Broad-band Optical Polarimetric Studies toward the Galactic young star cluster Be 59
Abstract
We present multiwavelength optical linear polarimetric observations of 69 stars toward the young open cluster Be 59. The observations reveal the presence of three dust layers located at the distances of 300, 500 and 700 pc. The dust layers produce a total polarization per cent. The mean values of polarization and polarization angles due to the dust layers are found to increase systematically with distance. We show that polarimetry in combination with the colour-colour diagram yields a better identification of cluster members. The polarization measurements suggest that the polarization due the intra-cluster medium is 2.2 per cent. An anomalous reddening law exists for the cluster region, indicating a relatively larger grain size than that in the diffuse ISM. The spatial variation of the polarization and is found to increase with radial distance from the cluster center, whereas the and are found to decrease with increasing radial distance from the cluster center. About 40 per cent of cluster members show the signatures of either intrinsic polarization or rotation in their polarization angles. There is an indication that the star light of the cluster members might have been depolarized because of non-uniform alignment of dust grains in the foreground dust layers and in the intra-cluster medium.
keywords:
Polarization- dust, extinction - open clusters and associations: individual: Berkeley 59.1 INTRODUCTION
Interstellar grains are aspherical in nature and, given proper conditions, are aligned in space by the magnetic field (Davis & Greenstein 1951). The effective extinction cross sections of the dust particles are the greatest when the electric vector of the incident light is parallel to the long axes of the dust particles as projected on the plane of the sky, and the least when parallel to the short axes. This differential extinction introduces a small degree of linear polarization in the transmitted light.
Studies of polarization due to the interstellar matter (ISM) are important as these provide information about the properties of the dust associated with the ISM and intra-cluster matter as well as help to trace the Galactic magnetic field. As the grains are thought to align due to the local magnetic field, the observed polarization vectors map the general geometry of the magnetic field. The observed maximum upper limit relation between the degree of the polarization and the colour excess is found to be (Aannestad Purcell 1973). The relation between and colour excess, and the variation of with wavelength are interpreted in terms of the grain properties and the efficiency of the grain alignment. Therefore, polarimetry is a useful technique to investigate the properties like maximum polarization , the wavelength corresponding to and the orientation of the magnetic field in various Galactic locations.
Polarimetric studies of star-forming regions/young star clusters are specially important because physical parameters such as distance, age, membership and colour excess of these regions are known accurately, which consequently helps in analyzing the polarimetric data in a meaningful way. Strong ultraviolet radiation from O/B type stars in these regions has strong impact on the surrounding medium. Dust grains can undergo destruction processes due to direct radiative pressure, grain-grain collisions, sputtering or shattering etc. As a result, it is likely that the mean size of the dust grains could be smaller than the mean value for the diffuse ISM. The stars associated with the star-forming regions can help to understand the nature of dust as well as the magnetic field of the intra-cluster medium.
Young star clusters (age 10 Myr), still embedded in the parent molecular clouds, are unique laboratories to understand the dust properties as well as the nature of interaction between young star(s) and the surrounding medium. Berkeley 59 ( = 00h 02m 13s, = +67 25′ 11′′; = 118.22, = 5.00) is such a young star cluster associated with a heavily obscured gas-dust complex of the Cepheus OB4 association. The cluster Be 59, located at the center of the Sharpless region S171 contains nine O7B3 stars (cf. Pandey et al. 2008; hereafter P08) at a distance of kpc and has mag. The extent of the cluster was found to be pc (P08).
As a part of an ongoing project to understand the dust characteristics in star-forming regions and to map the structure of magnetic field at diverse environments of the Milky Way Galaxy, we have carried out broad-band optical polarimetric observations around the cluster Be 59. In Section 2 we present the observations and data reduction. Results are presented in Section 3. The dust properties and the spatial variation of , , and are in Sections 4 and 5 respectively. Finally, we conclude our results in Section 6.
2 OBSERVATIONS AND DATA REDUCTION
Polarimetric observations were carried out on seven nights (2009 November 23, 24, 25 and 2009 December 24, 26, 27 and 28), using the ARIES Imaging Polarimeter (AIMPOL; Rautela, Joshi & Pandey, 2004) mounted at the Cassegrain focus of the 104-cm Sampurnanand telescope of the Aryabhatta Research Institute of observational sciencES (ARIES), Nainital, India. The observations were carried out in the , , and (=0.440m, =0.530m, =0.670m and =0.800m) photometric bands using fraction (370370 pixel2) of the TK 1024 1024 pixel2 CCD camera. The AIMPOL consists of a half-wave plate modulator and a Wollaston prism beam-splitter. The Wollaston prism analyzer is placed at the backend of the telescope beam path in order to produce ordinary and extraordinary beams in slightly different directions separated by 28 pixels along the North-South direction on the sky plane. A focal reducer (85 mm, f/1.8) is placed between the Wollaston prism and the CCD camera. Each pixel of the CCD corresponds to 1.73 arcsec and the field of view is 8 arcmin diameter on the sky. The FWHM of the stellar image varied from 2 to 3 pixels. The read-out noise and gain of the CCD are 7.0 and 11.98 /ADU respectively. Since AIMPOL does not have a grid, we manually checked for any overlap of ordinary and extraordinary images of the sources. Fluxes of ordinary () and extra-ordinary () beams for all the observed sources with good signal-to-noise ratio were extracted by standard aperture photometry after bias subtraction using the IRAF111IRAF is distributed by National Optical Astronomical Observatories, USA. package. The ratio is computed using the following relation
| (1) |
where is the fraction of the total light in the linearly polarized condition and is the position angle of the plane of polarization. Here is the position of the fast axis of the half wave plate (HWP) at 0, 22.5, 45 and 67.5 corresponding to the four normalized Stokes parameters respectively, [R(0)], [R(22.5)], [R(45)] and [R(67.5)]. The detailed procedures used to estimate the polarization and position angles for the program stars are given by Eswaraiah et al. (2011) (hereafter E11) and references therein.
The instrumental polarization of AIMPOL on the 104-cm Sampurnanand Telescope has been monitored since 2004 on various observing nights and found to be less than 0.1 per cent in different bands (E11 and references therein). All the measurements were corrected for both the null polarization ( 0.1 per cent) which is independent of the pass-bands and the zero-point polarization angle by observing several unpolarized and polarized standard stars from Schmidt, Elston & Lupie (1992) (hereafter S92). The results for the standard stars are given in Table 1. The first column lists the star name with the date of observation or reference in parenthesis. The next consecutive columns are the polarization in percent [ (per cent)] and polarization angle in degree [] measured in BV pass-bands. Entries with S92 in parenthesis are taken from S92. The present results for the polarized standard stars are in good agreement, within the observational errors, with those given by S92.
3 RESULTS
Table 2 lists the polarization measurements for 37 stars using bands, whereas Table 3 lists the results for 32 stars using the bands. The star identification numbers (column 1) are taken from P08. The right ascension, declination and photometric visual magnitudes, also from P08, are listed in the second, third and fourth columns of Tables 2 and 3 respectively. The next consecutive columns correspond to the polarization, polarization angle and their associated errors in B, V, bands and V, bands respectively. The given polarization angles are in the equatorial coordinate system measured from the North increasing towards the East. Tables 2 and 3 reveal that the maximum linear polarization towards the cluster region is 8 per cent. Such a high amount of polarization is not often found towards the star clusters, with only a few exceptions, Tr 27 (Feinstein et al. 2000), and M17 (Schultz et al. 1981).
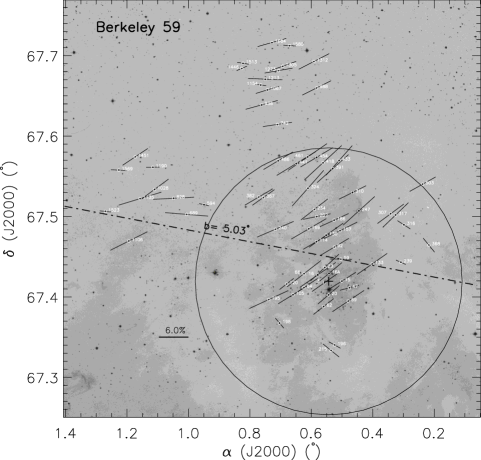
In Fig. 1 all the observed 69 stars are marked with white circles on the DSS II -band image. The sky projection of -band polarization vectors are overlaid. The length of each polarization vector is proportional to the degree of polarization. The dash-dotted line represents the orientation of the projection of the Galactic plane (GP) at =5.03, which corresponds to the position angle of .
| star name | ||||||||
|---|---|---|---|---|---|---|---|---|
| (date of observations) | ||||||||
| (reference) | (per cent) | () | (per cent) | () | (per cent) | () | (per cent) | () |
| (1) | (2) | (3) | (4) | (5) | (6) | (7) | (8) | (9) |
| HD 19820 (23, Nov 09) | 4.49 0.11 | 114.9 0.7 | 4.89 0.09 | 114.2 0.5 | 4.49 0.09 | 115.5 0.6 | 4.06 0.16 | 115.3 1.0 |
| HD 19820 (24, Nov 09) | 4.61 0.11 | 114.7 0.7 | 4.79 0.08 | 115.1 0.5 | 4.51 0.07 | 114.6 0.4 | 3.97 0.09 | 115.7 0.6 |
| HD 19820 (25, Nov 09) | 4.72 0.11 | 115.6 0.7 | 4.94 0.08 | 114.9 0.4 | 4.61 0.07 | 114.4 0.4 | 3.86 0.10 | 113.4 0.7 |
| HD 19820 (23, Dec 09) | 4.70 0.10 | 115.0 0.6 | — | — | 4.61 0.07 | 114.3 0.4 | 4.06 0.08 | 114.0 0.5 |
| HD 19820 (24, Dec 09) | 4.68 0.11 | 116.4 0.7 | 4.90 0.09 | 114.6 0.5 | 4.62 0.07 | 114.8 0.4 | 4.06 0.08 | 114.3 0.5 |
| HD 19820 (27, Dec 09) | 4.57 0.11 | 116.4 0.6 | 4.69 0.09 | 115.0 0.5 | 4.63 0.07 | 114.6 0.4 | 4.01 0.08 | 114.3 0.5 |
| HD 19820 (28, Dec 09) | 4.72 0.09 | 115.4 0.5 | 4.80 0.08 | 114.8 0.5 | 4.51 0.07 | 114.2 0.4 | 3.92 0.08 | 115.2 0.5 |
| HD 19820 (S92) | 4.70 0.04 | 115.7 0.2 | 4.79 0.03 | 114.9 0.2 | 4.53 0.03 | 114.5 0.2 | 4.08 0.02 | 114.5 0.2 |
| HD 25443 (23, Nov 09) | 5.19 0.09 | 134.6 0.5 | 5.04 0.07 | 136.0 0.4 | 5.01 0.06 | 134.5 0.4 | 4.19 0.09 | 134.8 0.6 |
| HD 25443 (24, Nov 09) | 5.21 0.09 | 134.1 0.5 | 5.11 0.07 | 136.2 0.4 | 5.13 0.06 | 133.8 0.4 | 4.29 0.09 | 134.4 0.6 |
| HD 25443 (25, Nov 09) | 5.11 0.09 | 134.5 0.5 | 5.25 0.09 | 134.3 0.5 | 5.10 0.08 | 133.4 0.4 | 4.37 0.10 | 132.6 0.7 |
| HD 25443 (23, Dec 09) | 5.12 0.08 | 135.7 0.5 | 5.12 0.08 | 135.5 0.4 | 4.88 0.08 | 134.5 0.5 | 4.23 0.08 | 134.9 0.5 |
| HD 25443 (24, Dec 09) | 5.12 0.09 | 134.0 0.5 | 5.27 0.09 | 134.8 0.5 | 5.00 0.08 | 134.5 0.4 | 4.19 0.07 | 136.0 0.5 |
| HD 25443 (27, Dec 09) | 5.05 0.08 | 134.8 0.5 | 5.17 0.07 | 135.9 0.4 | 5.04 0.07 | 134.0 0.4 | 4.13 0.07 | 134.5 0.5 |
| HD 25443 (S92) | 5.23 0.09 | 134.3 0.5 | 5.13 0.06 | 134.2 0.3 | 4.73 0.05 | 133.6 0.3 | 4.25 0.04 | 134.2 0.3 |
| BD+64 106 (23, Nov 09) | 5.49 0.17 | 98.0 0.9 | 6.09 0.13 | 99.0 0.6 | 5.41 0.11 | 96.1 0.6 | 4.50 0.14 | 96.6 0.9 |
| BD+64 106(23, Dec 09) | 5.37 0.15 | 97.9 0.8 | 5.57 0.11 | 96.8 0.6 | 5.63 0.09 | 97.6 0.5 | 4.63 0.10 | 97.5 0.6 |
| BD+64 106 (S92) | 5.51 0.09 | 97.2 0.5 | 5.69 0.04 | 96.6 0.2 | 5.15 0.10 | 96.7 0.5 | 4.70 0.05 | 96.9 0.3 |
| HD 204827 (25, Nov 09) | 5.67 0.10 | 58.3 0.5 | 5.53 0.08 | 58.8 0.4 | 5.02 0.08 | 59.2 0.4 | 4.14 0.10 | 59.9 0.7 |
| HD 204827 (S92) | 5.65 0.02 | 58.2 0.1 | 5.32 0.01 | 58.7 0.1 | 4.89 0.03 | 59.1 0.2 | 4.19 0.03 | 59.9 0.2 |
| BD+59 389 (23, Dec 09) | 6.35 0.13 | 97.8 0.6 | 6.73 0.09 | 97.8 0.4 | 6.48 0.08 | 97.6 0.3 | 5.66 0.06 | 97.9 0.3 |
| BD+59 389 (28, Dec 09) | 6.43 0.13 | 97.9 0.6 | 6.82 0.09 | 97.5 0.4 | 6.47 0.08 | 97.7 0.4 | 5.61 0.07 | 97.9 0.4 |
| BD+59 389 (S92) | 6.34 0.04 | 98.1 0.2 | 6.70 0.01 | 98.1 0.1 | 6.43 0.02 | 98.1 0.1 | 5.80 0.02 | 98.3 0.1 |
| HD 236633 (28, Dec 09) | 6.06 0.11 | 90.4 0.5 | 5.65 0.09 | 91.3 0.4 | 5.34 0.09 | 91.0 0.5 | 4.69 0.09 | 90.5 0.6 |
| HD 236633 (S92) | 5.53 0.04 | 92.5 0.2 | 5.49 0.02 | 93.8 0.1 | 5.38 0.03 | 93.0 0.2 | 4.80 0.04 | 93.1 0.2 |
| Star ID ⋆ | R.A () | DEC () | V (mag)⋆ | ||||||||
|---|---|---|---|---|---|---|---|---|---|---|---|
| (2000J) | (2000J) | (per cent) | () | (per cent) | () | (per cent) | () | (per cent) | () | ||
| (1) | (2) | (3) | (4) | (5) | (6) | (7) | (8) | (9) | (10) | (11) | (12) |
| 3 | 0.55659104 | 67.417798 | 11.30 | 4.80 0.20 | 102.3 1.2 | 5.30 0.13 | 105.1 0.7 | 5.00 0.10 | 104.0 0.5 | 4.57 0.09 | 106.7 0.6 |
| 15 | 0.50060639 | 67.419664 | 12.78 | 5.04 0.41 | 103.4 2.3 | 5.85 0.26 | 103.6 1.2 | 6.20 0.19 | 103.4 0.9 | 5.48 0.18 | 104.4 0.9 |
| 16 | 0.57895372 | 67.427389 | 11.81 | 6.87 0.31 | 106.8 1.3 | 7.55 0.16 | 104.9 0.6 | 7.04 0.09 | 106.0 0.4 | 6.68 0.07 | 107.7 0.3 |
| 16A | 0.54241389 | 67.429288 | - | 5.35 0.09 | 106.3 0.5 | 5.53 0.06 | 107.7 0.3 | 5.45 0.04 | 106.4 0.2 | 4.64 0.04 | 106.5 0.3 |
| 20 | 0.54363477 | 67.402592 | 13.40 | 3.78 0.47 | 108.1 3.5 | 4.60 0.31 | 108.2 1.9 | 4.21 0.23 | 106.3 1.5 | 3.76 0.21 | 109.0 1.6 |
| 23 | 0.55624163 | 67.436586 | 13.84 | 6.85 0.75 | 101.9 3.1 | 6.10 0.42 | 109.7 1.9 | 5.97 0.27 | 112.9 1.3 | 5.57 0.23 | 110.9 1.2 |
| 66 | 0.62357699 | 67.428952 | 12.95 | 6.81 0.50 | 107.5 2.1 | 7.14 0.28 | 106.5 1.1 | 6.99 0.19 | 107.7 0.8 | 6.34 0.16 | 108.1 0.7 |
| 69 | 0.47981658 | 67.394837 | 14.06 | 6.16 0.74 | 111.3 3.3 | 6.62 0.47 | 104.4 2.0 | 6.74 0.35 | 107.5 1.5 | 5.39 0.33 | 103.3 1.7 |
| 114 | 0.58320121 | 67.468772 | 12.43 | 5.37 0.28 | 97.8 1.5 | 5.50 0.17 | 102.5 0.9 | 5.39 0.11 | 96.7 0.6 | 4.66 0.13 | 98.3 0.8 |
| 130 | 0.55160126 | 67.476766 | 12.61 | 5.84 0.34 | 99.0 1.6 | 7.17 0.19 | 105.1 0.7 | 6.80 0.11 | 98.4 0.5 | 6.14 0.11 | 98.2 0.5 |
| 157 | 0.50636486 | 67.482452 | 14.51 | 6.89 0.96 | 94.8 3.9 | 7.06 0.57 | 100.8 2.3 | 6.62 0.40 | 99.0 1.7 | 5.74 0.35 | 94.6 1.7 |
| 169 | 0.60818307 | 67.484653 | 13.43 | 6.86 0.48 | 95.0 2.0 | 7.29 0.28 | 102.6 1.1 | 7.16 0.17 | 99.2 0.7 | 6.34 0.19 | 100.5 0.8 |
| 186 | 0.52564189 | 67.495438 | 13.72 | 5.44 0.67 | 99.7 3.5 | 5.95 0.36 | 99.9 1.7 | 5.70 0.20 | 100.3 1.0 | 5.00 0.19 | 101.0 1.1 |
| 234 | 0.58994890 | 67.508870 | 14.22 | 4.81 0.65 | 96.4 3.8 | 5.66 0.39 | 106.6 1.9 | 5.16 0.26 | 101.3 1.4 | 4.57 0.31 | 99.0 1.9 |
| 239 | 0.30857984 | 67.443113 | 12.94 | 2.46 0.43 | 81.1 4.8 | 1.98 0.28 | 80.4 3.5 | 2.24 0.18 | 82.7 2.2 | 1.78 0.21 | 83.5 3.2 |
| 247 | 0.44508728 | 67.507038 | 10.09 | 6.14 0.12 | 106.7 0.6 | 6.80 0.07 | 109.1 0.3 | 6.48 0.05 | 110.4 0.2 | 5.87 0.05 | 112.0 0.2 |
| 307 | 0.34187817 | 67.503367 | 13.97 | 4.73 0.97 | 103.0 5.8 | 5.55 0.45 | 105.7 2.3 | 5.43 0.27 | 107.1 1.4 | 5.05 0.22 | 108.3 1.2 |
| 310 | 0.46585155 | 67.529885 | 12.48 | 6.39 0.34 | 101.4 1.5 | 5.59 0.20 | 100.8 1.0 | 5.77 0.12 | 101.9 0.6 | 4.89 0.12 | 102.8 0.7 |
| 316 | 0.29854431 | 67.489695 | 12.47 | 3.14 0.36 | 74.9 3.2 | 2.67 0.27 | 76.3 2.5 | 2.92 0.19 | 75.3 1.8 | 2.17 0.24 | 66.9 3.0 |
| 324 | 0.61096275 | 67.535161 | 14.13 | 7.21 0.65 | 111.1 2.6 | 6.98 0.38 | 113.4 1.5 | 6.63 0.24 | 109.7 1.0 | 6.00 0.27 | 110.1 1.3 |
| 367 | 0.75596949 | 67.523695 | 14.88 | 3.74 1.00 | 88.1 7.5 | 4.64 0.54 | 105.1 3.3 | 5.95 0.33 | 99.6 1.6 | 5.89 0.36 | 101.2 1.7 |
| 368 | 0.21731676 | 67.464417 | 13.93 | 3.10 0.67 | 73.8 6.0 | 2.54 0.43 | 64.8 4.4 | 2.72 0.29 | 76.7 3.0 | 2.55 0.33 | 75.7 3.6 |
| 382 | 0.77096790 | 67.524242 | 14.09 | 5.53 0.57 | 100.7 2.9 | 5.80 0.37 | 102.7 1.8 | 5.88 0.25 | 100.9 1.2 | 5.23 0.31 | 102.4 1.6 |
| 391 | 0.53020318 | 67.559531 | 13.15 | 6.61 0.41 | 106.4 1.8 | 6.76 0.24 | 108.8 1.0 | 6.86 0.15 | 104.1 0.6 | 6.13 0.17 | 103.6 0.8 |
| 418 | 0.56191788 | 67.566861 | 13.94 | 7.03 0.59 | 104.4 2.4 | 8.03 0.35 | 109.4 1.2 | 7.58 0.24 | 103.6 0.9 | 6.75 0.29 | 103.1 1.2 |
| 441 | 0.64887476 | 67.565940 | 12.14 | 7.48 0.25 | 98.7 0.9 | 8.15 0.15 | 103.2 0.5 | 7.91 0.10 | 99.1 0.4 | 7.16 0.12 | 98.5 0.5 |
| 454 | 0.58273633 | 67.573569 | 11.07 | 6.81 0.14 | 99.1 0.6 | 6.71 0.09 | 102.9 0.4 | 6.67 0.06 | 98.1 0.3 | 5.78 0.08 | 99.2 0.4 |
| 461 | 0.61191189 | 67.574077 | 13.72 | 7.45 0.52 | 96.6 2.0 | 8.10 0.32 | 104.7 1.1 | 7.45 0.21 | 100.6 0.8 | 6.42 0.25 | 101.4 1.1 |
| 486 | 0.70776450 | 67.569370 | 13.51 | 5.86 0.71 | 97.1 3.4 | 6.13 0.28 | 102.9 1.3 | 5.78 0.14 | 98.4 0.7 | 4.99 0.13 | 100.6 0.7 |
| 936 | 0.76152588 | 67.638797 | 12.63 | 6.39 0.36 | 96.2 1.6 | 6.53 0.18 | 96.0 0.8 | 6.23 0.12 | 95.8 0.5 | 5.41 0.13 | 94.6 0.6 |
| 988 | 0.58255340 | 67.659929 | 13.13 | 5.82 0.46 | 102.7 2.2 | 5.93 0.23 | 100.9 1.1 | 5.48 0.17 | 99.2 0.9 | 4.62 0.19 | 102.5 1.2 |
| 1067 | 0.74265875 | 67.657519 | 13.43 | 3.94 0.50 | 99.3 3.5 | 4.76 0.26 | 96.8 1.5 | 4.36 0.18 | 97.2 1.1 | 3.79 0.20 | 98.1 1.4 |
| 1154 | 0.76472099 | 67.663676 | 13.54 | 1.94 0.49 | 87.7 6.9 | 2.20 0.27 | 87.1 3.4 | 2.02 0.20 | 83.8 2.7 | 1.53 0.24 | 85.2 4.2 |
| 1213 | 0.74994583 | 67.670815 | 13.36 | 6.57 0.55 | 88.9 2.4 | 6.97 0.26 | 89.1 1.1 | 6.53 0.17 | 89.2 0.7 | 5.40 0.17 | 90.2 0.9 |
| 1446 | 0.82639705 | 67.684169 | 14.26 | 2.32 0.71 | 106.3 8.4 | 2.11 0.39 | 99.5 5.0 | 1.90 0.28 | 95.2 4.0 | 1.76 0.34 | 89.3 5.1 |
| 1580 | 0.67072198 | 67.712589 | 12.93 | 2.01 0.38 | 90.7 5.2 | 2.55 0.21 | 88.5 2.2 | 2.34 0.15 | 92.4 1.8 | 2.17 0.18 | 92.7 2.2 |
| 1684 | 0.72806296 | 67.716366 | 13.27 | 6.45 0.68 | 92.5 3.0 | 5.84 0.25 | 96.2 1.2 | 5.52 0.13 | 96.7 0.7 | 4.57 0.12 | 98.0 0.7 |
⋆ Star IDs and V magnitudes, barring 16A, have been taken from P08
| Star ID ⋆ | R.A () | DEC () | V (mag)⋆ | ||||||
|---|---|---|---|---|---|---|---|---|---|
| (2000J) | (2000J) | (per cent) | () | (per cent) | () | (per cent) | () | ||
| (1) | (2) | (3) | (4) | (5) | (6) | (7) | (8) | (9) | (10) |
| 47 | 0.47588896 | 67.411372 | 14.63 | 3.90 0.61 | 95.7 4.3 | 3.84 0.46 | 97.2 3.3 | 4.04 0.41 | 105.9 2.9 |
| 59 | 0.50411914 | 67.446995 | 14.88 | 4.50 0.68 | 89.6 4.3 | 4.58 0.51 | 98.4 3.1 | 4.64 0.45 | 97.2 2.7 |
| 62 | 0.55995352 | 67.388082 | 13.48 | 4.27 0.22 | 106.7 1.5 | 4.86 0.13 | 106.1 0.7 | 4.02 0.12 | 107.5 0.9 |
| 64 | 0.62424757 | 67.411543 | 14.56 | 5.74 0.38 | 104.3 1.9 | 6.05 0.20 | 102.7 0.9 | 5.49 0.18 | 104.4 0.9 |
| 92 | 0.52499704 | 67.462054 | 15.46 | 6.03 0.92 | 103.0 4.3 | 5.15 0.68 | 101.9 3.7 | 4.51 0.56 | 99.0 3.5 |
| 105 | 0.65972184 | 67.402794 | 13.65 | 6.17 0.24 | 103.3 1.1 | 5.71 0.13 | 103.5 0.6 | 4.84 0.11 | 104.7 0.6 |
| 120 | 0.68030330 | 67.416096 | 14.48 | 2.99 0.37 | 106.7 3.4 | 4.39 0.20 | 113.0 1.3 | 3.46 0.19 | 113.7 1.5 |
| 133 | 0.40192644 | 67.441032 | 14.94 | 6.31 0.72 | 105.1 3.2 | 5.59 0.52 | 106.2 2.6 | 4.44 0.44 | 106.3 2.8 |
| 195 | 0.73841635 | 67.396758 | 14.22 | 8.00 0.32 | 100.0 1.1 | 7.84 0.17 | 100.5 0.6 | 6.61 0.15 | 101.0 0.6 |
| 196 | 0.52409579 | 67.340231 | 13.46 | 2.40 0.22 | 78.1 2.5 | 2.08 0.12 | 69.5 1.6 | 1.91 0.12 | 72.7 1.7 |
| 198 | 0.70341898 | 67.367529 | 13.47 | 1.88 0.24 | 65.7 3.5 | 2.18 0.15 | 79.5 1.9 | 1.76 0.17 | 75.4 2.5 |
| 202 | 0.58241709 | 67.499918 | 14.19 | 5.61 0.50 | 94.4 2.6 | 5.24 0.28 | 95.7 1.5 | 4.72 0.17 | 96.4 1.0 |
| 215 | 0.53576488 | 67.333432 | 13.99 | 3.42 0.30 | 72.8 2.5 | 2.47 0.18 | 74.6 2.0 | 1.98 0.19 | 76.1 2.6 |
| 240 | 0.71675681 | 67.484199 | 14.61 | 7.49 0.47 | 99.4 1.8 | 8.23 0.29 | 95.8 1.0 | 7.27 0.31 | 94.4 1.2 |
| 317 | 0.32552520 | 67.501884 | 12.76 | 5.54 0.28 | 110.2 1.5 | 5.28 0.14 | 108.1 0.8 | 4.82 0.12 | 108.6 0.7 |
| 433 | 0.50950597 | 67.569704 | 13.22 | 5.80 0.26 | 113.3 1.2 | 4.64 0.16 | 106.5 1.0 | 4.28 0.18 | 105.7 1.1 |
| 503 | 0.23764401 | 67.540179 | 13.55 | 5.37 0.33 | 102.0 1.7 | 5.27 0.21 | 103.3 1.1 | 4.93 0.21 | 103.2 1.2 |
| 594 | 0.94921847 | 67.514749 | 11.25 | 1.94 0.08 | 85.0 1.1 | 1.64 0.06 | 83.5 1.1 | 1.44 0.06 | 84.0 1.2 |
| 689 | 1.00593420 | 67.502698 | 14.40 | 8.73 0.35 | 88.2 1.1 | 7.69 0.23 | 87.8 0.8 | 6.61 0.17 | 88.9 0.8 |
| 742 | 0.71032883 | 67.614514 | 14.87 | 5.88 0.53 | 93.3 2.5 | 5.44 0.33 | 95.3 1.7 | 5.43 0.33 | 97.4 1.7 |
| 828 | 1.04825650 | 67.522676 | 12.66 | 8.30 0.15 | 91.2 0.5 | 8.30 0.10 | 90.0 0.3 | 7.44 0.08 | 90.6 0.3 |
| 1028 | 1.11032740 | 67.533648 | 13.57 | 5.88 0.23 | 105.8 1.1 | 5.99 0.15 | 107.0 0.7 | 5.11 0.12 | 107.5 0.6 |
| 1106 | 1.19379620 | 67.469519 | 14.35 | 7.66 0.33 | 100.8 1.2 | 8.07 0.24 | 98.5 0.8 | 5.47 0.19 | 102.4 1.0 |
| 1135 | 1.15739640 | 67.522225 | 14.91 | 8.72 0.45 | 96.6 1.5 | 7.07 0.29 | 100.9 1.1 | 6.26 0.21 | 99.0 1.0 |
| 1190 | 1.11587840 | 67.561287 | 13.20 | 2.70 0.20 | 90.3 2.0 | 2.72 0.15 | 88.2 1.5 | 2.32 0.13 | 87.2 1.6 |
| 1273 | 0.70653826 | 67.681432 | 15.07 | 5.66 0.57 | 93.9 2.8 | 5.61 0.37 | 94.8 1.8 | 5.03 0.38 | 97.4 2.1 |
| 1305 | 0.69299158 | 67.686948 | 14.74 | 5.45 0.49 | 97.8 2.5 | 4.66 0.30 | 99.1 1.8 | 4.10 0.31 | 94.4 2.1 |
| 1312 | 0.59132421 | 67.692850 | 14.08 | 6.29 0.37 | 101.1 1.6 | 5.78 0.20 | 103.8 1.0 | 5.14 0.17 | 106.1 1.0 |
| 1451 | 1.17321310 | 67.574163 | 14.12 | 5.26 0.30 | 104.3 1.6 | 4.82 0.20 | 108.0 1.1 | 4.30 0.16 | 109.2 1.0 |
| 1513 | 0.82238181 | 67.690576 | 12.71 | 2.32 0.19 | 86.3 2.2 | 2.00 0.14 | 88.3 1.9 | 1.97 0.17 | 93.3 2.4 |
| 1523 | 1.27017620 | 67.506336 | 13.86 | 2.28 0.27 | 87.9 3.2 | 2.45 0.20 | 88.2 2.2 | 2.18 0.17 | 84.5 2.2 |
| 1569 | 1.22657310 | 67.557681 | 13.60 | 3.17 0.24 | 88.9 2.0 | 3.19 0.17 | 86.7 1.5 | 2.67 0.15 | 88.3 1.6 |
⋆From P08
3.1 Distribution of and :
A careful inspection of Fig. 1 reveals two groups of stars characterized by different degree and direction of polarization. The first group with relatively small degree of polarization ( 2 per cent) and with the orientation nearly parallel to the Galactic disk () may be composed of foreground stars. The stars of this group are randomly distributed on the plane of the sky. The second group, whose degree of polarization is significantly higher than the first group and the alignment of polarization vectors ( 102) is significantly deviated from the GP, may be composed of cluster members. Majority of the stars of the second group are located within the cluster region ( 10 arcmin).
Figure 2 displays the distribution of polarization vs polarization angle , which clearly segregates the above mentioned two groups. The mean and for the first group is found to be 2.47 0.46 per cent and 819, respectively. The mean polarization angle is nearly aligned with the GP, indicating the homogeneity in the local magnetic field of the Galaxy towards the direction of Be 59. The stars belonging to the second group are more polarized ( per cent) and having . The mean polarization angle of the second group (1035) significantly deviates from the GP. The magnetic field associated with the parental molecular cloud may have been perturbed during the cloud collapse or due to the strong stellar winds or supernova explosions (e.g., Waldhausen, Martínez & Feinstein 1999). The stars belonging to the second group could be either the cluster members or background stars. The second group of stars show large dispersion in polarization but a very small dispersion in polarization angle. The large dispersion in ( per cent) could be attributed to the differential reddening within the cluster. Similar type of segregated groups have already been reported in a few cases, namely Trumpler 27 (Feinstein et al. 2000), Hogg 22 & NGC 6204 (Martínez et al. 2004), NGC 5749 (Vergne et al. 2007) and NGC 6250 (Feinstein et al. 2008).


The distribution of for all the observed 69 stars is shown in the upper panel of Fig. 3, which clearly reveals two separate distributions for field and probable cluster members. The distribution for field stars peaks at 2 per cent, whereas that for the probable members peaks at 5.5 per cent with an extended tail towards higher polarization, which could be either due to highly extincted probable members, background stars or due to the presence of different populations of dust grains with different polarizing properties. The lower panel of Fig. 3 shows the distribution of , which reveals that the distribution of probable cluster members lies in the range of 95115 with a peak at 105.
To have a better understanding of the nature of the dust component and the magnetic field associated with the foreground and intra-cluster medium, it is essential to find out the members associated with the cluster versus the stars located in the foreground/background of the cluster. In our previous study (E11) we have shown that polarimetry in combination with the two-colour diagram (TCD) can yield a better identification of probable members than photometry alone. In the ensuing section we will discuss the determination of membership using the polarization properties in combination with TCD.
3.2 Member identification


TCD is one of the useful tools to identify probable members of a cluster. It is expected that all member stars have values comparable to the mean value of the cluster since the cluster stars have formed out of the same molecular cloud and consequently have the same distance and age. In comparison, the field population is expected to be less or highly extincted depending on whether they are foreground or background to the cluster. Fig. 4 shows the TCD for only 63 stars as the colours are not available for 6 stars. In Fig. 4 the zero-age-main-sequence (ZAMS) from Schmidt-Kaler (1982) is shifted along a normal reddening vector having a slope of = 0.72. The TCD shows a variable reddening in the cluster region with 1.4 mag and 1.8 mag. The cluster members (shown by open circles) seem to have spectral types earlier than . The TCD manifests the presence of a foreground population shown by filled circles. The foreground population reddened by =0.4 mag is found to be located at 470 pc (P08). The other field star (late type) population is shown by filled diamonds.
The polarimetric observations can be used as a tool to identify member stars in a Galactic open cluster, particularly, when the field stars have colours similar to those of cluster members (Martínez et al. 2004; Vergne et al. 2007; Feinstein et al. 2008; Vergne et al. 2010; Orsatti et al. 2010; E11). The individual Stokes parameters of the polarization vector of the -band, , given by and are estimated for all the observed stars toward Be 59 and presented on a versus plot, known as the Stokes plane, in Fig. 5.
The measured degree of polarization of a star depends on the cumulative amount of aligned dust grains that lie along the line of sight, and hence the degree of polarization would be similar, lower or higher depending on whether it is member, foreground or background to the cluster. Likewise, the position angles of the cluster members would be similar, but different for foreground or background field stars as light from them could have contributions from different or additional dust components. Hence the cluster members are expected to show a grouping in the plane, while non-members are expected to show a scattered distribution. Therefore plot could be a useful tool to identify the members of a cluster. The stars with intrinsic polarization (due to asymmetric distribution of matter around young stellar objects (YSOs)) and/or rotation in their polarization angles may also create scattered distribution in the plane. Nebulous background in case of star-forming regions would also create small intrinsic polarization and hence possibly the scattered distribution.
Fig. 5 shows two prominent groupings around and (first group) and and (second group). The grouping at and should be due to the cluster members. Fifty percent (13 out of 27) of the field stars, identified on the basis of TCD (Fig. 4), can be noticed mainly around and . The remainder of the probable field stars show a scattered distribution in plot; however some of the probable field stars are found to mingle with the probable cluster members. To further elucidate the membership we plot a box with dashed line in plot having boundaries of mean (6.221.21 per cent) and mean (102 6) obtained using the probable member stars (open circles) identified in Fig 4. The stars shown with open circles and lying within the 1 box of the mean and could be probable members of the cluster. It is apparent from Fig. 4, i.e., the TCD that the majority of the stars located within the box follow the general reddening of the cluster region, hence are probable members of the cluster.
Stars # 59, 120, 689, 828 and 1213 are located significantly away from the box. The stars #59 (=4.5 per cent, =90) and #120 (=3.0 per cent, =107), even though located spatially within the cluster region (see Fig. 1) and with photometric colours consistent with membership, their value or value is not comparable to the cluster region (see Fig. 5), so are considered as non-members. The stars # 689, 828 and 1213 are located outside the cluster region. These stars show relatively large polarization ( 6.6 to 8.7 per cent) but their values ( 88 to 91) are significantly different from those of probable cluster members (Tables 2 and 3) and are comparable to the GP. Hence these are considered as non-members. The stars # 23, 195, 247, 324, 391, 418, 441, 433 and 461 are distributed outside but near the boundary of box. Of these 9 stars (barring # 23, 195 and 324) have relatively higher value of (cf. Fig. 10, Sec 4) indicating rotation in their polarization angles. These stars have in the range of 1.41.8 mag (cf. Fig. 4), so could be members of the cluster. Three stars, namely # 20, 62 and 367 are also located near the boundary of the box. The values of these stars are in the range of 4.3 per cent to 4.6 per cent which is the lower limit of value for the cluster member stars (see Tables 2 and 3). The values range from 105108. These could also be members of the cluster.
There seems to be a less prominent grouping around and consisting of stars # 202, 742, 936, 1067, 1273, 1305 and 1684 (cf. Fig. 5). We refer to this group as the third group. Interestingly, all these stars (except 202) are located spatially at the same region towards the Northern part of the cluster Be 59. This group of stars is located near the edge of 1 box. The mean value of (5.680.53 per cent) is comparable to the values of the cluster region. However, the mean (=) is significantly different from that in the cluster region. These stars are considered as field stars.
The colours of stars # 1028, 1135 and 1451 are comparable to those of the cluster members and lie in the 1.4 to 1.8 mag range (presuming that these stars have spectral types earlier than ). Star # 1135 has (8.120.45 per cent) higher than those for cluster members, however (96.61.5) is smaller than the value for cluster stars. This star is located outside the 1 box and also located outside the estimated boundary of the cluster (Fig. 1), hence this star is considered as a non-member. Stars # 1028 and 1451 have and values both comparable to those of the cluster members but located outer side boundary of the cluster, hence the membership of these stars is uncertain.
Star # 196 is located near the solar neighborhood in the and diagram. Its colours are consistent with those of early type members of the cluster, which yields =1.4 mag, but its location in the diagram (Fig. 5) manifests that it should be a field star, hence this star is considered as a field star for further discussion. The star # 1106 is located near the 1 box boundary (cf. Fig. 5). On the basis of its colours and its location outside the cluster boundary, we consider it as a non-member.
The stars # 382, 503 and 988 are well separated from the cluster probable members in the - TCD (cf. Fig. 4), however they lie within 1 box in the plot (Fig. 5). Since stars # 382 and 503 lie within the boundary of the cluster and and values are comparable to the cluster stars, these are considered as probable members. Star # 988 lies outside the boundary of the cluster, its membership is uncertain.
The probable members of the cluster identified using and colour-colour diagrams are given in Table 4. The member, probable member and non-member stars are represented with ”M”, ”PM” and ”NM” respectively. Stars with uncertainty in their membership determination are indicated with a ”?” symbol.
Since cluster members seem to have spectral types earlier than (see Fig. 4), the reddening for the member stars has been estimated using the -method (Johnson & Morgan 1953). As seen in Fig. 4, all the field stars have spectral types later than . The reddening for field stars is estimated visually using the slide-fit method of ZAMS along the reddening vector. The estimated values of are given in Table 4. The colours of stars # 828 and 1213 suggest spectral types earlier than . The colours of star # 689 suggest two reddening values, (=0.70 mag for a spectral type later than , or =1.44 mag for a spectral type earlier than ). Star # 1135 has =8.72 per cent, which is comparable to the cluster members, however its value (96.6) is different from the cluster region. Its colours also suggest two values of (1.17 mag for a spectral type later than , or 1.42 mag for a spectral type earlier than ). Similarly, colours for stars # 1028, 1106, and 1451 have two possible values of reddening. These are mentioned in Table 4.
The colours of the third group of stars (# 742, 936, 1067, 1273, 1305 and 1684) suggest that their values are in the range of 0.951.30 mag. The location of the star # 936 in the TCD suggests an O/B spectral type. The mean values of and for these stars are 5.69 0.58 per cent and 962 respectively. This group of stars may lie between the foreground stars ( 470 pc) and the cluster. Assuming a mean =1.20 mag, the CMD indicates that these stars are distributed at a distance of 700 pc.
| stars with pass-band data | stars with pass-band data | ||||||
| Star ID ⋆ | membership | Star ID ⋆ | membership | ||||
| (mag) | (mag) | ||||||
| (1) | (2) | (3) | (4) | (5) | (6) | ||
| 3 | 1.41 | M | 47 | 0.43†, 1.20 | NM | ||
| 15 | 1.38 | M | 59 | 0.63†, 1.13† | NM | ||
| 16 | - | NM | 62 | 1.35 | M | ||
| 16A | - | M | 64 | 1.55 | M | ||
| 20 | 0.48†, 1.40† | M | 92 | 1.64 | M | ||
| 23 | 1.80 | M | 105 | 1.53 | M | ||
| 66 | 1.79 | M | 120 | 0.70†, 1.06† | NM | ||
| 69 | 1.33 | M | 133 | 1.63 | M | ||
| 114 | 1.52 | M | 195 | 1.47 | M | ||
| 130 | 1.87 | M | 196 | 0.57† | NM | ||
| 157 | 1.54 | M | 198 | 0.40† | NM | ||
| 169 | 1.55 | M | 202 | - | NM | ||
| 186 | - | M | 215 | 0.63† | NM | ||
| 234 | 1.41 | M | 240 | - | NM | ||
| 239 | 0.33†, 0.65† | NM | 317 | 1.81† | NM | ||
| 247 | 1.67 | M | 433 | 1.74 | M | ||
| 307 | 0.95† | NM | 503 | 1.30 | PM | ||
| 310 | 1.58 | M | 594 | 0.35†, 0.51 | NM | ||
| 316 | 0.65† | NM | 689 | 0.70†, 1.44 | NM | ||
| 324 | 1.61 | M | 742 | 0.95, 1.61 | NM | ||
| 367 | - | M | 828 | 1.54 | NM | ||
| 368 | 0.55† | NM | 1028 | 1.14†, 1.45 | ? | ||
| 382 | 1.26 | PM | 1106 | 1.17 | NM | ||
| 391 | 1.65 | M | 1135 | 1.17†, 1.42 | NM | ||
| 418 | 1.41 | M | 1190 | 0.46† | NM | ||
| 441 | 1.53 | M | 1273 | 0.56†, 1.16† | NM | ||
| 454 | 1.42 | M | 1305 | 0.95†, 1.17† | NM | ||
| 461 | 1.36 | M | 1312 | 1.34† | NM | ||
| 486 | - | NM | 1451 | 1.08†, 1.40 | ? | ||
| 936 | 1.50 | ? | 1513 | 0.30† | NM | ||
| 988 | 1.05† | ? | 1523 | 0.63† | NM | ||
| 1067 | 0.55†, 1.27 | NM | 1569 | 0.45† | NM | ||
| 1154 | 0.85† | NM | |||||
| 1213 | 1.63 | NM | |||||
| 1446 | 0.45† | NM | |||||
| 1580 | - | NM | |||||
| 1684 | 0.95† NM | ||||||
From P08
†: values were obtained using slide and fit method
M: Members
NM: Non-members
PM: Probable members
: Stars with uncertainty in their membership

| (per cent) | () | No. of stars | Distance (pc) | |||
|---|---|---|---|---|---|---|
| First group | 2.44 0.45 | 8210 | =-2.35 | =0.65 | 14 | 470 |
| Third group | 5.55 0.41 | 952 | =-5.43 | -1.04 | 6 | 700 |
| Member stars | 6.34 1.05 | 1054 | =-5.45 | -3.24 | 29 | 1000 |
Fig. 6 shows the distribution of (left panels) and (right panels) for the identified foreground stars (first group and third group of stars) and cluster members. The mean and standard deviation of and of these three groups of stars are given in a Table 5 and also shown in Fig. 6. The mean values of and are also listed in Table 5. Fig. 6 shows the mean degree of polarization, polarization angle as well as the deviation of the mean polarization angle from the GP increases systematically with increasing distance.

3.3 Dust distribution
The stokes plane can be used effectively not only to determine the membership but also to delineate the variations in the interstellar environments, e.g., the distribution of dust layers, the role of dust layers in polarization, the associated magnetic field orientation etc. The vector that connects two points in the Stokes plane represents the amount of polarization, while any change in the direction of vectors is related to change in the polarization angle as seen by us toward a particular line of sight. If the dust grains are oriented/aligned uniformly (i.e., uniform magnetic field orientation) then the degree of polarization is expected to increase with distance but the direction of polarization (polarization angle) should remain the same and hence the Stokes vector should not change its direction with increasing distance. For example, in the case of NGC1893 (E11) the degree of polarization was found to increase with distance whereas the direction of polarization remains almost constant (cf. their Fig. 5).
To understand the dust distribution towards Be 59, we compare the polarization measurements of foreground stars, the stars of third group, and the cluster members as shown in Fig. 7. The mean Stokes parameters of these three groups of stars are also marked with large open circle, open square and filled circle respectively and are connected with dashed lines.
| Dust layers | (per cent) | () | ||
|---|---|---|---|---|
| In front of first group of stars | 2.44 | 82 | =-2.35 | =0.65 |
| In front of third group of stars | 3.51 | 104 | =-3.08 | = -1.69 |
| Intra-cluster medium | 2.20 | 135 | =-0.02 | =-2.20 |
The individual polarization properties of the dust layers have been estimated by subtracting their foreground contribution and the same are given in Table 6. The polarization measurements of first group of foreground stars (mean =2.440.45 per cent and mean =8210) located at 470 pc indicate the presence of a dust layer at 470 pc. The orientation of magnetic field of this layer is found to be comparable to the GP. The third group of stars, lying between the first group and the cluster Be 59, show different polarization measurements (=5.550.41 per cent and =952) from those of first group or the cluster members. This fact manifests that there must be another dust layer at the distance 500 pc that polarizes the star light of the second group of stars by 3.5 per cent (see Table 6). The dust grains in this dust layer are found to be aligned significantly differently ( 104, see Table 6) from that in the first dust layer ( 82). The polarization measurements for cluster members (=6.341.05 per cent and = 1054) also indicate different polarization properties of intra-cluster dust. Table 6 suggests that intra-cluster medium also polarizes the cluster members by 2.20 per cent. The dust grains of the intra-cluster material are aligned significantly differently (135) from those in the two foreground dust layers. The polarization angles found to increase with increase in distance from the Sun (cf. Table 6 and Fig. 7). This systematic change in the alignment of dust grains may cause depolarization (less polarization efficiency). This issue will be discussed in the ensuing section.

To further study the dust distribution for distance 500 pc towards the direction of Be 59, we select stars with polarization measurements from the catalogue by Heiles (2000) and having Hipparcos parallax measurements (van Leeuwen, 2007) in a 10 radius around Be 59. We selected stars by applying the following criteria: (a) 0.1 per cent, (b) ratio of parallax error to the parallax, i.e., 0.5 and (c) stars without having any emission features or photometric variability (with the help of SIMBAD). Figure 8 shows polarization versus distance (upper panel) and polarization versus polarization angle (lower panel) for the stars studied in the present work (same symbols as in Fig. 7) as well as the stars (shown with dots) from Heiles (2000). Figure 8 indicates a sudden increase in the polarization at 300 pc, 500 pc and 700 pc, which suggests the presence of three dust layers at 300 pc, 500 pc and 700 pc towards Be 59.
As shown in the lower panel, the polarization angles of the Heiles stars (dots) are distributed randomly, which indicates that the magnetic field orientation in the nearby but in an extended region towards the direction of Be 59 is not as organized as compared with that in the cluster region. Hence the magnetic field in the intra-cluster medium seems to be more confined.
Neckel & Klare (1980) have studied the reddening distribution in the GP with 7.6 using the extinction and distances computed for individual stars. The map towards the direction of Be 59 by Neckel & Klare (1980) [see their Figure 6a, 4 (115/3)] shows an increase in by 0.6 mag at the distance of 300 pc, indicating the presence of a dust layer at this distance. For a normal reddening law, 0.6 corresponds to 0.20 mag. This value of yields a polarization of 1 per cent (=5) which is in accordance with the dust layer at 300 pc as shown in Fig. 8. At 800 pc the further increases and reaches 1 mag. The has a steep rise after 800 pc and at a distance of 1 kpc the is 3 mag corresponding to the of 1 mag, which is consistent with the cluster’s foreground reddening. The present polarimetric results are therefore consistent with the reddening distribution given by Neckel & Klare (1980).


| 37 stars with BV pass-band data | 32 stars with V pass-band data | ||||||||||
| Star ID⋆ | Star ID ⋆ | ||||||||||
| (per cent) | (per cent) | ||||||||||
| (1) | (2) | (3) | (4) | (5) | (6) | (7) | (8) | (9) | (10) | ||
| 3 | 5.19 0.08 | 0.55 0.02 | 0.85 | 1.84 | 47 | 4.05 0.28 | 0.69 0.14 | 0.57 | 1.12 | ||
| 15 | 6.01 0.12 | 0.62 0.03 | 1.14 | 0.22 | 59 | 4.72 0.31 | 0.68 0.13 | 0.33 | 1.62 | ||
| 16 | 7.38 0.09 | 0.57 0.02 | 1.67 | 2.28 | 62 | 4.69 0.14 | 0.58 0.03 | 3.29 | 0.47 | ||
| 16A | 5.57 0.04 | 0.52 0.01 | 3.54 | 3.08 | 64 | 6.02 0.20 | 0.61 0.04 | 0.79 | 0.45 | ||
| 20 | 4.36 0.19 | 0.55 0.06 | 0.85 | 0.33 | 92 | 6.00 1.10 | 0.48 0.10 | 0.83 | 0.43 | ||
| 23 | 6.36 0.29 | 0.53 0.06 | 0.87 | 1.63 | 105 | 6.25 0.24 | 0.50 0.02 | 3.44 | 0.67 | ||
| 66 | 7.18 0.17 | 0.56 0.03 | 0.15 | 0.79 | 120 | 3.91 0.16 | 0.64 0.07 | 3.49 | 2.13 | ||
| 69 | 6.67 0.32 | 0.52 0.06 | 1.12 | 1.30 | 133 | 6.59 1.03 | 0.45 0.07 | 1.68 | 0.27 | ||
| 114 | 5.56 0.12 | 0.52 0.03 | 0.94 | 3.99 | 195 | 8.23 0.28 | 0.52 0.02 | 2.91 | 0.61 | ||
| 130 | 6.94 0.10 | 0.57 0.02 | 1.82 | 5.87 | 196 | 2.31 0.20 | 0.52 0.06 | 1.06 | 2.37 | ||
| 157 | 7.08 0.51 | 0.49 0.08 | 0.23 | 1.45 | 198 | 2.08 0.14 | 0.60 0.09 | 1.42 | 3.00 | ||
| 169 | 7.32 0.17 | 0.55 0.03 | 0.56 | 2.86 | 202 | 5.54 0.38 | 0.55 0.05 | 0.95 | 0.64 | ||
| 186 | 5.91 0.26 | 0.53 0.05 | 0.52 | 0.22 | 215 | 3.98 0.78 | 0.36 0.05 | 5.50 | 0.72 | ||
| 234 | 5.41 0.27 | 0.53 0.07 | 0.69 | 2.57 | 240 | 8.03 0.25 | 0.62 0.05 | 1.38 | 2.13 | ||
| 239 | 2.26 0.22 | 0.50 0.12 | 1.03 | 0.46 | 317 | 5.50 0.19 | 0.57 0.03 | 0.97 | 1.22 | ||
| 247 | 6.69 0.04 | 0.55 0.01 | 1.83 | 4.98 | 433 | 5.66 0.33 | 0.47 0.03 | 3.40 | 4.28 | ||
| 307 | 5.52 0.23 | 0.59 0.06 | 0.29 | 0.63 | 503 | 5.40 0.20 | 0.60 0.05 | 0.36 | 0.59 | ||
| 310 | 6.02 0.17 | 0.49 0.03 | 2.13 | 1.00 | 594 | 1.95 0.10 | 0.47 0.03 | 2.81 | 0.75 | ||
| 316 | 2.99 0.25 | 0.46 0.09 | 1.31 | 1.10 | 689 | 8.73 0.39 | 0.49 0.02 | 3.57 | 0.41 | ||
| 324 | 7.10 0.30 | 0.51 0.05 | 0.35 | 1.48 | 742 | 5.74 0.29 | 0.61 0.07 | 0.94 | 1.05 | ||
| 367 | 6.01 0.31 | 0.80 0.06 | 0.51 | 1.88 | 828 | 8.44 0.10 | 0.58 0.01 | 2.49 | 1.48 | ||
| 368 | 2.81 0.25 | 0.55 0.13 | 0.64 | 1.86 | 1028 | 6.07 0.18 | 0.55 0.02 | 2.41 | 1.19 | ||
| 382 | 5.92 0.20 | 0.57 0.05 | 0.39 | 0.52 | 1106 | 8.58 0.47 | 0.45 0.02 | 7.15 | 1.29 | ||
| 391 | 6.93 0.13 | 0.57 0.03 | 0.74 | 2.99 | 1135 | 8.58 0.55 | 0.47 0.03 | 3.73 | 1.86 | ||
| 418 | 7.82 0.22 | 0.55 0.04 | 0.76 | 3.00 | 1190 | 2.77 0.16 | 0.55 0.05 | 1.02 | 1.05 | ||
| 441 | 8.10 0.08 | 0.56 0.02 | 0.75 | 5.89 | 1273 | 5.74 0.39 | 0.57 0.08 | 0.35 | 0.66 | ||
| 454 | 6.88 0.06 | 0.53 0.01 | 2.36 | 7.64 | 1305 | 5.39 0.56 | 0.48 0.06 | 1.38 | 0.73 | ||
| 461 | 7.95 0.27 | 0.49 0.04 | 0.87 | 3.16 | 1312 | 6.21 0.31 | 0.53 0.04 | 1.43 | 2.16 | ||
| 486 | 6.21 0.29 | 0.48 0.05 | 0.64 | 2.07 | 1451 | 5.21 0.27 | 0.53 0.04 | 1.35 | 2.25 | ||
| 936 | 6.58 0.16 | 0.50 0.03 | 0.72 | 0.52 | 1513 | 2.23 0.17 | 0.54 0.07 | 1.12 | 1.37 | ||
| 988 | 6.01 0.28 | 0.46 0.05 | 0.67 | 0.97 | 1523 | 2.40 0.15 | 0.61 0.09 | 0.54 | 0.49 | ||
| 1067 | 4.57 0.20 | 0.52 0.06 | 0.99 | 0.57 | 1569 | 3.26 0.20 | 0.54 0.05 | 1.22 | 0.54 | ||
| 1154 | 2.18 0.35 | 0.44 0.16 | 0.69 | 0.33 | |||||||
| 1213 | 7.05 0.31 | 0.46 0.04 | 1.31 | 0.27 | |||||||
| 1446 | 2.20 0.50 | 0.44 0.23 | 0.22 | 0.95 | |||||||
| 1580 | 2.43 0.12 | 0.57 0.08 | 0.69 | 0.89 | |||||||
| 1684 | 6.31 0.44 | 0.41 0.06 | 1.18 | 1.07 | |||||||
From P08

4 DUST PROPERTIES
The wavelength dependence of polarization towards many Galactic directions follows the empirical relation (Serkowski et al. 1975; Coyne, Gehrels & Serkowski 1974; Wilking, Lebofsky, & Rieke 1982)
| (2) |
where is the percentage polarization at wavelength and is the peak polarization, occurring at wavelength . The is a function of the optical properties and characteristic particles size distribution of aligned grains (Serkowski, Mathewson & Ford, 1975; McMillan, 1978). The value of is determined by the column density, the chemical composition, size, shape, and degree and orientation of the dust grains. The parameter , an inverse measure of the width of the polarization curve, was treated as a constant by Serkowski et al. (1975), who adopted a value of 1.15 for all the stars. The Serkowski relation with =1.15 provides an adequate representation of the observations of interstellar polarization between wavelengths 0.36 and 1.0 m. In one case and were obtained using the weighted nonlinear least square fit to the measured polarization by adopting; (1) =1.15 for stars having data in passbands, or (2) =1.66 (Whittet et al. 1992) for stars having data in passbands. Table 7 lists the , , and for 69 stars. The estimated values of the and using are listed in the second and third columns and those with passband data are in the seventh and eighth columns. We also computed the parameters 222The values of for each star are computed using the expression ; where is the number of colours and ., (the unit weight error of the fit for each star) which quantifies the departure of the data from standard Serkowski’s law and , the dispersion of the polarization angle for each star normalized by the average of the polarization angle errors (cf. Marraco, Vega, & Vrba 1993). The estimated values of and using passband data are listed in the fourth and fifth columns whereas those using passband data are in the ninth and tenth columns of Table 7. Further, the and for the 37 stars, which have data in the passbands, have been calculated using the data of only three passbands and =1.15. A comparison of the and values obtained using the three and four passband data is shown in Fig. 9, which manifests a good agreement.
If the wavelength dependence of polarization is well represented by the Serkowski law, should not be greater than 1.5 because of the weighting scheme. A higher value ( 1.5) could be indicative of intrinsic stellar polarization (Waldhausen et al. 1999, Feinstein et al. 2008). The polarization angle rotation with wavelength () also indicates the presence of an intrinsic polarization or a change of along the line of sight (Coyne 1974, Martin 1974). Systematic variations with wavelength in the position angle of the interstellar linear polarization of star light may also be indicative of multiple dust layers with different magnetic field orientations along the line of sight (Messinger et al. 1997). Following the above stated criteria, we consider stars with and as probable candidates to have intrinsic polarization and/or polarization angle rotation.
Fig. 10 plots radial distance of stars from the center of the cluster versus (upper left panel), versus (upper right panel), the radial distance of stars versus (lower left panel) and versus (lower right panel). One can see that a significant number of stars show deviation from the normal distribution (14 stars have 2.3, 19 stars have 1.5 and 5 stars have 1.5 as well as (cf. Fig. 10 and Table 7). It is interesting to mention that the majority of foreground stars (12 out of 14) have and all the stars having are located within the cluster region, whereas the majority of the stars (10 stars) having 1.5 are located within the cluster region. About 40 per cent (28 out of 69) stars of the sample show the signatures of either intrinsic polarization or rotation in their polarization angles. Ten stars (#3, 16A, 133, 169, 195, 234, 367, 454, 689 and 1106) are found to be located in the near infrared excess zone (see Fig. 11). Six of them (# 16A, 133, 195, 454, 689 and 1106) show intrinsic polarization, with 1.5. The upper right panel of Fig. 10 indicates that a significant number of stars (12 stars) with 4.5 per cent have 2.3. The star #247 (BD+66 1673) is located towards the north western edge of the cluster. This star was classified previously with objective prism spectra as O9B0 (MacConnell 1968; Walker 1965), but is reclassified later as O5 V((f))n (Majaess et al. 2008), making it the hottest star in Cep OB4. The star’s high temperature drives mass loss via strong stellar winds (Yang and Fukui 1992; Gahm et al. 2006). Our polarimetric results indicate an intrinsic nature of polarization as it has =1.83 and =4.98.
Another criterion to detect intrinsic stellar polarization is based on . A star having much lower than the average value of the ISM (0.545 m; Serkowski, Mathewson & Ford 1975) is considered as a candidate to have an intrinsic component of polarization (Orsatti, Vega, & Marraco 1998). In the present study only one star # 215 has been found to have a much lower value of =0.360.05m. This star has =5.5.
4.1 Extinction law

To study the nature of the extinction law in the cluster region we used the TCDs as described by Pandey et al. (2000, 2003), in the form of () vs. (), where is one of the wavelengths of the broadband filters or , to separate the influence of the normal extinction produced by the diffuse ISM from that of the abnormal extinction arising within regions having a peculiar distribution of dust sizes (cf. Chini & Wargau 1990, Pandey et al. 2000). The () vs. () TCDs for the cluster region are shown in Fig. 12. The distribution of field stars follows a normal reddening law for the foreground inter-stellar matter. The slopes of the distributions for cluster members, , are found to be , , , and for , , , versus TCDs respectively. The ratios and the ratio of total-to-selective extinction in the cluster region, , is derived using the procedure given by Pandey et al. (2003). Assuming the value of for the diffuse foreground ISM as 3.1, the ratios yield , which indicates an anomalous reddening law. P08 have also estimated an anomalous reddening law in the cluster region with , with a normal reddening law for the foreground diffuse ISM. In the central region of Be 59, MacConnell (1968) also found evidence for a large value (3.43.7) of . Several studies have already pointed out an anomalous reddening law with a high value in the vicinity of star-forming regions (see e.g. Pandey et al. 2003 and references therein), however for the Galactic diffuse ISM a normal value of is well accepted. The higher than the normal values of has been attributed to the presence of larger dust grains. There is evidence that within dark clouds accretion of ice mantles on grains and coagulation due to colliding grains change the size distribution towards larger particles. On the other hand, in star-forming regions, radiation from massive stars may evaporate ice mantles resulting in small particles. Here it is interesting to mention that Okada et al. (2003), on the basis of the [Siii] 35 m to [Nii] 122 m ratio, suggested that efficient dust destruction is occurring in the ionized region of Be 59. Chini & Kruegel (1983) and Chini & Wargau (1990) have shown that either larger or smaller grains may increase the ratio of total-to-selective extinction.
The weighted mean value of for the cluster region was estimated to be 0.5380.004m. The mean value, within error, is comparable to the value measured in the general ISM (0.545 m, Serkowski et al. 1975). Using the relation (Whittet & Van Breda 1978), the value of , the total-to-selective extinction, comes out to be 3.010.16, which is in agreement with the average value ( = 3.1) for the Milky Way, but is in contradiction with the result obtained from TCDs. The mean value of for foreground stars is estimated as 0.4980.017m, which yields the value as 2.790.18 for the foreground diffuse ISM. This indicates a smaller value of for the diffuse ISM towards the direction of the Be 59 (). There is much evidence in the literature that indicates significant variations in the properties of interstellar extinction along various Galactic directions. Whittet (1977) reported that the value of in the Galactic plane can be represented by a sinusoidal function of the form = 3.08+0.17 ( + 175), which indicates a minimum value of at . The above relation suggests a value of towards the direction of Be 59 (i.e. ). The study by Geminale & Popowski (2004) also suggests a lower value () towards Galactic longitude . Thus the present estimation of , and consequently the value of for the diffuse ISM is in agreement with the values reported in the literature. Hence we conclude that the for the intra-cluster matter could be higher in comparison to that for the general diffuse matter towards the direction of Be 59. Here it is worthwhile to note that there is much evidence of variation of grain size-distribution towards the direction of Be 59.
4.2 POLARIZATION EFFICIENCY
The ratio of is known to be a measure of the polarization efficiency of the ISM and it depends mainly on the grain alignment efficiency, the magnetic field strength and the amount of depolarization due to the radiation traversing clouds with different magnetic field directions. When the light passes through multiple dust layers, the resultant polarization may increase or decrease depending upon the orientation of the magnetic field in each dust layer (see for example, Feinstein et al. 2003b, Orsatti et al. 2003, Martínez et al. 2004, Vergne et al. 2007, 2010 and E11) The observed polarization and extinction data towards a particular direction of the Galaxy provides important inputs to test the models dealing with the extinction and alignment of the grains. Figure 13 displays the polarization efficiency diagram for the observed stars. The symbols are the same as in Fig. 10. It is well known that for the diffuse ISM the polarization efficiency can not exceed the empirical upper limit given by, =3 3 9.3 per cent (assuming =3.1, Hiltner & Johnson 1956; Serkowski et al. 1975) and the same is shown by a continuous line in Fig. 13. For the average ISM, Serkowski et al. (1975) have found that the polarization efficiency of the ISM follows the mean relation 5 , which is shown by a dashed line. The recent estimate of the average polarization efficiency for the general diffuse ISM by Fosalba et al. (2002), which is valid for 1.0 mag, is shown with a dash-dotted line.

Figure 13 shows that the foreground stars (filled circles) are distributed along the dashed line, which suggests that the dust grains in the dust layer located at 470 pc have polarization efficiency comparable to the average polarization efficiency (5 per cent per mag) of the diffuse ISM. The stars located at 700 pc are shown with filled squares. The colours of these stars indicate two values of (see Table 4). We have used both values of for these stars and those data are connected with thin dashed-dotted lines. In general it seems that the dust layer located at 500 d 800 pc also has an average polarization efficiency (i.e., 5 per cent per mag). The majority of the cluster members (open circles) are distributed below the dashed line thereby indicating that the intra-cluster medium exhibits less polarization efficiency than the mean value for the diffuse ISM ( 5 per cent per mag). The large dispersion in (48 per cent) for cluster members is compatible with the differential reddening within the cluster ( 1.41.7 mag).
The net polarization due to the intra-cluster medium is estimated to be 2.2 per cent (cf. Table 6). The differential due to the intra-cluster medium is 0.3 mag. Thus the net polarization efficiency due to the intra-cluster medium comes out to be 7.3 per cent per mag, which is higher than that due to the diffuse ISM. The small dispersion in the mean value of (4, Table 5) of cluster members also indicates a better alignment of dust grains in the intra-cluster medium. As discussed in Sec 3.3, for the foreground stars of the first group and third group as well as the cluster members, the mean polarization angle changes with increasing distance systematically which may lead to the depolarization effect in the case of radiation from cluster members. Hence the less polarization efficiency of the intra-cluster medium, as seen in Fig. 13, could be because of different alignment of dust grains in the foreground dust layers. Similar kind of depolarization effect has been observed towards Trumpler 27 by Feinstein et al. (2000), Hogg 22 and NGC 6204 by Martínez, Vergne and Feinstein (2004) and towards NGC 6124 by Vergne et al. (2010). Here it is interesting to mention that stars # 418, 441 and 461, located at the northern periphery of the cluster have the highest polarization efficiency among the cluster members. These stars have polarization efficiencies greater than the average value (5 per cent per mag) for the diffuse ISM. Four stars # 689, 828, 1106 and 1135 are located outside the boundary of the cluster and towards north-east of the cluster center. These stars have the highest polarization ( 7.68.7 per cent) and polarization efficiency greater than 5 per cent per mag. The values of these stars range 1.201.50 mag. Interestingly, all these four stars have their 1.5 (cf. Fig. 10), thereby indicating presence of intrinsic polarization.

5 Spatial variation of , , and
Fig. 14(a) shows the spatial distribution of as a function of radial distance from the center of the cluster. The distribution reveals a lack of reddening material near the center of the cluster. The increases away from the center. The values reaches its maximum at 4 ( 1.2 pc) and remains constant up to 6 (1.8 pc). The value decreases for radial distances 6. The spatial distribution suggests that the density of the reddening material is high at 1.21.6 pc in comparison to that near the cluster center. On the basis of one-dimensional raster-scan observations of Sh171 (Be 59) region, Okada et al (2003) have studied the the spatial distribution of line intensities, representing the lowly-ionized gas, the highly ionized gas and photo dissociation region (gas phases) as a function of radial distance from the cluster. The lines representing the neutral region (e.g., [Oi] 63m, 146m; [Cii] 158m; [Siii] 35m), lowly ionized region ([Nii] 122m) and highly ionized region ([Oiii] 52m, 88m; [Niii] 57m) show maxima at 1 pc and 4 pc indicating the presence of high density gas at these positions. Their figure 6, showing 0.61 GHz continuum flux on the line along the raster-scan observations, also indicated that the flux increases systematically with radial distance from the cluster center and reaches the maximum at 1.2 pc and remains constant up to 1.7 pc. The flux shows a decreasing trend for radial distance 1.7 pc. The spatial distribution of 0.61 GHz continuum flux agrees nicely with the distribution as shown in Fig. 14(a). Thus, it is clear that the density of the gas increases with the radial distance from the cluster center with the maximum at 1 pc.
The spatial variation of as a function of radial distance from the cluster center (Fig. 14(b)) shows a systematic increasing trend with the radial distance up to 5; however for radial distance 5, the distribution of shows no trend but a significant scatter. The variation of agrees well with the distribution of gas as discussed above, indicating that the average polarization efficiency in the core as well as in the corona of the cluster is the same. Fig. 14(c) shows the distribution of as a function of radial distance. The distribution also shows a systematic change with the radial distance, in the same sense that the average value ( 110) at the center decreases to 100 at 5. For radial distances 5, the distribution of shows a scattered distribution around 102. On the basis of the distribution we can conclude that the magnetic field orientation in the core of the cluster is significantly different from that in the coronal region, which is comparable to the magnetic field orientation of the third group of the stars ( 96). We presume this could be either due to the molecular cloud at the center being perturbed during the cloud collapse or to strong stellar winds/supernova explosion.
Fig. 14(d) shows the spatial variation of obtained for identified members of the cluster, which manifests that the is higher near the center of the cluster. The average value of decreases up to 5 with increasing radial distance from the cluster center. The distribution of suggests that the dust grain size near the center of the cluster is relatively higher in comparison to that in the coronal region. Okada et al (2003), on the basis of the [Siii] 35m to [Nii] 122m ratio, suggested that the efficient dust destruction is occurring in the ionized region. It is possible that the smaller dust grains might have been evacuated from the central region of the cluster due to strong stellar winds leaving relatively large dust grains in the central region of the cluster.
6 Conclusions
In the present study we have carried out polarimetric observations towards the
direction of young open cluster Be 59 in the bands. The aim of the study
was to investigate the properties of dust grains in the ISM towards the direction of Be 59 as well as the
properties of intra-cluster dust.
Following are the main conclusions of the present study:
The distribution of and suggests three dust layers towards the direction of Be 59 at 300 pc, 500 pc and 700 pc respectively. The total polarization due to these dust layers is found to be 0.21.0, 1.03.0 and 5.5 per cent respectively. The magnetic field orientation in these dust layers is different from each other. The magnetic field orientation of the first dust layer ( 82) is rather similar to that of the GP (86).
We have further shown that the polarization measurements in combination with the colour-colour diagram provide a better estimation of the cluster members. The polarization measurements of the identified cluster members reveal that the net polarization due to the intra-cluster medium is estimated to be 2.2 per cent. About 40 per cent cluster members show the signatures of either intrinsic polarization or rotation in their polarization angles.
The TCDs of the identified cluster members reveal an anomalous reddening law in the cluster region. The weighted mean values of for the cluster region and for the foreground stars are estimated as 0.540.01m and 0.500.02m. The above estimate of for the foreground ISM indicates relatively smaller dust grain sizes, consequently smaller value of total-to-selective absorption =2.790.18 in comparison to the normal value for the diffuse ISM (=3.1). Thus mean value for the cluster region (0.540.01m) suggests a relatively larger grain size in the cluster region in comparison to those in the general diffuse ISM towards the cluster region.
The foreground dust layers have polarization efficiency comparable to the average polarization efficiency ( 5 per cent per mag) of the diffuse ISM, whereas the majority of the cluster members indicate a smaller polarization efficiency for the intra-cluster medium. It indicates that the star light of the cluster members might have been depolarized because of the non-uniform alignment of dust grains in the foreground dust layers and in the intra-cluster medium.
The spatial distribution of in the cluster region shows an increasing trend with the radial distance. The polarization is also found to be systematically increasing with the radial distance from the cluster center. Both and values reach a maximum value at 4-5 ( 1.21.5 pc). The as well as for the cluster members are found to decrease systematically with increasing radial distance.
Acknowledgments
The authors are thankful to the referee Prof. Michael S. Bessell for his critical reading of the manuscript and several useful suggestions, which greatly improved the scientific content of the paper. This publication makes use of data from the 2MASS (a joint project of the University of Massachusetts and the Infrared Processing and Analysis Center /California Institute of Technology, funded by the National Aeronautics and Space Administration and the National Science Foundation). This research has made use of the WEBDA database, operated at the Institute for Astronomy of the University of Vienna, as well as has used the images from the Digital Sky Survey (DSS), which was produced at the Space Telescope Science Institute under the US Government grant NAG W-2166. We have also used NASA’s Astrophysics Data System and IRAF, distributed by National Optical Astronomy Observatories, USA. This work is partially supported by Indo-Taiwan S&T programme.
References
- (1) Aannestad P. A., Purcell E, M., 1973, ARA&A, 11, 309
- (2) Bessell M. S., Brett J. M., 1988, PASP, 100, 1134
- (3) Carpenter J. M., 2001, AJ, 121, 2851
- (4) Chini R., Kruegel E., 1983, A&A, 117, 289
- (5) Chini R., Wargau W. F., 1990, A&A, 227, 213
- (6) Cohen J. G., Persson S. E., Elias J. H., Frogel J. A., 1981, ApJ, 249, 481
- (7) Coyne G. V., 1974, AJ, 79, 565
- (8) Coyne G. V., Gehrels T., Serkowski K., 1974, AJ, 79, 581
- (9) Cutri R. M., et al. 2003, The IRSA 2MASS All-Sky Point Source Catalog, NASA/IPAC Infrared Science Archive (http://irsa.ipac.caltech.edu/applications/Gator/)
- (10) Davis L. Jr., Greenstein J. L., 1951, ApJ, 114, 206
- (11) Eswaraiah C., Pandey A. K., Maheswar G., Medhi B. J., Pandey J. C., Ojha D. K., Chen W. P., 2011, MNRAS, 411, 1418
- (12) Feinstein C., Baume G., Vázquez R., Niemela V., Cerruti M. A., 2000, AJ, 120, 1906
- (13) Feinstein C., Baume G., Vergne M. M., Vázquez R., 2003b, A&A, 409, 933
- (14) Feinstein C., Vergne M. M., Martínez R., Orsatti A. M., 2008, 391, 447
- (15) Fosalba P., Lazarian A., Prunet S., Tauber J. A., 2002, ApJ, 564, 762
- (16) Gahm G. F., Carlqvist P., Johansson L. E. B., Nikolić S., 2006, A&A, 454, 201
- (17) Geminale A., Popowski P., 2004, AcA, 54, 375
- (18) Heiles C., 2000, AJ, 119, 923
- (19) Hiltner W. A., Johnson H. L., 1956, ApJ, 124, 367
- (20) MacConnell D. J., 1968, ApJS, 16, 75
- (21) Majaess D. J., Turner D. G., Lane D. J., Moncrieff K. E., 2008, JAVSO, 36, 90
- (22) Marraco H. G., Vega E. I., Vrba F. J., 1993, AJ, 105, 258
- (23) Martin P. G., 1974, ApJ, 187, 461
- (24) Martínez R., Vergne M. M., Feinstein C., 2004, A&A, 419, 965
- (25) McMillan R. S., 1978, ApJ, 225, 880
- (26) Messinger D. W., Whittet D. C. B., Roberge W. G., 1997, ApJ, 487, 314
- (27) Neckel Th., Klare G., 1980, A&AS, 42, 251
- (28) Okada Y., Onaka T., Shibai H., Doi Y., 2003, A&A, 412, 199
- (29) Orsatti A. M., Feinstein C., Vergne M. M., Martínez R. E., Vega E. I., 2010, A&A, 513, 75
- (30) Orsatti A. M., Vega E., Marraco H. G., 1998, AJ, 116, 266
- (31) Pandey A. K., Ogura K., Sekiguchi K., 2000, PASJ, 52, 847
- (32) Pandey A. K., Sharma S., Ogura K., Ojha D. K., Chen W. P., Bhatt B. C., Ghosh S. K., 2008, MNRAS, 383, 1241
- (33) Pandey A. K., Upadhyay K., Nakada Y., Ogura K., 2003, A&A, 397, 191
- (34) Ramaprakash A. N., Gupta R., Sen A. K., Tandon S. N., 1998, A&AS, 128, 369
- (35) Rautela B. S., Joshi G. C., Pandey J. C., 2004, BASI, 32, 159
- (36) Schmidt G, D., Elston R., Lupie O. L., 1992, AJ, 104, 1563
- (37) Schmidt-Kaler Th., 1982, in Schaifers K., Voigt H. H., Landolt H., eds, Landolt-Bornstein, Vol. 2b. Springer, Berlin, p. 19
- (38) Schulz A., Lenzen R., Schmidt T., Proetel K., 1981, A&A, 95, 94
- (39) Serkowski K., Mathewson D. S., Ford V. L., 1975, ApJ, 196, 261
- (40) van Leeuwen F., 2007, A&A, 474, 653
- (41) Vergne M. M., Feinstein C., Martínez R., 2007, A&A, 462, 621
- (42) Vergne M. M., Feinstein C., Martínez R., Orsatti A. M., Alvarez M. P., 2010, MNRAS, 403, 2041
- (43) Waldhausen S., Martínez R. E., Feinstein C., 1999, AJ, 117, 2882
- (44) Walker G. A. H., 1965, ApJ, 141, 660
- (45) Whittet D. C. B., 1977, MNRAS, 180, 29
- (46) Whittet D. C. B., Martin P. G., Hough J. H., Rouse M. F., Bailey J. A., Axon D. J., 1992, ApJ, 386, 562
- (47) Whittet D. C. B., van Breda I. G., 1978, A&A, 66, 57
- (48) Wilking B. A., Lebofsky M. J., Rieke G. H., 1982, AJ, 87, 695
- (49) Yang J., Fukui Y., 1992, ApJ, 386, 618