A Model for Soft Interactions motivated by AdS/CFT and QCD
Abstract
Monte Carlo generators which were tuned for energies up to that of the Tevatron, are found wanting when extended to LHC energies. We construct a model that satisfies the theoretical requisites of high energy soft interactions, based on two conjectures: (i) the results of the Ads/CDF correspondence for N = 4 SYM, and (ii) the requirement of matching with high energy QCD. In keeping with these postulates, we assume that the soft Pomeron intercept is relatively large, and the slope of the Pomeron trajectory is equal to zero. We derive analytical formulae that sum both the enhanced and semi-enhanced diagrams for elastic and diffractive amplitudes. Parameters of the model are obtained by fitting to experimental data, up to and including the Tevatron energies, and we predict cross sections at all energies accessible at the LHC and beyond. Predictions of the model are in agreement with measured values obtained by CMS, ATLAS and ALICE for and for . We compare our results with experimental data and competing models.
I Introduction
The complete algebraic treatment and results of our model are
contained in GLM GLM and GLMI GLMI .
The following were our guiding criteria for constructing the GLM model.
-
•
The model should be built using Pomerons and Reggeons.
-
•
The intercept of the Pomeron should be relatively large. In AdS/CFT correspondence we expect = 1 - 2/ 0.11 to 0.33. The estimate for from the cross section for multiparticle production as well as from DIS at HERA is = 5 to 9.
-
•
.
-
•
A large Good-Walker component is expected, as in the AdS/CFT approach the main contribution to shadowing corrections comes from elastic scattering and diffractive production.
-
•
The Pomeron self-interaction should be small (of the order of in AdS/CFT correspondence), and much smaller than the vertex of interaction of the Pomeron with a hadron, which is of the order of .
-
•
The last requirement follows from the natural matching with perturbative QCD: where the only vertex that contributes is the triple Pomeron vertex.
II Fundamentals of the GLM model
II.1 The Good-Walker mechanism
In our approach diffractive dissociation is taken into account in the framework of a two channel model, which we developed in GW . This enables us to express all the relevant cross sections, ,,, and the forward elastic slope in terms of three basic amplitudes (s,b), (s,b), (s,b) and a mixing parameter . Satisfying the unitarity constraints we can parametrize the scattering amplitudes in the following simple form:
| (1) |
our parametrization of the opacities will be discussed later. A deficiency of the Good-Walker approach is that it only accounts for diffraction in the region of small mass.
II.2 Enhanced and semi-enhanced diagrams
To calculate the contribution of produced large mass in diffraction dissociation, it is necessary to sum diagrams which contain Pomeron-Pomeron interactions. Examples of these diagrams are shown in Fig.1
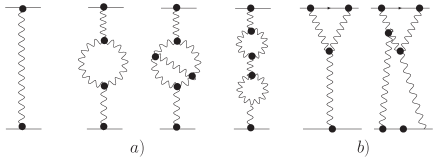
To sum the enhanced and semi-enhanced diagrams, we employ the MPSI approximation (where only large loops of rapidity size O(Y) contribute). This allows us to obtain a closed expression for the Pomeron Green’s function
| (2) |
where is the incomplete gamma function, and denotes the amplitude of the parton (dipole) interaction with the target at arbitrary rapidity Y.
The summed amplitude can then be expressed in terms of
where
| (3) |
III Predictions of our model
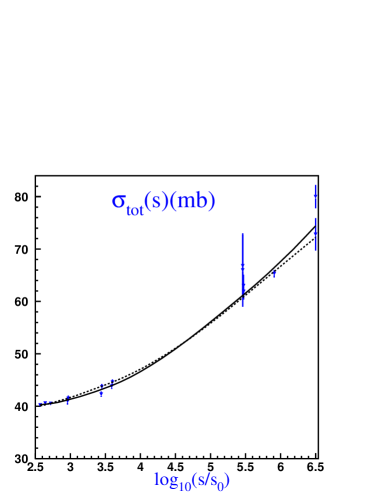
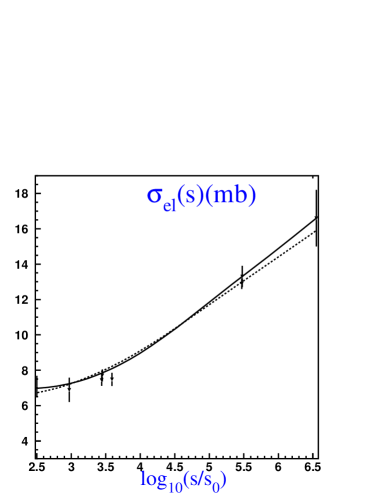
To determine values for the parameters in our model we made a least squares fit, over the ISR -Tevatron energy range, to 55 data points . We obtain a /d.o.f. = 0.86. The values of the parameters are given in GLM .
The results for our total cross section and elastic cross section are shown in Fig.2, other cross sections appear in Fig.3.
 |
 |
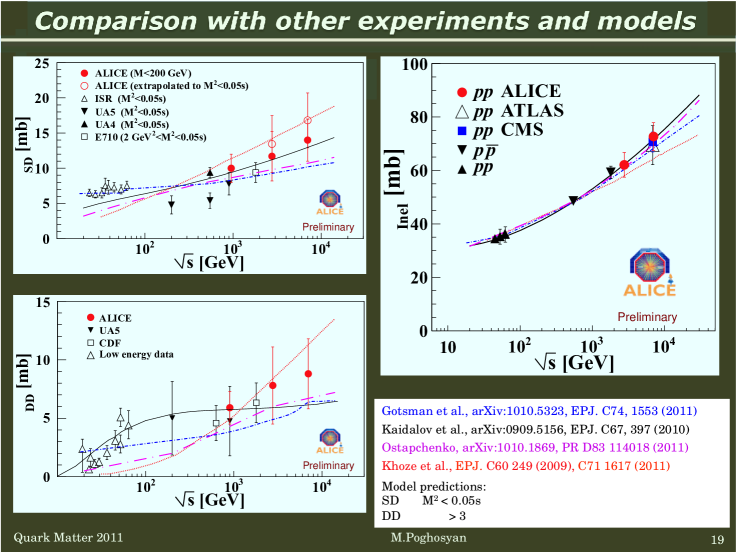
III.1 Comparison with other models on the market
Kaidalov and Poghosyan Kai attempt to describe the data on soft diffraction by taking into account all possible non-enhanced absorptive corrections to three Pomeron and Reggeon vertices and loop diagrams. They apply AGK rules for calculating the discontinuity of the matrix element, and the generation of the optical theorem for the case of multi-Pomeron exchanges. They adopt the following parametrization for the Pomeron trajectory = 1.17 + 0.25t, and for the f and Reggeons, =0.7 + 0.8t and = 0.4 + 0.9t.
Ostapchenko Ostap has made a comprehensive calculation in the framework of Reggeon field theory, based on the resummation of both enhanced and semi-enhanced Pomeron diagrams. To fit the total and diffractive cross sections he assumes two Pomerons: i) a ”soft” Pomeron, = 1.14 + 0.14t and ii) a ”hard” Pomeron, =1.31 + 0.085t.
The Durham group KMR have a model which is similar in spirit to GLM, the main difference lies in their technique of summing the ”Pomeron loop” diagrams, and their recent inclusion of evolution.
The results of the four models are compared in Fig.3.
IV Single Inclusive cross sections
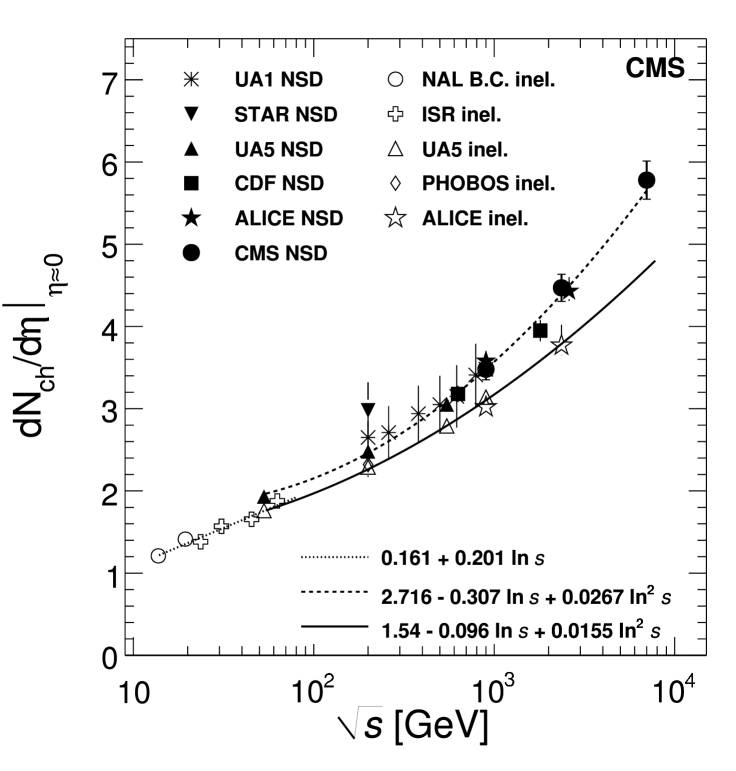
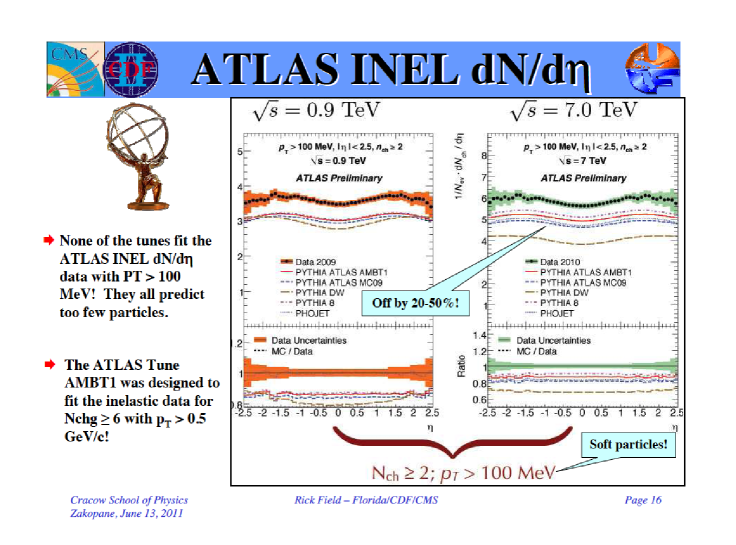
The first results emanating from the LHC was a measurement of the single inclusive cross section cms1 ,Atlas1 ,Alice1 . As shown in Fig.4. by the CMS collaboration cms1 , the inclusive data appear to have a different energy dependence at lower ISR energies, where it can be parametrized by a ln s behaviour, than at the higher LHC energies where it has a ln2s dependence. This variance in energy dependence also appears in the results of Monte Carlo programs which gave a good description of the data when tuned for energies of GeV and failed when extended to LHC energies field . This is clearly illustrated in Fig.5, which was taken from a talk given by Rick Field in Zakopane field .
We were curious to see if our model was compatible with this feature. To test this we extended our model of soft interactions so as to examine its reliability at LHC energies.
The single inclusive cross section:
| (4) |
IV.1 Comparison with LHC single inclusive data
To compare our model with data, we need to introduce two new phenomenological parameters and which describe the emission of hadrons from the Pomeron and Reggeon, as well as the ratio of the dimensional parameters and . is the average transverse momentum of the produced minijets, and denotes the mass of the slowest hadron produced in the decay of the minijet. The three additional parameters are determined by fitting to experimental inclusive data.
We made two separate fits:
a) fitting to the CMS data at different LHC energies, and
b) fitting to all inclusive data for W 546 GeV.
The results of our fit are shown in Table 1.
| Data | ||||
|---|---|---|---|---|
| All | 0.396 | 0.186 | 0.427 | 0.9 |
| CMS | 0.413 | 0.194 | 0.356 | 0.2 |
In Fig.6. we compare the predictions of our model (using the parameters given in Table 1) with the experimental results given by the three LHC experimental groups cms1 ,Atlas1 ,Alice1 and from PDG PDG .
 |
 |
In Fig.6(a) (the left hand figure) we compare with the CMS data cms1 , while in Fig.6(b), (the right hand figure) we compare with all data available at energies 546 GeV cms1 ,Atlas1 Alice1 , PDG . The fit to the CMS data for energies 900 GeV 7000 GeV is far superior to that made to all data 546 GeV 7000 GeV. Whether this is due to normaliztion problems, or unascertained physical phenomena, is still an open question.
V Summary and Conclusions
-
•
We present a model for soft interactions having two components:
(i) G-W mechanism for elastic and low mass diffractive scattering.
(ii) Pomeron enhanced contributions for high mass diffractive production. -
•
Enhanced diagrams, make important contributions to both and .
-
•
Most phenomenological models which successfully describe LHC data, are found lacking at lower energies. This is shown explicitly in Fig.3, where the fit denoted Khoze KMR which goes through the LHC points for and , completely underestimates the lower energy measurements.
-
•
Monte Carlo generators which were successful in describing data for W 1.8 TeV, need to be retuned to describe LHC data. This is illustrated in Fig.5.
-
•
GLM model (with parameters determined by data for W 1.8 TeV ) underestimates inclusive rapidity distribution () data for = 7 TeV.
Fit made to LHC data (ONLY), is successful.
We trust that the enigma regarding the cause of the apparent change in energy behaviour at LHC energies, will be solved in the near future.
Acknowledgements.
I would like to thank my friends and collegues Genya Levin and Uri Maor, for an enjoyable collaboration, the fruits of which are presented here.References
- (1) E. Gotsman, E. Levin, U. Maor, Eur. Phys. J. C71 (2011) 1553 [arXiv:1010.5323 [hep-ph]].
- (2) E. Gotsman, E. Levin, U. Maor, “Inclusive production in a model for soft interactions“ Phys. Rev.D (in print) [arXiv:1103.4509 [hep-ph]].
- (3) E. Gotsman, E. Levin, U. Maor, J.S. Miller, Eur. Phys. J. C57 (2008) 689 [arXiv:0805.2799 [hep-ph]].
- (4) A. Kaidalov and M. Poghosyan, Eur. Phys. J. C67 (2010) 397 [arXiv:0909.5156 [hep-ph]].
- (5) A. Ostapchenko, Phys. Rev. D 83 (2011) 114018 [arXiv:1010.1869 [hep-ph]].
- (6) V. Khoze, A. Martin and M. Ryskin, Eur. Phys. J. C 60 (2009) 249; 71 (2011) 1617.
- (7) V. Khachatryan et al (CMS Collaboration), JHEP 1002 (2010) 041 [arXiv:1002.0621 [hep-ex]].
- (8) G. Aad et al (ATLAS collaboration), Phys. Lett. B 688 (2010) 21 [arXiv:1003.3124 [hep-ex]].
- (9) K. Aamodt,et al, (ALICE Collaboration), Eur. Phys. J. C 65 (2010) 111 [arXiv:0911.5430 [hep-ex]].
- (10) C. Amsler et al. (Particle Data Group) Phys. Lett. B B687 (2004) 1.
- (11) R. D. Field, ”Mini-Bias and the Underlying Events at LHC (Part 2), 51st Cracow School of Theoretical Physics, Zakopane, Poland, June 13, 2011.