The Young Cluster in IC 1274
Abstract
IC 1274 is a faintly luminous nebula lying on the near surface of the Lynds 227 (L227) molecular cloud. Its cavity-like morphology is reminiscent of a blistered star-forming region. Four luminous, early-type (B0–B5) stars are located within a spherical volume 5′ in diameter that appears to be clear of heavy obscuration. Approximately centered in the cleared region is the B0 V star HD 166033, which is thought to be largely responsible for the cavity’s excavation. Over 80 H emission sources brighter than have been identified in the region. More than half of these are concentrated in IC 1274 and are presumably members of a faint T Tauri star population. Chandra Advanced CCD Imaging Spectrometer (ACIS) imaging of a nearby suspected pulsar and time-variable -ray source (GeV J1809-2327) detected 21 X-ray sources in the cluster vicinity, some of which are coincident with the early-type stars and H emitters in IC 1274. Deep () optical photometry has been obtained for the cluster region. A distance of kpc and a mean extinction of mag follow from photometry of the early-type stars. Using pre-main-sequence evolutionary models, we derive a median age for the H emitters and X-ray sources of 1 Myr; however, a significant dispersion is present. Our interpretation of the structure of IC 1274 and the spatial distribution of H emitters is that the early-type stars formed recently and are in the process of ionizing and dispersing the molecular gas on the near surface of L227. The displaced material was driven against what remains of the molecular cloud to the east, enabling the formation of the substantial number of T Tauri stars found there. A dispersed population of H emitters is also found along the periphery of L227, IC 1275, and IC 4684. These sources, if pre-main-sequence stars, appear to have formed in relative isolation compared to the dense cluster environment of IC 1274 or, alternatively, may be older and have drifted further from their formation sites. We identify a star very near the position of X-ray source 5, the assumed -ray source and young pulsar candidate. The lack of distinctive characteristics for this source, however, coupled with the density of faint stars in this region suggest that this may be a random superposition.
1 Introduction
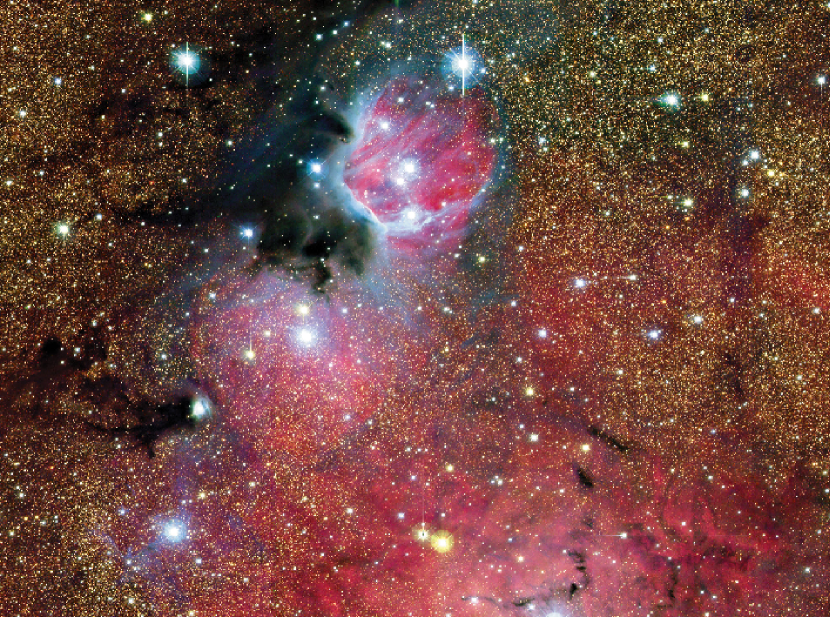
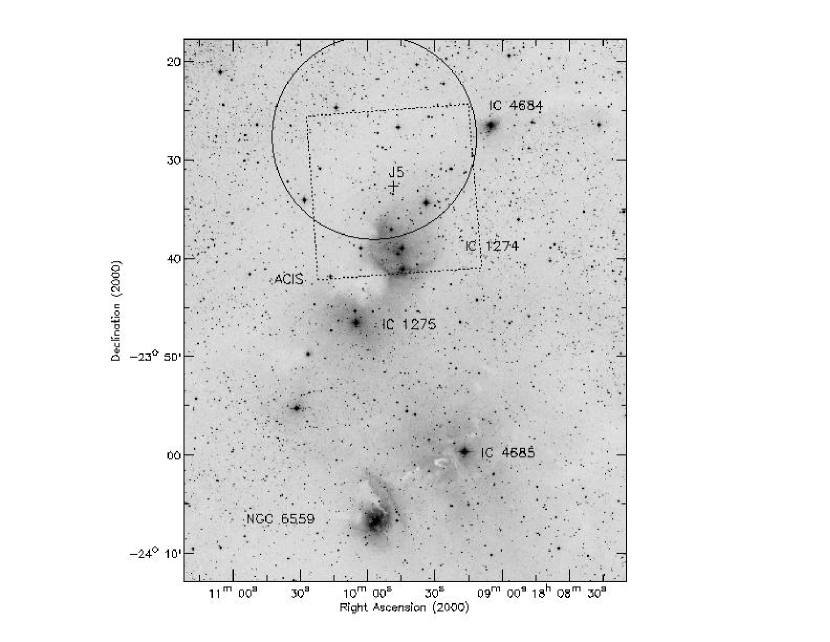
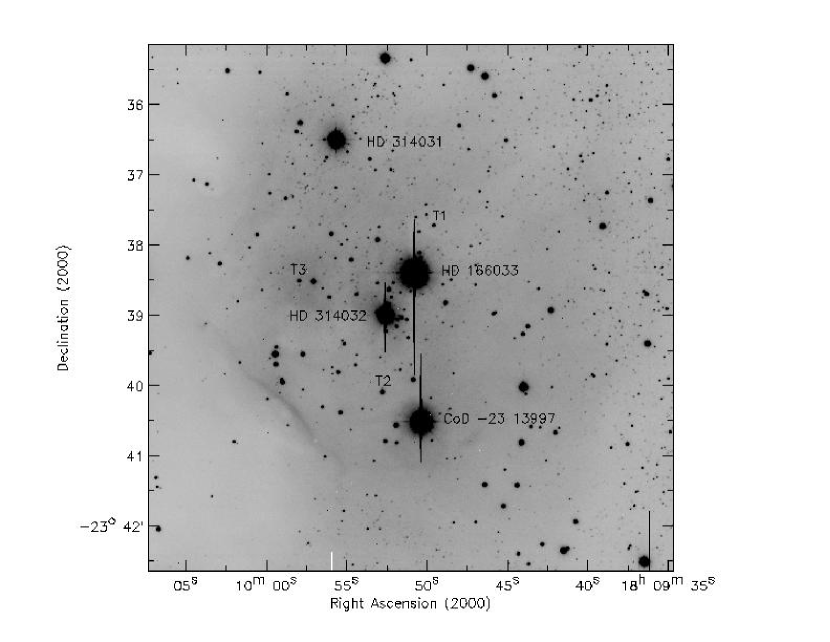
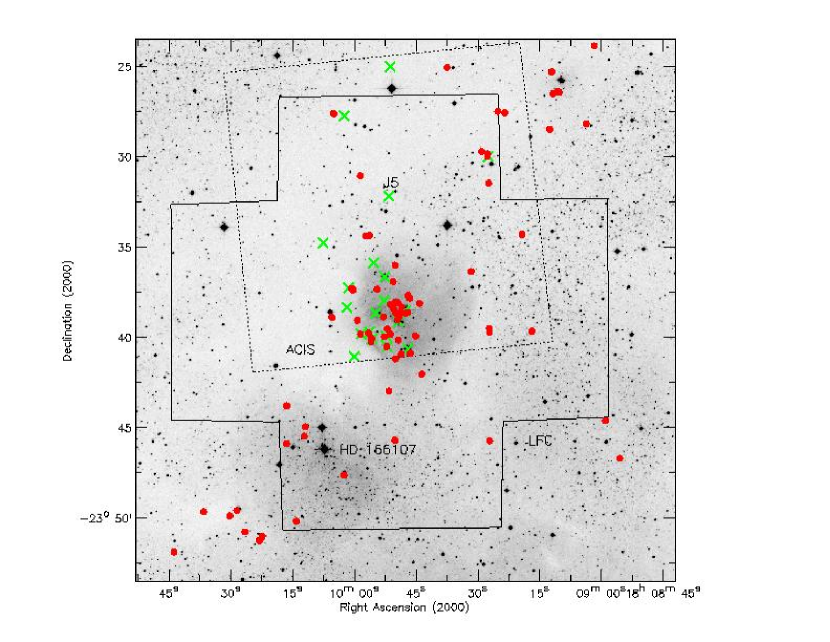
IC 1274 (, ; , ), shown in Figure 1, lies within an aggregate of bright nebulae located northeast of the H II region M8 and nearly 2 southeast of M20. Optical images show that M8 is located at the base of a bulbous mass of dark nebulosity, 08 wide, that appears to project from the Galactic plane to a distance of 17 before terminating in a complex region referred to as Simeis 188. Included within Simeis 188 are the bright nebulae IC 4684, IC 1274, IC 1275, IC 4685, and NGC 6559, as well as the Lynds 227 (L227) and Lynds 210 (L210) molecular clouds. Low-level H II emission present throughout the region is referred to as Sharpless 2-32 (Sh 2-32). Shown in Figure 2 is a 45′56′ blue image of Simeis 188 obtained from the Digitized Sky Survey in which major components are identified. IC 1274 is shown in more detail in Figure 3, a deep -band image obtained with the University of Hawaii (UH) 2.2 m telescope. Four bright B-type stars, which are labeled, appear to illuminate the nebula. A spherical cavity 5′ in diameter appears to have been carved out of L227, presumably by the early-type stars.
Approximately centered in the evacuated region is HD 166033 (B0 V). This star likely furnishes the illumination of the bright nebular rim, although the confused structure of the rim near CoD23∘13997 (B1 V) suggests that this star is also involved. Together with HD 314032 (B5 V) and HD 314031 (B0.5 V), these stars could represent the most massive members of a young stellar cluster that is emerging from the molecular cloud. Herbig (1957) identified six faint H emission stars in and around IC 1274 using the slitless grating spectrograph of the Crossley reflector at Lick Observatory. To date, no thorough investigation of the young stellar population of IC 1274 is known to the authors.
The region received considerable attention when the Energetic Gamma Ray Experiment Telescope (EGRET) onboard the Compton Gamma Ray Observatory discovered an apparently time-variable -ray source, GeV J1809-2327 (Oka et al. 1999; Hartman et al. 1999; Braje et al. 2002), several arcminutes north of IC 1274. Subsequent X-ray observations of the region with Advanced Satellite for Cosmology and Astrophysics (ASCA) and Chandra identified 21 X-ray sources, many of which correspond to stars in the IC 1274 region, including the four early-type stars. Braje et al. (2002) give particular attention to one source that is attached to a 30″ tail of diffuse X-ray emission. They speculate that this source is a young pulsar with no optical counterpart and the likely origin of the -ray emission.
The present investigation is intended to identify the low-mass population of the star-forming region. Toward this end, deep () optical () imaging of IC 1274 has been obtained using the Large Format Camera (LFC) on the Hale 200 inch (5 m) telescope at Palomar Observatory. Complementing these observations are three epochs of slitless grism H spectroscopy spanning some 19 yr that reveal a faint T Tauri star (TTS) population concentrated within the cluster and sparsely distributed along the periphery of the L227 molecular cloud. High-dispersion optical spectra of the four early-type stars in IC 1274 and of three regions within the weakly ionized emission nebula have also been obtained.
This paper is organized as follows: In § 2 details are provided of all observations presented. In § 3 distance and extinction estimates are determined for the region and compared with results from the literature for Sh 2-32. In § 4 the H slitless grism survey of IC 1274 and the surrounding area is discussed, potential sources of contamination are reviewed, and the spatial distributions of detected H emitters and X-ray sources are considered. In § 5, we examine the cluster, including the color-magnitude diagram, the ages and masses of the identified TTSs and X-ray sources, and its near-infrared color–color diagram. In §§ 6 and 7, the high-dispersion spectra of the early-type stars and nebulosity are discussed. The electron density is also derived for the luminous shell. Finally, we discuss star formation in IC 1274, the young pulsar candidate identified by Braje et al. (2002) and the star-forming history of the region.
2 Observations
2.1 Optical Photometry
Deep (Bessel) images of IC 1274 were obtained on the night of 2006 August 31 using the LFC mounted at the prime focus of the Hale telescope. The night was photometric; however, seeing conditions varied between and 15. The LFC is a mosaic of six SITe 20484096 pixel thinned, backside-illuminated, anti-reflection coated CCDs with 15″ gaps between detectors. The mosaic yields a 24′ diameter field of view with a pixel scale of 0.36″ pixel-1 (binned 22). A sequence of five dithered images was obtained with exposure times of 120 s in the - and -band filters and 60 s in the - and -band filters. A second sequence with 10 s and 5 s integration times was also made with the - and -band filters and the - and -band filters, respectively, to enable photometry on stars saturated in the longer integrations. The five dithers allowed regions lying in the detector gaps to be adequately covered.
The reduction of the LFC mosaic imaging followed a description by Roy Gal that makes use of the external packages and in the Image Reduction and Analysis Facility (IRAF). The task was used to apply crosstalk and overscan corrections, and trim the overscan regions of the individual CCDs. The combined bias frame and appropriate dome flats were then applied to the standard star and target images yielding processed data frames. Remnant large-scale background variations caused by uneven dome illumination were removed by creating and applying sky flats generated from twilight images. Due to significant distortion present in the LFC, corrections to the astrometric solutions must be derived and applied using the task, which matches catalogs of USNO-A2 stars to each of the observed fields. Stars were rejected on the individual frames until residuals for a 5th order polynomial fit were 04. Cosmic rays were removed using the task in the package of IRAF. Given that does not function on multiextension format (MEF) images, each CCD in the mosaic was treated individually.
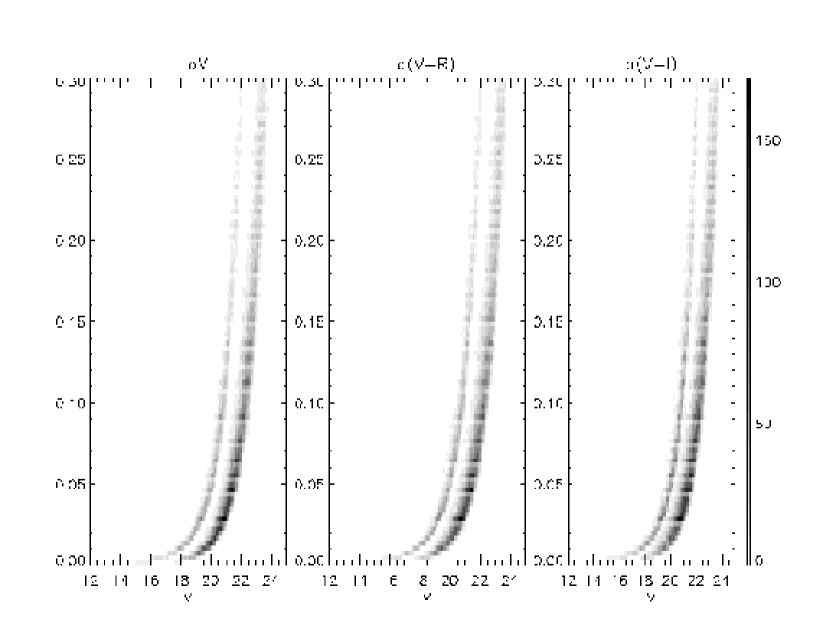
Single images were created from the MEF files using the task. Images of a given field were then tangent plane projected with the same pixel scale and center position and stacked into a single image using the task in IRAF. Aperture photometry was then performed on the final stacked images using the task in the package using apertures of 18 for both standard stars and program stars. Extinction corrections and transformation to the Landolt (1992) system were achieved by observing several standard star fields throughout the night at various air masses. Density plots of photometric errors as they depend upon -band mag are shown for , , and in Figure 4.
2.2 H Slitless Grism Spectroscopy
The H emission surveys of the IC 1274 region were carried out on 1990 September 14, 2003 October 02–03, and 2009 July 17 UT. The 1990 and 2003 surveys were made with the Wide-Field Grism Spectrograph (WFGS) installed at the f/10 Cassegrain focus of the UH 2.2 m telescope. A 420 line mm-1 grism blazed at 6400 Å provided a dispersion of 3.85 Å pixel-1. The narrowband H filter isolated a region of the first-order spectra between 6300 and 6750 Å. WFGS imaged upon the central 10241024 pixels of a Tektronix 20482048 pixel CCD, yielding a nominal field of view 5555. The 1990 observations covered a region 15′55 in area, roughly centered upon HD 166033. The more extensive 2003 survey consisted of nine overlapping fields arranged in a 33 grid pattern yielding a final mapped region 15′15′ in area. Integration times for the slitless grism spectra were 30, 120, and 1200 s for each field to ensure complete, unsaturated coverage for nearly all sources. Seeing conditions during the 2003 October survey were excellent, 06. Consequently, several faint H emitters were only detected by those observations.
The 2009 survey used the Wide-Field Grism Spectrograph 2 (WFGS2: Uehara et al. 2004) also installed at the Cassegrain focus of the UH 2.2 m telescope. The WFGS2 observations used a 300 line mm-1 grism blazed at 6500 Å providing a dispersion of 3.8 Å pixel-1. The narrowband H filter has a 500 Å passband centered near 6515 Å. The detector for WFGS2 is a Tektronix 20482048 CCD with 24 m pixels. The field of view is 115115. The 2009 survey was the most extensive in area, covering a region 30′30′ on the sky, but the deepest integrations were limited to 240 s due to telescope guiding problems. Depending upon seeing conditions, the limiting measurable equivalent width, W(H), is approximately 2 Å for both WFGS and WFGS2. The continua of stars brighter than were sufficiently well defined on deep exposures such that W(H) could be determined.
2.3 HIRES Spectroscopy
High-dispersion optical spectra were obtained for the four early-type stars in IC 1274 and across three regions of the nebulosity using the High Resolution Echelle Spectrometer (HIRES; Vogt et al. 1994) on Keck I on the night of 2010 June 16. Conditions were photometric with average seeing of 10. High-resolution spectra were also obtained for HD 166033 on 1997 August 12 and 1998 October 31 using HIRES. The instrument was configured with the red cross-disperser and collimator in beam. The C1 decker (08770), which has a projected slit width of 3 pixels, was used, providing a spectral resolution of 45,000 (6.7 km s-1). Near complete spectral coverage from 3600–8000 Å was achieved. The 1997 and 1998 observations were made with the single Tektronix 20482048 CCD that has 24 m pixels. The 2010 observations were made with the upgraded 3-chip mosaic of MIT-LL CCDs having 15 m pixels. The CCDs were used in low-gain mode, resulting in readout noise levels of 2.8, 3.1, and 3.1 e-1 for the red, green, and blue detectors, respectively. Internal quartz lamps were used for flat fielding, and ThAr lamp spectra were obtained for wavelength calibration. Integration times were 900 s, yielding signal-to-noise levels of 100 on the green detector for the early-type stars. The cross-dispersed spectra were reduced and extracted using standard tools available in IRAF.
3 Distance and Extinction
Direct imaging of the Sagittarius star-forming region suggests that Simeis 188, M8, and M20 are associated with the same complex of molecular gas and dust (Herbig 1957). Modern distance estimates for these star-forming regions and their associated clusters include 1247 pc for NGC 6530 (Mayne & Naylor 2008), 1250 pc for M8 (Arias et al. 2007), 1260 pc for NGC 6531 (Park et al. 2001), and 1670 pc for M20 (Rho et al. 2008). A recent study of variations in the extinction law within the Trifid nebula (M20) by Cambrésy et al. (2011), however, suggests an even greater distance of 2.70.5 kpc. The extinction values were obtained using Two Micron All Sky Survey (2MASS), United Kingdom Infrared Deep Sky Survey (UKIDSS) and Spitzer Space Telescope data, but are insensitive to the diffuse interstellar medium, which is characterized by a ratio of total-to-selective absorption of .
To estimate the distance of IC 1274, we assume that the four early-type stars define the zero-age main sequence. These stars, however, are saturated even on the shortest LFC integrations. We therefore use the optical photometry for these stars from Herbst et al. (1982). We also adopt the magnitudes and intrinsic colors for main-sequence stars of Schmidt-Kaler (1982) to determine individual values and distances, assuming , which are presented in Table 1. These values rely upon spectral types taken from Herbst et al. (1982) and Crampton & Fisher (1974). No modern spectral types for these stars are available. The average distance is kpc and the mean is mag. One caveat regarding this distance estimate is that Jaschek & Gomez (1998) find that for a given B-type dwarf, is distributed around its mean with a standard deviation of 0.55 mag. For the sample of four stars in IC 1274, we expect an inherent error of 0.55/41/2 mag, which equates to distance uncertainty of 245 pc.
This distance estimate is consistent with those derived for the surrounding H II region Sh 2-32 by other investigations using a range of techniques. Georgelin et al. (1973) derive photometric and H interferometric kinematic distances of 2.4 and 1.881.03 kpc, respectively. From and H photoelectric photometry of 5 early-type stars within Sh 2-32, Vogt & Moffat (1975) determine a distance of 2.2 kpc and a mean extinction of 1.17 mag. Using CO velocities for molecular gas within Sh 2-32, Fich & Blitz (1984) find a kinematic distance of 1.800.6 kpc. Photometric distance estimates are sensitive to errors in spectral classification and luminosity type, absolute magnitude, binarity, interstellar absorption, and measurement errors. Kinematic distances are limited by the accuracy of the Galactic rotation curve and the assumption of circular motion about the Galactic center. Random motions, expansion of the H II region, and measurement errors contribute to the total uncertainty as well. Table 2 summarizes these results from the literature, as well as the methods used in their determination.
4 The H Emission Survey of IC 1274 and L227
4.1 Detected H Emission Sources and Field Star Contamination
Herbig (1957) discovered six H emission stars in and around IC 1274 (LkH125–130) in a photographic survey carried out at Lick Observatory between 1954 and 1956. The limiting magnitude of the Lick survey was . The H slitless grism observations presented here resulted in the detection of 82 H emitters, including 5 of those identified by Herbig (1957), in the 30′30′ survey area. Over half of these emitters are concentrated within IC 1274. The remaining sources are distributed across the region, but are preferentially found along the periphery of L227.
Provided in Table 3 are the J2000 coordinates, -band magnitudes, , , , colors, and -band magnitudes for these emission-line sources, if available. The imaging region with the LFC was less extensive than the H emission survey; consequently some of the detected H emitters lack optical photometry. Those sources lacking near-infrared photometry are either fainter than the detection limit of 2MASS, or their point-spread functions are confused with other nearby sources. Also given in Table 3 are the measured W(H) values from each of the three H surveys (1990, 2003, 2009), if available. For the previously unknown emission-line sources, an IH number is assigned, continuing the numbering convention of Herbig (1998), Herbig & Dahm (2002), Herbig et al. (2004), Dahm & Simon (2005), Dahm (2005), and Herbig & Dahm (2006). No corrections have been applied to the W(H) values presented in Table 3 for overlying absorption structure.
The fundamental advantage of spectroscopic H surveys is the near unambiguous detection of pre-main-sequence stars in young clusters and star-forming regions. The primary sources of contamination are active late-K and M-type field stars (dMe) that exhibit enhanced chromospheric and coronal emission. H emission strengths among dMe stars, however, are typically weak, W(H) 10 Å (Hodgkin et al. 1995; Reid et al. 1995; Hawley et al. 1996), and would predominantly affect the statistics of weak-line T Tauri star (WTTS) populations. Few (19/82) weak-line emitters are detected among the H emission stars in this survey. Other potential sources of contamination include chromospherically active giants, RS CVn binaries, cataclysmic variables, and active galaxies. The field density of such objects is expected to be low, and the L227 molecular cloud would likely obscure background sources over a substantial fraction of the survey area. With these caveats, we assume that field contamination among the H emission stars is low, but certainly nonzero. Most of the detected emitters are believed to be members of a faint TTS population.
The equivalent width of H is a well-established indicator of accretion processes and chromospheric activity among pre-main-sequence stars (for a review, see Bertout 1989). Traditionally, the boundary between classical T Tauri stars (CTTS) and WTTS was placed at W(H) = 10 Å (e.g. Herbig 1998). No physical interpretation was intended for this value, but clear differences in the processes responsible for emission have since been recognized for CTTS (accretion) and WTTS (enhanced chromospheric activity). Because of the contrast effect (Basri & Marcy 1995; White & Basri 2003), W(H) is spectral-type dependent. Consequently, no unique W(H) value is capable of distinguishing all accretors from nonaccretors. Various spectral type dependent criteria have been proposed, (e.g., Martín 1998; White & Basri 2003), but without spectral type information for the low-mass population of IC 1274, we assume the classical boundary of 10 Å to distinguish CTTS from WTTS.
Using this criterion, we find the fraction of H emitters that are WTTS, (WTTS) = (WTTS)/(TTS), to be . We compare this fraction with those found in other young clusters and star-forming regions derived from identical techniques. In IC 5146 this ratio is (Herbig & Dahm 2002); in NGC 2264, 0.430.03 (Dahm & Simon 2005); in IC 348, Herbig (1998); and in NGC 2362, (Dahm 2005). The published ages for these young clusters are 1.0 Myr for IC 5146 (Herbig & Dahm 2002), 1–2.5 Myr for NGC 2264 (Dahm & Simon 2005; Dahm et al. 2007), 1–3 Myr for IC 348 (Lada et al. 2006), and 5 Myr for NGC 2362 (Dahm 2005; Dahm & Hillenbrand 2007). The decay of strong H emission with isochronal age parallels the timescale of inner disk dissipation determined from near- and mid-infrared excess observations (e.g., Haisch et al. 2001; Hernández et al. 2007).
Notably absent from IC 1274 are bright H emitters that could be intermediate-mass Herbig AeBe stars or classical Be stars whose circumstellar disks have become optically thin (Hillenbrand et al. 1993). Given the relative youth of the cluster, the presence of such stars would be expected. Further north near IC 4684 is one potential intermediate-mass emission-line star: LkH127. Optical photometry is available from the literature, mag. Assuming the distance and mean extinction of IC 1274, the for this source would be mag, consistent with a mid-B spectral type at 1 Myr using the isochrones of Siess et al. (2000). A spectrum, however, is needed for confirmation.
4.2 Spatial Distribution of H Emitters and X-ray Sources
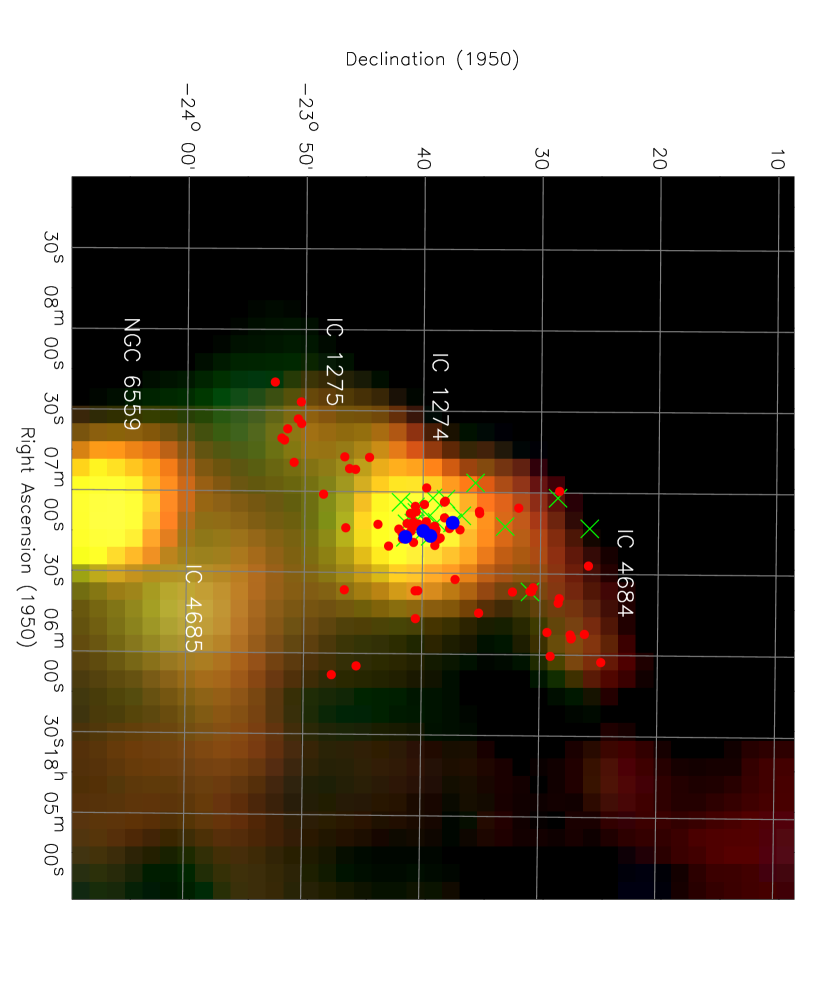
Shown in Figure 5 is the spatial distribution of H emission sources superimposed upon a red Digitized Sky survey image of the IC 1274 region. Also plotted are the X-ray sources from Braje et al. (2002) that were detected in a shallow (9.7 ks) Chandra ACIS exposure (ObsID 739). The four early-type stars, as well as four H emitters, were detected in X-rays. The other X-ray sources lacking H emission are presumably cluster members. Two are not detected optically and two others lie far outside of the LFC field of view (annotated in Fig. 5). In Table 4 we summarize the properties of the 21 X-ray sources identified by Braje et al. (2002), including their J2000 coordinates, -band magnitudes, , , , colors, and -band magnitudes.
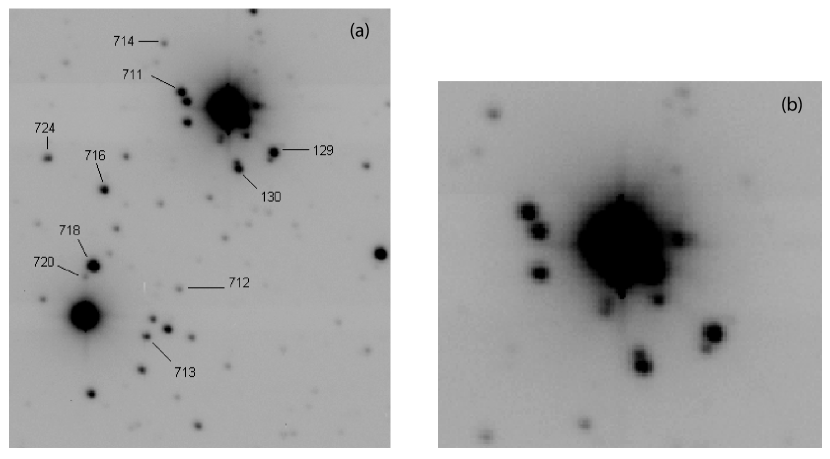
Across the entire region surveyed, roughly half of the detected H emitters and X-ray sources are located in IC 1274. Most of these are preferentially found in the southeastern hemisphere of the evacuated cavity. Faint sources, some of which are H emitters, also appear to be strongly concentrated around HD 166033, the assumed center of IC 1274. This is not observed for the other B-type stars. Shown in Figures 6a and 6b are -band images of HD 166033 obtained with the UH 2.2 m telescope. They reveal at least a dozen sources within 20″ of HD 166033, or projected separations of 0.18 pc. Considering only H emitters and X-ray sources, we estimate the surface density of presumed cluster members to peak 8 pc-2 within the central 1 pc, comparable to other densely populated star-forming regions.
It is perhaps no coincidence that IC 1274 hosts the most massive star that has yet formed in the L227 molecular cloud. The dense population of H emitters detected in the central cluster region suggests that star formation in IC 1274 was highly localized and rapid as random velocity dispersions on the order of 1 km s-1 (typical of young galactic clusters) would disperse cluster members over relatively short timescales, 10 Myr.
In addition to the H emitters concentrated within IC 1274, there is a dispersed population that spans the extent of L227. Approximately 8′ (4.2 pc) southeast of IC 1274, some 14 H emitters are found near IC 1275. Most are along the periphery of L227, but several are near HD 166107, the bright B2 V star at the center of IC 1275 (Fig. 5). To the northwest of IC 1274, a number of H emitters and X-ray sources are distributed along the dark nebulosity leading up to IC 4684. This sparse population of T Tauri stars appears to have formed in relative isolation compared with those within IC 1274. It is also possible, however, that these stars are simply older and have drifted from their formation site within the cluster.
5 The Young Cluster in IC 1274
5.1 The Color-Magnitude Diagram
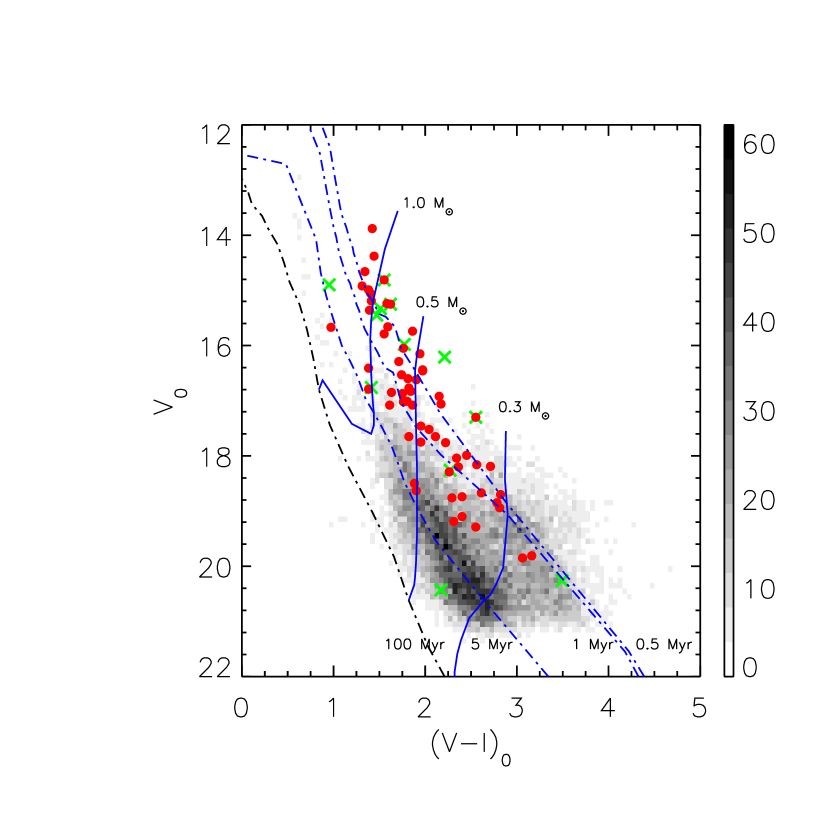
The extinction-corrected , color-magnitude diagram for the H emission stars and X-ray sources with available photometry is shown in Figure 7. The two-dimensional density function of over 18,000 sources having photometric uncertainties of 0.1 mag in both -band magnitude and color from the LFC imaging is represented by the grayscale histogram. In the absence of classification spectroscopy, we apply the mean extinction value ( mag) derived for the B-type cluster stars to the H emitters and X-ray sources. This technique was also used by Walker (1957; 1959) in his studies of NGC 6530 and IC 5146 and more recently by Herbig (1998), Herbig & Dahm (2002), and Dahm & Simon (2005) in IC 348, IC 5146, and NGC 2264, respectively. Also shown in Figure 7 is the 100 Myr isochrone of Siess et al. (2000), placed at a distance of 1.82 kpc, which serves as a zero-age main-sequence line. The 0.5, 1.0, and 5.0 Myr isochrones and the 0.3, 0.5, and 1.0 evolutionary tracks of Siess et al. (2000), placed in the observational plane using the main-sequence colors of Kenyon & Hartmann (1995), are also depicted. It is apparent that the H emitters and X-ray sources do not fall along a well-defined pre-main sequence, but are instead distributed between the 0.5 and 5 Myr isochrones. While this may in part be due to an intrinsic age dispersion, other factors including binarity, variability, and observational error all contribute to the observed spread.
5.2 The Ages and Masses of the H Emitters and X-ray Sources
The grid of solar metallicity pre-main-sequence models of Siess et al. (2000) was used to derive physical properties for the optically detected H emitters and X-ray sources, assuming the adopted cluster distance and mean extinction. Uncertainties involved in the use of pre-main sequence evolutionary tracks and isochrones fall into two broad categories: the underlying physics used in modeling stellar evolution from the birthline to the zero-age main sequence, and the error induced when transforming between theoretical and observational planes. Each pre-main sequence model treats convection, opacity, radiative transfer, accretion, and rotation differently, leading to differences in predicted evolutionary paths for a given stellar mass. Initial conditions establishing the birthline are also not well understood. Transforming between theoretical and observational planes is typically achieved by fitting main sequence colors and bolometric corrections as a function of effective temperature. The use of main sequence colors, however, is questionable given the enhanced chromospheric activity, accretion, and variability characteristic of pre-main sequence stars. The intrinsic colors of such sources, however, are not well established.
Table 5 summarizes the predicted attributes for the H emitters, including spectral type, effective temperature (), mass, luminosity, radius, and age. Table 6 presents identical data for the X-ray sources of Braje et al. (2002), excluding the four early-type stars and the H emitters included in Table 5.
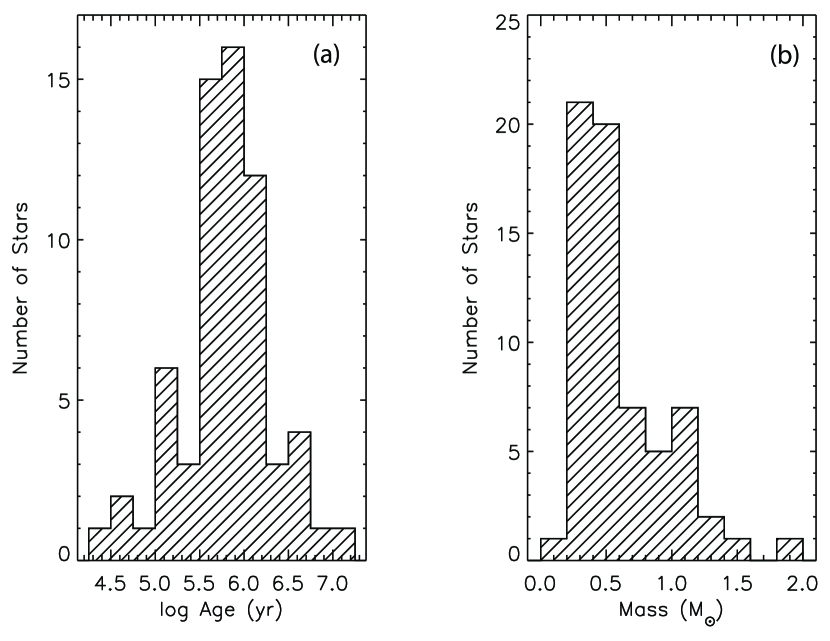
The resulting age distribution for the H emitters and X-ray sources is shown in Figure 8a by the histogram. The median of the age distribution is 0.8 Myr, but no corrections have been applied for possible binarity among the H emission and X-ray population of IC 1274 prior to calculating individual ages and masses. This estimated age is sensitive to the adopted distance and would increase by a factor of 3 if IC 1274 were 0.5 kpc closer to the Sun.
We show the distribution of masses derived using the Siess et al. (2000) models for the H and X-ray selected sample of stars in IC 1274 in Figure 8b. The distribution peaks near 0.4 before turning sharply over toward lower masses due to survey incompleteness. The masses predicted by the pre-main-sequence models of Siess et al. (2000) are in reasonable agreement with the dynamical masses of main-sequence binaries in the mass range from 1.2 to 2.0 (Hillenbrand & White 2004). In the range from 0.1 to 0.5 , however, these models predict masses that are systematically lower than the dynamically derived values by 5–20% (Hillenbrand & White 2004). Summing the derived mass values for the detected H emitters and X-ray sources, we are able to account for 40 of the total cluster mass. Assuming an uncertainty of 20%, we can at best account for 48 of the cluster population. Adding to this the estimated masses of the four B-type stars, 41 , the observed cluster mass is 90 .
The total mass of a cluster can be approximated by integrating the initial mass function (IMF) in the power-law region of the relation that extends from the highest-mass stars to 0.3 . This lower mass limit coincides with the least massive members of IC 1274 detected by the H emission survey. Assuming the Salpeter (1955) IMF power-law slope of 1.35, Elmegreen (2000) finds the solution of this integral to be approximated by
,
where is the total cluster mass and is the mass of the most massive star in the cluster in units of solar mass. For IC 1274, this would be the B0 V star HD 166033. Using the average mass of a B0 V star from Drilling & Landolt (2000), 17.5 , we estimate the total mass of the IC 1274 cluster to be 285 . This does not include the flattened, low-mass portion of the IMF below 0.3 , which remains unexplored by the present survey. The implication is that over two-thirds of the cluster’s stellar mass content remains unaccounted for by the H emission stars, X-ray sources, and known early-type stars. The undetected cluster members either lack strong H and X-ray emission, are heavily obscured, or remain embedded within L227. Deep (100 ks) X-ray imaging of the cluster would likely reveal more candidate cluster members. Intermediate-mass (1.5–3.5 ) stars generally exhibit a large dispersion in fractional X-ray luminosity (Feigelson et al. 2003; Dahm et al. 2007), but should be detectable in a sufficiently deep X-ray image of the cluster. Such A-, F-, and G-type stars are notably absent from the H and X-ray-selected stars.
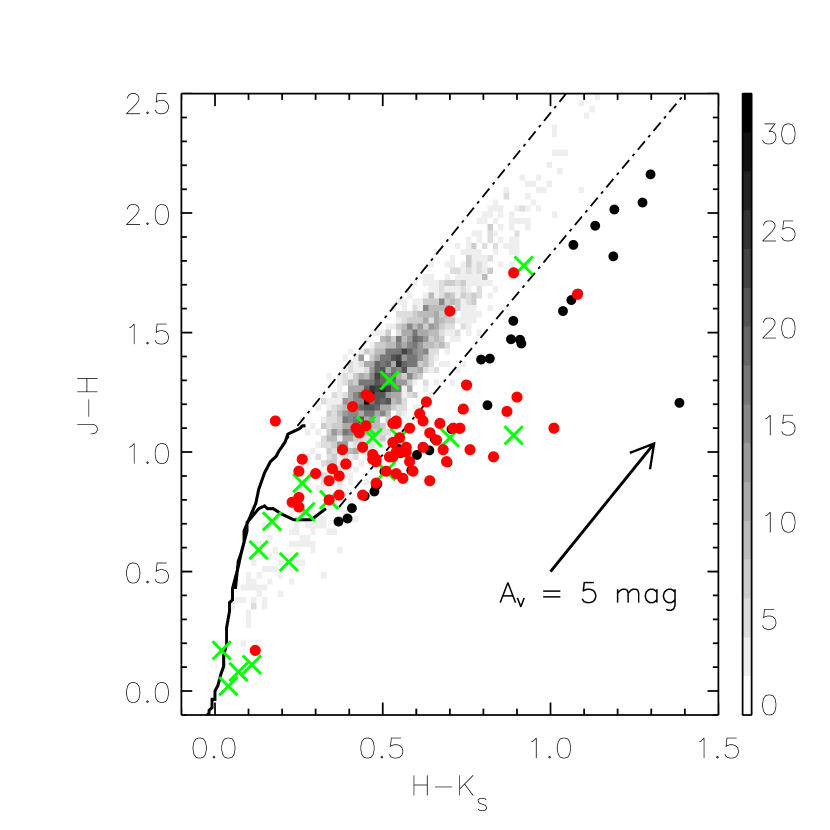
5.3 The Near-Infrared Color-Color Diagram
Near-infrared photometry was obtained from the 2MASS Point Source Catalog for all sources within a 10′ radius of the IC 1274 cluster center defined by HD 166033. The resulting , color-color diagram is shown in Figure 9 for all sources with and photometric uncertainties of 0.1 mag. The solid curves are the intrinsic colors for main-sequence stars and giants from Tokunaga (2000), transformed to the 2MASS filter system using the relations of Carpenter (2000). The dashed parallel lines are the reddening boundaries for the giant branch and main-sequence loci, derived using the average interstellar extinction curve of He et al. (1995). Significant reddening is apparent for a large population of infrared sources, presumably distant background stars and galaxies. The majority of the H emitters and X-ray sources, however, suffer little reddening but do exhibit substantial excess, indicative of dust emission from hot inner disks. There appears to be a larger population of infrared excess sources that are not accounted for by either the H or the X-ray surveys of the region. Many of these sources lie to the right of the reddening line for main-sequence stars and are possible members of IC 1274 or embedded Class I protostars within L227.
6 High-Dispersion Spectroscopy of the Early-type Stars
The absorption lines of the four B stars are very broad (HD 166033 is the narrowest), so blending is severe, but all reasonably unblended lines between 3600 and 7200 Å have been measured, with results given in Table 7. The range in velocity measured for HD 166033 much exceeds the uncertainty of the individual measurements, so we suspect it to be a spectroscopic binary. The velocity measured for the sharp Na I lines is essentially the same for all four B stars, km s-1, and is shared by the CH+ and K I interstellar lines in the same spectra. We conclude they are produced in the foreground.
This can be compared with the mean heliocentric CO velocities in the region determined by Oka et al. (1999; 3.46 km s-1), Yamaguchi et al. (1999; 3.05 km s-1), and Fich & Blitz (1984; 2.95 km s-1) that agree that the velocity of L227 is about 3.0 km s-1. The difference may be because the CO is concentrated around the periphery of the cavity, while the Na I cloud is projected against the B stars in the middle. The velocities of the B stars themselves (in Table 7) are roughly 10 km s-1 more positive. Throughout this paper, we have tacitly assumed that the early-type stars and H emission populations are essentially contemporary, but to account for the radial velocity discrepancy between the early-type stars and molecular cloud, we must acknowledge the possibility that the B stars formed elsewhere in the foreground and have now moved near the edge of L227 and are in the process of creating the cavity and exposing the H emission population.
7 The Emission Nebula IC 1274
The cavity of IC 1274 is faintly luminous, but given the spectral types of the illuminating stars (B0–B5), it is not obvious whether the nebula is likely to be an H II region, because the conventional dividing line between stars that illuminate emission and reflection nebulae is about B1. The B0 V star HD 166033 is bolometrically the most luminous of the early-type stars, and given its central position within IC 1274, we believe it to be largely responsible for the cavity’s excavation.
To examine whether the cavity is the remnant of an expanding shell of gas, HIRES spectra were obtained at three points across the face of IC 1274 (labeled T1, T2, and T3 in Fig. 3). Spectra of the background at the positions of the B stars have also been recovered. Emission lines characteristic of an ionized nebula are present: H is strong and appears as a smooth structureless Gaussian with a full width at half-maximum (FWHM) of 22 to 24 km s-1 with peak heliocentric radial velocities ranging from 5 to 7 km s-1. The intensity ratio of the [S II] lines at 6717, 6730 is an indicator of electron density. Following the formalism of Keenan et al. (1996), we derive an electron density of about 100 cm-3, demonstrating that the cavity contains a very weakly ionized emission nebula, but there may also be scattered light from the other B-type stars as well.
If the cavity were an expanding shell, the radial velocities of the narrow [S II] and [N II] emission lines should vary systematically with respect to the distance from the center of the nebula (i.e., HD 166033). At the assumed distance, and a time interval of 1 Myr, the expansion velocity would be 1–2 km s-1. The emission lines, however, remain single, at 3 to 7 km s-1, with the exception of those at HD 166033, where they are double and have a separation of 8 to 10 km s-1. Provided in Table 8 are the rectangular coordinates in arcsec of T1–T3 and the B-type stars relative to HD 166033, the radial distance from HD 166033 in arcsec, the measured heliocentric radial velocity of [S II] emission at these points, and the intensity ratio of 6717/6730. These results place a firm restraint on any speculation that the diameter of the shell is correlated with the dynamic age of IC 1274.
8 Discussion
Our interpretation of the structure of IC 1274 is as follows: The early-type stars in the cluster formed recently, and have since ionized and dissociated the H2 and CO on the near side of the molecular cloud, forming the cavity that is now observed. The faintly luminous spherical shell is outlined particularly on the east and southeast by what appears to be a pileup of material driven there, directly or indirectly, by the B-type stars near the center. The western edge of the nebula is not so clearly defined. There is a striking concentration of H emitters in the southeastern half of the cavity. An explanation might be that the molecular gas that originally filled the cavity was disrupted when the B stars formed, and material in the eastern half was driven up against what now survives as the massive L227 molecular cloud. To the west there was no such resistance, and material flowed freely outward in that direction. The increase in density to the east enabled the formation of low-mass stars in that volume. If so, the photometric ages of those TTSs (1 Myr) would have to be compatible with the time required for the cavity to have been formed. An alternate explanation is that the TTSs may have been present well before the early-type stars formed, and are only now detectable because the expanding cavity cleared away the foreground extinction.
Substantial low-mass star formation has accompanied the appearance of the massive stars and indeed may have preceded their formation if the isochronal ages of some individual H emitters and X-ray sources are taken at face value. Limited low-mass star formation is occurring along the periphery of the L227 molecular cloud from IC 4684 to IC 1275, some 10 pc in extent. Shown in Figure 10 is a 1∘ square IRAS composite image (25, 60, and 100 m) centered upon IC 1274 with the positions of the early-type stars, H emitters, and X-ray sources superimposed. Dust emission peaks within the cluster core, which is offset from the dark nebulosity evident on optical images of the field (compare with Figs. 1, 2, and 5). Some 20′ south of IC 1274, NGC 6559 exhibits significant far-infrared emission, presumably from dust heated by the presence of early-type stars that illuminate the emission/reflection nebula. The H emission stars and X-ray sources effectively trace the areas of warm dust emission.
Oka et al. (1999) mapped the L227 molecular cloud in the transition of CO and found a mean cloud velocity that corresponds to a kinematic distance of kpc. The virial mass of the cloud agrees well (factor of 2) with that derived using the total CO luminosity and a standard CO to H2 mass ratio (Scoville et al. 1987). This total mass, 1–, is comparable to that of the molecular clouds in the Taurus-Auriga complex (Mizuno et al. 1995). The cloud exhibits a sharp, well-defined boundary (see Fig. 1 of Oka et al. 1999) that parallels the eastern edge of dust emission evident in Figure 10. The Very Large Array (VLA) 21 cm continuum observations of the region by Braje et al. (2002) reveal a spherical mass of H I emission coincident with IC 1274 (see their Fig. 1). The neutral hydrogen emission likely originates from the photodissociation of H2 by the early-type stars. The conically shaped H I emission region north of IC 1274 evident in the VLA map has been the subject of an intense search to isolate the Galactic -ray source GeV J18092327.
The identity of GeV J18092327 could have some bearing on the early star forming history of L227. If a young pulsar is responsible for the time-variable -ray emission as hypothesized by Oka et al. (1999) and Braje et al. (2002), its progenitor supernova could have triggered the active star formation that is occurring throughout L227 and the Simeis 188 nebula complex. The low spatial resolution (3′) ASCA Gas Imaging Spectrometer (GIS) survey of Oka et al. (1999) identified two prominent X-ray sources separated by 6′. The southern source is pointlike, but appears connected with the IC 1274 cluster. X-ray emission for this source peaks between 0.5 and 2.2 keV, primarily due to the response of the ACIS detectors. The northern point source is associated with diffuse X-ray synchrotron emission and was considered the likely candidate for the -ray source. This X-ray source exhibits a significant hard component from 2.2 to 10 keV that was not observed for the southern source. Within the synchrotron nebula, Oka et al. (1999) speculate that a pulsar is producing high-energy electrons (TeV-level) that are impacting the molecular gas of L227, some 30″ or 0.3 pc distant, rapidly decelerating, and emitting the observed -ray flux.
The higher-resolution (03) Chandra ACIS and VLA 21 cm observations of the region by Braje et al. (2002) revealed an X-ray point source near the ASCA GIS detection that is connected to a nonthermal X-ray and radio emission nebula. Their X-ray source 5 lacks an optical counterpart on the Palomar Sky Survey red image and appears connected to the diffuse radio nebula by a 30″ long jet of X-ray emission. This source exhibits a composite X-ray spectrum with a hard component as well as an underlying thermal emission spectrum. Braje et al. (2002) propose that source 5 is a young pulsar (age 104–106 yr), and that its wind and nebula are responsible for the observed -ray emission.
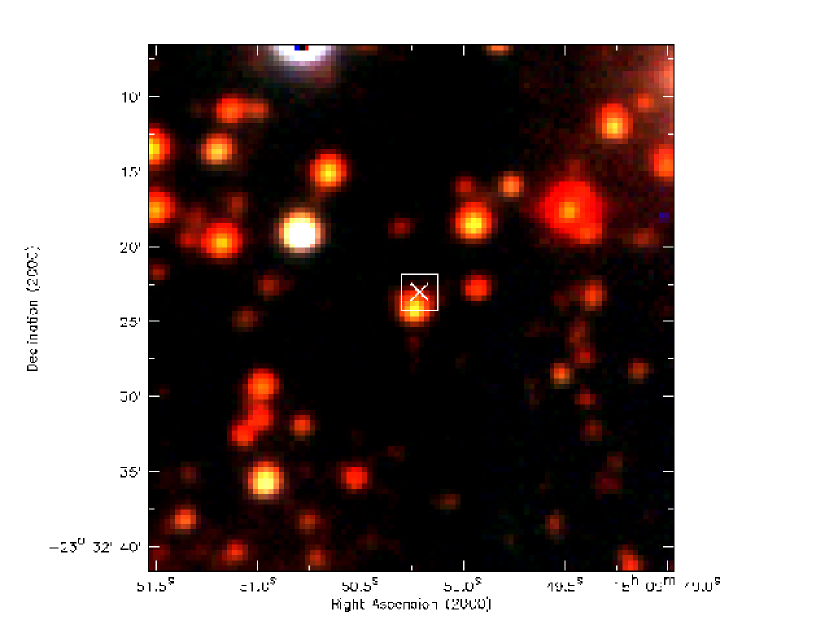
The LFC observations presented here include the location of source 5. To identify an optical counterpart, we first registered a dozen X-ray sources having well-defined, unsaturated optical counterparts and determined a median relative position error between the ACIS and LFC astrometry of 0.90.4″. The offset for source 5 specifically with its proposed optical counterpart is 1.2″. The source is faint, , and if at the adopted distance of IC 1274, it would lie near the 0.5 Myr isochrone of Siess et al. (2000), several magnitudes above the zero-age main sequence with a mass of 0.25 .
Shown in Figure 11 is a three-color composite () image of source 5 taken from the LFC imaging. The synchrotron emission nebula extends to the northwest, toward the luminous star causing the halo evident in the upper right corner of Fig. 11. The LFC imaging reveals a peculiar red flaring that extends several arcseconds south of source 5 that may be a confused background object. Given the densely populated field, it is certainly possible that source 5 and the proposed optical counterpart are the result of a random superposition. Considering that the -ray line of sight extends far beyond L227, and the lack of any persuasive structural connection between the two, we conclude that the proposed causal connection between the -ray source and star formation activity in IC 1274 and L227 has yet to be demonstrated.
9 Summary and Conclusions
IC 1274 is a faintly luminous emission nebula enveloping a spherical cavity excavated out of the L227 molecular cloud very probably by the B0 V star HD 166033. This single-line spectroscopic binary hosts a small clustering of fainter stars within a distance of 20″ or projected separations of 0.18 pc. From the intensity ratio of the forbidden [S II] lines at 6717, 6730, we derive an electron density of 100 cm-1, establishing IC 1274 as a weakly ionized emission nebula, but scattered light from the other B-type stars must also be present.
Star formation, as evidenced by the presence of numerous H emission stars and X-ray sources, presumably members of a low-mass, pre-main-sequence population, is occurring within and around IC 1274 and the L227 molecular cloud. Over 80 stars with H in emission and brighter than have been identified in the region as well as 21 X-ray sources (Braje et al. 2002), many of which are coincident with the early-type stars and H emission stars in IC 1274. Correcting for interstellar extinction and assuming a distance of 1.82 kpc (inferred from photometry of the four B-type stars), these H emitters and X-ray sources lie 1–3 mag above the zero-age main sequence. A median age of 1 Myr is derived using the evolutionary models of Siess et al. (2000), although a significant dispersion is present.
The H emission stars and X-ray sources are strongly concentrated around the massive B-type stars in IC 1274, and are preferentially positioned in the southeastern half of the nebula. The dust and molecular gas that once filled the cavity within IC 1274 may have been driven up against the massive L227 molecular cloud to the east when the B stars formed. The increase in density may have enabled the formation of the low-mass stars in that volume. To the west, the outflowing gas met no resistance and flowed freely into the interstellar medium. Some 14 H emission stars are identified along the periphery of the L227 cloud near IC 1275 10′ or 5 pc to the south. Another handful of emitters is found along the lanes of dark nebulosity leading up to the IC 4684 reflection nebula.
Notably absent from IC 1274 are bright H emission stars that could be intermediate-mass Herbig AeBe or classical Be stars. Given the relative youth of the cluster, the presence of Herbig AeBe stars would be expected. We identify one candidate classical Be star (LkH 127) lying near IC 4684. This source exhibits strong H emission, but its near-infrared colors are consistent with photospheric emission.
Assuming that the early-type stars and detected H emitters and X-ray sources form a real cluster, we conclude that only one-third of the cluster mass is accounted for if a Salpeter-like IMF is adopted. Deeper high-resolution X-ray imaging of IC 1274 is needed to identify the bulk of the cluster stars, particularly the intermediate-mass members that eluded detection by the H emission survey and the shallow Chandra survey of Braje et al. (2002). In press it was brought to the attention of the authors that a deeper (30 ks) Chandra ACIS-I observation was recently made of this region (ObsID 12546). When available, this image should detect a substantial number of additional cluster members.
The faint () optical counterpart of X-ray source 5 identified in the LFC imaging exhibits colors that are consistent with a low-mass, pre-main-sequence star if at the adopted distance of IC 1274. Given the density of the field star population in this region, however, it is not unreasonable to assume that the X-ray source and optically detected star are randomly superposed. We conclude that the linkage between the -ray source GeV J1809-2327, X-ray source 5, and star formation activity within L227 is derived from the concatenation of several hypotheses that requires additional evidence to support. The deeper Chandra ACIS-I observation of the region may resolve some of these issues.
References
- (1) Arias, J. I., Barba, R. H., & Morrell, N. I. 2008, MNRAS, 374, 1253
- (2) Basri, G. & Marcy, G. W. 1995, AJ, 109, 762
- (3) Bertout, C. 1989, ARA&A, 27, 351
- (4) Braje, T. M., Romani, R. W., Roberts, M. S. E., & Kawai, N. 2002, ApJ, 565, L91
- (5) Cambrésy, L., Rho, J., Marshall, D. J., & Reach, W. T. 2011, A&A, 527, A141
- (6) Carpenter, J. 2000, AJ, 120, 3139
- (7) Crampton, D., & Fisher, W. A. 1974, Publications of the Dominion Astrophysical Observatory Victoria, 14, 283
- (8) Dahm, S. E. 2005, AJ, 130, 1805
- (9) Dahm, S. E., & Hillenbrand, L. A. 2007, AJ, 133, 2072
- (10) Dahm, S. E., & Simon, T. 2005, AJ, 129, 829
- (11) Dahm, S. E., Simon, T., Proszkow, E., & Patten, B. M. 2007, AJ, 134, 999
- (12) Drilling, J. S., & Landolt, A. U., in Allen’s Astrophysical Quantities, ed. A. N. Cox (4th ed.; New York: Springer), 381
- (13) Elmegreen, B. G. 2001, in ASP Conf. Ser. 243, From Darkness to Light: Origin and Evolution of Young Stellar Clusters, ed. T. Montmerle & P. Andr ’e (San Francisco, CA: ASP), 255
- (14) Feigelson, E. D., Gaffney, J. A., III, Garmire, G., Hillenbrand, L. A., & Townsley, L. 2003, ApJ, 584, 911
- (15) Fich, M., & Blitz, L. 1984, 279, 125
- (16) Georgelin, Y. M., Georgelin, Y. P., & Roux, S. 1973, A&A, 25, 337
- (17) Grasdalen, G. L. 1975, PASP, 87, 831
- (18) Haisch, K. E., Jr., Lada, E. A., & Lada, C. J. 2001, ApJ, 553, L153
- (19) Hartman, R. C., Bertsch, D. L., Bloom, S. D., Chen, A. W., Deines-Jones, P., Esposito, J. A., et al. 1999, ApJ, 525, 191
- (20) Hawley, S. L., Gizis, J. E., & Reid, I. N. 1996, AJ, 112, 2799
- (21) He, L., Whittet, D. C. B., Kilkenny, D., & Spencer Jones, J. H. 1995, ApJS, 101, 335
- (22) Herbig, G. H. 1957, ApJ, 125, 654
- (23) Herbig, G. H. 1998, AJ, 497, 736
- (24) Herbig, G. H., Andrews, S. M., & Dahm, S. E. 2004, AJ, 128, 1233
- (25) Herbig, G. H., & Dahm, S. E. 2002, AJ, 123, 304
- (26) Herbig, G. H., & Dahm, S. E. 2006, AJ, 131, 1530
- (27) Herbst, W., Miller, D. P., Warner, J. W., & Herzog, A. 1982, AJ, 87, 98
- (28) Hernández, J., et al. 2007, ApJ, 671, 1784
- (29) Hillenbrand, L. A., Massey, P., Strom, S. E., & Merrill, K. M. 1993, AJ, 106, 1906
- (30) Hillenbrand, L. A., & White, R. J. 2004, ApJ, 604, 741
- (31) Hodgkin, S. T., Jameson, R. F., & Steele, I. A. 1995, MNRAS, 274, 869
- (32) Jaschek, C., & Gomez, A. E., 1998, A&A, 330, 619
- (33) Keenan, F. P., Aller, L. H., Bell, K. L., Hyung, S., McKenna, F. C., & Ramsbottom, C. A. 1996, MNRAS, 281, 1073
- (34) Kenyon, S. J., & Hartmann, L. 1995, ApJS, 101, 117
- (35) Lada, C. J., et al. 2006, AJ, 131, 1574
- (36) Landolt, A. U. 1992, AJ, 104, 340
- (37) Martín, E. L. 1998, AJ, 115, 351
- (38) Mayne, N. J., & Naylor, T. 2008, MNRAS, 386, 261
- (39) Mizuno, A., Onishi, T., Yonekura, Y., Nagahama, T., Ogawa, H., & Fukui, Y. 1995, ApJ, 445, 161
- (40) Oka, T., Kawai, N., Naito, T., Horiuchi, T., Namiki, M., Saito, Y., Romani, R. W., & Kifune, T. 1999, ApJ, 526, 764
- (41) Park, B-G., Sung, H., & Kang, Y. H. 2001, JKAS, 34, 317
- (42) Reid, N., Hawley, S. L., & Mateo, M. 1995, MNRAS, 272, 828
- (43) Rho, J., Lefloch, B., Reach, W. T., & Cernicharo, J. 2008, in ASP Monograph Publ. 5., Handbook of Star Forming Regions, Vol. 2: The Southern Sky, ed. B. Reipurth (San Francisco, CA: ASP), 509
- (44) Salpeter, E. E. 1955, ApJ, 121, 161
- (45) Schmidt-Kaler, T. 1982, in Landolt-Bornstein, New Series, Group 6, Vol. 2b, Stars and Star Clusters, ed. K. Schaifers & H. H. Voight (Berlin: Springer), 10
- (46) Scoville, N. S., Yun, M. S., Clemens, D. P., Sanders, D. B., & Waller, W. H. 1987, ApJS, 63, 821
- (47) Siess, L., Dufour, E., & Forestini, M. 2000, A&A, 358, 593
- (48) Tokunaga, A. T. 2000, in Allen’s Astrophysical Quantities, ed. A. N. Cox (4th ed.; New York: Springer), 143
- (49) Uehara, M., et al. 2004, SPIE, 5492, 661
- (50) Vogt, N., & Moffat, A. F. J., 1975, A&A, 45, 405
- (51) Vogt, S. S., et al. 1994, SPIE, 2198, 362
- (52) Walker, M. F. 1957, ApJ, 125, 636
- (53) Walker, M. F. 1959, ApJ, 130, 57
- (54) White, R. J., & Basri, G. 2003, ApJ, 582, 1109
- (55) Yamaguchi, N., Mizuno, N., Saito, H., Matsunaga, K., Mizuno, A., Ogawa, H., & Fukui, Y. 1999, PASJ, 51, 791
| Star | CoD | aaOptical photometry from Herbst et al. (1982). | aaOptical photometry from Herbst et al. (1982). | Sp TypebbSpectral types from Herbst et al. (1982) and Crampton & Fischer (1974). | Distance | J sourceccSource identifier from Braje et al. (2002). | |
|---|---|---|---|---|---|---|---|
| (kpc) | |||||||
| … | 23∘13997 | 9.16 | +0.07 | B1 V | 1.04 | 1.84 | 12 |
| HD 166033ddSome confusion arose because the identification of these stars on the HDE charts was not compatible with the original HD listing. Herbst et al. (1982) followed the HDE numbering, where our HD 166033 was identified as HD 166079, and our CoD 23∘13997 was called HD 166033. | 23∘13998 | 8.59 | +0.07 | B0 V | 1.15 | 1.94 | 1 |
| HD 314032 | 23∘13999 | 9.96 | +0.22 | B5 V | 1.21 | 0.98 | 13 |
| HD 314031eeThis star was once believed to be a white dwarf (WD 180623) on the basis of color and a large proper motion. The proper motion was shown to be in error by Grasdalen (1975), and there is now no reason to believe that the star is not at about the distance of IC 1274. | 23∘14002 | 9.89 | +0.20 | B0.5 V | 1.49 | 2.51 | 3 |
| Reference | Method | Technique | Distance |
|---|---|---|---|
| (kpc) | |||
| This paper | Photometric | B stars | |
| Georgelin et al. (1973)aaH interferometric kinematic distance for the H II region. | Kinematic | H velocities | |
| Georgelin et al. (1973) | Photometric | B stars , H | 2.4 |
| Vogt & Moffat (1975)bbDerived a mean extinction of 1.17 mag. | Photometric | B stars | 2.2 |
| Fich & Blitz (1984) | Kinematic | CO velocities | |
| Oka et al. (1999) | Kinematic | CO velocities |
| IHaaIH number unless previously identified by Herbig (1957). | bbOptical photometry from the LFC, unless otherwise noted. | bbOptical photometry from the LFC, unless otherwise noted. | bbOptical photometry from the LFC, unless otherwise noted. | ccNear-infrared photometry from the 2MASS Point Source Catalog. | ccNear-infrared photometry from the 2MASS Point Source Catalog. | ccNear-infrared photometry from the 2MASS Point Source Catalog. | W(H) 1990ddEM: emission detected, but not measurable because of faint continuum, overlapping spectra, etc.; ND: emission not detected; ellipsis: not within survey field. | W(H) 2003ddEM: emission detected, but not measurable because of faint continuum, overlapping spectra, etc.; ND: emission not detected; ellipsis: not within survey field. | W(H) 2009ddEM: emission detected, but not measurable because of faint continuum, overlapping spectra, etc.; ND: emission not detected; ellipsis: not within survey field. | Comments | ||
|---|---|---|---|---|---|---|---|---|---|---|---|---|
| (J2000) | (J2000) | (Å) | (Å) | (Å) | ||||||||
| 686 | 18 08 55.18 | 23 47 05.4 | … | … | … | 1.19 | 0.41 | 11.64 | … | … | 105: | |
| 687 | 18 08 58.47 | 23 44 59.7 | … | … | … | 1.02 | 0.62 | 11.73 | … | … | 13 | |
| 688 | 18 09 00.03 | 23 24 15.2 | … | … | … | 1.02 | 0.57 | 10.97 | … | … | 5 | |
| 689 | 18 09 02.26 | 23 28 32.8 | … | … | … | 0.99 | 0.47 | 11.82 | … | … | 38 | |
| 690 | 18 09 08.75 | 23 26 47.3 | … | … | … | 0.96 | 0.58 | 11.31 | … | … | 7 | |
| 691 | 18 09 09.10 | 23 26 45.1 | … | … | … | 0.82 | 0.44 | 9.06 | … | … | 2 | |
| 692 | 18 09 10.18 | 23 26 51.6 | … | … | … | 0.79 | 0.23 | 11.40 | … | … | EM | |
| 693 | 18 09 10.43 | 23 25 39.3 | … | … | … | 0.92 | 0.25 | 12.12 | … | … | 7: | |
| 694 | 18 09 11.09 | 23 28 49.6 | … | … | … | 1.24 | 0.45 | 11.74 | … | … | 43 | |
| 695 | 18 09 16.08 | 23 39 59.4 | 16.40 | 0.88 | 1.91 | 0.77 | 0.25 | 12.07 | 2 | ND | 2 | |
| 696 | 18 09 18.17 | 23 34 37.7 | 16.87 | 0.95 | 2.09 | 0.81 | 0.25 | 12.38 | … | … | 5: | |
| 697 | 18 09 21.94 | 23 27 53.3 | … | … | … | 1.08 | 0.43 | 11.99 | … | … | 8: | |
| … | 18 09 23.61 | 23 27 47.9 | 14.70ee-band magnitude from the literature. | … | … | 1.17 | 0.87 | 9.34 | … | … | 168 | LkH 126 |
| 698 | 18 09 26.04 | 23 31 46.1 | 16.88 | 0.68 | 1.47 | 0.66 | … | … | … | … | 83 | |
| 699 | 18 09 26.20 | 23 30 09.0 | 19.95 | 1.26 | 2.90 | 1.28 | 0.75 | 12.74 | … | … | 17: | |
| 700 | 18 09 26.27 | 23 30 16.9 | 19.50 | 1.17 | 2.76 | 1.11 | 0.45 | 12.92 | … | … | 29: | X-ray source 17 |
| 701 | 18 09 26.38 | 23 40 01.4 | 18.06 | 1.06 | 2.13 | 1.13 | 0.18 | 12.91 | … | 14 | 12 | |
| 702 | 18 09 26.41 | 23 39 47.8 | 20.50 | 1.37 | 3.05 | … | … | … | … | 37: | ND | |
| 703 | 18 09 26.68 | 23 46 01.4 | 18.27 | 1.22 | 2.67 | 0.88 | 0.34 | 12.36 | … | … | 36: | |
| 704 | 18 09 27.64 | 23 30 00.8 | 18.29 | 1.08 | 2.36 | 1.02 | 0.44 | 12.66 | … | … | 9: | |
| 705 | 18 09 30.62 | 23 36 38.5 | 16.13 | 0.85 | 1.81 | 0.92 | 0.59 | 11.41 | … | 14 | 28 | |
| … | 18 09 35.72 | 23 25 19.9 | 11.81fffootnotemark: | … | … | 0.17 | 0.12 | 10.80 | … | … | 17 | LkH 127 |
| 706 | 18 09 42.93 | 23 42 17.0 | 18.29 | 0.97 | 2.11 | 0.96 | 0.69 | 12.94 | 55 | 67 | 54 | |
| 707 | 18 09 43.22 | 23 38 21.9 | 18.96 | 1.11 | 2.45 | 1.01 | 0.68 | 12.81 | 19 | 52 | 44 | |
| 708 | 18 09 44.31 | 23 40 10.4 | 19.37 | 1.30 | 3.06 | 1.04 | 0.53 | 12.80 | 86: | 96: | 36 | |
| … | 18 09 45.53 | 23 38 04.1 | 17.36 | 1.13 | 2.44 | 1.05 | 0.66 | 11.41 | 71 | 106 | 80 | LkH 128 |
| 709 | 18 09 45.64 | 23 41 07.1 | 18.73 | 1.14 | 2.54 | 1.12 | 0.53 | 12.73 | 36: | 43 | 86 | |
| 710 | 18 09 45.98 | 23 37 54.9 | 17.81 | 1.03 | 2.31 | 1.18 | 0.74 | 12.08 | 21 | 33 | ND | |
| … | 18 09 46.16 | 23 38 52.4 | 16.20 | 0.85 | 1.88 | 0.88 | 0.64 | 11.29 | 30 | 24 | 28 | LkH 129 |
| … | 18 09 46.62 | 23 38 55.1 | 16.45 | 0.83 | 2.08 | 1.00 | 0.57 | 11.09 | 45 | 64 | 39 | LkH 130 |
| 711 | 18 09 47.29 | 23 38 41.6 | 15.87 | 0.84 | 1.84 | 0.90 | 0.53 | 11.00 | EM | EM | EM | |
| 712 | 18 09 47.36 | 23 39 16.2 | 18.86 | 1.03 | 2.32 | 1.24 | … | … | EM | EM | 30 | |
| 713 | 18 09 47.75 | 23 39 24.5 | 17.83 | 1.05 | 2.40 | … | … | … | EM | EM | 3 | |
| 714 | 18 09 47.56 | 23 38 33.4 | 19.84 | 0.87 | 2.40 | 1.13 | 0.62 | 13.06 | EM | EM | 77: | |
| 715 | 18 09 47.84 | 23 41 09.6 | 17.62 | 0.90 | 1.88 | 1.12 | 0.54 | 12.23 | EM | 33 | 18 | |
| 716 | 18 09 48.03 | 23 38 53.1 | 18.23 | 1.07 | 2.26 | 0.91 | 0.30 | 13.25 | ND | 6 | ND | |
| 717 | 18 09 48.16 | 23 39 05.7 | 19.25 | 1.37 | 2.84 | 1.21 | 0.63 | 12.77 | EM | 64 | 119: | |
| 718 | 18 09 48.45 | 23 39 12.3 | 15.09 | 0.88 | 1.92 | 1.00 | 0.55 | 10.27 | 4 | 8 | 7 | |
| 719 | 18 09 48.47 | 23 38 18.2 | 21.02 | 1.79 | 3.66 | 0.96 | 0.48 | 13.56 | EM | 189: | 113: | |
| 720 | 18 09 48.54 | 23 39 14.3 | 16.57 | 0.52 | 1.89 | … | … | … | EM | 52 | 60: | |
| 721 | 18 09 48.50 | 23 40 23.0 | 19.71 | 0.99 | 2.38 | … | 0.58 | 13.48 | EM | 29: | 29: | |
| 722 | 18 09 49.02 | 23 36 14.2 | 18.00 | 0.93 | 1.88 | 0.98 | 0.52 | 13.34 | ND | 6 | ND | |
| 723 | 18 09 49.03 | 23 38 16.4 | 15.59 | 0.90 | 1.94 | 0.82 | 0.37 | 11.02 | 2 | 3 | 3 | |
| 724 | 18 09 49.04 | 23 38 53.4 | 18.13 | 1.10 | 2.65 | 1.08 | 0.64 | 11.70 | 39: | 50 | 58 | |
| 725 | 18 09 49.24 | 23 41 25.2 | 19.41 | 1.30 | 2.86 | 1.10 | 0.42 | 12.67 | EM | 28: | 24 | |
| 726 | 18 09 49.51 | 23 37 07.8 | 17.50 | 1.01 | 2.21 | 0.93 | 0.35 | 12.27 | ND | 8 | 6 | |
| 727 | 18 09 49.57 | 23 38 36.6 | 20.40 | 1.40 | 2.81 | 0.98 | 0.83 | 13.49 | EM | 31: | 45: | |
| 728 | 18 09 49.68 | 23 45 55.2 | 18.67 | 1.13 | 2.45 | 0.95 | 0.39 | 13.26 | … | 25 | EM | |
| 729 | 18 09 50.36 | 23 38 23.0 | 19.20 | 1.29 | 2.95 | 1.00 | 0.54 | 12.80 | EM | 21: | 42: | |
| 730 | 18 09 50.41 | 23 40 03.4 | 17.74 | 0.91 | 2.24 | 1.13 | 0.54 | 12.46 | 25 | 28 | 22 | |
| 731 | 18 09 50.98 | 23 43 11.5 | 18.97 | 1.20 | 2.72 | 0.95 | 0.39 | 13.12 | … | 84 | 94 | |
| 732 | 18 09 51.10 | 23 39 45.2 | 17.65 | 1.07 | 2.47 | 0.90 | 0.37 | 12.14 | 14 | 17 | 23 | |
| 733 | 18 09 51.32 | 23 40 43.7 | 16.46 | 0.96 | 2.12 | 0.92 | 0.51 | 11.31 | 10 | 9 | 7 | X-ray source 8 |
| 734 | 18 09 51.82 | 23 40 10.7 | 19.91 | 1.28 | 3.32 | 0.97 | 0.26 | 13.19 | ND | 49 | EM? | |
| 735 | 18 09 52.02 | 23 39 05.5 | 17.00 | 0.93 | 2.05 | 1.01 | 0.38 | 11.91 | 14 | 13 | 12 | |
| 736 | 18 09 53.45 | 23 37 33.0 | 19.40 | 1.47 | 3.21 | 1.23 | 0.90 | 11.02 | EM | 23: | EM? | |
| 737 | 18 09 54.92 | 23 40 18.0 | 16.02 | 0.87 | 2.05 | 0.80 | 0.34 | 11.10 | 2: | 4 | 4 | X-ray source 4 |
| 738 | 18 09 54.99 | 23 40 15.3 | 17.67 | 1.05 | 2.47 | … | … | … | ND | 5: | 8: | |
| 739 | 18 09 55.09 | 23 40 26.9 | 20.15 | 1.37 | 3.31 | 0.91 | 0.54 | 12.96 | EM | 47: | 88: | |
| 740 | 18 09 55.09 | 23 34 34.4 | 18.86 | 1.17 | 2.61 | 1.12 | 0.67 | 12.72 | … | 14 | EM | |
| 741 | 18 09 55.71 | 23 39 57.6 | 19.88 | 1.30 | 3.11 | … | 0.55 | 12.96 | EM | 16: | 10 | |
| 742 | 18 09 55.86 | 23 34 35.7 | 19.97 | 1.29 | 2.79 | … | … | … | … | 4: | ND | |
| 743 | 18 09 57.10 | 23 31 15.7 | … | … | … | … | … | … | … | … | 22 | |
| 744 | 18 09 57.67 | 23 40 01.2 | 18.51 | 1.31 | 3.05 | 1.06 | 0.55 | 11.79 | 34 | 21 | 26 | X-ray source 21 |
| 745 | 18 09 58.38 | 23 39 15.4 | 20.06 | 1.39 | 3.28 | 0.97 | 0.48 | 13.26 | ND | 98 | 37 | |
| 746 | 18 09 59.28 | 23 37 33.8 | 21.06 | 1.54 | 3.56 | 1.66 | 1.08 | 11.36 | ND | 33: | EM | |
| 747 | 18 09 59.61 | 23 37 29.3 | 16.95 | 1.05 | 2.36 | 1.10 | 0.71 | 11.00 | 69 | 68 | 77 | |
| 748 | 18 10 03.33 | 23 27 47.8 | … | … | … | 1.75 | 0.89 | 8.152 | … | … | 190: | |
| 749 | 18 10 02.13 | 23 47 48.8 | 18.22 | 1.00 | 2.30 | … | 0.80 | 10.67 | … | … | 14: | |
| 750 | 18 10 04.51 | 23 39 04.5 | 18.08 | 1.04 | 2.25 | 1.10 | 0.73 | 12.11 | … | 16 | 52 | |
| 751 | 18 10 11.36 | 23 45 06.2 | 16.26 | 0.85 | 1.90 | 0.89 | 0.56 | 11.47 | … | 2 | ND | |
| 752 | 18 10 11.63 | 23 45 37.1 | 20.31 | 1.39 | 2.90 | 1.10 | 0.58 | 13.37 | … | 17 | EM | |
| 753 | 18 10 13.93 | 23 50 19.0 | 17.26 | 0.92 | 2.26 | 0.97 | 0.47 | 11.99 | … | … | 27 | |
| 754 | 18 10 15.80 | 23 43 55.4 | 18.04 | 1.05 | 2.34 | 0.98 | 0.53 | 12.31 | … | 12 | 10 | |
| 755 | 18 10 16.00 | 23 46 01.2 | 17.98 | 0.99 | 2.32 | 0.87 | 0.48 | 12.64 | … | 34 | 30 | |
| 756 | 18 10 22.21 | 23 51 07.8 | … | … | … | 1.59 | 0.70 | 9.86 | … | … | 328: | |
| 757 | 18 10 22.93 | 23 51 21.3 | … | … | … | … | … | … | … | … | 30 | |
| 758 | 18 10 26.37 | 23 50 52.0 | … | … | … | 1.23 | 0.46 | 9.77 | … | … | 8 | |
| 759 | 18 10 28.33 | 23 49 41.1 | … | … | … | 1.10 | 1.01 | 12.95 | … | … | 30 | |
| 760 | 18 10 30.03 | 23 49 58.2 | … | … | … | 1.01 | 0.76 | 11.05 | … | … | 42 | |
| 761 | 18 10 36.35 | 23 49 43.0 | … | … | … | 1.16 | 0.61 | 12.81 | … | … | 44 | |
| 762 | 18 10 43.71 | 23 51 55.5 | … | … | … | 0.74 | … | … | … | … | 146: |
| Source | Comments | ||||||||
|---|---|---|---|---|---|---|---|---|---|
| (J2000) | (J2000) | ||||||||
| 1 | 18 09 46.74 | 23 38 44.7 | 8.59 | 0.18 | 0.27 | 0.17 | 0.02 | 8.03 | HD 166033aaOptical photometry from Herbst et al. (1982). |
| 2 | 18 10 00.44 | 23 37 25.9 | 17.97 | 0.93 | 1.91 | 0.71 | 0.17 | 13.76 | |
| 3 | 18 09 51.62 | 23 36 51.4 | 9.89 | 0.28 | 0.50 | 0.08 | 0.07 | 9.05 | HD 314031aaOptical photometry from Herbst et al. (1982). |
| 4 | 18 08 54.92 | 23 40 18.0 | 16.02 | 0.87 | 2.05 | 0.80 | 0.34 | 11.10 | IH-737 |
| 5 | 18 09 50.27 | 23 32 24.6 | 21.47 | 1.86 | 3.99 | 1.30 | 0.52 | 12.62 | -ray source(?) |
| 6 | 18 09 53.89 | 23 38 51.4 | 17.19 | 0.99 | 2.27 | 0.54 | 0.22 | 12.17 | |
| 7 | 18 09 55.37 | 23 39 54.2 | … | … | … | 0.75 | 0.27 | 10.19 | |
| 8 | 18 09 51.32 | 23 40 43.7 | 16.46 | 0.96 | 2.12 | 0.92 | 0.51 | 11.31 | IH-733 |
| 9bbOutside of LFC field of view. | 18 09 49.46 | 23 25 13.2 | … | … | … | 1.07 | 0.89 | 10.81 | |
| 10 | 18 09 59.28 | 23 41 14.4 | … | … | … | 1.78 | 0.92 | 13.77 | Embedded in L227 |
| 11 | 18 10 06.41 | 23 34 56.1 | 16.11 | 0.70 | 1.45 | 0.59 | 0.13 | 12.89 | |
| 12 | 18 09 46.35 | 23 40 51.5 | 9.16 | 0.18 | 0.28 | 0.02 | 0.04 | 8.77 | CoD 13997aaOptical photometry from Herbst et al. (1982). |
| 13 | 18 09 48.56 | 23 39 21.1 | 9.96 | 0.30 | 0.53 | 0.11 | 0.11 | 8.95 | HD 314032aaOptical photometry from Herbst et al. (1982). |
| 14 | 18 10 00.8 | 23 27 56 | 21.64 | 1.18 | 2.67 | … | … | … | |
| 15 | 18 09 54.2 | 23 36 05 | … | … | … | … | … | … | No optical or 2MASS counterpart |
| 16 | 18 10 00.80 | 23 38 32.4 | 17.42 | 1.20 | 2.71 | 1.06 | 0.47 | 10.84 | |
| 17 | 18 09 26.27 | 23 30 16.9 | 19.47 | 1.29 | 2.77 | 1.11 | 0.45 | 12.92 | IH-700 |
| 18 | 18 09 51.90 | 23 38 11.6 | 16.54 | 0.94 | 2.01 | 0.87 | 0.26 | 12.01 | |
| 19 | 18 09 51.46 | 23 40 09.0 | 16.66 | 0.91 | 1.97 | 1.06 | 0.70 | 11.44 | |
| 20bbOutside of LFC field of view. | 18 10 52.5 | 23 37 13 | … | … | … | … | … | … | No 2MASS counterpart |
| 21 | 18 09 57.56 | 23 40 01.2 | 18.51 | 1.31 | 3.05 | 1.06 | 0.55 | 11.79 | IH-744 |
| IH | Sp TypeaaPredicted stellar properties from the models of Siess et al. (2000) for an assumed distance of 1.82 kpc and an average extinction of =1.21 mag. | aaPredicted stellar properties from the models of Siess et al. (2000) for an assumed distance of 1.82 kpc and an average extinction of =1.21 mag. | aaPredicted stellar properties from the models of Siess et al. (2000) for an assumed distance of 1.82 kpc and an average extinction of =1.21 mag. | TeffaaPredicted stellar properties from the models of Siess et al. (2000) for an assumed distance of 1.82 kpc and an average extinction of =1.21 mag. | MassaaPredicted stellar properties from the models of Siess et al. (2000) for an assumed distance of 1.82 kpc and an average extinction of =1.21 mag. | log (Age)aaPredicted stellar properties from the models of Siess et al. (2000) for an assumed distance of 1.82 kpc and an average extinction of =1.21 mag. |
|---|---|---|---|---|---|---|
| () | () | (K) | () | (yr) | ||
| 695 | K5 | 4.46 | 3.77 | 4272 | 1.02 | 5.71 |
| 696 | K6 | 3.78 | 3.62 | 4096 | 0.79 | 5.67 |
| 699 | K1 | 2.05 | 1.82 | 4986 | 1.55 | 6.84 |
| 700 | M2 | 0.54 | 1.88 | 3484 | 0.35 | 6.11 |
| 701 | M2 | 6.30 | 2.11 | 3443 | 0.34 | 6.06 |
| 702 | K7 | 1.20 | 2.17 | 4056 | 0.74 | 6.16 |
| 703 | M3 | 3.68 | 1.59 | 3454 | 0.34 | 6.22 |
| 704 | M2 | 1.96 | 3.57 | 3569 | 0.39 | 5.00 |
| 705 | M0 | 1.28 | 2.46 | 3797 | 0.52 | 5.90 |
| 706 | K4 | 5.30 | 3.79 | 4385 | 1.24 | 5.74 |
| 708 | K6 | 0.95 | 1.79 | 4077 | 0.77 | 6.29 |
| 709 | M0 | 0.77 | 1.95 | 3732 | 0.48 | 6.06 |
| 710 | M3 | 1.04 | 3.06 | 3310 | 0.28 | 5.03 |
| 711 | K5 | 6.95 | 4.37 | 4340 | 1.22 | 5.60 |
| 712 | M0 | 0.72 | 1.85 | 3826 | 0.55 | 6.16 |
| 713 | M0 | 2.05 | 3.16 | 3768 | 0.50 | 5.76 |
| 714 | M0 | 3.32 | 4.07 | 3739 | 0.49 | 4.85 |
| 715 | M1 | 1.06 | 2.41 | 3667 | 0.44 | 5.93 |
| 716 | M0 | 1.79 | 2.88 | 3833 | 0.54 | 5.81 |
| 717 | K5 | 5.19 | 4.04 | 4301 | 1.10 | 5.67 |
| 718 | K6 | 5.15 | 4.23 | 4106 | 0.82 | 5.58 |
| 721 | M4 | 0.46 | 2.46 | 2985 | 0.19 | 5.15 |
| 722 | K5 | 3.75 | 3.27 | 4291 | 1.05 | 5.79 |
| 723 | M0 | 0.35 | 1.32 | 3782 | 0.52 | 6.51 |
| 724 | K5 | 1.00 | 1.72 | 4301 | 1.06 | 6.53 |
| 725 | K5 | 9.65 | 5.59 | 4171 | 1.01 | 5.44 |
| 726 | M0 | 0.32 | 1.20 | 3768 | 0.51 | 6.55 |
| 727 | M2 | 0.82 | 2.31 | 3510 | 0.36 | 5.97 |
| 728 | K7 | 2.21 | 2.80 | 3950 | 0.63 | 5.82 |
| 729 | M2 | 0.31 | 1.41 | 3536 | 0.37 | 6.34 |
| 730 | M1 | 1.07 | 2.37 | 3699 | 0.46 | 5.94 |
| 731 | M2 | 1.12 | 2.78 | 3474 | 0.35 | 5.71 |
| 732 | K7 | 1.82 | 2.62 | 3924 | 0.61 | 5.84 |
| 733 | M2 | 1.06 | 2.58 | 3558 | 0.38 | 5.91 |
| 734 | M1 | 2.64 | 3.70 | 3718 | 0.47 | 5.13 |
| 735 | K7 | 5.25 | 4.38 | 4056 | 0.77 | 5.57 |
| 736 | M3 | 0.88 | 2.64 | 3381 | 0.31 | 5.64 |
| 737 | K6 | 2.92 | 3.27 | 4135 | 0.82 | 5.76 |
| 738 | M3 | 1.23 | 3.18 | 3410 | 0.32 | 5.07 |
| 739 | K6 | 7.21 | 4.92 | 4135 | 0.91 | 5.50 |
| 740 | M1 | 2.59 | 3.70 | 3718 | 0.47 | 5.18 |
| 741 | M3 | 0.71 | 2.34 | 3378 | 0.31 | 5.99 |
| 742 | M1 | 1.02 | 2.43 | 3623 | 0.42 | 5.94 |
| 743 | M3 | 0.71 | 2.27 | 3435 | 0.33 | 6.01 |
| 744 | M2 | 0.40 | 1.55 | 3573 | 0.39 | 6.24 |
| 746 | M3 | 2.30 | 4.11 | 3454 | 0.34 | 4.58 |
| 747 | M3 | 0.38 | 1.71 | 3391 | 0.31 | 6.19 |
| 748 | M4 | 0.39 | 2.18 | 3040 | 0.20 | 5.37 |
| 749 | M0 | 4.40 | 5.00 | 3797 | 0.55 | 4.73 |
| 751 | M0 | 1.27 | 2.42 | 3840 | 0.55 | 5.92 |
| 752 | K7 | 1.35 | 2.39 | 3898 | 0.59 | 5.93 |
| 753 | K5 | 5.08 | 4.04 | 4282 | 1.07 | 5.66 |
| 754 | M2 | 0.37 | 1.54 | 3503 | 0.36 | 6.24 |
| 755 | K7 | 3.00 | 3.64 | 3859 | 0.57 | 5.66 |
| 756 | M0 | 1.61 | 2.78 | 3797 | 0.52 | 5.83 |
| 757 | K7 | 1.41 | 2.21 | 3963 | 0.65 | 6.00 |
| Source | Sp TypeaaPredicted stellar properties from the models of Siess et al. (2000) for an assumed distance of 1.82 kpc and an average extinction of =1.21 mag. | aaPredicted stellar properties from the models of Siess et al. (2000) for an assumed distance of 1.82 kpc and an average extinction of =1.21 mag. | aaPredicted stellar properties from the models of Siess et al. (2000) for an assumed distance of 1.82 kpc and an average extinction of =1.21 mag. | aaPredicted stellar properties from the models of Siess et al. (2000) for an assumed distance of 1.82 kpc and an average extinction of =1.21 mag. | MassaaPredicted stellar properties from the models of Siess et al. (2000) for an assumed distance of 1.82 kpc and an average extinction of =1.21 mag. | log (Age)aaPredicted stellar properties from the models of Siess et al. (2000) for an assumed distance of 1.82 kpc and an average extinction of =1.21 mag. |
|---|---|---|---|---|---|---|
| () | () | (K) | () | (yr) | ||
| 17 | M2 | 0.68 | 2.07 | 3558 | 0.39 | 6.04 |
| 19 | K5 | 3.68 | 3.40 | 4213 | 0.93 | 5.74 |
| 18 | K6 | 4.28 | 3.60 | 4173 | 0.90 | 5.65 |
| 6 | M0 | 3.21 | 3.82 | 3840 | 0.56 | 5.57 |
| 2 | K5 | 1.05 | 1.90 | 4270 | 1.01 | 6.46 |
| 14 | M1 | 0.083 | 0.70 | 3591 | 0.37 | 7.09 |
| 16 | M2 | 4.24 | 4.95 | 3572 | 0.40 | 4.28 |
| 11 | K1 | 4.11 | 2.55 | 5033 | 1.97 | 6.54 |
| 5 | M5 | 0.49 | 2.20 | 3212 | 0.25 | 5.44 |
| Star | Radial Velocity | UT Date |
|---|---|---|
| (km s | ||
| CoD23 13997 | +12. 3. | 2010 Jun 4 |
| HD 166033 | 4. 1. | 1997 Aug 12 |
| +6. 1. | 1998 Oct 31 | |
| +26. 1. | 2010 Jun 4 | |
| HD 314031 | +2. 1. | 1998 Oct 31 |
| +8. 2. | 2010 Jun 4 | |
| HD 314032 | +3. 2. | 2010 Jun 4 |
| Source | aaRectangular coordinates of the point with respect to HD 166033 in arcsec. | aaRectangular coordinates of the point with respect to HD 166033 in arcsec. | bbDiagonal distance from HD 166033 in arcsec. | [S II] 6717:6730 | ||
|---|---|---|---|---|---|---|
| (arcsec) | ccHeliocentric velocity at the point, from the [S II] emission lines. | RatioddIntensity ratio of 6717/6730 at the point. | ||||
| (km s-1) | ||||||
| T1 | 16 | +41 | 44 | 5. | 1.38 | |
| T2 | +28 | 103 | 107 | 5. | 1.39 | |
| T3 | +96 | 7 | 99 | 3. | 1.39 | |
| 166033 | 0 | 0 | 0 | 10, 1 | ||
| 23.13997 | 4 | 126 | 126 | 5. | 1.37 | |
| 314032 | +27 | 36 | 45 | 7. | 1.38 | |
| 314031 | +68 | +114 | 133 | 4. | 1.39 | |