The Assembly of the Red Sequence at : The Color and Spectral Properties of Galaxies in the Cl1604 Supercluster
Abstract
We investigate the properties of the 525 spectroscopically confirmed members of the Cl1604 supercluster at as part of the Observations of Redshift Evolution in Large Scale Environments (ORELSE) survey. In particular, we focus on the photometric, stellar mass, morphological, and spectral properties of the 305 member galaxies of the eight clusters and groups that comprise the Cl1604 supercluster. Using an extensive Keck LRIS/DEIMOS spectroscopic database in conjunction with ten-band ground-based, Spitzer, and Hubble Space Telescope imaging, we investigate the buildup of the red sequence in groups and clusters at high redshift. Nearly all of the brightest and most massive red-sequence galaxies present in the supercluster environment are found to lie within the bounds of the cluster and group systems, with a surprisingly large number of such galaxies present in low-mass group systems. Despite the prevalence of these red-sequence galaxies, we find that the average cluster galaxy has a spectrum indicative of a star-forming galaxy, with a star formation rate between those of field galaxies and moderate redshift cluster galaxies. The average group galaxy is even more active, exhibiting spectral properties indicative of a starburst. The presence of massive, red galaxies and the high fraction of starbursting galaxies present in the group environment suggest that significant processing is occurring in group environments at and earlier. There is a deficit of low-luminosity red-sequence galaxies in all Cl1604 clusters and groups, suggesting that such galaxies transition to the red sequence at later times. Extremely massive ( ) red-sequence galaxies routinely observed in rich clusters at are also absent from the Cl1604 clusters and groups. We suggest that such galaxies form at later times through merging processes. There are significant populations of transition galaxies at intermediate stellar masses [-] present in the group and cluster environments, suggesting that this range is important for the buildup of the red-sequence mass function at . Through a comparison of the transitional populations present in the Cl1604 cluster and group systems, we find evidence that massive blue cloud galaxies are quenched earliest in the most dynamically relaxed systems and at progressively later times in dynamically unrelaxed systems.
Subject headings:
galaxies: evolution — galaxies: formation — galaxies: clusters: general — galaxies: groups: general — techniques: spectroscopic — techniques: photometric1. Introduction
In the local universe, the Sloan Digital Sky Survey (SDSS) has greatly enhanced our understanding of galaxy properties. Studies of SDSS data have revealed insights into the nature of star formation and quenching (e.g., Goto et al. 2003; Brinchmann et al. 2004; Kauffmann et al. 2004), properties of clusters and their member galaxies (e.g, Gómez et al. 2003; Hansen et al. 2009; von der Linden et al. 2010), relationships between fundamental observable quantities (e.g., Bernardi et al. 2003; Tremonti et al. 2004; Blanton et al. 2005, La Barbera et al. 2010), and the properties of active galactic nuclei (AGNs) and their host galaxies (e.g., Kauffmann et al. 2003; Kewley et al. 2006; Yan et al. 2006). Such studies, however, are, by themselves, of limited use in the context of galaxy evolution as they provide only a snapshot of the result of galaxy processing over a Hubble time. It is only by comparing such galaxies to those at higher redshifts that galaxy evolution can be fully investigated.
At high redshifts, there exist several surveys (e.g., zCOSMOS, DEEP2, VVDS) that contain both large samples of UV/optical spectra necessary to characterize star-formation activity, stellar ages, and metallicities and the high-resolution multiwavelength data necessary to characterize morphologies, AGN contributions, and stellar masses. These surveys have been instrumental in probing the nature of galaxy evolution both in the field and intermediate-density regimes (e.g., Ilbert et al. 2005; Cooper et al. 2006, 2007, 2008; Faber et al. 2007; Pérez-Montero et al. 2009; Cucciati et al. 2010). By comparing the evolution of fundamental relationships, such as, e.g., mass-metallicity, morphology/colordensity, and star formation rate (SFR)density, between and the present day, a picture of galaxy evolution in such environments has begun to emerge. The number density of star-forming, blue late-type galaxies in group environments decreases significantly from to , with a corresponding rise in the number density of red, quiescent early-type galaxies (ETGs; Poggianti et al. 2008; Balogh et al. 2009; Tasca et al. 2009; Wilman et al. 2009; McGee et al. 2011). Similarly, the red/early-type fraction correlates weakly with local density at , with red galaxies only slightly preferring overdense environments. At lower redshifts this correlation becomes stronger; the fraction of red galaxies in low-mass group environments increases significantly from to lower redshifts, while remaining essentially unchanged in field environments (e.g., Cooper et al. 2007). These results suggest that the highest density environments present in such surveys (i.e., low-mass groups) play the most prominent role in this picture.
However, the limited range of environments present in such surveys limits the conclusions that can be drawn from these data. Due to the scarcity of massive galaxy associations, these surveys contain limited information on intermediate-density (i.e., rich group) and high-density (i.e., cluster) environments. This is problematic for galaxy evolution studies, as it has long been known (Butcher & Oemler 1984) that such environments are instrumental in the transformation of galaxies. In the last half decade, surveys of higher redshift clusters extending to several times the virial radius at 0.5 (e.g., Treu et al. 2003; Dressler et al. 2004; Poggianti et al. 2006; Ma et al. 2008, 2010; Oemler et al. 2009) and the innermost cores of clusters at (e.g., Postman et al. 2005) seem to support this claim, as galaxies in rich groups and clusters show strong differential evolution relative to the field over the last Gyr.
The lack of comprehensive data sets of cluster galaxies at the same redshift range as these surveys means that the processes responsible for driving this evolution in galaxy clusters and high mass groups are still not well understood. This is partly due to the sheer number of processes that galaxies are subjected to in high-density environments that are either not present or less effective in the field (e.g., ram-pressure stripping, harassment, strangulation, tidally induced merging, and tidal stripping). The overlapping spheres of influence of each effect and the requirement of high signal-to-noise ratio (S/N) spectral data necessary to precisely quantify star formation histories (SFHs), separate from the effects of stellar mass and metallicity, make disentangling these processes both extremely complicated and observationally expensive. Though several studies have attempted such analyses, there is significant disagreement as to the primary mechanism responsible for driving galaxy evolution in cluster environments (see, e.g., the literature review in Oemler et al. 2009). This disagreement is likely due, at least in part, to the spread in global properties of cluster galaxy populations, as well as the varying galaxy selection functions for each study and the clustocentric radius to which they extend. Furthermore, as discussed extensively in Moran et al. (2007), the dominant mechanism responsible for galaxy transformation in the cluster environment is likely to vary from cluster to cluster. Processes like ram-pressure stripping will be more effective in virialized, massive clusters, while merging and low-velocity tidal interactions should be more prevalent in lower mass systems. As such, in order to gain a comprehensive picture of galaxy evolution in these environments from to the present day, it is necessary to study the galaxy populations of high-redshift clusters that encompass a wide range of both dynamical states and masses.
One manifestation of cluster-specific evolution is the cluster red sequence. At lower redshifts, massive virialized galaxy clusters are marked by a tight sequence of red galaxies observed in colormagnitude space (e.g., Bower et al. 1992; van Dokkum et al. 1998; Terlevich et al. 2001; López-Cruz et al. 2004; Haines et al. 2006). At higher redshift, clusters observed to be dynamically young and X-ray underluminous show increasing scatter in their red sequences as well as a significant deficit of low-luminosity red-sequence galaxies (RSGs; e.g., De Lucia et al. 2004, Homeier et al. 2006a; Mei et al. 2009), a clear sign that the red sequence is still being assembled. The question of which primary mechanism is responsible for building up the red sequence, a question intimately related to the transformation of blue late-type galaxies into quiescent ETGs, is, however, still not settled (e.g., Faber et al. 2007). Standard galaxy scenarios predict the bulk of star formation to occur in brightest cluster galaxies (BCGs) primarily at , with fainter luminosity red-sequence members forming the bulk of their stars at progressively later epochs. Thus, by studying galaxy clusters at , only 4 Gyr after the nominal formation epoch of BCGs, it is possible to observe clusters in their early stages of assembly.
This paper is the first in a series studying the spectral, color, and morphological properties of galaxy clusters and high- to intermediate-mass groups at . In this paper we present the Hubble Space Telescope (HST) Advanced Camera for Surveys (ACS) magnitude, color, and morphological properties as well as the composite Keck I/II Low-Resolution Imaging Spectrometer (LRIS; Oke et al. 1995) and DEep Imaging Multi-Object Spectrograph (DEIMOS; Faber et al. 2003) spectral properties of the 525 spectroscopically confirmed members of the Cl1604 supercluster at . In addition, we present stellar masses of the galaxy populations that comprise the eight groups and clusters of the Cl1604 supercluster. These stellar masses are used to investigate the buildup of the red sequence in these structures independent of star-formation effects, as even small amounts of star formation can significantly alter galaxy magnitudes (Bruzual 2007). In future papers we will extend this work to investigate the SFRdensity and morphology/colordensity relationships of Cl1604 galaxies as well as galaxy populations of other large scale structures as part of the Observations of Redshift Evolution in Large Scale Environments (ORELSE) survey (Lubin et al. 2009, hereafter L09). The virtues of the current observational data sets in the ORELSE fields include multiwavelength imaging and spectroscopy across large areas, extending to several virial radii in most fields, and uniform field-to-field selection functions used to target galaxies for spectroscopy. In addition, the ORELSE structures span a large range in mass, X-ray/optical properties, richness, and dynamical states allowing investigations of galaxy evolution over a variety of different regimes at high-redshift.
The paper is organized as follows. §2 presents the observation and reduction of our optical and near-infrared (NIR) imaging and spectral data, §3 presents the data analysis, §4 presents our results, §5 discusses the implication of our results, and §6 presents our conclusions. Throughout this paper we adopt a concordance CDM cosmology, with = 70 km s-1 Mpc-1, =0.27, and =0.73. All equivalent width (EW) measurements are presented in the rest frame. We adopt the convention that negative EWs are used for features observed in emission and positive EWs for those in absorption. All magnitudes are given in the AB system (Oke & Gunn 1983; Fukugita et al. 1996).
2. Observations and Reduction
The Cl1604 supercluster was observed as part of the ORELSE survey (L09). The environments present within the Cl1604 supercluster span from rich ( km s-1), virialized clusters dominated by red, ETGs and a hot intracluster medium, to moderate mass (300-500 km s-1) groups and sparse chains of galaxies dominated by starbursts and luminous AGN (Gal et al. 2008; Kocevski et al. 2009b; 2011a). This structure and some of the associated data have been described in great detail in other papers (Gal & Lubin 2004; Gal et al. 2008; Kocevski et al. 2009a, 2009b, 2011a, 2011b; Lemaux et al. 2009, 2010). In the following section we review all data obtained on the Cl1604 supercluster to date, including new data that has not been previously presented.
2.1. Optical and Near-infrared Imaging
Initial wide-field optical imaging of the Cl1604 supercluster was taken with the Large Format Camera (LFC; Simcoe et al. 2000) mounted on the Palomar Hale 5-m telescope. These data were reduced using Image Reduction and Analysis Facility (IRAF; Tody 1993) with a set of publicly available routines. Photometry was performed using Source Extractor (SExtractor; Bertin & Arnouts 1996) and is described in further detail in §3.1.1 and Appendix A. Further details of the observation and reduction are described in Gal et al. (2005, 2008). The LFC images reach 5 point source limiting magnitudes of 25.2, 24.8, & 23.3 mags in the , , and bands, respectively.
Wide-field NIR imaging of the Cl1604 field was obtained with two different sets of observations. Imaging in the band was obtained with the Wide-field InfraRed Camera (WIRC; Wilson et al. 2003) mounted at prime focus on the Palomar Hale 5-m telescope on 2006 August 8th and 9th UTC. Conditions were photometric and seeing ranged from 0.9-1.3 in the band. The WIRC data were processed using a combination of scripts written in IDL and IRAF. All frames were corrected for dark current and flat fielded using dome flats. The sky background in each frame was fit using a third order polynomials in both coordinates and subtracted. Known bad pixels and satellite trails were masked. Astrometry was obtained by fitting to stars from the USNO A2 catalog using the task msccmatch. The dark-corrected, flat-fielded, sky-subtracted, bad-pixel-masked images at each pointing were then median combined using the IRAF task imcombine. A second astrometric correction was applied to the final image in the same manner as for the individual exposures. These data were primarily used to perform our spectral energy density (SED) fitting for the purpose of obtaining stellar masses (see §3.1.2) and reach a 5 point source limiting magnitude of =21.3.
Imaging in the band was also obtained with the Wide-Field Camera (WFCAM; Casali et al. 2007) mounted on the United Kingdom Infrared Telescope (UKIRT) on 2007 April 29-30 UTC in photometric conditions and 0.6-0.7 seeing. These data were processed using the standard UKIRT processing pipeline courtesy of the Cambridge Astronomy Survey Unit111http://casu.ast.cam.ac.uk/surveys-projects/wfcam/technical. These data were used to obtain -band stellar masses when SED fitting was not available or poorly constrained (see §3.1.2). The UKIRT imaging is deeper than the WIRC imaging, reaching a 5 point source limiting magnitude of 22.4, equivalent to a 0.2 cluster elliptical at .
A portion of the Cl1604 field is spanned by a 17 pointing HST ACS (Ford et al. 1998) mosaic. Fifteen of these pointings are single orbit observations in both the F606W and F814W filters, reaching 5 point source limiting magnitudes of 27.2 & 26.8 mags, respectively. Two of the pointings, centered on clusters Cl1604+4304 and Cl1604+4321, are deeper, reaching 5 point source limiting magnitudes of 28.1 & 27.6 mags in F606W & F814W, respectively. Further details on the observation and reduction of these data can be found in Kocevski et al. (2009b).
Deep Spitzer InfraRed Array Camera (IRAC; Fazio et al. 2004)) 3.6/4.5/5.8/8.0 m imaging has also been obtained for the entire Cl1604 field as part of the Spitzer program GO-30455 (PI L. M. Lubin). Data were reduced using the standard Spitzer Science Center reduction pipeline and further processed using a modified version of the SWIRE survey pipeline (Surace et al. 2005). The total exposure time of the mosaic is 1080 s per pixel, which results in 5 point source limiting magnitudes of 24.0, 23.7, 22.2, and 21.9 mags in IRAC channels 1-4, respectively. Additional observations with Spitzer were obtained with the Multiband Imaging Photometer for SIRTF (MIPS; Rieke et al. 2004) at 24m and cover a large fraction of the supercluster field. The effective exposure time of the observations in the area covering the supercluster members is 1200 s per pixel, which results in a 5 point source limiting magnitude of = 19.4, or roughly at . Further details on the observation and reduction of both the IRAC and MIPS data can be found in Kocevski et al. (2011a; hereafter K11).
2.2. Optical Spectroscopy
The original spectroscopic data in the Cl1604 field were obtained using LRIS on the Keck 10-m telescopes. The initial LRIS campaign consisted of a magnitude limited survey (R 23) that targeted galaxies in the vicinity of two of the constituent clusters of the Cl1604 supercluster system, Cl1604+4304 and Cl1604+4321 (see Oke, Postman, & Lubin 1998 for further details). Following the original survey, a follow-up LRIS spectroscopic campaign of six slitmasks was undertaken in the Cl1604 field in the vicinity of clusters Cl1604+4314 and Cl1604+4321 (see Gal & Lubin 2004 for details). In total 85 high-quality redshifts were obtained with LRIS between 0.84 0.96, the adopted redshift range of the Cl1604 supercluster.
The bulk of the redshifts in the Cl1604 field come from observations of 18 slitmasks with DEIMOS on the Keck II 10-m telescope between 2003 May and 2010 June. The details of the observations and spectroscopic selection of 12 of these masks are described in Gal et al. (2008; hereafter G08) and Lemaux et al. (2010; hereafter L10). The remaining six DEIMOS masks (referred to hereafter as “completeness masks”) were designed to obtain a magnitude limited sample to a depth of across a 16.7 5 subsection of the field running roughly north to south and encompassing clusters Cl1604+4314 and Cl1604+4321 (hereafter clusters B and D, adopting the naming convention of G08). In total, we targeted 90% of galaxies with in the subsection of the Cl1604 field covered by the completeness masks and obtained high quality redshifts for 75% of galaxies brighter than this limit. In the remainder of the field our spectroscopic completeness limit was slightly shallower, roughly complete to a depth of and reaching a limiting magnitude of .
All DEIMOS slitmasks were observed with the 1200 l mm-1 grating with an FWHM resolution of 1.7Å (68 km s-1), with a typical wavelength coverage of 6385-9015Å. The slitmasks were observed with differing total integration times depending on weather and seeing conditions and varied from 3600s to 14400s in seeing that ranged from 0.45-1.4. The initial 12 masks were observed for an average total integration time per mask of 2.75 hr, while the completeness masks are much shallower, averaging just under 1.5 hr of total integration per mask. The exposure frames for each DEIMOS slitmask were combined using a modified version of the DEEP2 spec2d package (Davis et al. 2003). The details of this package as well as the reduction process are described further in Lemaux et al. (2009; hereafter Lem09). In total, 1340 total high-quality (Q 3; see G08 for detailed explanations of the quality codes) extragalactic DEIMOS spectra were obtained in the Cl1604 field, with 440 objects having measured redshifts within the adopted redshift range of the supercluster. Combined with the additional redshifts obtained in the two LRIS campaigns, 525 high quality spectra have been obtained for members of the Cl1604 supercluster.
3. Analysis
3.1. Imaging Measurements
3.1.1 Photometry
Nearly all of the results presented in this paper rely heavily on the magnitudes of the Cl1604 supercluster members as measured in our ten-band imaging. Thus, both the accuracy and precision of our absolute photometric measurements and the self-consistency of these measurements from band to band are extremely important. The latter is of particular concern, as poorly matched apertures from multiband imaging can result in significant issues with differential photometry (Vanzella et al. 2001; Coe et al. 2006), which introduces bias into the SED fitting process. In Appendix A we describe the processes used to obtain reliable photometry from our LFC, WIRC, WFCAM, IRAC, and ACS imaging, as well as discuss our choice of apertures for each band and systematics associated with these choices. We refer interested readers to Appendix A.
3.1.2 Spectral Energy Distribution Fitting and Stellar Masses
Synthetic stellar templates were fit to the optical/IR SED of each galaxy in the Cl1604 field with the Le PHARE (Arnouts et al. 1999; Ilbert et al. 2006) code using the single stellar population (SSP) models of Bruzual & Charlot (2003) with a Chabrier initial mass function (IMF; Chabrier 2003). For galaxies with spectroscopic redshifts, the redshift was used as a prior to constrain the range of best-fit templates. For each galaxy, minimization is performed by Le PHARE relative to six parameters: the redshift (in the case of no spectroscopic redshift prior), stellar mass, stellar age, extinction, metallicity, and , the e-folding time of the star-formation event in the galaxy. Extinction values were bounded by the range = 0 to = 0.5 in six bins of size using a Calzetti et al. (2000) reddening law (though the stellar mass, the most important parameter derived from this fitting, is relatively insensitive to this choice; see, e.g., Swindle et al. 2011). Metallicity values were chosen to be 0.2, 0.4, and , consistent with the range of metallicity values used for other high-redshift surveys (e.g., Ilbert et al. 2010). Additionally, the BC03 SSP models contained nine different values of , ranging from a near-instantaneous burst ( Gyr) to a model consistent with that of a dwarf spiral galaxy ( Gyr). The stellar mass and mean stellar age of each galaxy was not discretized, but was rather constrained by the SFH of the best-fit template and scaled by the observed luminosity. Errors on each parameter are estimated through Monte-Carlo simulations in which each broadband magnitude is varied by its formal error to simulate random errors in the photometry and does not account for any systematic bias. For this paper, we require that a galaxy be detected in at least the & bands and have a secure spectroscopic redshift to consider the SED stellar mass reliable. The resulting average stellar mass error for the Cl1604 members that fulfill these criteria is 0.14 dex.
For those Cl1604 member galaxies that went undetected in any of the LFC bands (//) or the WIRC imaging, stellar masses were derived using our UKIRT -band imaging. The observed UKIRT magnitude for each detected galaxy was converted to a rest-frame -band luminosity by applying an evolutionary k-correction of (using a BC03 Gyr, =3 SSP model, see L09). Interpolated values of -band mass-to-light (/) ratios at (Drory et al. 2004) are multiplied by the resulting -band luminosity to obtain stellar mass estimates. Errors in these estimates are derived from the formal errors in our UKIRT photometry. The resulting average stellar mass error for the Cl1604 members detected in the UKIRT imaging is 0.07 dex.
Stellar masses derived from UKIRT data were compared to those estimated by Le PHARE for the subset of Cl1604 members detected in at least four bands. The scatter of the stellar masses derived from the two methods is reasonably small ( dex222This scatter is significantly increased relative to the quadrature sum of the formal errors of the two mass estimates. The quoted errors on the two mass estimators are random errors only and do not include the systematic errors associated with our choice of templates for the SED fitting, imperfect k-corrections, and our ignorance of the rest-frame -band / ratios. It appears that these systematic errors and random errors discussed earlier contribute roughly equally., and, perhaps more importantly, there exists no bias between the two methods as a function of stellar mass. For this paper, Le PHARE-derived stellar masses are given preference over UKIRT-derived stellar masses in cases where both mass estimates were available and reliable. In total, the two methods resulted in reliable stellar mass measurements for 452 of the 525 members of the Cl1604 supercluster system of which 399 are detected in our ACS imaging.
3.1.3 Group and Cluster Membership
Since many of the results presented in this paper rely on the comparison of the member galaxy populations of the eight spectroscopically confirmed clusters and groups in the Cl1604 supercluster, we define here our criteria for cluster or group membership. Our general philosophy is to err on the side of being overly inclusive, such that we include all galaxies that could potentially be associated with the cluster and to include a large range of environments. For the majority of the cluster and group systems we consider a galaxy a member of a particular system if it satisfies , where is the velocity offset of a galaxy from the systemic velocity of the group or cluster and is the group or cluster velocity dispersion, and , where is the projected radial offset of a galaxy from the group or cluster center and is the virial radius. The center of each system is defined as the centroid (as determined by SExtractor) of the smoothed red galaxy overdensity of each system and is described in detail in G08. The errors on these centroids, estimated by comparing centroids derived in this manner to X-ray centroids for all X-ray bright ORELSE clusters with the requisite data, ranges from 25 to 150 kpc (3-20). While the upper limit of this error is somewhat large, we stress that the optically derived centroid is the more relevant quantity for determining the local density in systems that are X-ray underluminous and still in the process of formation (as most of the sc1604 systems are). Thus, we choose to ignore this error for the remainder of the paper. The virial radius for each system is defined in terms of the radius at which the mean density is equal to 200 times the critical density of the universe at the redshift of that group or cluster (), such that (Biviano et al. 2006; Poggianti et al. 2009). The value of is calculated by (Carlberg et al. 1997):
| (1) |
where is the value of the Hubble parameter at the redshift of interest. The values of are taken from K11 and G08. For each cluster and group system we also calculate a virial mass, given by:
| (2) |
where is Newton’s gravitational constant.
The one exception to these criteria is group C, in which we see a continuum of galaxies at spanning from the group core to well past . This observation is consistent with preliminary velocity dispersion measurements of the members of group C using new data obtained since the publication of K11. In this measurement we observe a significant increase in the velocity dispersion relative to the value reported in K11, suggesting that we have underestimated the virial radius of group C by adopting the K11 value. As such, we relax the projected radius criterion for this group, considering any galaxy a member if it lies within and of the group center. Using these and the above criteria results in 305 of the 525 member galaxies of the Cl1604 supercluster (%) being classified as either group or cluster members. The remaining 220 galaxies that are not associated with a particular cluster or group system will be referred to hereafter as the “superfield” population. The number of members, as well as the name, location, mean redshift, velocity dispersion, virial radius, and virial mass for each Cl1604 cluster and group are given in Table 1.
As discussed in detail in G08 and K11, the groups and clusters of the Cl1604 supercluster span a large range of masses and dynamical states. Our two most massive clusters, A and B, are of nearly identical (optically derived) mass, but show significant differences in their galaxy populations, X-ray properties, and the radial distributions of their RSGs. In addition, as discussed briefly in K11, and as will be discussed later in this paper, the group systems also show similar variance in the radial distribution and the color properties of their constituent galaxies. Since it takes a cluster or group galaxy traveling 1000 km s-1 less than 2 Gyr to fall into the cores of these structures from the maximum projected radii (our largest projected cutoff is 2.10 Mpc; cluster B), being liberal in our membership criteria includes galaxies that may eventually be virialized into the cluster or group cores by . This way we can study both the current assembly of blue-cloud and RSGs in these structures as well as discuss the likely evolution of these systems over the next several Gyr. For some parts of our analysis we will be interested only in the former point and will restrict our study to galaxies at smaller projected radii.
| Name | ID | NmemaaWithin for all systems except C. For group C we allow Mpc, see §3.1.3. | (km s-1) | ( Mpc) | ||||
|---|---|---|---|---|---|---|---|---|
| A | Cl1604+4304 | 241.0975 | 43.0812 | 0.898 | 41 | 703110 | 0.92 | 3.281.53 |
| B | Cl1604+4314 | 241.1051 | 43.2396 | 0.865 | 85 | 78374 | 1.05 | 4.611.31 |
| C | Cl1604+4316 | 241.0316 | 43.2631 | 0.935 | 21 | 30436 | 0.39 | 0.260.09 |
| D | Cl1604+4321 | 241.1387 | 43.3534 | 0.923 | 96 | 582167 | 0.75 | 1.831.57 |
| F | Cl1605+4322 | 241.2131 | 43.3709 | 0.936 | 28 | 543220 | 0.70 | 1.481.80 |
| G | Cl1604+4324 | 240.9251 | 43.4017 | 0.901 | 17 | 40986 | 0.53 | 0.640.41 |
| H | Cl1604+4322 | 240.8965 | 43.3731 | 0.852 | 10 | 30264 | 0.42 | 0.270.17 |
| I | Cl1603+4323 | 240.7969 | 43.3918 | 0.902 | 7 | 359140 | 0.47 | 0.440.51 |
3.1.4 Morphology
For all Cl1604 supercluster members observed in our 17 pointing HST ACS mosaic, morphological classification was assigned through visual inspection of the data by one of the authors (LML). Briefly, ACS cutout images of each supercluster member galaxy were generated and presented to the inspector without prior knowledge of their location in the supercluster. For each inspected galaxy a primary morphological type was assigned using standard Hubble classification, as well as information on merger and interaction signatures, tidal features, etc. For this paper, we adopt the convention that all galaxies classified as spirals as well as those classified as irregular or amorphous (Sandage & Brucato 1979) are defined as late-type systems, while galaxies classified as either elliptical or S0 are early-type (though we discriminate between these two classes later in the paper). Merging systems, which were typically separated in the ACS imaging, were assigned the morphological classification of the galaxy associated with the DEIMOS/LRIS spectrum. In cases where the merging system was not separated in our imaging, or in cases where the primary galaxy was obscured by the merging process we did not assign an late-/early-type morphological classification. Such cases were rare, however, only comprising % of the cluster and group members with reliable stellar masses. For completeness, we include such systems when analyzing the color/stellar mass/morphological properties of member galaxies in §4.6, but we leave their morphological classification ambiguous. Visual inspections are preferred here over statistical quantities (i.e., Gini, M20, compactness, etc.) due to the added information that can be included when visually classifying galaxies and due the relatively small number of galaxies of the sample, which makes visual inspection feasible. Regardless, we find good agreement with the morphologies derived through visual inspections and those derived through more automated statistical methods (see discussion in K11).
In order to estimate the precision associated with the visual classification process, a random subset of 150 supercluster galaxies was presented to two of the authors (LML, RRG) for classification. These galaxies were presented blindly, in that neither author had knowledge of the original morphological classification of the galaxy. This process was used to test both the consistency of visual classification of a single observer and to test the objectivity of the process by including multiple classifiers. In both cases the results were comparable to the original classification, with the rms corresponding to roughly half a class, where a class refers to late-type, S0, and elliptical333More specifically, we assigned a number to each galaxy with elliptical=0, S0=1, and late-type=2 and took the difference between each trial for each galaxy. The resulting rms was when comparing multiple classifications by a single observer and when comparing results from multiple observers. Thus, we expect roughly %% of our sample to be morphologically misclassified. Since none of the results presented in this study are sensitive to changes of this level we choose to ignore this uncertainty for the remainder of the paper.
3.1.5 Red-sequence Fitting
For many of our studies we must divide systems not only into categories defined by their morphological classification but also to differentiate between red and blue galaxy populations. This will be especially important in §4.5 and §4.6 when comparisons are made between the red and blue galaxy populations of groups and clusters of very different masses in the Cl1604 supercluster. As such, we use the colormagnitude properties of each system to formally define the HST ACS “red sequence” and “blue cloud” galaxy populations in each of the constituent systems of the Cl1604 supercluster. The process of determining a formal red sequence for each system is similar to that used in Gladders et al. 1998 and Stott et al. 2009 and is described in detail in Appendix B. The slope, intercept, and width of the red sequence for each of the three Cl11604 clusters, as well as the composite “Groups” sample (see Appendix B), are given in Table 2. In addition, these red-sequence fits are plotted, along with the color and magnitude properties of the constituent galaxies of each system, in §4.1 and §4.4.
| Name | Intercept | Slope | WidthaaFor all clusters from the best fit colormagnitude relation was adopted for the width of the red sequence. For the group systems was adopted for the width (see Appendix B). |
|---|---|---|---|
| Cluster A | 2.200.02 | bbThe formal error in the red-sequence slope of all systems is smaller than 10-3. | 0.046 |
| Cluster B | 3.240.15 | bbThe formal error in the red-sequence slope of all systems is smaller than 10-3. | 0.048 |
| Cluster D | 3.210.30 | bbThe formal error in the red-sequence slope of all systems is smaller than 10-3. | 0.045 |
| Groups | 2.950.19 | bbThe formal error in the red-sequence slope of all systems is smaller than 10-3. | 0.076 |
3.2. Spectral Measurements
In this section we present the method used to extract measurements from our spectra, estimate their errors, and generate composite spectra of the galaxy populations of these systems.
3.2.1 Composite Spectra
Composite spectra were generated for the member galaxies of each Cl1604 cluster and group system following the method of Lem09. Composite spectra were created separately for members observed with DEIMOS and those observed with LRIS so as to not degrade the higher resolution DEIMOS data. Our use of variance weighting (see Lem09), in principle, will give higher average weight to brighter galaxies in the sample (due to galaxies effectively being weighted by their S/N ratio). The primary motivation for this weighting scheme is to down-weight those pixels that have been affected by poor night sky subtraction or which fall in the 10 Å chip gap between the red and blue CCD arrays on DEIMOS. While the difference between continuum S/N of the brightest and faintest galaxies in any individual system is, on average, a factor of 2-3, the differences between S/N ratios near spectral features of interest (i.e., [O II] and H) is significantly less. We, therefore, choose to ignore this effect for any equivalent width measurements made on composite spectra.
However, for measurements (see next section) this effect may be more pronounced since is a quantity that relies on direct measurement of the significant portions of the continuum. As a result of our weighting scheme, composite spectra produced in such a manner will be slightly biased to higher values (i.e., older average stellar populations). In order to determine the magnitude of this effect we have compared the measurements of composite spectra created using other weighting schemes (e.g., luminosity weighting, clipped variance weighting) and found the resulting difference to be of order . While this difference is certainly not trivial, the conclusions presented in §5 are robust to changes of this level to . We, therefore, choose to ignore this bias for measurements as well.
3.2.2 Equivalent Width and Measurements
Equivalent widths (EWs) of the [O II] 3727Å and 4101Å features were measured from composite spectra of group and cluster galaxies following the bandpass method of L10. While fitting methods generally lead to more precise results in the case of high S/N spectra, the process of combining group or cluster galaxies into a single composite spectrum tends to blur out small scale features in the constituent spectra, which diminishes the effectiveness and usefulness of such methods. Bandpasses for both the [O II] and features were adopted from Fisher et al. (1998). For further details on the method used to calculate EWs see L10. Since composite spectra from DEIMOS and LRIS were generated separately (see §3.2.1), EW measurements were performed on each set of spectra separately. For EW measurements of the spectrum of a given galaxy population, the final EW value was calculated by number-weighting the individual EW measurements from the DEIMOS and LRIS composite spectra. Errors on these quantities were similarly calculated. Table 3 gives the EW([O II]) and EW(H) measurements from the composite spectra of the eight Cl1604 groups and clusters. For all EW measurements we ignore the effect of differential extinction, which generally has a small effect on EW measurements (see discussion in L10).
In addition to EWs, the strength of the continuum break at 4000Å () is measured from composite spectra using the ratio of the blue and red continua as defined by Balogh et al. (1999). Mean flux density values are calculated from the -clipped spectrum of each region, with the index defined as . Errors on the index are calculated from the variance spectrum in each region, again using -clipping to avoid regions of poor night sky subtraction or regions that fell within the 10 Å CCD chip gap. As with EWs, measurements of the value were performed separately on DEIMOS and LRIS composite spectra for each group and cluster system and combined by a number-weighted average. measurements from the composite spectra of the member galaxies of the eight groups and clusters of the Cl1604 system are given in Table 3.
The effects of reddening on are not negligible. An approximately 1 Gyr old SSP with no dust [i.e., ] has a that is 10% smaller than that of a identical age SSP with significant dust [i.e., ]. Differences in metallicity have a similar effect, changing by roughly 6% in Gyr old SSPs when metallicity changes by a factor of two. Though these effects are reasonably large, the quantitative work involving the index in this paper relies not only on the index but also on the EW measurements described above. Through such analysis we are able to mitigate the effects of dust and metallicity differences when interpreting the evolutionary state of a particular system of galaxies. More importantly, in all cases throughout the paper our main conclusions do not change if the dust or metallicity properties of the galaxies are altered significantly.
3.2.3 Spectroscopic Selection and Completeness
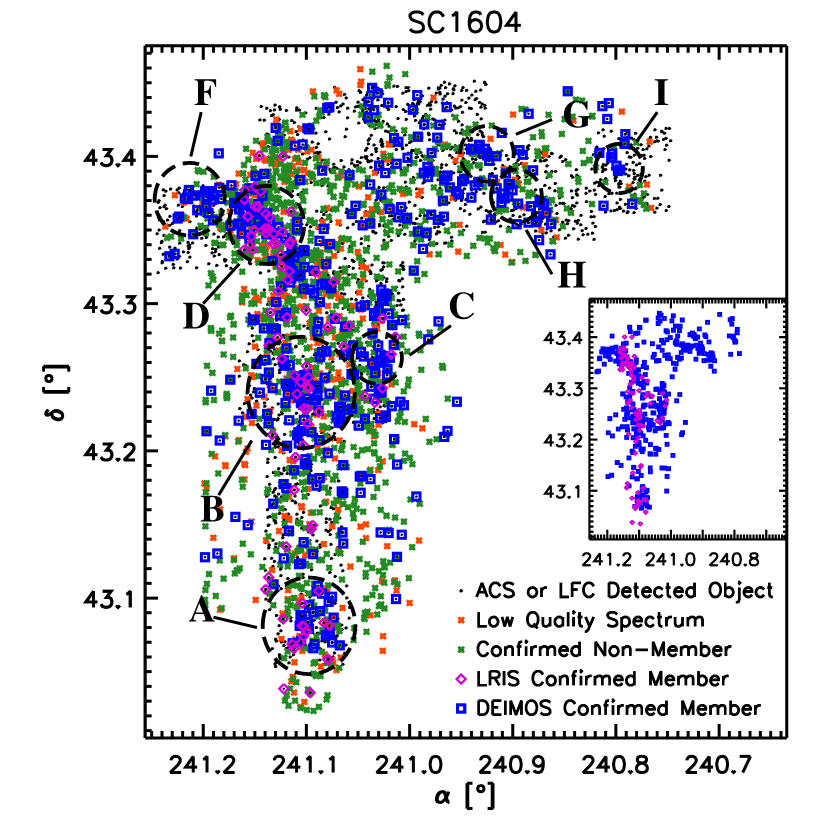
With over 500 spectroscopically confirmed members, the Cl1604 supercluster is one of the most well-studied large scale structures at intermediate redshifts. Despite this fact, there exist a significant number of galaxies both within the superfield and within the truncation radius of the constituent groups and clusters for which we do not have spectroscopic information (see Figure 1). This issue is further complicated by our method of selecting targets for spectroscopy, which has evolved considerably over the course of the spectroscopic campaign. These selections have resulted in certain areas of the supercluster that are roughly spectroscopically complete, either to (clusters A and D; see Oke, Postman, & Lubin 1998) or to (clusters B and D and the superfield spanning the two structures; see Figure 1 and §4.1), while other areas, like those that include the five Cl1604 groups, have sparser spectroscopic coverage. In order to investigate the effects that spectroscopic incompleteness and selection have on our results bootstrap analysis was performed on the composite spectra of all Cl1604 systems. This analysis, which is described in detail in Appendix C, uses a combination of the HST ACS photometry and the DEIMOS/LRIS spectroscopic information in such a way so as to simulate the maximum possible variance of the composite EW and values due to spectroscopic sampling alone.
While these “incompleteness errors” can be quite large relative to the formal random errors (see Table 3), we stress that the errors generated by this process properly account for the effects of differing spectroscopic selection functions and spectroscopic coverage. In such a way, any statistically significant differences that we observe between the composite Cl1604 galaxy populations and that of low-redshift samples with similar spectroscopic coverage to that of Cl1604 or high-redshift samples with sparser spectroscopic coverage must be the result of true differences in the properties of the galaxies. Similarly, this is true when making comparisons between the composite galaxy properties of individual clusters or groups within the supercluster. For details on the methodology used to estimate these incompleteness errors see Appendix C.
4. Results
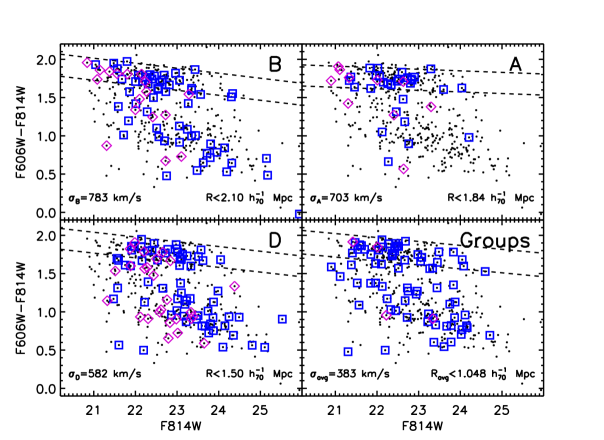
4.1. ColorMagnitude Properties
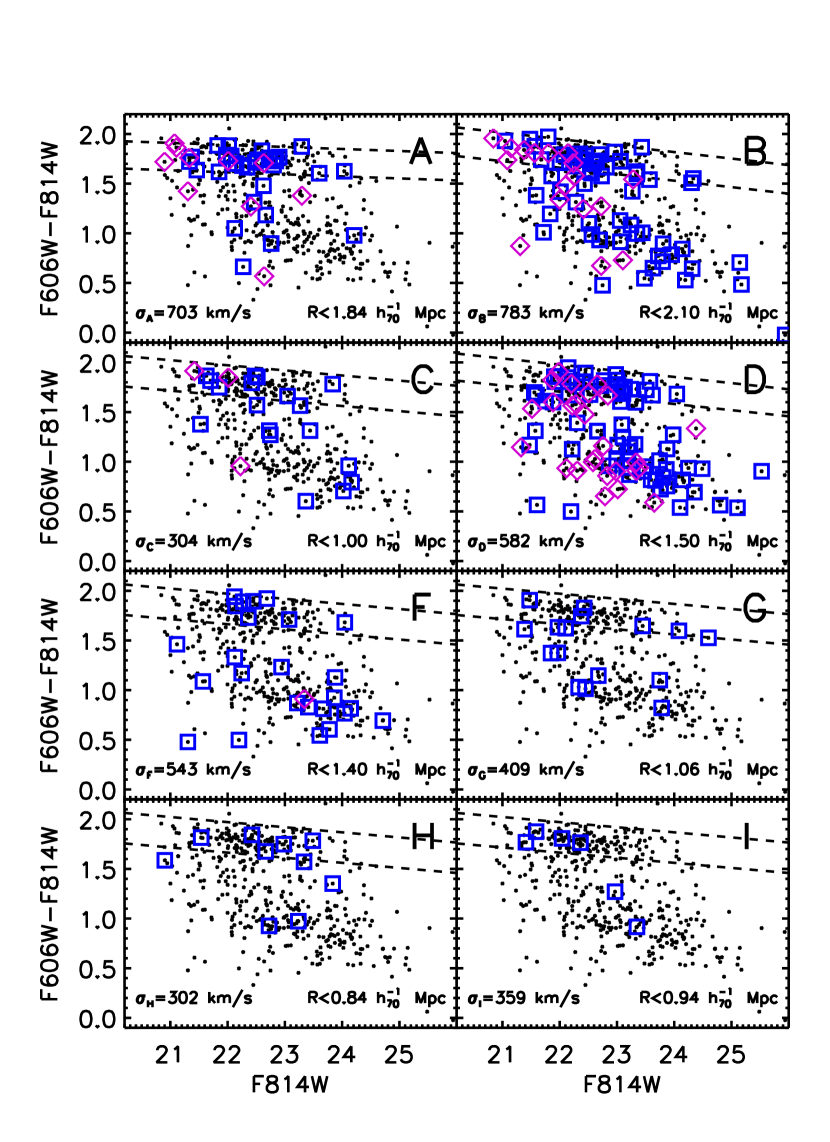
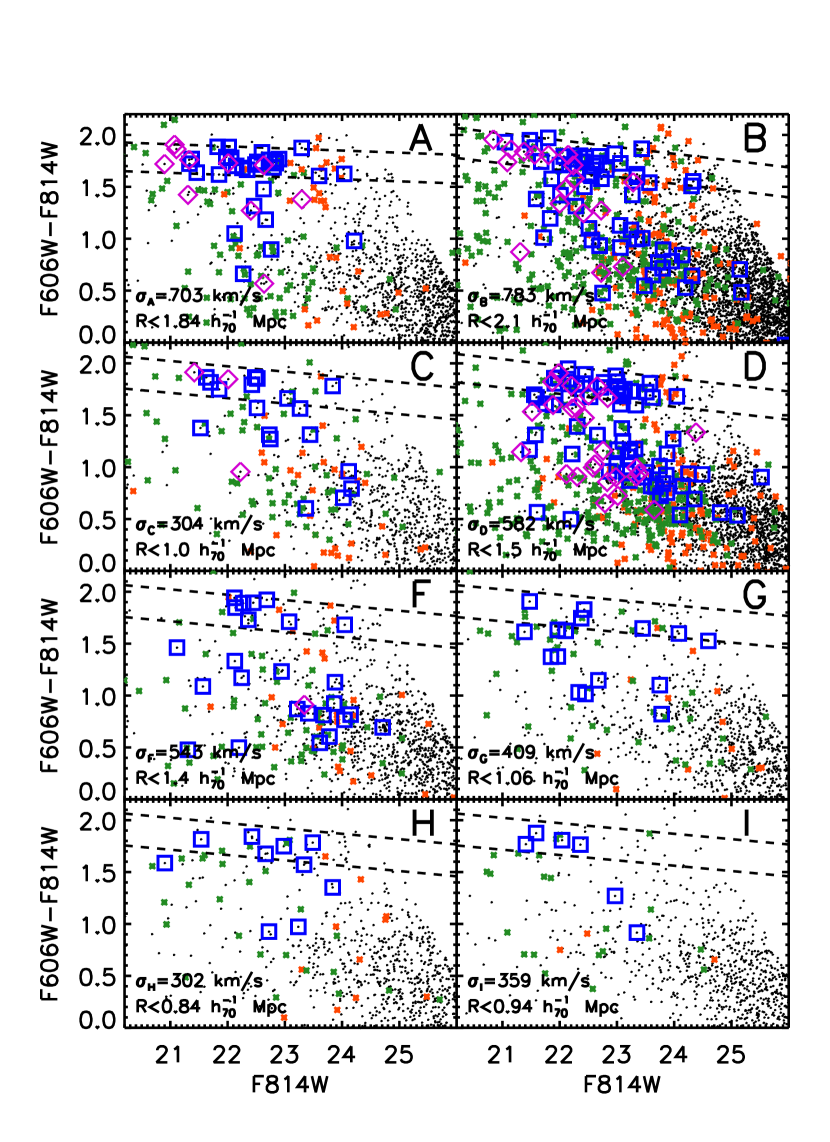
In Figure 2 we plot the ACS colormagnitude diagrams (CMDs) for the three clusters (A, B, & D) and five groups (C, F, G, H, & I) of the Cl1604 supercluster. In each panel we plot the 460 Cl1604 members which fall in the ACS field of view (small black points) to highlight the range of colors and magnitudes spanned by the member galaxies of the supercluster system. The magenta diamonds (LRIS confirmed) and blue squares (DEIMOS confirmed) in each panel indicate the members of that particular system. Cluster and group membership is defined by the criteria given in §3.1.3. In total, using a truncation radius of , the Cl1604 groups and clusters contain 288 of the 467 (62%) ACS detected spectroscopically confirmed members of the supercluster.
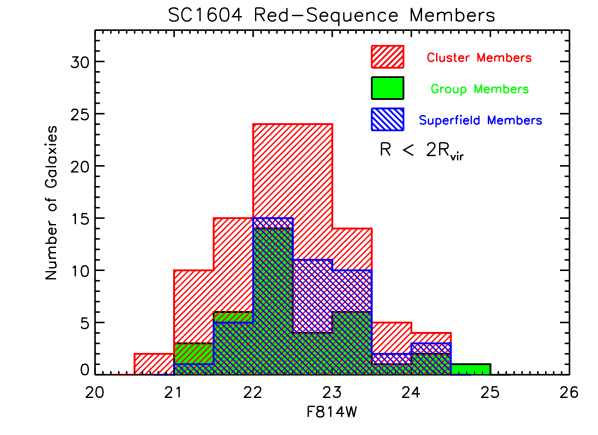
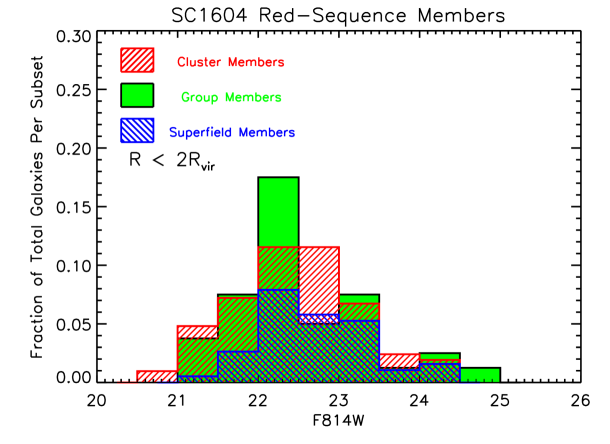
Looking at the CMDs, a few observations are immediately clear. A large fraction (76%) of RSGs and virtually all of the bright RSGs in the Cl1604 supercluster are contained within the groups and clusters. This can also be seen in Figure 3 where we plot both the total number of RSGs, as well as the fractional contribution of RSGs, as a function of magnitude for the cluster, group, and superfield samples. The fraction of RSGs in the combined Cl1604 clusters and groups sample is 47%, while it is only 23% for superfield galaxies. Additionally, at nearly every magnitude, the fractional contribution of RSGs is significantly more in cluster and group environments than in the Cl1604 superfield. Despite the fact that these groups and clusters are optically selected, generally X-ray underluminous (see Kocevski et al. 2009a), and still in the process of formation, the member galaxies of the groups and clusters are already beginning to distinguish themselves from their field counterparts. Surprisingly, the red sequence fraction of the galaxy population in the Cl1604 clusters is 47%, identical to the fraction for just the Cl1604 group galaxies. This suggests that significant processing has occurred, and at similar levels, in both group and cluster environments at . The considerable processing observed in the Cl1604 group environments will be a recurring point in later sections.
What is further striking in Figure 2 is the large variance in the color and magnitude properties of the cluster and group galaxies from structure to structure. While the three clusters differ in their (optically derived) virial mass () by only a little over a factor of two (and are consistent within the errors, see Table 1), both the fraction of RSGs and the number of bright blue galaxies change drastically from cluster to cluster. In cluster A, a cluster that is relatively relaxed and dominated by a bright ICM (see Kocevski et al. 2009a), the fraction of RSGs is quite high (%) and essentially no bright blue-cloud galaxies are observed. In the X-ray underluminous clusters B and D, the red-sequence fraction is significantly lower, 49% and 36%, respectively, and a large number of bright blue galaxies are observed (though these two populations have significantly different properties, see §4.4).
In the group systems, the variance of the colormagnitude properties of the member galaxies is even more pronounced. The most massive group in the Cl1604 system (group F) has the lowest observed fraction of RSGs (31%) of any structure in the supercluster and a large fraction of bright, blue, 24-detected starburst galaxies (see K11). Conversely, the two lowest mass group systems in Cl1604 (groups C and H) have observed red-sequence fractions that are % and contain a large fraction of the brightest RSGs observed in the group systems. The errors on the virial mass estimates of the group systems are, however, quite large (see Table 1). Further increasing our uncertainty is the large fraction of blue galaxies in groups F and G, which may be artificially inflating the observed velocity dispersion relative to groups comprised primarily of RSGs (as in, e.g., Zabludoff & Franx 1993). Considering these large uncertainties, if we instead assume all group systems belong to roughly the same mass halo, the variance in the colors and magnitudes of the group members observed from system to system is still surprising. From Figure 4 we conclude that this variance and the variance of the colormagnitude properties of the cluster members is not due to incomplete spectral sampling, but rather represents real differences in the galaxy populations of the Cl1604 groups and clusters.
4.2. Global Spectral Properties
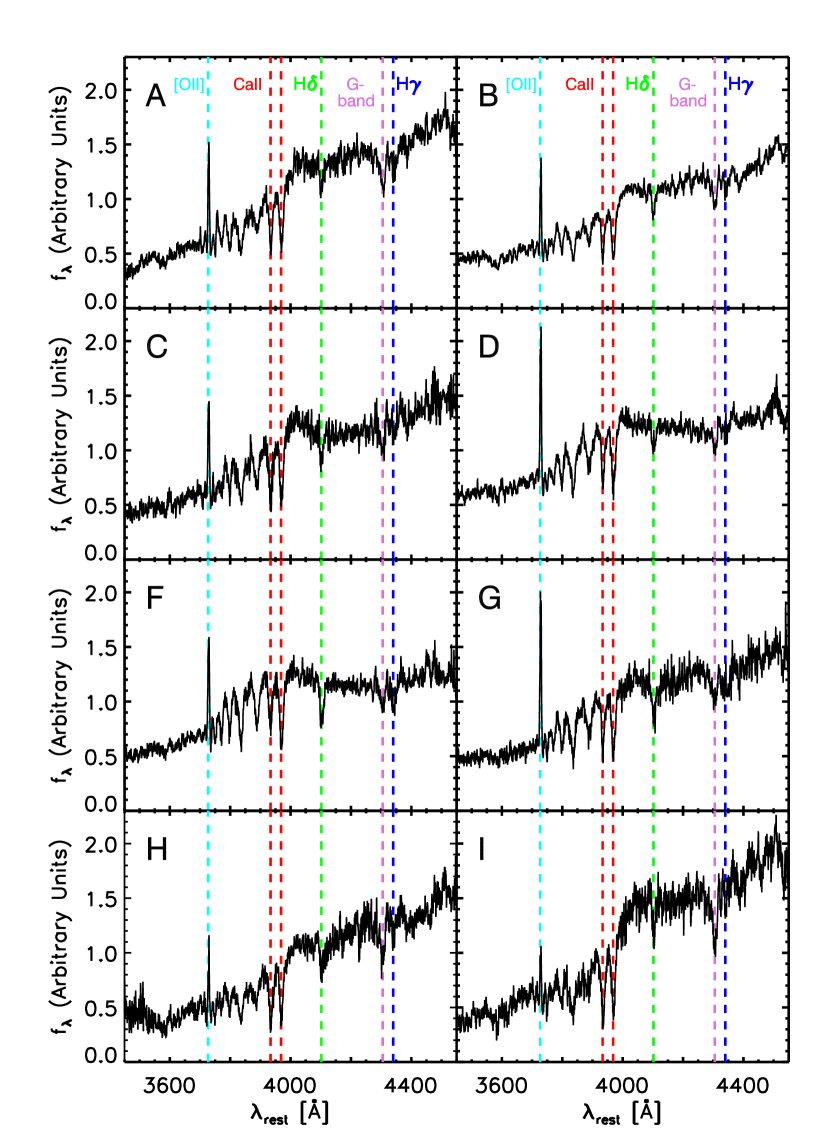
The differences in the galaxy populations between the Cl1604 groups and clusters are not limited to their broadband properties. In Figure 5 we plot the composite UV/optical spectra of member galaxies of the clusters and groups observed with DEIMOS. Important spectral emission and absorption features are overlaid in the plot (for a review of these features see Burstein et al. 1984; Rose 1985; L10). Since the DEIMOS spectra make up % of the spectrally confirmed members in the Cl1604 clusters and nearly all of the confirmed members of the groups (see Figure 2), we plot the DEIMOS composite spectra here to highlight the general spectral properties of the cluster and group populations. The LRIS composite spectra, which we will include later in the section when measuring spectral quantities, are generated separately from the DEIMOS spectra (see §3.2.1) and are not shown here.
Just as significant variance was observed in the colormagnitude properties of the group and cluster members, we observe that variance manifested here in the spectral properties of the average member galaxy of each system (see §3.2.1 for a detailed explanation on the meaning of our use of “average”). A quick inspection of the composite spectra of the members in the three cluster systems (A, B, & D) and the five groups (C, F, G, H, & I) reveal significant differences in the level of ongoing star-formation (based on the strength of the [O II] Å nebular emission feature), the luminosity-weighted fraction of older stellar populations [based on the strength of the Ca II and -band 4305Å features and , a quantitative measure of the magnitude of the continuum break at 4000Å], and the luminosity-weighted fraction of relatively young stars (based on the strength of the H 4101Å and higher order Balmer absorption lines just blueward of CaII).
The average galaxy in cluster A, a system dominated by RSGs (see §4.1), is, not surprisingly, comprised primarily of an older stellar population [large ] with moderate signatures of recent star formation activity. What is perhaps surprising, however, is the [O II] emission feature is stronger in the average galaxy in cluster A than in cluster B, a system with a much lower fraction of RSGs. This is likely due to non-star-forming processes and will be discussed in more detail later. The spectrum of the average galaxy in cluster D is significantly different than its counterpart in either of the higher mass clusters. The typical stellar population in D is several Gyr younger [ versus and ]. The average galaxy in D also shows a higher level of current star formation than that of either of the more massive clusters. The spectrum of the average group galaxy similarly varies from structure to structure, ranging from young systems that are dominated by A stars and ongoing star-formation (group F) to systems comprised of extremely old stellar populations (group I). In Table 3 we list the composite spectral properties of the member galaxies of the eight Cl1604 groups and clusters.
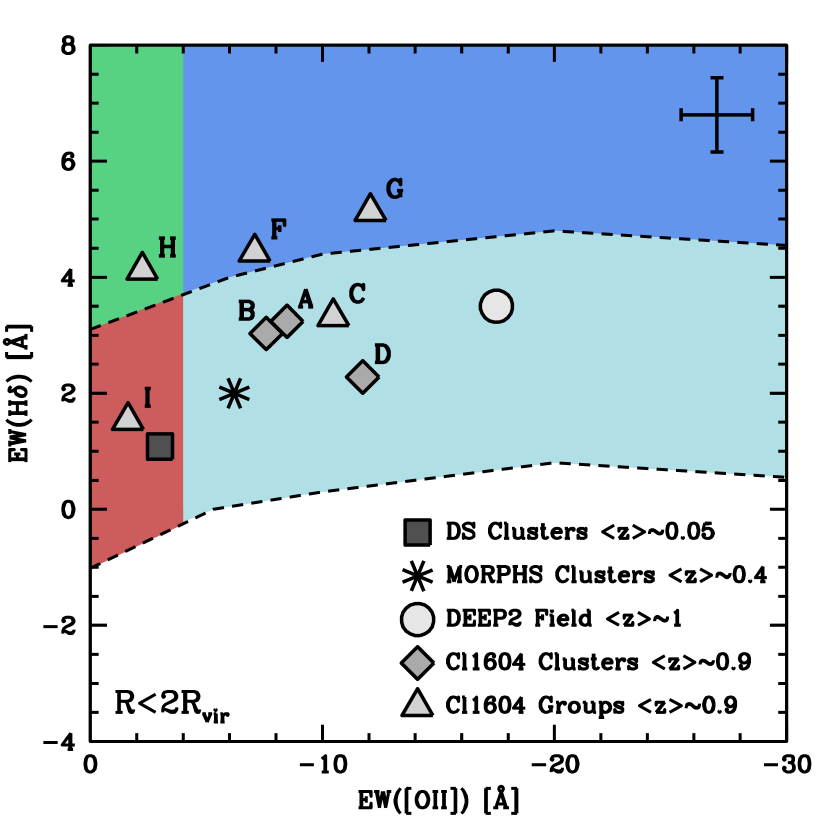
To further quantify this variance we plot in Figure 6 the EW of the [O II] and H spectral features as measured from the composite spectra. With spectral features that provide us with information on both the level of instantaneous star formation (in the form of [O II]) and the level of recent ( Gyr) star-formation activity (in the form of H), such a diagnostic diagram is useful both to separate star-forming galaxies from quiescent populations and to determine the manner in which active (i.e., star-forming) galaxies are forming their stars. Also plotted in Figure 6 are the average properties of field galaxies from the DEEP2 redshift survey444A. Dressler (private communication, 2008). (Davis et al. 2003, 2007), as well as the average properties of selected cluster galaxies at (Dressler et al. 2004) and (Dressler & Shectman 1988). Shaded regions correspond to quiescent, post-starburst, starburst, and “normal” (i.e., continuous) star-forming galaxies (red, green, dark blue, and light blue, respectively).
| EW([O II])aaRandom and incompleteness errors are reported for EW([O II]), EW(H), and separately. The second error given in each column is the uncertainty due to completeness effects (see §3.2.3 and Appendix C). | EW(H)aaRandom and incompleteness errors are reported for EW([O II]), EW(H), and separately. The second error given in each column is the uncertainty due to completeness effects (see §3.2.3 and Appendix C). | ||
|---|---|---|---|
| Name | (Å) | (Å) | aaRandom and incompleteness errors are reported for EW([O II]), EW(H), and separately. The second error given in each column is the uncertainty due to completeness effects (see §3.2.3 and Appendix C). |
| Cluster A | 8.470.161.16 | 3.240.140.79 | 1.5010.0050.037 |
| Cluster B | 7.580.151.09 | 3.030.150.50 | 1.4720.0060.024 |
| Group C | 10.470.241.95 | 3.320.230.96 | 1.4030.0080.038 |
| Cluster D | 11.740.121.02 | 2.280.130.51 | 1.2490.0030.018 |
| Group F | 7.080.161.72 | 4.430.180.79 | 1.1710.0040.025 |
| Group G | 12.070.231.60 | 5.130.220.52 | 1.3390.0070.044 |
| Group H | 2.240.332.09 | 4.120.300.87 | 1.6500.0110.038 |
| Group I | 1.620.291.60 | 1.530.230.49 | 1.8890.0130.058 |
| GroupsbbMeasurements made a composite spectrum comprised of all Cl1604 group galaxies | 7.920.211.90 | 4.150.200.63 | 1.3810.0050.041 |
Prior to investigating the results of Figure 6 for the Cl1604 systems, as well as for the DEEP2 field and lower redshift cluster populations, it is necessary to discuss the physical interpretation of EW([O II]). While [O II] is traditionally associated with nebular star formation activity, other process relating to AGNs or low-ionization nuclear emission-line regions (LINERs) generate significant [O II] emission (Yan et al. 2006; L10; Kocevski et al. 2011b; Hayashi et al. 2011). This is particularly an issue for [O II]-emitting RSGs that have no other indicators of current star-formation activity, as in a large fraction (%) of such galaxies [O II] emission originates from a LINER/AGN. We will discuss the level of contamination in the composite [O II] emission from this population later in the section. Interpreting the EW([O II]) for dust-reddened systems is also complicated by certain dust geometries, which can non-trivially decrease the measured values of EW([O II]). Dust-reddened starbursts can appear in both the blue cloud and on the red sequence, with differential reddening playing an increasingly significant role the redder such galaxies become. As there is a large 24m-bright starburst population observed in the Cl1604 supercluster (K11), we take care to account for this population throughout this paper.
For systems primarily comprised of blue-cloud or quiescent555Quiescent here refers to both star-formation processes and LINER or other AGN processes RSGs, the relationship between EW([O II]) and the global SFR of a galaxy requires knowledge of that galaxy’s rest-frame UV brightness. Since our spectral measurements come from composite spectra rather than a single galaxy, translating the composite EW([O II]) to an average SFR for each group and cluster galaxy population involves the rest-frame UV brightness of the average member galaxy in each system. The median absolute -band magnitude, , of the constituent galaxies of the eight Cl1604 groups and clusters varies between and . This is a difference of only a factor of in luminosity for the most extreme cases. These values of are roughly consistent with the median of the DEEP2 field galaxy sample (see Cooper et al. 2007) and that of the cluster galaxy samples at and (assuming ; see Dressler et al. 1999, 2004). Thus, we ignore this point for the remainder of this section and will speak of EW([O II]) in such systems as being directly proportional to the global SFR.
With these caveats in mind we examine the properties of the average member galaxies of the eight Cl1604 groups and clusters. From our measurements of the members of clusters A, B, and D we find that the average cluster galaxy at is a normal star-forming galaxy, in stark contrast with the average cluster galaxies at , which appears to be devoid of any star-formation activity. Furthermore, cluster galaxies at appear to be forming stars at, on average, roughly half the rate as those galaxies in the field at similar redshifts, but roughly twice the rate as those in clusters.
Measuring only the EW([O II]) feature from a composite spectrum comprised of only RSGs in both cluster B and the group systems, we find a negligible contribution to the [O II] EW from this population (see §5). [O II]-emitting LINER/AGN are apparently not prevalent in the RSGs in cluster B or the group systems. The red-sequence population in both clusters A and D, however, exhibit significant levels of [O II] emission. In cluster A this is likely due to contamination from LINERs or AGN (see §5). Thus, for cluster A we interpret the SFR derived from the composite EW([O II]) measurement as an upper limit. In cluster D, much of the [O II] emission is likely due to residual star formation in galaxies that have recently transitioned to the red sequence (see §5). Furthermore, cluster D, the least massive cluster of the Cl1604 complex, has a large fraction of dust-reddened starburst galaxies, a population that is less prevalent in the two massive cluster systems. Thus, for cluster D the EW([O II]) value as measured from the composite spectrum is considered a lower limit. Even without these considerations we observe a trend of decreasing SFR of the average cluster member with increasing halo mass.
If we instead make a correction for the [O II] emission originating from non-star-forming processes in cluster A, the EW([O II]) of the average galaxy in cluster A drops to [O II]Å. This correction is made by artificially setting the EW([O II]) of RSGs in this system to [O II]Å, a value typically associated with no star formation. This corrected value of EW([O II]) places the average cluster A member in line with member galaxies of lower-redshift () clusters. In cluster D, the SFR derived from the composite EW([O II]) value is an underestimate due to the large number of -bright galaxies observed in the system. To correct for this, we extinction correct the spectra of the 25% of cluster D members that are observed in (assuming an and a Calzetti et al. 2000 reddening law). The EW([O II]) from this “corrected” composite spectrum is [O II]Å, consistent with the EW([O II]) observed for average field galaxies at . Since H is observed in these spectra primarily in absorption, the resulting “corrected” is statistically identical to the uncorrected case. While there is significant uncertainty in this process, it is clear that the average cluster galaxy at in the Cl1604 supercluster is (i) undergoing normal star formation, (ii) has an SFR that lies somewhere between the average SFR of galaxies in lower redshift clusters and that of the average field galaxy at , and (iii) the level at which the cluster galaxy is forming stars is related to the host halo mass and the dynamics of the cluster system in which it is embedded.
In contrast, only one of the group systems (group C) has an average member galaxy that is undergoing continuous star formation. The average level of star formation in this group is roughly consistent with the average SFR in the Cl1604 cluster galaxies. This is perhaps not surprising, as the colormagnitude properties of group C are the most “cluster-like” of any of the group systems; this group contains both bright RSGs, a significant population of bright blue galaxies, and a red-sequence fraction that is nearly identical to cluster B. The other group systems exhibit large differences in the spectral properties of their member galaxies. The average member galaxies in groups H and I have an EW([O II]) consistent with no ongoing star formation. In group H, the average member galaxy is classified as a post-starburst (i.e., K+A; Dressler et al. 1999; Poggianti et al. 1999), suggesting significant recent ( Gyr) star formation has occurred. In the two remaining group systems, groups F and G, which have the highest observed fraction of 24m bright dusty starburst galaxies (see K11), the average member is a starburst galaxy. If we instead consider the composite group properties by combining all group galaxies in a single population, the average measured EW values, [O II]Å and Å, imply that the average Cl1604 group galaxy is undergoing a starburst. This conclusion is somewhat surprising given the large number of bright (and, as we will show later, massive and early-type) RSGs observed in the group systems. All these results suggest that significant processing of galaxies is occurring in group environments before such systems are formed into clusters, consistent with the conclusions of several other studies (e.g., Zabludoff & Mulchaey 1998; Jeltema et al. 2007; Kautsch et al. 2008; Tran et al. 2009; Bai et al. 2010; Balogh et al. 2009, 2011).
4.3. Red-sequence Luminosity Function
Much work has been done on observing the properties of the red-sequence luminosity function (LF) in high redshift clusters (-). These studies confirm the existence of bright (or massive) RSGs in overdense environments at (e.g., Stanford et al. 2005, 2006; Tanaka et al. 2007; Papovich et al. 2010; Stott et al. 2010; Tran et al. 2010) and show a significant deficit in the population of the low-luminosity RSGs at such redshifts (Tanaka et al. 2005, 2007; De Lucia et al. 2007; Koyama et al. 2007; Stott et al. 2007; Lerchster et al. 2011; but see Andreon 2006, 2008 for a different view). While the latter point is well established by such studies, the lack of dense spectroscopic sampling forces these works to rely primarily on photometric redshifts or statistical field subtraction techniques (as in, e.g., Pimbblet et al. 2002), which leaves significant uncertainty in the magnitude of this deficit for individual cluster systems. With the wealth of spectroscopic data on the Cl1604 supercluster we present here for the first time the LF of a deep, magnitude limited survey of high-redshift cluster RSGs using solely spectroscopically confirmed members (though see Zucca et al. 2009 for a similar survey of overdense regions in the COSMOS field).
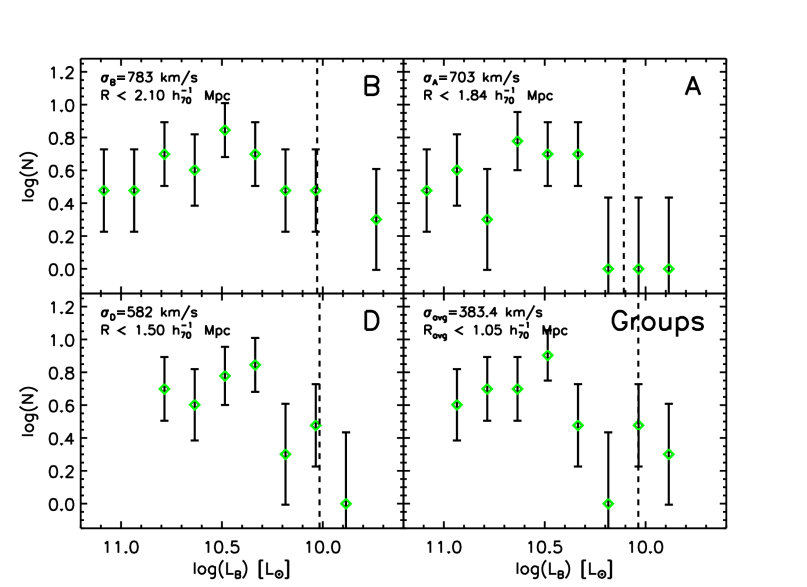
In Figure 7 we plot the rest-frame -band red-sequence LF of the confirmed members of the three clusters and five groups that comprise the Cl1604 supercluster. Both here and for the bulk of our remaining analysis we combine all the group galaxies into a single “Groups” population. This facilitates comparisons to the cluster populations and to create a sample of group galaxies that is similar in number to members in each of the Cl1604 clusters. Transformations to the rest-frame B band are made using our ACS photometry and the relationship derived by Homeier et al. (2006b) specifically for cluster galaxies in the Cl1604 system:
| (3) |
where is the luminosity distance to each source as determined by its spectroscopic redshift and our choice of cosmology. The absolute rest-frame -band luminosity of each galaxy was translated to using the -band luminosity of the sun666http://www.ucolick.org/cnaw/sun.html. No correction was made for internal dust extinction, as the extinction values derived from the SED process are only precise enough to use in a statistical manner. The average fitted extinction of the RSGs presented here is , which translates to a difference of % in luminosity. While this is a non-trivial absolute uncertainty, the RSGs of each system span an order of magnitude in luminosity, and, thus, this uncertainty is much smaller than the bin size used for this analysis. Furthermore, we find no significant difference between the average values of the brighter [] RSGs in the sample than that of the fainter [] RSGs, which is crucial to our analysis. We therefore ignore the effects of extinction for the remainder of the section.
What is immediately noticeable in Figure 7 is the level of development in the group red sequence. The bright end of the red-sequence LF in the group systems appears nearly identical that of the two most massive Cl1604 clusters (clusters A and B). The only exception is the few extremely bright [] RSGs present in clusters A and B that are lacking in the group systems. Conversely, in our lowest mass cluster (cluster D) we observe no RSGs with . While this cluster is still quite young (as determined by the average stellar ages of its massive RSGs, see §5), it appears that galaxies at the bright end of the red sequence were not “embedded” into the system at an early time in its formation history. While it is not necessarily the case that such galaxies were embedded into the potentials of the two more massive clusters, the presence of bright (and, as we will show later, massive) RSGs in clusters A and B allows for this possibility. Furthermore, the presence of such galaxies in the group systems (except for the very brightest end, a distinction which will become important later) argues strongly in favor of a scenario where the bulk of the bright end of the red sequence is formed primordially through “early quenching” (Poggianti et al. 2006; Kriek et al. 2006; Faber et al. 2007; Cooper et al. 2007). In this scenario star-forming galaxies are transformed into massive quiescent ellipticals at early () times. However, since we observe no such galaxies in cluster D, it is puzzling to consider how such a system might form if early quenching processes are universal for bright (massive) red-sequence cluster galaxies. Since there are no bright RSGs in cluster D, a different scenario is required to explain how such galaxies will777While it is possible that cluster D represents a special case of a cluster where bright/massive RSGs do not form by, e.g., , we assume that its galaxy population will eventually resemble that of a “typical” cluster. arise in cluster D. The formation of a system like cluster D requires very specific progenitors, as every group system (with the exception of group F) has at least one RSG that is brighter than the brightest RSG in cluster D. We will return to the issue of what processes are likely responsible for building up the bright (massive) end of the red sequence in cluster D and the other Cl1604 structures in §5.
At the faint end of the red-sequence LF a noticeable decrement occurs in the number counts of RSGs at luminosities of (). The red-sequence completeness limit (indicated by the dashed line in each panel of Figure 7) is determined from the blueward envelope of the red-sequence in each system and the magnitude where we have obtained high quality spectroscopic redshifts for 90% of RSGs in any particular structure. This completeness limit is roughly () for all systems or 0.3 (where is adopted from the red galaxy sample in Willmer et al. 2006). For all structures except the most isolated and relaxed system (cluster A; see §4.5), the deficit in the number counts of RSGs occurs at significantly brighter luminosities than our completeness limit. This suggests that the paucity of faint RSGs in these systems is real and not a result of our spectral sampling. In cluster A we observe a flattening out of the red-sequence number counts persisting nearly to the completeness limit in this system and only marginal evidence for a decrease in the number count at luminosities consistent with our completeness limit. These results are identical to the photometric analysis of cluster A by Crawford et al. (2009), in which no decrease in faint RSGs was observed to their completeness limit. However, in an evolved system such as Coma, the number counts of RSGs are seen to increase nearly monotonically with decreasing luminosity (Terlevich et al. 2001; De Lucia et al. 2007). This suggests that, although the deficit of low-luminosity RSGs is not as pronounced in cluster A as in the less-evolved Cl1604 systems, cluster A still has a significant decrement in the low-luminosity end of the red-sequence LF despite being the most evolved system in the supercluster. These results are consistent with the observations of De Lucia et al. (2007) and Koyama et al. (2007), who found that the deficit of low-luminosity red-sequence cluster galaxies is strongly tied to the evolutionary state of the cluster. Clusters which are more evolved or observed at lower redshift (and, therefore, generally more evolved than those at high redshift) were found in both studies to contain a larger fraction of faint RSGs than their younger counterparts.
The noticeable lack of faint RSGs within the bounds of the Cl1604 structures initially seems somewhat difficult to reconcile with the observation of a large number of bright, RSGs in the two most massive clusters and in a majority of the group systems. We previously argued that early quenching processes were strongly favored by the presence of such bright (and massive; see §4.4) RSGs. The process that transformed these bright RSGs early in their formation histories cannot, however, generally be responsible for the transformation of their low-luminosity counterparts since the majority of this population is not formed by . The fraction of low-luminosity red galaxies is also quite low in the field at these redshifts, both in the Cl1604 superfield population and in larger field surveys (e.g., Cooper et al. 2007). This further suggests that early quenching processes are not responsible for the formation of such galaxies. As there are few low-luminosity RSGs in the field for clusters to “passively” accrete at , it is likely that late-time transformation of low-luminosity (or low-mass) blue cluster and group galaxies is responsible for comprising the low-luminosity end of the red-sequence LF at low redshifts. As we will show later, a large number of faint (and low-mass) blue galaxies are observed outside the core () of all the Cl1604 structures (see §4.5), suggesting that such galaxies have yet to be quenched by the cluster or group environment.
4.4. ColorStellar-mass Properties
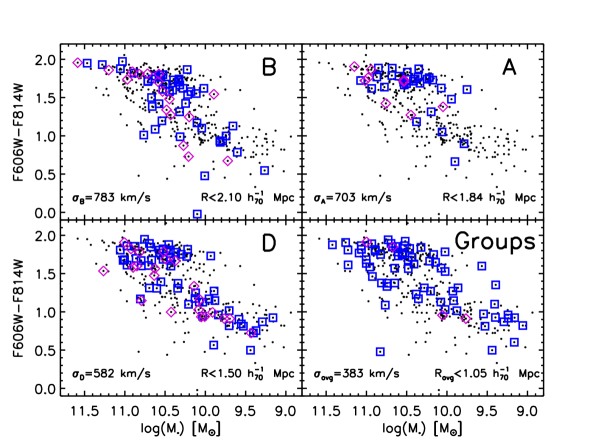
In Figure 8 we plot the CMDs and colorstellar-mass diagrams (CSMDs) for the member galaxies of the three clusters and five groups of the Cl1604 supercluster. One of the most striking observations from both the CMDs and the CSMDs is both the level of development of the group red sequence and the number of massive RSGs present in the five Cl1604 groups. The mass range of the confirmed red-sequence members of the groups is nearly identical to that of the most massive cluster (B), the only exception being the highest mass galaxies [] in cluster B which are absent in the groups. The presence of these massive red galaxies in the groups suggests that either there is a large population of massive dust-reddened starbursts in the groups populating the red sequence, or significant pre-processing is occurring in the group environments in the supercluster. This question will be addressed when we discuss their morphologies in §4.6.
A dramatic shift is observed in specific subsets of galaxies in the cluster and group populations when the CMDs and CSMDs are compared. In the two most massive clusters (A & B), what was already a reasonably tight colormagnitude relation has become an even tighter relationship between color and mass (though the average error in stellar mass is roughly seven times that of the average error). This phenomenon is particularly noticeable in cluster B, where the colorstellar-mass (CSM) relation is observed with virtually no scatter for over order of magnitude beginning at and extending to higher stellar mass. The low scatter of the RSGs observed in the CMDs and CSMDs of the two most massive Cl1604 clusters is typical of systems that have formed their RSGs at much earlier epochs (see Mei et al. 2009 and references therein). Another dramatic shift when comparing the CMDs and CSMDs occurs at the bright end of the red sequence in clusters A & B. While the bright ends of their red sequences look nearly identical, there exist significant disparities between the masses of these galaxies. In particular, the most massive [] RSGs that are observed in both cluster B and the group systems are largely absent in cluster A.
In the lower mass systems (cluster D and the groups) significant scatter is observed in the CSM relation for RSGs at nearly all masses. This scatter is the result of a large population of massive [] blue-cloud galaxies that have colors just blueward of the red sequence. This is a population that is virtually absent in the two most massive clusters. A comparison between bright blue-cloud galaxies () in the low-mass systems and the high-mass systems (clusters A & B) reveals a factor of two disparity in their average stellar masses, with bright blue-cloud galaxies in the low-mass systems being, on average, twice as massive. If we assume that rest-frame -band luminosity is roughly proportional to the SFR in blue-cloud galaxies (James et al. 2008), the bright blue-cloud galaxies in the two most massive clusters have optical specific star formation rates (SSFR) that are, on average, a factor of two higher than the analogous galaxy population in the low-mass systems. This will be investigated further in the next section.
In both the X-ray bright clusters (clusters A & B), as well as the low mass cluster and group systems, we do not observe the extremely massive RSGs [] that exist in local clusters (e.g., Stott et al. 2010). The most massive galaxy observed in the supercluster (a member of cluster B) is required to double its mass by to reproduce the mass of a typical BCG at low redshift. In clusters A & D this disparity is more pronounced. The most massive galaxies observed in these two systems are roughly a factor of 10 lower in stellar mass than typical low-redshift BCGs. Through these comparisons we are inherently assuming that the galaxy population of the Cl1604 clusters and groups are typical progenitors of the galaxy populations of modern clusters. However, the presence of a very massive [] BCG is a common occurrence in average, X-ray bright clusters at (Stott et al. 2010), suggesting that such galaxies are a consequence of a wide variety of formation histories. Thus, it is likely that most massive red galaxies observed at in the clusters and groups of the Cl1604 supercluster will experience significant buildup over the next Gyr. We will return to this point in §5.
4.5. Radial Distributions
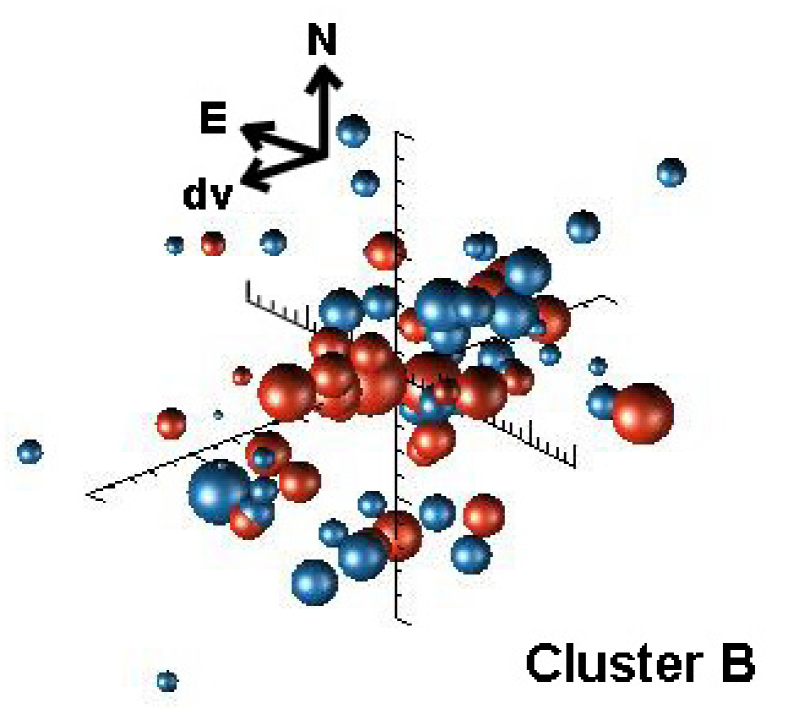
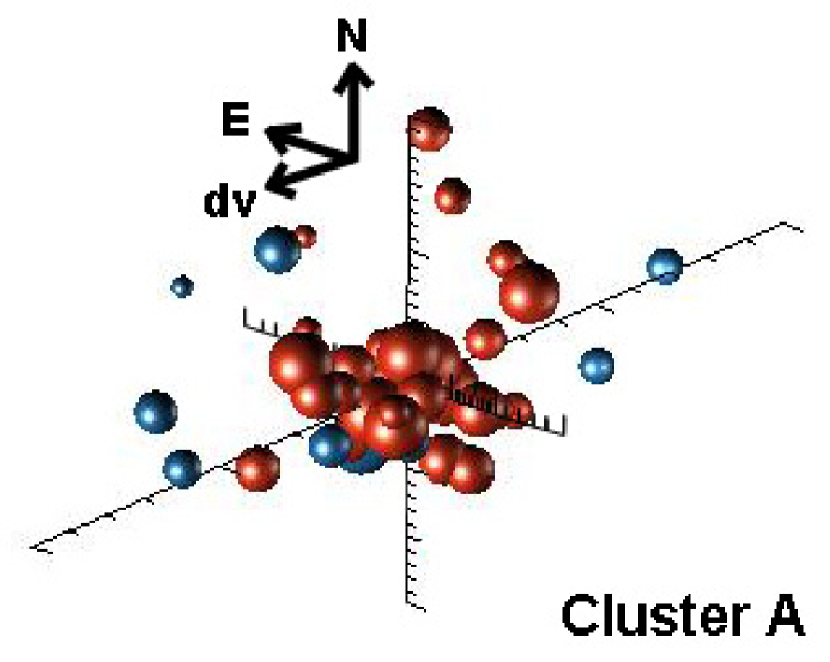
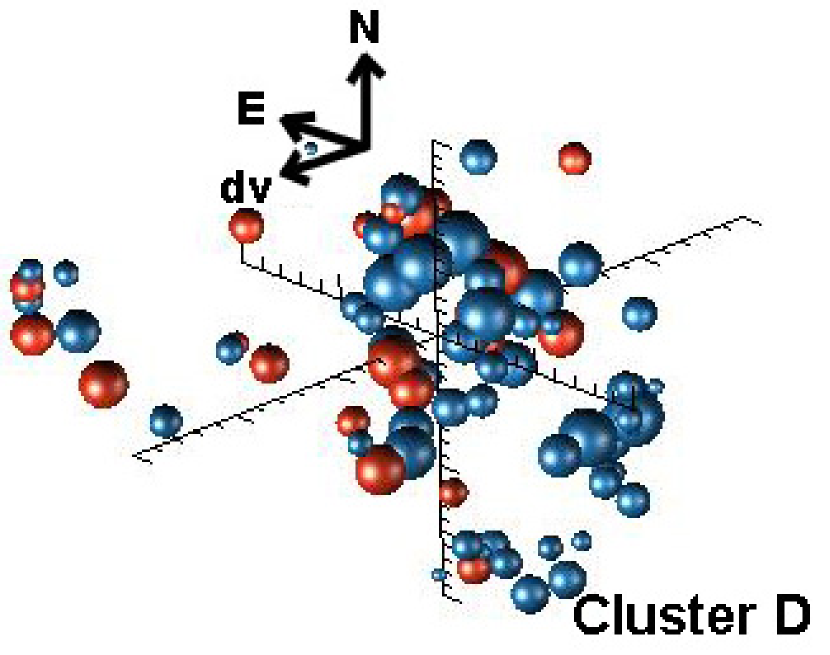
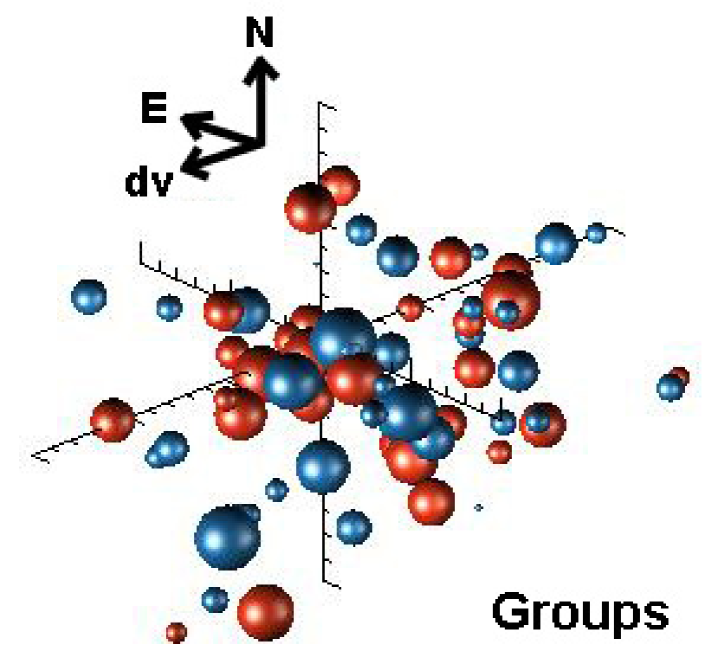
In this section we examine the radial distributions of galaxies in the Cl1604 clusters and groups. In Figure 9 we present a “three dimensional” plot of the member galaxies of each system. The two spatial dimensions are plotted (normalized by the virial radius of each system) and the third dimension is represented by the differential velocity of each galaxy with respect to the mean velocity of its parent cluster or group (normalized by the velocity dispersion of each system). Galaxies are separated into blue-cloud and RSGs following the definitions in §3.1.5. The size of each sphere is scaled linearly by the rest-frame B-band luminosity (see §4.3) of each galaxy. We will formally quantify the (projected) radial distributions of certain subsets of cluster and group galaxies in the various systems later in the section. Prior to that, however, Figure 9 provides us with a useful diagnostic to quickly assess the overall populations and dynamics of each system (or composite of systems in the case of the groups).
We begin this discussion with cluster A, the second most massive cluster in the Cl1604 complex, and the cluster that lies most securely on the optical-X-ray cluster scaling relations (Kocevski et al. 2009a; N. Rumbaugh et al. 2012, in preparation). Earlier we asserted that cluster A was the most relaxed of the Cl1604 clusters. From Figure 9 we can see that this is quite obviously the case; nearly all of the galaxies in the system are red and a large fraction of these lie at small (projected) radii and low differential velocities with respect to the cluster center. Nearly all of the blue galaxies (faint and luminous) are observed at either large projected radii or large velocity offsets. Considering cluster B and then cluster D, we see a clear trend in both the galaxy populations and the level of relaxation. Cluster D contains a galaxy population that is both the bluest (on average) and the least centrally concentrated of any of the Cl1604 clusters. In cluster B we see that, as in cluster A, a bulk of the faint blue-cloud galaxies lie at large clustocentric distances or velocity offsets (or both). In cluster D and the group systems this does not seem to be the case; faint blue galaxies are distributed relatively evenly, indistinguishable from the spatial and kinematic distributions of the general galaxy population. The spatial distribution of all constituent galaxies of cluster D is consistent with the interpretation of a large filamentary structure intersecting the cluster core (G08; K11). The Cl1604 group systems seem, on average, to be in an intermediate stage relative to clusters B & D in both their dynamical evolution and the evolution of their constituent galaxies. As in cluster A and to a lesser extent in clusters B & D, a large fraction of luminous RSGs in the group systems appear at low projected radii and small differential velocity.
We now discuss the projected radial distributions of both bright and massive red and blue galaxies in each system. As we will show later (§4.6), a large population of transition galaxies is observed in the Cl1604 groups and clusters. By analyzing and comparing the (projected) spatial distribution of different types of galaxies in each of the clusters and groups we can begin to discuss the nature of such transformations. In Figure 10 we plot the projected radial distributions of both luminous and massive blue-cloud members of the Cl1604 clusters and groups. As before, member galaxies of the five groups are combined to create a single composite population by normalizing the projected distance of each member galaxy by the virial radius of its parent group. Examining the radial distribution of bright888Since all of the Cl1604 systems are essentially at the same redshift, bright here, and throughout the paper, is equivalent to luminous. () blue-cloud galaxies in each system, we see that their distribution is generally consistent with that of the overall galaxy population. The only possible exception to this trend is cluster D, where bright blue members show preference towards lower clustocentric radii than the overall galaxy population, with no bright blue galaxies observed at radii greater than .
In the right panel of Figure 10 we plot the radial distributions of massive (as opposed to simply luminous) blue-cloud galaxies for the same systems. Immediately it is apparent that the number of massive blue-cloud galaxies in clusters A & B is considerably different than the bright blue population. Less than half of galaxies that comprised the bright blue galaxy population in clusters A & B are at high enough stellar mass to be considered in the right panel of Figure 10. This is best exemplified by the cumulative distribution of massive blue galaxies in cluster A, which is simply a single vertical line marking the location of the one massive blue cloud galaxy in the system. In contrast, the numbers of bright blue galaxies in cluster D and the groups are nearly identical to the number of massive blue galaxies in these systems. The radial distributions of the massive blue galaxies in clusters A & B also differ significantly from that of their bright counterparts. In cluster A there is only a single massive blue galaxy, meaning that nearly all of the bright blue-cloud galaxies in cluster A are at lower mass. In cluster B, massive blue galaxies tend to avoid the cluster core () and a majority of these galaxies are observed at large projected radii . Conversely, a large fraction (%) of bright blue galaxies in clusters A & B are located within the cluster core and a majority of these galaxies are situated within in both systems. These results imply that there exists a large population of bright, low-mass blue galaxies in the cores of the two most massive clusters in the Cl1604 supercluster. To supplement this analysis we have performed a Kolmogorov-Smirnov (KS) test to determine how similarly bright blue and massive blue galaxies are distributed (in projection) in cluster B999This same test is not performed in cluster A because only a single massive blue galaxy is present in this cluster.. The KS test confirms that the two distributions differ at % confidence level, further reinforcing the conclusions reached from our visual inspection. In the lower mass systems (cluster D and the groups), the distribution of massive and bright member galaxies is nearly identical, with a majority of both bright and massive blue cloud located within . Thus, the bright blue galaxies in the cores of the massive Cl1604 clusters have optical SSFRs that are considerably higher than both their counterparts at larger (projected) clustocentric radius and the analogous population in the lower mass cluster and group systems. The cores of these massive clusters appear to be active in regulating star formation of low-mass blue galaxies.
This result is in apparent contradiction to the findings of K11, where 24m bright starbursting cluster galaxies were preferentially found at larger projected radii from the cluster center. However, a large fraction of the low-mass bright blue galaxies considered here are not 24m bright, suggesting that whatever process is regulating star formation in blue galaxies in the cluster core is different than the process which is responsible for the dusty starburst population observed in the clusters. In K11, we suggested that merging or other galaxy-galaxy tidal interaction processes were largely responsible for the formation of dusty starbursts in the groups and cluster systems. Since these high SSFR blue cloud galaxies are observed largely in the inner regions of the most massive clusters, clusters which contain a hot ICM, it is likely that some cluster specific process is responsible for regulating star formation in this population.
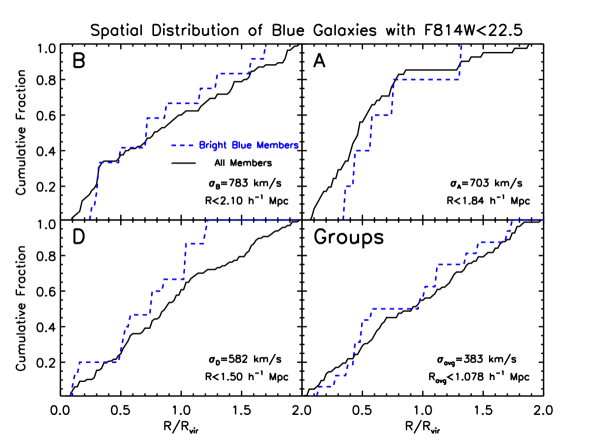
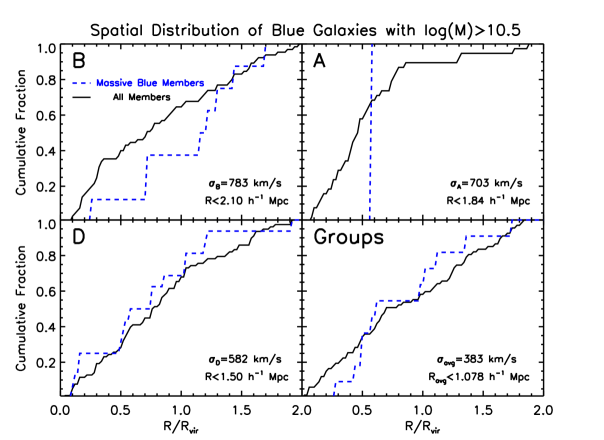
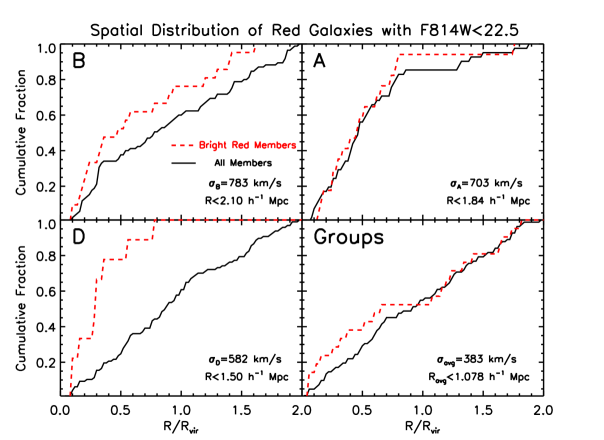
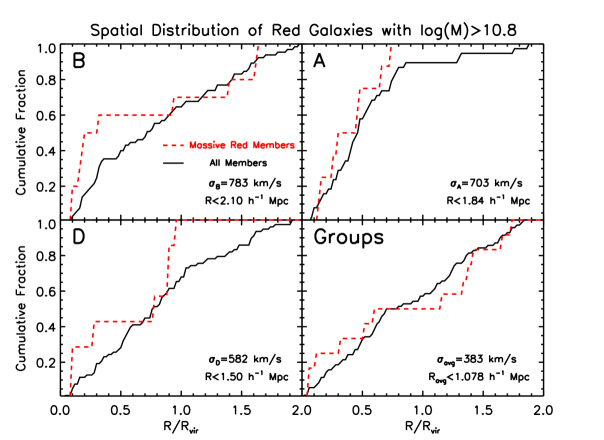
In Figure 11 we repeat this analysis for both bright and massive RSGs. The radial distributions of both the massive and bright RSGs confirm the general picture from Figure 9; a majority of the bright and massive RSGs in all systems are observed at low (projected) radii (i.e., ). In the group systems we observe a slow, continuous increase in the number of bright and massive RSGs out to . This is in contrast to the rapid increase in both bright and massive RSGs observed in cluster A to , past which there are essentially no such galaxies, highlighting the difference in the dynamical states of the two populations. With the exception of cluster D, the radial distributions of the bright red galaxies are nearly identical to those of the massive red galaxies, suggesting the red-sequence populations in the two most massive clusters and the low mass group systems have similar ratios. In cluster D, however, there is a significant difference in the radial distributions of bright red members relative to their massive analogues (confirmed by a KS test at % confidence level). While both populations are observed solely within , their radial distributions within the core of the cluster () are dramatically different. Nearly all (%) of the bright red population is observed within a projected radius of , while only % of the massive red population is contained within this radius. The bright galaxies in cluster D that are not observed in the radial distribution of massive red galaxies must be less massive than the mass limit of the plot [], and, by definition, have lower ratios than their counterparts in any of the other systems. Thus, there are a large number of bright, low-mass RSGs present in cluster D that are either still star forming or have formed stars in the past Gyr and have only recently transitioned to the cluster red sequence. We will discuss this population further in §5.
4.6. Mass-Morphology Properties
Thus far we have discussed the color, magnitude, mass, spectral, and radial properties of the member galaxies of the eight groups and clusters in Cl1604. While several conclusions have been reached from investigating these properties, open questions still remain regarding the nature of RSGs in the groups and cluster systems as well as the processes responsible for placing them on the red sequence. It is with these questions in mind that we explore in this section the morphological properties of member galaxies of the Cl1604 supercluster.
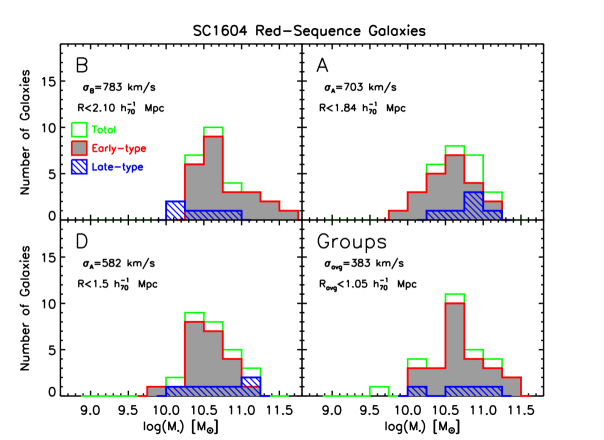
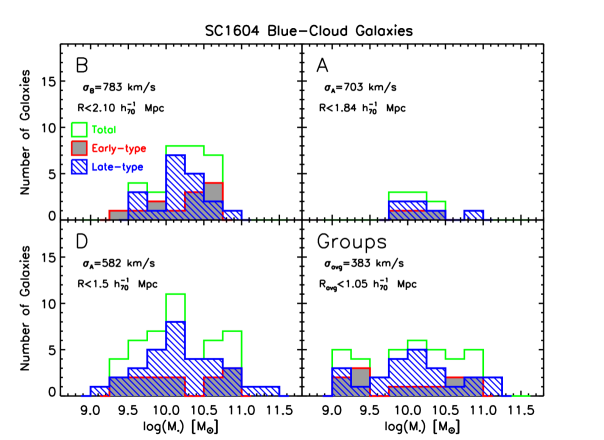
In Figure 12 we present mass histograms of late-type and early-type member galaxies for both the blue cloud and red sequence of each system (or composite systems in the case of group members). Recall that in our classification scheme, S0 galaxies are considered ETGs. Examining the red sequence mass histogram first (left panels), it is immediately clear that a majority of galaxies on the cluster and group red sequences are elliptical or S0 galaxies. In the previous section we discussed the possibility of that the group red sequence contained either a large number of dust-reddened starbursts or a large number of massive quiescent galaxies. The high fraction of ETGs present in the red sequence of the groups strongly favors the latter interpretation. Furthermore, in the study of K11 we found that only a small fraction (%) of ETGs in the groups are detected in at the starburst or luminous infrared galaxy (LIRG) level. These galaxies are also not likely to be forming stars at sub-starburst (i.e., “normal”) levels, as the average [O II] EW of the massive group red sequence population is consistent with no current star formation (see §5). Thus, it appears that the presence of massive, quiescent, ETGs is a common phenomenon in the Cl1604 groups, further reinforcing our previous claim that significant pre-processing is occurring in such environments.
In cluster environments a similar trend is observed; a majority of the RSGs have early-type morphologies. However, both in the group and cluster environment a small number of late-type galaxies are observed on the red sequence. A large fraction (76%) of these galaxies, as well as nearly all of the massive [] red-sequence late-type galaxies, are the 24m-bright dusty starburst galaxies studied in K11. The remaining population, which is primarily observed at lower stellar masses [-], is comprised of late-types that are not observed at 24m and have weak [O II] emission (SFR([O II]) yr-1, where the [O II] luminosity is measured using methods nearly identical to that of L10 and translated to an SFR using the relationship of Kennicutt et al. 2009). Because such galaxies are on the red sequence and not detected at 24m, and because there exists a strong correlation between SFR and the colors of dusty starbursts (in that systems with a higher SFR are redder, see K11), it is unlikely that these galaxies are lower luminosity analogs to the 24m-bright dusty starburst population, but are rather truly quiescent. Though rare in the Cl1604 supercluster, this red “passive disk” population is of particular interest, as it is thought to be one of the main progenitors of S0 galaxies that are found in large numbers in low-redshift clusters, and thus potentially representing an intermediate stage in the transformation of a star-forming late-type galaxy to a quiescent S0 (Moran et al. 2006, 2007; Bundy et al. 2010). We will return to consider this population later in the section.
In the right panel of Figure 12 we plot the mass histograms of early- and late-type systems for blue-cloud member galaxies. While the fraction and mass distribution of these galaxies changes dramatically from system to system, a large majority of such galaxies are late-type galaxies. Again, we observe a significant difference at the massive end of the blue-cloud galaxy mass function between the two most massive clusters (A and B) and the lower mass systems (cluster D and the groups); the large population of massive [] blue-cloud galaxies observed in cluster D and the groups are largely absent from clusters A and B. At all masses we also observe a non-trivial fraction of blue ETGs. The bulk of this population lies at a mass range identical to that of the passive disks discussed earlier and also at the mass range where the number counts of red-sequence ETGs begins to decrease dramatically. The stellar mass range of - seems to be an important threshold in group and cluster environments; a significant number of galaxies of this mass appear to be transforming from blue late-types into red ETGs at . This mass range is also roughly the stellar mass where a majority of the star formation takes place in blue-cloud galaxies and where a large fraction of the stellar mass is added to the RSG mass function from to (Bell et al. 2004).
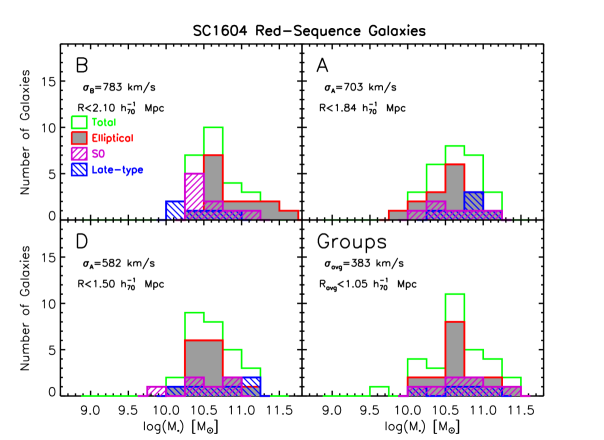
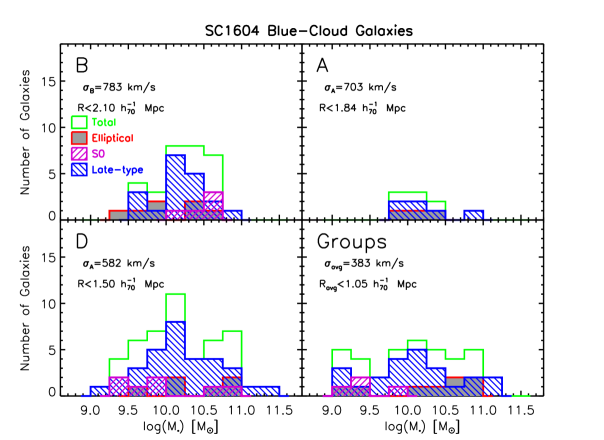
If we instead consider the two components of the ETG population, ellipticals and S0 galaxies, separately101010In some cases, discriminating between elliptical and S0 galaxies is extremely difficult, both in visual inspections and with statistical measurements. The number of ETGs in our sample is large enough to average out the ambiguities in the classification process (see §3.1.4), however, we urge the reader to keep in mind the difficulty of separating these populations when conclusions based on the differences in the two populations are presented., the evidence becomes somewhat clearer. As in Figure 12, Figure 13 shows mass histograms for red-sequence and blue-cloud galaxies. This time, however, we differentiate between elliptical and S0 galaxies. Considering again the stellar mass range of -, we observe an obvious trend in cluster B. Both the massive end of the blue cloud and the low-mass end of the red sequence (in both cases the same mass of ) are dominated by passive disks and S0 galaxies. Red ellipticals are found at higher stellar masses, while blue late-type galaxies are primarily at lower masses. These blue S0 galaxies are likely the progenitors of the more massive red sequence S0 galaxies in this system and will not re-assemble into star-forming late-types (as in Kannappan et al. 2009). This is a reasonable assumption given the plethora of quenching processes a galaxy is subject to in cluster environments. Since fading of the disk alone cannot create elliptical galaxies from disk galaxy populations (Faber et al. 2007), in cluster B it appears that the processes responsible for quenching star formation in a cluster galaxy largely occur prior to those responsible for morphologically transforming a passive disk or S0 into an elliptical, something that is also observed in the field and in intermediate density environments at (see Bolzonella et al. 2010 and references therein). If merging events are the primary mechanism responsible for morphologically transforming disk galaxies to ellipticals, as is generally thought the case (see, e.g., Hopkins et al. 2010), such mergers must either (i) occur once the S0 population is quenched and situated on the red sequence, or (ii) be directly or indirectly responsible for both the quenching and the morphological transformation of this population, with the morphological transformation occurring over a longer timescale than the quenching of star formation. While it has been shown that in field environments at merging activity is largely not responsible for quenching processes associated with populations transitioning onto the red sequence (Mendez et al. 2011), it is unclear whether such results extend to high-redshift group and cluster environments. It has also been suggested both in observational studies and in simulations that a two-stage process such as the possibility raised in i) may be favored to explain the transformation of star-forming late-types into quiescent ellipticals (see discussions in Sánchez-Blázquez et al. 2009 and Bundy et al. 2010). Though such questions are outside the scope of the current work, these topics will be the focus of a future study.
In the remaining systems the picture is somewhat different; ellipticals and S0 galaxies are observed at a large range of masses in both the red sequence and the blue cloud (with the exception of cluster A). Though the number of galaxies in each sub-population is somewhat small (i.e., 10-15 galaxies), the fractions of red, passive disk/S0 galaxies and blue elliptical galaxies with - in the two lower mass clusters and the group systems is nearly identical. If we assume that the progenitors of these galaxies are late-types, a reasonable assumption given that such galaxies comprise the bulk of field galaxies at (see, e.g., Scarlata et al. 2007), the relative number of blue ellipticals and red passive spiral/S0 galaxies in these systems suggests that in lower mass clusters and groups the quenching of star formation occurs prior to morphological transformation in only roughly % of cases.
It is not clear what exactly makes the morphological and color transformations of the constituent galaxies of cluster B different from those of the other clusters and groups. Cluster B is the only system in the supercluster which exhibits both a bright ICM and a galaxy population that is dynamically unrelaxed. It is possible that the confluence of these two physical conditions results in transformations that do not occur when only a dominant ICM (as in cluster A) or a dynamically unrelaxed galaxy population (as in cluster D) is present. However, a full characterization of the processes responsible in each case requires detailed analysis of the spectral properties of the cluster and group systems as a function of, e.g., clustocentric radius, as well as detailed analysis of the morphological properties of these transition populations. This will also be explored in a future study. What is clear, however, is that there appears to be a large population of transition galaxies in Cl1604 group and cluster environments at -. We will continue to discuss this population over the course of the following section.
5. The Buildup of the Red Sequence at
Throughout the previous sections we have approached the analysis of the Cl1604 member galaxies from a variety of different observational standpoints. The sheer amount of data presented in this paper on the supercluster member galaxies makes the task of drawing a cohesive picture of galaxy evolution within the supercluster environment somewhat daunting. As such, before going further in our discussion, we begin this section by highlighting those results from previous sections that are relevant to obtaining such a picture.
-
In §4.1 we discussed the color and magnitude properties of galaxies comprising the three clusters and five group systems in the Cl1604 complex, finding that the cluster and group environment is instrumental in creating bright red galaxies, but that significant variation exists in the fraction of red galaxies that comprise each cluster and group system.
-
In §4.2 we found again large variations in the spectral properties of average member galaxies of the Cl1604 groups, ranging from populations dominated by quiescent galaxies to galaxies largely comprised of starbursts. The average galaxy populations of the three cluster systems were, however, relatively homogeneous in their star-forming properties. The average cluster galaxy in each system was classified as a normal star-forming galaxy with an SFR at an level intermediate to an average field galaxy at and an average low-redshift cluster member.
-
In §4.3 a significant deficit of low-luminosity RSGs was observed in all systems. In cluster A, the most relaxed cluster in the Cl1604 supercluster, this deficit is seen to be significantly less than the deficit observed in the other Cl1604 systems. This result suggests that low-luminosity galaxies have largely not transitioned to the cluster or group red sequence at , but that the processing of such galaxies is beginning to occur in the environments of more advanced systems at these redshifts.
-
In §4.4 we determined that massive RSGs are observed in all clusters and the composite group population. The most massive RSGs are housed in the most massive Cl1604 cluster (cluster B) and, surprisingly, the group systems. The most massive galaxies observed in all systems are, however, less massive than typical BCGs by a factor of two or greater, suggesting that significant evolution will occur in such galaxies. In this section we also showed that a large population of high-mass, blue-cloud galaxies are observed in both cluster D and the groups systems. This population is largely absent in the two most massive clusters (clusters A & B). We also showed that the bright blue galaxies observed in clusters A & B had higher SSFRs than the analogous population observed in cluster D and the group systems.
-
In §4.5 we discussed the radial distributions of the galaxies comprising the Cl1604 cluster and composite group populations. These high SSFR blue-cloud galaxies observed in the two most massive clusters are found primarily at low projected clustocentric radius. In the lower mass systems (cluster D and the groups) we find the majority of both bright and massive blue cloud member galaxies are also observed at low clustocentric radius. The radial distribution of RSGs in these systems revealed a large population of unusually bright red galaxies in the core of cluster D.
-
Finally, in §4.6 we considered the morphology of red-sequence and blue-cloud galaxies that comprise the Cl1604 cluster and group systems. Several populations of “transition” galaxies were found in all systems at intermediate stellar masses [], though a majority of this population was observed in cluster B. These transition populations included passive spiral galaxies, blue and red S0s, and massive blue ellipticals.
We are now in a position to bring all our observational evidence to bear on the question of galaxy evolution in high-redshift clusters and groups. While it is important to note that the Cl1604 supercluster represents only one set of clusters and groups at high-redshift, we stress here that we are observing all of these systems at virtually the same epoch. In such a way, we are able to cleanly separate out redshift dependent galaxy evolution from galaxy evolution driven largely by environment.
| Stellar Mass RangebbRange of red-sequence galaxies included in each subsample. Only galaxies with well-defined (see §3.1.2) stellar masses are included. | EW([O II])ccOnly random errors are reported for EW([O II]), EW(H), and as incompleteness errors are negligible. | EW(H)ccOnly random errors are reported for EW([O II]), EW(H), and as incompleteness errors are negligible. | ||
|---|---|---|---|---|
| SubsetaaSubsets include only those galaxies brighter than that are within of the cluster/group center. | (Å) | (Å) | ccOnly random errors are reported for EW([O II]), EW(H), and as incompleteness errors are negligible. | |
| Cluster A | 5.750.29 | 2.220.25 | 1.593 0.010 | |
| Cluster B | 2.520.25 | 2.920.20 | 1.646 0.010 | |
| Cluster B low- | 1.030.54 | 3.140.38 | 1.4450.023 | |
| Cluster D | 7.050.46 | 2.250.28 | 1.3650.016 | |
| GroupsddMeasurements made a composite spectrum comprised of all Cl1604 group galaxies | 1.670.23 | 1.250.20 | 1.7030.009 | |
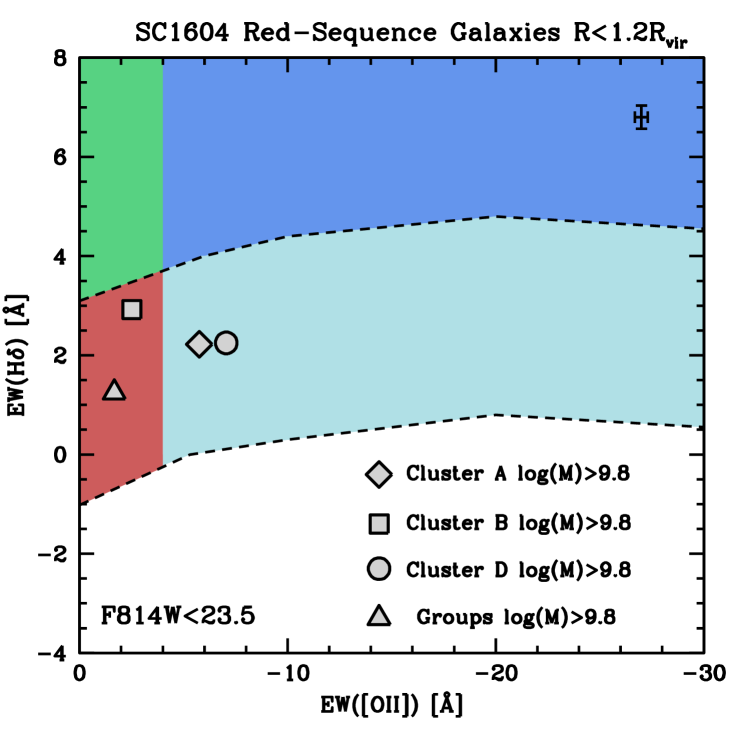
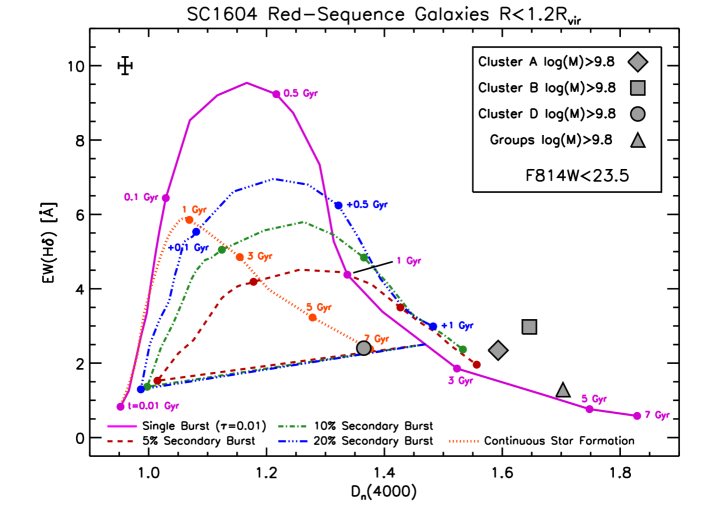
We begin by focusing on the properties of the galaxies in each system that have already transitioned to the red sequence at . In Figure 14 we plot average spectral properties of certain subsets of Cl1604 RSGs against measurements made from solar-metallicity synthetic spectra (Bruzual 2007) with a variety of different SFHs. Each synthetic spectra is “extincted” using a Calzetti et al. (2000) reddening law and an , approximately equal to the average of both red-sequence and blue-cloud members estimated using our SED fitting. Plotted are EW([O II]), EW(H), and measured from composite spectra of RSGs in each cluster and the combined group sample that are within and brighter than . The projected radial limit is chosen in order to minimize contamination from galaxies at large projected radii that may have had no interaction with the central regions of the group/cluster and that are dynamically removed from the central regions by Gyr. Additionally, the majority of all galaxies in both the red-sequence galaxies considered here and the blue-cloud galaxies considered later are within this radius in all systems. The magnitude limit ensures that any effects from completeness are minimal when making our comparisons.
The spectral properties of the observed RSGs in clusters A & B (filled diamond and square, respectively) are broadly consistent with the conclusions reached in other sections: the average RSG in the two most massive clusters is consistent with forming through a single burst at . The significantly elevated EW(H) of the average RSG in cluster B suggest that at least some of these galaxies have had recent ( Gyr) star formation activity. In §4.6 we suggested that this population was largely comprised of low-mass galaxies on the red sequence. We confirm that suggestion here; a composite spectrum comprised of only low-mass [] RSGs at in cluster B reveals a relatively young stellar population with recent (i.e., Gyr) star formation [; EW(H)=3.14Å]. In the most massive cluster in the Cl1604 supercluster low-mass galaxies have only recently arrived on the red-sequence. In cluster A this does not seem to be the case. The composite spectrum of a similar population of RSGs in cluster A reveals even the lowest-mass RSGs in this system have, on average, moderately old (i.e., Gyr) stellar populations [].
In the group systems the picture is largely similar. Red-sequence galaxies in group environments (filled triangle) have the oldest average stellar population of any population in the supercluster, consistent with a formation epoch of . However, in contrast with cluster B, we observe no significant excess of EW(H) for the average group RSG relative to the single burst model plotted in the right panel of Figure 14. This suggests that, unlike cluster B (and to a lesser extent cluster A), there are essentially no new arrivals to the group red sequence in the last Gyr. While significant pre-processing has obviously occurred in these systems prior to , as evidenced by the large number of bright and massive galaxies observed in the groups, it appears that RSGs in group environments are largely in place at early times.
In cluster D the average RSG (filled circle) has a much smaller than the analogous population of any of the other systems. In §4.5 we discussed a large population of unusually bright RSGs in the core of cluster D. The observed EW([O II]), EW(H), and values of cluster D RSGs imply that this population has low residual levels of star formation and is comprised of relatively young stellar populations. This strongly suggests that the red-sequence galaxies in the center of cluster D, which includes nearly all of the most massive galaxies in the system, have only recently transitioned onto the red sequence. Values of EW([O II]), EW(H), and for each of the red-sequence samples discussed here are given in Table 4.
| Stellar Mass RangeaaRange of blue-cloud galaxies included in each subsample. Only galaxies with well-defined (see text) stellar masses are included. | EW([O II])bbOnly random errors are reported for EW([O II]), EW(H), and (see text). | EW(H)bbOnly random errors are reported for EW([O II]), EW(H), and (see text). | ||
|---|---|---|---|---|
| SubsetccSubsets include only those galaxies brighter than that are within of the cluster/group center. | (Å) | (Å) | bbOnly random errors are reported for EW([O II]), EW(H), and (see text). | |
| Cluster A All Masses | 13.900.91 | 6.150.74 | 1.250 0.023 | |
| Cluster B All Masses | 16.290.47 | 3.030.30 | 1.342 0.010 | |
| Cluster D high- | 8.040.47 | 3.750.31 | 1.3420.011 | |
| Cluster D low- | 24.031.03 | 4.520.81 | 1.0510.019 | |
| GroupsddMeasurements made a composite spectrum comprised of all Cl1604 group galaxies high- | 8.780.18 | 6.150.20 | 1.1120.005 | |
| GroupsddMeasurements made a composite spectrum comprised of all Cl1604 group galaxies low- | 13.270.58 | 5.140.81 | 1.2080.017 | |
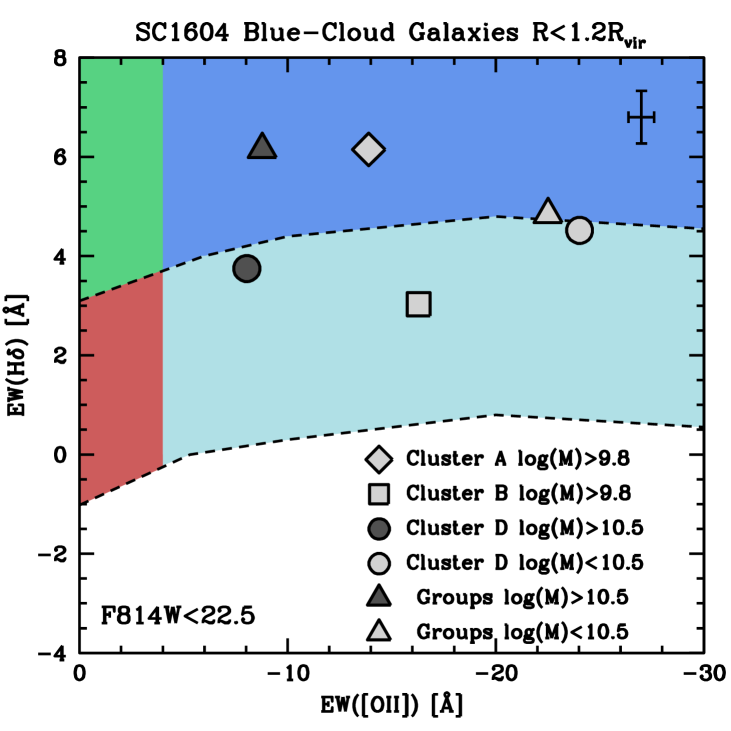
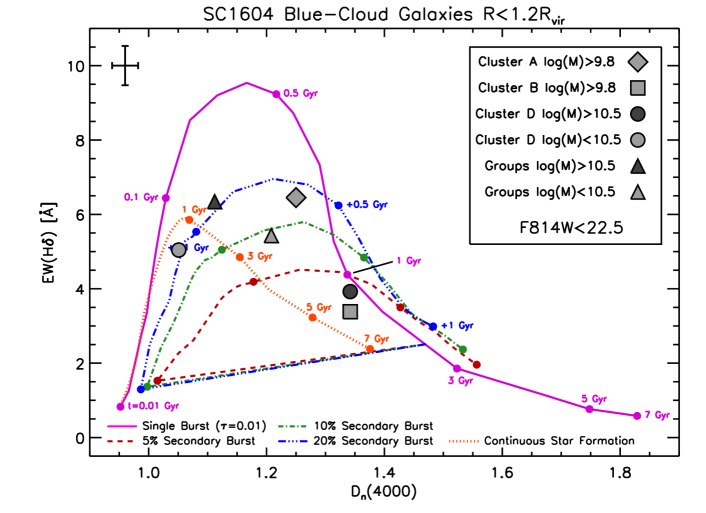
If the picture we have given so far is correct, the progenitors of galaxies recently transitioning onto the cluster red sequence should be observable in the cluster galaxy populations. The two main galaxy populations for which we have the most evidence of these transitions are the moderate- to high-mass red galaxies in cluster D and the low- to moderate-mass red galaxies in cluster B. In Figure 15 we plot the spectral properties of composite spectra generated from various subsets of blue galaxies within and in the group and cluster environments. These limits are again chosen to minimize contamination from field galaxies and spectroscopic completeness effects for cluster and group blue-cloud galaxies. Table 5 also lists the composite spectral properties for this and other blue-cloud populations considered in this section. Bright, massive [] blue-cloud galaxies in the center () of cluster D (dark filled circle) share almost identical properties with the red-sequence population in cluster D. Of the blue-cloud populations observed in the supercluster, the bright, massive blue-cloud galaxies in cluster D have on average both the second highest and the second lowest EW(H) values. In fact, the of such galaxies in the center of cluster D is consistent with being identical to that of the average cluster D RSG. While the stellar mass and brightness limits differ between the blue-cloud and red-sequence galaxies being considered, it is not necessary for this analysis that they be the same, as we are comparing this blue-cloud population to the average cluster D RSG. Thus, these results strongly suggest that bright, massive blue-cloud galaxies at the center of cluster D are in the process of transitioning on to the red sequence at . There is some concern that a large population of dusty starburst galaxies, as is observed in cluster D (see K11), could artificially inflate the value, causing the average stellar population to appear artificially older. However, in K11 we determined that the majority of the 24m-bright galaxies observed in the center of the Cl1604 clusters are decaying in their starburst activity, consistent with these results.
In contrast to the analogous population in cluster D, the average and EW values of the bright, massive blue-cloud galaxies in the group systems (dark filled triangle) reveal a starbursting population that is very young. Even with the instant cessation of star-formation activity, it would require Gyr to move these galaxies onto the group red sequence. This result is consistent with the results of K11, in which we found that 24m-bright starbursting galaxies were comprised of extremely young stellar populations. It appears that bright, massive blue-cloud galaxies in the group systems are generally not transitioning to the red sequence at .
The bright, massive blue-cloud population observed in cluster D and the groups is largely absent in clusters A & B. Assuming these clusters were formed from progenitors with similar galaxy populations to cluster D and the groups, the processing of massive blue-cloud galaxies that is occurring in cluster D at must have occurred at earlier times in the two most massive Cl1604 clusters. Since such galaxies do not exist in the two most massive Cl1604 clusters, we now consider instead the progenitors of the low- to moderate-mass galaxies that recently transitioned onto the red sequence in cluster B. In Figure 15 we show the average spectral properties of the all bright blue-cloud galaxies in cluster B that have well-defined stellar masses [; light filled square]. The stellar mass limit here, and for blue-cloud galaxies in cluster A, differs from the limit imposed on cluster D galaxies due to the lack of massive blue galaxies in clusters A & B discussed earlier. While we include the few blue-cloud galaxies in clusters A & B in this analysis with , the bulk of the population considered is comprised of the bright, high-SSFR galaxies discussed in §4.4 and §4.5, which share similar color and mass properties with the low- to moderate-mass RSGs in cluster B. From the moderately high levels of [O II] emission seen in the left panel of Figure 15 we confirm the results of the §4.4; this population has, on average, higher optical SFRs and SSFRs than the massive blue galaxies observed in cluster D or the group systems.
However, the right panel of Figure 15 presents a significantly different picture. The bright, moderate-mass blue cloud galaxies in cluster B have the both the highest and the lowest EW(H) values of any blue-cloud population considered in the supercluster. Both values are nearly identical to those measured from the composite spectra of the lower-mass RSGs in the cluster, suggesting that bright, low- to moderate-mass blue galaxies at the center of cluster B appear to be transitioning to the red sequence at . In cluster D and the group systems, this is not the case for similar mass galaxies. The bright, moderate-mass []111111While this is not the same mass limit as is used for cluster B, the average mass of the bright, moderate-mass blue-cloud galaxies in cluster D and the groups using this limit is nearly identical to the [] blue-cloud population considered in cluster B. blue-cloud populations in these systems (light filled circle and triangle, respectively) are comprised, on average, of young stellar populations with significant ongoing star-formation activity. In cluster A there exist only four analogous galaxies (light filled diamond), two of which are the decaying 24m-bright starbursts discussed earlier in the section. Thus, the paucity of bright, blue intermediate-mass galaxies in the center of cluster A suggests that much of the processing that is occurring in cluster B at occurred in cluster A at early times. This is further evidenced by the relatively old stellar populations in the low-mass RSGs and the smaller observed deficit of low-luminosity RSGs in cluster A as was discussed in §4.3.
We have now presented a picture in which the characteristic mass transitioning on to the group or cluster red sequence at is highly dependent on the environment in which that galaxy resides. In all systems (perhaps with the exception of cluster D) it appears that early quenching is important in building up the red sequence at early times. However, late quenching of cluster or group blue-cloud galaxies also appears to be prevalent in these environments at . In the most relaxed and isolated system in the supercluster (cluster A), both low-mass and high-mass galaxies have largely been processed and moved on to the cluster red sequence prior to . In the slightly more massive and slightly less relaxed cluster B, this processing appears to have occurred for high-mass blue-cloud galaxies, but is only just beginning to occur at for moderate-mass [] blue galaxies. In the lower mass cluster D, a cluster shown in §4.5 to be extremely unrelaxed, we observe the late quenching of massive [] blue-cloud galaxies in the cluster center. The moderate-mass [] blue-cloud galaxies in cluster D, however, seem generally unaffected by the quenching processes and are likely still several Gyr from transitioning to the cluster red sequence. In the low-mass group systems the red sequence has been built up significantly by , but this buildup appears to have primarily occurred at early times (). Both the high-mass [] and moderate-mass [] blue-cloud populations in the group systems appear several Gyr from evolving into quiescent RSGs.
The process known as downsizing (Cowie et al. 1991, 1996), in which galaxies at fainter magnitudes (i.e., lower mass) are found to transition on to the red sequence at later epochs than their brighter (i.e., higher mass) counterparts, is a process that is thought to be broadly independent of environmental effects (see, e.g., Bundy et al. 2006). The picture we present here is in direct conflict with this claim. Since all the systems in the Cl1604 supercluster are observed at virtually the same epoch, any effect that changes typical “quenching mass” (, i.e., the mass of a typical blue-cloud galaxy that is transitioning on to the red sequence) in the various Cl1604 systems must be largely due to environmental effects. From our data it appears, however, that the mass of the cluster or group potential is not the key quantity in determining the typical for a given system. Rather, it appears that the global dynamical state of the group or cluster system is the primary determinant in setting the quenching mass in each system. Instead of traditional (redshift-dependent) downsizing, in the Cl1604 supercluster we are observing dynamical downsizing, in which massive blue-cloud galaxies are quenched earliest in the massive, relaxed clusters and the quenching of higher mass blue-cloud galaxies occurs at progressively later times in lower mass and less relaxed clusters and groups. This picture of dynamical downsizing is consistent with the study of Baldry et al. (2006), in which the fraction of - galaxies observed on the red sequence at was found to be a strong function of environment.
Despite the wide variation in the formation history of RSGs in Cl1604, galaxies with the characteristics of BCGs observed in relaxed clusters at appear to be missing from all of the systems. These characteristics include extremely large stellar masses [; Stott et al. 2010], extremely high visual luminosities [; Ascaso et al. 2011], and large offsets in magnitude from the second brightest cluster galaxy [; Smith et al. 2010; Ascaso et al. 2011]. As noted in §4.4, BCGs with these properties are common in low-redshift clusters, suggesting a large variety of cluster progenitors at result in relaxed clusters dominated by BCGs. If we assume that the groups and clusters of the Cl1604 supercluster are the progenitors of a “typical” low-redshift cluster, significant evolution of the Cl1604 high-mass RSGs between and is required121212In fact, both the brightest and most massive galaxies in cluster D as well as the the brightest galaxy in cluster A are spirals, strongly hinting that significant evolution of the BCG will occur in these systems between and the present day.. At the most massive RSGs in the Cl1604 systems range from to . If the BCGs in modern day clusters are built from such galaxies, then these galaxies must more than double their mass from to . This scenario is in good agreement with the simulations of De Lucia & Blaizot (2007) and the observations of Aragón-Salamanca et al. (1998), in which it was found that 50-80% of the mass of BCGs is assembled between and (but see also Stott et al. 2010, 2011 for an opposing view).
This result is somewhat surprising given the early formation epoch of the average RSG in clusters A & B and the group systems. If these galaxies were in place at an early epoch, there seems to be no reason why the assembly process should be so vigorous between and but languid at higher redshifts. However, our data does not preclude the possibility of early dry mergers, in which two gas-depleted galaxies of roughly equal age merge into a single galaxy. Indeed, the old stellar populations observed in low-redshift BCGs favors a scenario in which the most massive galaxies observed at accrete mass through dry mergers or in mixed mergers with low mass ratios. Additionally, it has been shown that dry mergers are known to become more frequent at later times (Lin et al. 2008) and that merging occurs more frequent and generally involves both more massive galaxies and higher merger mass ratios in high density environments (see, e.g., McIntosh et al. 2008; de Ravel et al. 2011). Thus, it seems reasonable to appeal to dry merging processes to buildup the massive end of the cluster red sequence from to (though see Kaviraj et al. 2011 for an alternative view of ETG mass buildup involving mixed minor merging). Such a scenario is also supported by the studies of Bell et al. (2006a,b), who found that a majority of both massive and luminous galaxies have experienced a merger over the last Gyr. Preliminary analysis of the most massive galaxies in each of the Cl1604 cluster systems also supports this scenario. Each of the most massive galaxies in clusters A, B, & D has at least one other nearly equal mass companion within a small projected radius ( kpc) and at a small differential velocity ( km s-1). This result is suggestive of such galaxies eventually merging to create galaxies with similar masses to BCGs (as in, e.g., Tran et al. 2008; Jeltema et al. 2008). This result will be explored further in a future paper (Ascaso et al. 2012, in preparation). For now, we simply state here that our data is broadly consistent with a scenario in which the most massive RSGs gain mass through dry merging processes. Taken as a whole, the picture presented in this section is consistent with the “mixed” galaxy evolution scenario favored by Faber et al. (2007), in which galaxies on the red sequence transition there through both early and late quenching processes and buildup mass through dry mergers.
The relative importance of these early and late quenching processes seems, however, to vary greatly from system to system in the Cl1604 supercluster. While the mass of the typical galaxy affected by late quenching processes correlates well with the global dynamical state of a system, the efficiency of early quenching does not seem to correlate well with either the global dynamical state or the optically derived mass of the system. In all systems it appears that dry merging or minor mixed merging likely plays a significant role in building up the mass of the BCG from to , but it is unclear how important such processes are in the mass evolution of low- to intermediate-mass RSGs. To fully characterize the relative importance of quenching and merging processes at , as well as to investigate the physical mechanisms responsible for these processes, it is necessary to study a statistical sample of high-redshift groups and clusters. In a future paper we will use the full ORELSE sample, consisting of over 40 high-redshift group and cluster systems, to investigate these questions.
6. Summary and Conclusions
In this paper we studied the properties of the 525 spectroscopically confirmed members of the Cl1604 supercluster at , focusing in particular on the 305 member galaxies of the eight clusters and groups that comprise the supercluster. With this spectroscopic sample, unprecedented for large scale structures at this redshift, we explored the magnitude, color, stellar mass, spectral, morphological, and radial properties of cluster and group galaxies at . Through this exploration we gained a cohesive picture of galaxy evolution and the buildup of the red sequence in the Cl1604 supercluster. Our main conclusions are:
-
Considering the color and magnitude properties of the Cl1604 members, we found that a large fraction of the RSGs (and nearly all of the bright ones) are contained within the group and cluster environments. The red-sequence fraction of both the cluster and composite group populations is 47%, compared with only 23% in the supercluster “field”. Many bright RSGs are observed in several of the group systems, suggesting significant pre-processing is occurring in these environments at .
-
Measuring the composite spectral properties of member galaxies of the Cl1604 clusters, we found the average cluster galaxy at exhibited features indicative of a star-forming galaxy, forming stars at a level roughly between field galaxies at and cluster galaxies at . While the average galaxy in the groups of the Cl1604 supercluster exhibited a large variety of spectral properties, combining all group galaxies in to a single population, we found that the average group galaxy at was undergoing a starburst.
-
An analysis of the red-sequence LF of the member galaxies of the three Cl1604 clusters and a composite population of the member galaxies of the five Cl1604 groups (i.e., the “groups” sample) revealed differences in the number of bright galaxies in each of the systems. Bright () red galaxies were observed in the two most massive clusters (A & B) as well as the groups. However, such galaxies were noticeably absent from the least massive cluster (cluster D). We also observed a significant deficit of low-luminosity () red-sequence galaxies in all systems except the most relaxed cluster of the Cl1604 supercluster (cluster A), suggesting that low-luminosity galaxies have largely not transitioned onto the red sequence by .
-
While bright blue galaxies are observed in all systems, massive () blue galaxies are observed almost exclusively in cluster D and the groups. The few massive blue galaxies that belong to the galaxy population in cluster B tend to avoid the cluster core. The bright blue galaxies observed in the two most massive Cl1604 clusters (A & B) are primarily low-mass galaxies at low clustocentric radii. This population has an average SSFR considerably higher than the low-mass galaxies observed in cluster D and the groups, suggesting that the cores of these massive clusters are inducing star formation in such galaxies.
-
A large fraction of brightest and most massive RSGs in the Cl1604 cluster systems are observed at low clustocentric radii. In the group systems, massive and bright RSGs are observed in a continuous distribution out to a projected distance from the group centers. A large population of bright, lower mass [] RSGs is observed at the center of cluster D, suggestive of a population that has recently transitioned onto the cluster red sequence.
-
A large fraction of the RSGs observed in both the clusters and groups was found to be morphologically early type. Transitional populations of red passive disks and blue ETGs are observed in differing amounts in all systems, primarily in the stellar mass range -, suggesting that this mass range is instrumental in the buildup of the red sequence at . In cluster B we found that galaxies transitioning to the red sequence were quenched of their star formation largely prior to their morphological transformation. In the lower mass cluster and the group systems the quenching of star formation was found to occur prior to morphological transformation for only % of transitional galaxies.
-
The average stellar populations of RSGs within of the two most massive Cl1604 clusters are broadly consistent with formation through a single burst of star formation at . Surprisingly, the average stellar population of the group RSGs within of the group centers are found to be consistent with formation through a single burst at even higher redshifts (). In contrast, the average red galaxy in the cluster D, the least massive Cl1604 cluster, is found to have only recently transitioned on to the cluster red sequence.
-
Massive cluster galaxies [] with properties similar to those observed in BCGs at are absent from all Cl1604 clusters and groups at . We suggest that either dry merging or minor mixed merging may be important in building up such galaxies from to . This topic will be the subject of a future study.
-
Galaxies transitioning on to the red sequence were found to be at significantly different masses in each of the cluster and group systems in the Cl1604 supercluster. Furthermore, this mass was found to correlate well with the dynamical state of the system, in that the typical mass of such a galaxy decreased with increased virialization. We presented evidence for “dynamical downsizing”, a process in which massive blue cloud galaxies are quenched earliest in the most dynamically relaxed systems and at progressively later times in dynamically unrelaxed systems.
While this work represents only a case study of galaxy evolution in dense environments at , it is important to note that the supercluster structure contains three clusters and five groups at essentially a single epoch. Furthermore, the Cl1604 clusters and groups are largely isolated from one another and are in very different stages of assembly. Though we stress that conclusions drawn from a study of a single structure or even several groups and clusters at high redshift are limited in their capacity to constrain the processes governing galaxy evolution, the comprehensive dataset available for this system has allowed us to study the galaxy population in this particular collection of groups and clusters in great detail. In future work we will extend this analysis to the remaining 19 ORELSE fields, minimizing the effects of cosmic variance and allowing us to study galaxy evolution in a statistical sample of groups and clusters at high redshift.
We thank Jeff Newman and Michael Cooper for guidance with the spec2d reduction pipeline and for the many useful suggestions and modifications necessary to reduce our DEIMOS data. We also thank Adam Stanford, Begoña Ascaso, and an anonymous referee for their careful reading of the manuscript and for several useful suggestions. B.C.L also thanks both Daisys for being supportive and patient throughout the entire process of this work, even when it was not deserved. We also thank the Keck II support astronomers for their dedication, knowledge, and ability to impart that knowledge to us at even the most unreasonable of hours. Support for this research was provided by the National Science Foundation under grant AST-0907858. In addition, we acknowledge support from program number HST-GO-11003 which was provided by NASA through a grant from the Space Telescope Science Institute, which is operated by the Association of Universities for Research in Astronomy, Incorporated, under NASA contract NAS5-26555. Portions of this work are also based in part on observations made with the Spitzer Space Telescope, which is operated by the Jet Propulsion Laboratory, California Institute of Technology under a contract with NASA. Support for this work was provided by NASA through an award issued by JPL/Caltech. The spectrographic data presented herein were obtained at the W.M. Keck Observatory, which is operated as a scientific partnership among the California Institute of Technology, the University of California, and the National Aeronautics and Space Administration. The Observatory was made possible by the generous financial support of the W.M. Keck Foundation. We wish to thank the indigenous Hawaiian community for allowing us to be guests on their sacred mountain; we are most fortunate to be able to conduct observations from this site.
References
- Adelman-McCarthy et al. (2007) Adelman-McCarthy, J. K., et al. 2007, ApJS, 172, 634
- Andreon (2006) Andreon, S. 2006, MNRAS, 369, 969
- Andreon (2008) Andreon, S. 2008, MNRAS, 386, 1045
- Aragón-Salamanca et al. (1998) Aragón-Salamanca, A., Baugh, C. M., & Kauffmann, G. 1998, MNRAS, 297, 427
- Arnouts et al. (1999) Arnouts, S., Cristiani, S., Moscardini, L., Matarrese, S., Lucchin, F., Fontana, A., & Giallongo, E. 1999, MNRAS, 310, 540
- Ascaso et al. (2011) Ascaso, B., Aguerri, J. A. L., Varela, J., Cava, A., Bettoni, D., Moles, M., & D’Onofrio, M. 2011a, ApJ, 726, 69
- Ascaso et al. (2012) Ascaso, B., et al. 2012, in prep
- Bai et al. (2010) Bai, L., Rasmussen, J., Mulchaey, J. S., Dariush, A., Raychaudhury, S., & Ponman, T. J. 2010, ApJ, 713, 637
- Baldry et al. (2006) Baldry, I. K., Balogh, M. L., Bower, R. G., Glazebrook, K., Nichol, R. C., Bamford, S. P., & Budavari, T. 2006, MNRAS, 373, 469
- Balogh et al. (1999) Balogh, M. L., Morris, S. L., Yee, H. K. C., Carlberg, R. G., & Ellingson, E. 1999, ApJ, 527, 54
- Balogh et al. (2009) Balogh, M. L., et al. 2009, MNRAS, 398, 754
- Balogh et al. (2011) Balogh, M. L., et al. 2011, MNRAS, 412, 2303
- Bell et al. (2004) Bell, E. F., et al. 2004, ApJ, 608, 752
- Bell et al. (2006a) Bell, E. F., et al. 2006, ApJ, 640, 241
- Bell et al. (2006b) Bell, E. F., Phleps, S., Somerville, R. S., Wolf, C., Borch, A., & Meisenheimer, K. 2006, ApJ, 652, 270
- Bernardi et al. (2003) Bernardi, M., et al. 2003, AJ, 125, 1849
- Bertin & Arnouts (1996) Bertin, E., & Arnouts, S. 1996, A&AS, 117, 393
- Biviano et al. (2006) Biviano, A., Murante, G., Borgani, S., Diaferio, A., Dolag, K., & Girardi, M. 2006, A&A, 456, 23
- Blanton et al. (2005) Blanton, M. R., Eisenstein, D., Hogg, D. W., Schlegel, D. J., & Brinkmann, J. 2005, ApJ, 629, 143
- Bolzonella et al. (2010) Bolzonella, M., Kovač, K., Pozzetti, L., et al. 2010, A&A, 524, A76
- Bower et al. (1992) Bower, R. G., Lucey, J. R., & Ellis, R. S. 1992, MNRAS, 254, 601
- Brinchmann et al. (2004) Brinchmann, J., Charlot, S., White, S. D. M., Tremonti, C., Kauffmann, G., Heckman, T., & Brinkmann, J. 2004, MNRAS, 351, 1151
- Bruzual & Charlot (2003) Bruzual, G., & Charlot, S. 2003, MNRAS, 344, 1000
- Bruzual (2007) Bruzual, G. 2007, in ASP Conf. Ser. 374, From Stars to Galaxies: Building the Pieces to Build Up the Universe, ed. A. Vallenari, R. Tantalo, L. Portinari, & A. Moretti (San Francisco, CA: ASP), 303
- Bundy et al. (2006) Bundy, K., et al. 2006, ApJ, 651, 120
- Bundy et al. (2010) Bundy, K., et al. 2010, ApJ, 719, 1969
- Burstein et al. (1984) Burstein, D., Faber, S. M., Gaskell, C. M., & Krumm, N. 1984, ApJ, 287, 586
- Butcher & Oemler (1984) Butcher, H., & Oemler, A., Jr. 1984, ApJ, 285, 426
- Calzetti et al. (2000) Calzetti, D., Armus, L., Bohlin, R. C., Kinney, A. L., Koornneef, J., & Storchi-Bergmann, T. 2000, ApJ, 533, 682
- Carlberg et al. (1997) Carlberg, R. G., Yee, H. K. C., & Ellingson, E. 1997, ApJ, 478, 462
- Casali et al. (2007) Casali, M., Adamson, A., Alves de Oliveira, C., et al. 2007, A&A, 467, 777
- Chabrier (2002) Chabrier, G. 2003, PASP, 115, 763
- Ciliegi et al. (2005) Ciliegi, P., et al. 2005, A&A, 441, 879
- Coe et al. (2006) Coe, D., Benítez, N., Sánchez, S. F., Jee, M., Bouwens, R., & Ford, H. 2006, AJ, 132, 926
- Cooper et al. (2006) Cooper, M. C., et al. 2006, MNRAS, 370, 198
- Cooper et al. (2007) Cooper, M. C., et al. 2007, MNRAS, 376, 1445
- Cooper et al. (2008) Cooper, M. C., et al. 2008, MNRAS, 383, 1058
- Cowie et al. (1991) Cowie, L. L., Songaila, A., & Hu, E. M. 1991, Nature, 354, 460
- Cowie et al. (1996) Cowie, L. L., Songaila, A., Hu, E. M., & Cohen, J. G. 1996, AJ, 112, 839
- Crawford et al. (2009) Crawford, S. M., Bershady, M. A., & Hoessel, J. G. 2009, ApJ, 690, 1158
- Cucciati et al. (2010) Cucciati, O., et al. 2010, A&A, 524, A2
- Davis et al. (2003) Davis, M., et al. 2003, Proc. SPIE, 4834, 161
- Davis et al. (2007) Davis, M., et al. 2007, ApJ, 660, L1
- De Lucia et al. (2004) De Lucia, G., et al. 2004, ApJ, 610, L77
- De Lucia et al. (2007) De Lucia, G., et al. 2007, MNRAS, 374, 809
- De Lucia & Blaizot (2007) De Lucia, G., & Blaizot, J. 2007, MNRAS, 375, 2
- de Ravel et al. (2011) de Ravel, L., et al. 2011, arXiv:1104.5470
- Dressler & Shectman (1988) Dressler, A., & Shectman, S. A. 1988, AJ, 95, 284
- Dressler et al. (1999) Dressler, A., Smail, I., Poggianti, B. M., Butcher, H., Couch, W. J., Ellis, R. S., & Oemler, A., Jr. 1999, ApJS, 122, 51
- Dressler et al. (2004) Dressler, A., Oemler, A. J., Poggianti, B. M., Smail, I., Trager, S., Shectman, S. A., Couch, W. J., & Ellis, R. S. 2004, ApJ, 617, 867
- Drory et al. (2004) Drory, N., Bender, R., Feulner, G., Hopp, U., Maraston, C., Snigula, J., & Hill, G. J. 2004, ApJ, 608, 742
- Faber et al. (2003) Faber, S. M., et al. 2003, Proc. SPIE, 4841, 1657
- Faber et al. (2007) Faber, S. M., et al. 2007, ApJ, 665, 265
- Fazio et al. (2004) Fazio, G. G., et al. 2004, ApJS, 154, 10
- Fisher et al. (1998) Fisher, D., Fabricant, D., Franx, M., & van Dokkum, P. 1998, ApJ, 498, 195
- Ford et al. (1998) Ford, H. C., et al. 1998, Proc. SPIE, 3356, 234
- Fukugita et al. (1996) Fukugita, M., Ichikawa, T., Gunn, J. E., Doi, M., Shimasaku, K., & Schneider, D. P. 1996, AJ, 111, 1748
- Gal & Lubin (2004) Gal, R. R., & Lubin, L. M. 2004, ApJ, 607, L1
- Gal et al. (2005) Gal, R. R., Lubin, L. M., & Squires, G. K. 2005, AJ, 129, 1827
- Gal et al. (2008) Gal, R. R., Lemaux, B. C., Lubin, L. M., Kocevksi, D., & Squires, G. K. 2008, ApJ, 684, 933
- Gladders et al. (1998) Gladders, M. D., Lopez-Cruz, O., Yee, H. K. C., & Kodama, T. 1998, ApJ, 501, 571
- Goto et al. (2003) Goto, T., et al. 2003, PASJ, 55, 757
- Gómez et al. (2003) Gómez, P. L., et al. 2003, ApJ, 584, 210
- Haines et al. (2006) Haines, C. P., Merluzzi, P., Mercurio, A., Gargiulo, A., Krusanova, N., Busarello, G., La Barbera, F., & Capaccioli, M. 2006, MNRAS, 371, 55
- Hansen et al. (2009) Hansen, S. M., Sheldon, E. S., Wechsler, R. H., & Koester, B. P. 2009, ApJ, 699, 1333
- Hayashi et al. (2011) Hayashi, M., Kodama, T., Koyama, Y., Tadaki, K.-i., & Tanaka, I. 2011, MNRAS, 415, 2670
- Homeier et al. (2006a) Homeier, N. L., et al. 2006a, ApJ, 647, 256
- Homeier et al. (2006b) Homeier, N. L., et al. 2006b, AJ, 131, 143
- Hopkins et al. (2010) Hopkins, P. F., et al. 2010, ApJ, 715, 202
- Ilbert et al. (2005) Ilbert, O., et al. 2005, A&A, 439, 863
- Ilbert et al. (2006) Ilbert, O., et al. 2006, A&A, 457, 841
- Ilbert et al. (2010) Ilbert, O., Salvato, M., Le Floc’h, E., et al. 2010, ApJ, 709, 644
- James et al. (2008) James, P. A., Knapen, J. H., Shane, N. S., Baldry, I. K., & de Jong, R. S. 2008, A&A, 482, 507
- Jeltema et al. (2007) Jeltema, T. E., Mulchaey, J. S., Lubin, L. M., & Fassnacht, C. D. 2007, ApJ, 658, 865
- Jeltema et al. (2008) Jeltema, T. E., Mulchaey, J. S., & Lubin, L. M. 2008, ApJ, 685, 138
- Kannappan et al. (2009) Kannappan, S. J., Guie, J. M., & Baker, A. J. 2009, AJ, 138, 579
- Kauffmann et al. (2003) Kauffmann, G., et al. 2003, MNRAS, 346, 1055
- Kauffmann et al. (2004) Kauffmann, G., White, S. D. M., Heckman, T. M., Ménard, B., Brinchmann, J., Charlot, S., Tremonti, C., & Brinkmann, J. 2004, MNRAS, 353, 713
- Kautsch et al. (2008) Kautsch, S. J., Gonzalez, A. H., Soto, C. A., Tran, K.-V. H., Zaritsky, D., & Moustakas, J. 2008, ApJ, 688, L5
- Kaviraj et al. (2011) Kaviraj, S., Tan, K.-M., Ellis, R. S., & Silk, J. 2011, MNRAS, 411, 2148
- Kennicutt et al. (2009) Kennicutt, R. C., et al. 2009, ApJ, 703, 1672
- Kewley et al. (2006) Kewley, L. J., Geller, M. J., & Barton, E. J. 2006, AJ, 131, 2004
- Kocevski et al. (2009a) Kocevski, D. D., Lubin, L. M., Gal, R., Lemaux, B. C., Fassnacht, C. D., & Squires, G. K. 2009a, ApJ, 690, 295
- Kocevski et al. (2009b) Kocevski, D. D., Lubin, L. M., Lemaux, B. C., Gal, R. R., Fassnacht, C. D., Lin, R., & Squires, G. K. 2009b, ApJ, 700, 901
- Kocevski et al. (2011a)
- Kocevski et al. (2011) Kocevski, D. D., et al. 2011a, ApJ, 736, 38
- Kocevski et al. (2011b) 2011ApJ…737L..38K Kocevski, D. D., Lemaux, B. C., Lubin, L. M., Shapley, A. E., Gal, R. R., & Squires, G. K. 2011b, ApJ, 737, L38
- Koyama et al. (2007) Koyama, Y., Kodama, T., Tanaka, M., Shimasaku, K., & Okamura, S. 2007, MNRAS, 382, 1719
- Kriek et al. (2006) Kriek, M., et al. 2006, ApJ, 649, L71
- Kron (1980) Kron, R. G. 1980, ApJS, 43, 305
- La Barbera et al. (2010) La Barbera, F., De Carvalho, R. R., De La Rosa, I. G., Gal, R. R., Swindle, R., & Lopes, P. A. A. 2010, AJ, 140, 1528
- Lerchster et al. (2011) Lerchster, M., et al. 2011, MNRAS, 411, 2667
- Lemaux et al. (2009) Lemaux, B. C., et al. 2009, ApJ, 700, 20 (Lem09)
- Lemaux et al. (2010) Lemaux, B. C., Lubin, L. M., Shapley, A., Kocevski, D., Gal, R. R., & Squires, G. K. 2010, ApJ, 716, 970 (L10)
- Lin et al. (2008) Lin, L., et al. 2008, ApJ, 681, 232
- López-Cruz et al. (2004) López-Cruz, O., Barkhouse, W. A., & Yee, H. K. C. 2004, ApJ, 614, 679
- Lubin et al. (2000) Lubin, L. M., Brunner, R., Metzger, M. R., Postman, M., & Oke, J. B. 2000, ApJ, 531, L5
- Lubin et al. (2009) Lubin, L. M., Gal, R. R., Lemaux, B. C., Kocevski, D. D., & Squires, G. K. 2009, AJ, 137, 4867 (L09)
- Ma et al. (2008) Ma, C.-J., Ebeling, H., Donovan, D., & Barrett, E. 2008, ApJ, 684, 16
- Ma et al. (2010) Ma, C.-J., Ebeling, H., Marshall, P., & Schrabback, T. 2010, MNRAS, 406, 121
- Maraston (1998) Maraston, C. 1998, MNRAS, 300, 872
- Maraston (2005) Maraston, C. 2005, MNRAS, 362, 799
- McGee et al. (2011) McGee, S. L., Balogh, M. L., Wilman, D. J., Bower, R. G., Mulchaey, J. S., Parker, L. C., & Oemler, A. 2011, MNRAS, 413, 996
- McIntosh et al. (2008) McIntosh, D. H., Guo, Y., Hertzberg, J., Katz, N., Mo, H. J., van den Bosch, F. C., & Yang, X. 2008, MNRAS, 388, 1537
- Mei et al. (2009) Mei, S., et al. 2009, ApJ, 690, 42
- Mendez et al. (2011) Mendez, A. J., Coil, A. L., Lotz, J., Salim, S., Moustakas, J., & Simard, L. 2011, ApJ, 736, 110
- Moran et al. (2006) Moran, S. M., Ellis, R. S., Treu, T., Salim, S., Rich, R. M., Smith, G. P., & Kneib, J.-P. 2006, ApJ, 641, L97
- Moran et al. (2007) Moran, S. M., Ellis, R. S., Treu, T., Smith, G. P., Rich, R. M., & Smail, I. 2007, ApJ, 671, 1503
- Oemler et al. (2009) Oemler, A., Dressler, A., Kelson, D., Rigby, J., Poggianti, B. M., Fritz, J., Morrison, G., & Smail, I. 2009, ApJ, 693, 152
- Oke & Gunn (1983) Oke, J. B., & Gunn, J. E. 1983, ApJ, 266, 713
- Oke et al. (1995) Oke, J. B., et al. 1995, PASP, 107, 375
- Oke et al. (1998) Oke, J. B., Postman, M., & Lubin, L. M. 1998, AJ, 116, 549
- Papovich et al. (2010) Papovich, C., et al. 2010, ApJ, 716, 1503
- Pérez-Montero et al. (2009) Pérez-Montero, E., et al. 2009, A&A, 495, 73
- Pimbblet et al. (2002) Pimbblet, K. A., Smail, I., Kodama, T., Couch, W. J., Edge, A. C., Zabludoff, A. I., & O’Hely, E. 2002, MNRAS, 331, 333
- Poggianti et al. (1999) Poggianti, B. M., Smail, I., Dressler, A., Couch, W. J., Barger, A. J., Butcher, H., Ellis, R. S., & Oemler, A., Jr. 1999, ApJ, 518, 576
- Poggianti et al. (2006) Poggianti, B. M., et al. 2006, ApJ, 642, 188
- Poggianti et al. (2008) Poggianti, B. M., et al. 2008, ApJ, 684, 888
- Poggianti et al. (2009) Poggianti, B. M., et al. 2009, ApJ, 693, 112
- Postman et al. (2005) Postman, M., et al. 2005, ApJ, 623, 721
- Rieke et al. (2004) Rieke, G. H., et al. 2004, ApJS, 154, 25
- Rose (1985) Rose, J. A. 1985, AJ, 90, 1927
- Rumbaugh et al. (2012) Rumbaugh, N., et al. 2012, in prep
- Sánchez-Blázquez et al. (2009) Sánchez-Blázquez, P., et al. 2009, A&A, 499, 47
- Sandage & Brucato (1979) Sandage, A., & Brucato, R. 1979, AJ, 84, 472
- Scarlata et al. (2007) Scarlata, C., et al. 2007, ApJS, 172, 406
- Simcoe et al. (2000) Simcoe, R. A., Metzger, M. R., Small, T. A., & Araya, G. 2000, BAAS, 32, 758
- Skrutskie et al. (2006) Skrutskie, M. F., et al. 2006, AJ, 131, 1163
- Smith et al. (2010) Smith, G. P., et al. 2010, MNRAS, 409, 169
- Stanford et al. (2005) Stanford, S. A., et al. 2005, ApJ, 634, L129
- Stanford et al. (2006) Stanford, S. A., et al. 2006, ApJ, 646, L13
- Stott et al. (2007) Stott, J. P., Smail, I., Edge, A. C., Ebeling, H., Smith, G. P., Kneib, J.-P., & Pimbblet, K. A. 2007, ApJ, 661, 95
- Stott et al. (2009) Stott, J. P., Pimbblet, K. A., Edge, A. C., Smith, G. P., & Wardlow, J. L. 2009, MNRAS, 394, 2098
- Stott et al. (2010) Stott, J. P., et al. 2010, ApJ, 718, 23
- Stott et al. (2011) Stott, J. P., Collins, C. A., Burke, C., Hamilton-Morris, V., & Smith, G. P. 2011, MNRAS, 414, 445
- Surace et al. (2005) Surace, J. A., Shupe, D. L., Fang, F., Evans, T., Alexov, A., Frayer, D., Lonsdale, C. J., & SWIRE Team 2005, BAAS, 37, 1246
- Swindle et al. (2011) Swindle, R., Gal, R. R., La Barbera, F., & de Carvalho, R. R. 2011, AJ, 142, 118
- Tanaka et al. (2005) Tanaka, M., Kodama, T., Arimoto, N., Okamura, S., Umetsu, K., Shimasaku, K., Tanaka, I., & Yamada, T. 2005, MNRAS, 362, 268
- Tanaka et al. (2007) Tanaka, M., Kodama, T., Kajisawa, M., Bower, R., Demarco, R., Finoguenov, A., Lidman, C., & Rosati, P. 2007, MNRAS, 377, 1206
- Tasca et al. (2009) Tasca, L. A. M., et al. 2009, A&A, 503, 379
- Tody et al. (1993) Tody, D. 1993, Astronomical Data Analysis Software and Systems II, 52, 173
- Tran et al. (2008) Tran, K.-V. H., Moustakas, J., Gonzalez, A. H., Bai, L., Zaritsky, D., & Kautsch, S. J. 2008, ApJ, 683, L17
- Tran et al. (2009) Tran, K.-V. H., Saintonge, A., Moustakas, J., Bai, L., Gonzalez, A. H., Holden, B. P., Zaritsky, D., & Kautsch, S. J. 2009, ApJ, 705, 809
- Tran et al. (2010) Tran, K.-V. H., et al. 2010, ApJ, 719, L126
- Terlevich et al. (2001) Terlevich, A. I., Caldwell, N., & Bower, R. G. 2001, MNRAS, 326, 1547
- Tremonti et al. (2004) Tremonti, C. A., et al. 2004, ApJ, 613, 898
- Treu et al. (2003) Treu, T., Ellis, R. S., Kneib, J.-P., Dressler, A., Smail, I., Czoske, O., Oemler, A., & Natarajan, P. 2003, ApJ, 591, 53
- Willmer et al. (2006) Willmer, C. N. A., et al. 2006, ApJ, 647, 853
- Wilman et al. (2009) Wilman, D. J., Oemler, A., Mulchaey, J. S., McGee, S. L., Balogh, M. L., & Bower, R. G. 2009, ApJ, 692, 298
- Wilson et al. (2003) Wilson, J. C., et al. 2003, Proc. SPIE, 4841, 451
- Yan et al. (2006) Yan, R., Newman, J. A., Faber, S. M., Konidaris, N., Koo, D., & Davis, M. 2006, ApJ, 648, 281 (Y06)
- van Dokkum et al. (1998) van Dokkum, P. G., Franx, M., Kelson, D. D., Illingworth, G. D., Fisher, D., & Fabricant, D. 1998, ApJ, 500, 714
- Vanzella et al. (2001) Vanzella, E., et al. 2001, AJ, 122, 2190
- von der Linden et al. (2010) von der Linden, A., Wild, V., Kauffmann, G., White, S. D. M., & Weinmann, S. 2010, MNRAS, 404, 1231
- Zabludoff & Franx (1993) Zabludoff, A. I., & Franx, M. 1993, AJ, 106, 1314
- Zabludoff & Mulchaey (1998) Zabludoff, A. I., & Mulchaey, J. S. 1998, ApJ, 496, 39
- Zucca et al. (2009) Zucca, E., Bardelli, S., Bolzonella, M., et al. 2009, A&A, 508, 1217
Appendix A Appendix A: Multiband Photometry of the Cl1604 Supercluster
Initial photometry of the LFC imaging of the Cl1604 field was performed with SExtractor run in dual-image mode. This process involved the use of a deep combined frame for object detection, while magnitudes were measured in the individual band images. Variable diameter elliptical apertures were used, with major axis radius 2, where is the Kron radius (Kron 1980; Bertin & Arnouts 1996), outputted as MAG_AUTO in SExtractor. These apertures are determined in the deep images and used to extract the photometry in each of the individual band images. The virtue of this process is that a single, identical aperture is used for the photometry in all three bands, which reduces biases introduced to color measurements by integrating the light within the same physical scale for each galaxy (Lubin et al. 2000). A full discussion of this process can be found in Gal et al. (2005).
Following these initial steps, the LFC data were calibrated to SDSS data release 5 (DR5; Adelman-McCarthy et al. 2007) imaging, which spanned the entirety of our two LFC pointings in the Cl1604 field. The LFC magnitudes were compared to SDSS “modelmags”131313Detailed information can be found at http://www.sdss.org/dr7/algorithms/photometry.html for all objects that were detected in both the LFC and SDSS imaging. The SDSS modelmags have the advantage that, while still using a single aperture to measure the photometry in each band, a Srsic model (i.e., either an exponential disk or a de Vaucouleurs profile) is fit to each object in the band and applied to each individual band image to correct for the effects of using a finite aperture. The model is truncated for each galaxy measurement such that 99.3% of the (model dependent) flux from each galaxy is recovered in the band, with a similar percentage recovered in the other bands. While the SDSS imaging does not go nearly as deep as our own LFC imaging, this calibration process allowed us to make bulk corrections to our LFC magnitudes, which results in more self-consistent photometry and less aperture-induced bias when comparing our optical magnitudes to those in the NIR. Further details on this calibration process can be found in G08.
The photometry of the WIRC imaging was obtained by running SExtractor on the final images, with object detection performed on a pixel Gaussian smoothed image. All objects with more than 8 contiguous pixels above were cataloged. The photometric zero point for each deep image was found by comparison to the Two Micron All Sky Survey (2MASS; Skrutskie et al. 2006). The overlap regions between pointings were checked, and in the case of duplicate detections the one with the higher S/N was retained. Based on the overlap regions, typical astrometric errors are in each coordinate. The 2MASS -band magnitudes were transformed to the AB system assuming (Ciliegi et al. 2005). Magnitudes from the WIRC data were drawn from the SExtractor output MAG_AUTO. It is important to note that, since this reduction was done independently of the LFC reduction, the physical scale of the aperture used to compute the WIRC magnitudes is not necessarily the same one used in the optical imaging. However, a comparison of the -corrected WIRC magnitudes and UKIRT -band magnitudes (which are aperture corrected, see below) for a subset of the spectroscopically confirmed members of the Cl1604 supercluster exhibits only a small systematic offset ( mag) in the WIRC magnitudes for the very brightest and faintest galaxies in the supercluster. For a majority of the supercluster members there is no systematic offset between the two sets of magnitudes. We also make further attempts to correct zero-point offsets between filters when performing the SED fitting (see §3.1.2). Thus, it is likely that the small systematic offsets between the band and magnitudes measured from our other imaging does not introduce significant biases into our fitting process, especially in the case of supercluster members.
Spitzer IRAC 3.6/4.5/5.8/8.0m photometry was obtained with SExtractor run in dual-image mode. For these data the 3.6m image was used for object detection in the region containing the supercluster, while the magnitudes were measured in the individual band images. A stacked, four-band image was not used for object detection in this case, as the point spread function (PSF) degrades significantly in the bands longward of 3.6m. A fixed aperture of 1.9 was used to extract magnitudes for all bands, roughly chosen to match the PSF in the 3.6m image. For blended sources we used the IRAF task daophot to perform an iterative PSF fitting and subtraction in order to remove contamination from neighboring objects. For all supercluster members a multiplicative aperture correction of 1.36, 1.40, 1.65, and 1.84 was applied to the measured fluxes in the 3.6, 4.5, 5.8, and 8.0m bands, respectively. These corrections are appropriate for a galaxy at , which appears as a PSF to Spitzer, and a measurement aperture of 1.9 141414See http://swire.ipac.caltech.edu//swire/astronomers/public ations/SWIRE2_doc_083105.pdf, Table 9..
Photometry of the HST ACS data was obtained by SExtractor run in dual-image mode. A deep + image was used for object detection, while magnitudes were obtained in the single band images using an identical aperture for both and and drawn from the MAG_AUTO output of SExtractor (for more details see Kocevski et al. 2009b and references therein). Since the HST ACS data were not used in our SED fitting151515The trouble of including HST ACS data in our SED fitting process is the significant wavelength overlap of the ACS filter set with the bands chosen for our ground-based optical imaging and the higher resolution of the ACS imaging with respect our other imaging data of the supercluster. The latter makes the process of matched aperture photometry extremely difficult. Significant headway has been made in the astronomical community in this area, and it is likely that we will include ACS data in future SED fitting., no attempt was made to match the apertures used here to the ones used in the LFC/WIRC or Spitzer imaging. For this study, the only important feature of this photometry is that it be self-consistent between the two HST ACS bands, which we have ensured by choosing a common aperture to measure the magnitudes in each band.
The UKIRT -band imaging, as with the HST ACS data, was not used in our SED fitting. As such, we only briefly describe the photometry. Photometry catalogs of the UKIRT observations are provided by the Cambridge pipeline. An aperture corrected magnitude with a fixed aperture of 2 (“kAperMag3” in the Cambridge nomenclature) was chosen for all Cl1604 member galaxies as it most closely resembled the methodology used for obtaining magnitudes in the other imaging data. While we again did not make any attempt to match the apertures of the UKIRT -band magnitudes to those in other bands, the aperture correction performed on these magnitude measurements should, in principle, allow for consistent comparison between these data and those in other bands.
Appendix B Appendix B: Red-Sequence Fitting of the Cl1604 Clusters and Groups
For each Cl1604 cluster, a minimization to a linear model of the form:
| (B1) |
was performed on the member galaxies within a certain range of colors and magnitudes (Gladders et al. 1998; Stott et al. 2009). The color range was defined by an initial “by eye” estimate of the color range of the red sequence of each system, while the magnitude limits were defined as the limit at which photometric errors were reasonably small (). For most systems these resulted in a magnitude limit of and a color range of . Following the results of the fitting, the color slope of each system is removed and the resulting “corrected” color distribution of the galaxies in each system is fit to a single Gaussian using iterative clipping. The formal red sequence is then defined as the colormagnitude envelope bounded by a departure from the relationship given in Equation B1. The slope, intercept, and width of the red sequence for each of the three Cl11604 clusters are given in Table 2. Fitting was performed on galaxies within a projected radius of , 1.5, and 2, but we find that there is little difference between the three fits. In this paper we used the values derived using , as there is minimal contamination from bluer galaxies in most of the systems at these radii.
While we performed red sequence fitting on the individual populations of each of the three clusters (i.e., A, B, & D), there are too few members in any individual group system for us to perform the fitting on a single group. Instead, the individual group populations were combined into one “group” sample. Red sequence fitting was performed on this composite population in each of the three radial bins (, 1.5, and 2) using the methodology described above. A single “group” red-sequence fit is reported in Table 2. This fit is used to discriminate red and blue galaxies in each of the individual group systems.
Since the Cl1604 groups contain populations of galaxies at moderately different redshifts, the HST ACS observations probe slightly different rest-frame colors for each group, which tends to artificially inflate the scatter in the combined CMD. However, we compute a maximum difference of for an elliptical template (Maraston 1998, 2005) spanning the redshift range of the Cl1604 groups. This value does not change significantly when an equivalent model from Bruzual (2007) is used. While this effect is not trivial for precision measurements, here we simply adopted the best-fit relation in observed colormagnitude space for the combined group sample and used the departure from this relation as the boundaries of the group red sequence. The choice of the latter is motivated by the redshift effects discussed above, which artificially inflate the observed color scatter at roughly the level. The width of the group red sequence corresponds to a slightly higher width than the width of any of three Cl1604 clusters, which may be expected of systems still in the process of formation (i.e., Homeier et al. 2006a; Mei et al. 2009).
Appendix C Appendix C: Spectral Errors from Sampling and Incompleteness
To estimate the error and any possible biases spectroscopic selection effects and incompleteness might have on the quantities measured from composite spectra [i.e., EWs and ] we performed a bootstrap analysis on the composite spectra of all Cl1604 groups and clusters. Bootstrap analysis was performed using a combination of the HST ACS photometry and the DEIMOS/LRIS spectroscopic information in the following manner. The observed ACS CMD for the Cl1604 supercluster was separated into bins spanning 0.5 mag in color and 1 mag in brightness. For the magnitude bin and the color bin, the redshift probability distribution function, , is defined as:
| (C1) |
where is defined as any galaxy in that bin with a secure spectroscopic redshift within the range of the supercluster, , and is defined as any object in that bin with a secure redshift outside this range. This probability was calculated in each bin over the color range and a magnitude range of . The number of supercluster members missed by our spectroscopy is then:
| (C2) |
where is the number of photometrically detected objects within that colormagnitude bin that were not targeted for spectroscopy and is the number of low quality spectra in that bin for which the redshift was uncertain. For almost all of the 42 colormagnitude bins defined in this manner we have obtained spectral information on some non-zero fraction of the photometric objects in that bin. For those colormagnitude bins that are highly populated with Cl1604 members (i.e., , ) the fraction of photometrically detected objects for which we have spectral information is quite high, ranging from 30% to greater than 80%.
For each Cl1604 group and cluster, the effect of this incompleteness on EW([O II]), EW(H), and values measured from our composite spectra is estimated in the following way. For all colormagnitude bins in which , the spectra of galaxies were randomly drawn from the observed supercluster members in that colormagnitude bin. These randomly drawn galaxies are included in a new “completeness-corrected” composite spectrum along with the original members of that particular system such that the number of galaxies in the new composite spectrum is:
| (C3) |
For each structure the completeness-corrected composite spectrum is generated 500 times and the EW([O II]), EW(H), and are measured for each realization. While the number of randomly drawn supercluster members used to make the completeness correction remains constant in each realization for a particular structure, the galaxies used to make the completeness correction change for each realization. For each structure, a distribution of EW([O II]), EW(H), and values is generated from the 500 realizations of the completeness corrected composite spectrum. The “incompleteness error” is calculated from the second moment of this distribution for each structure and is assumed to be Gaussian. This error is added in quadrature to the random errors on the EWs and the measurements in cases where the full Cl1604 galaxy sample is used (i.e., not subsets of brighter galaxies, as in §5). In addition to performing this analysis for each of the eight groups and clusters of the supercluster, an identical analysis was performed on a composite spectrum which included members of all five of the Cl1604 group systems (the “Groups” sample).
The galaxies included when estimating the effects of completeness are drawn not only from the denser regions of the supercluster (i.e., from a group or cluster center) but from all environments. In such a way we attempt to simulate the maximum possible variance of the spectral quantities measured from the composite spectra due to incompleteness. By using such a method we are inherently assuming that the spectral properties of observed supercluster members in any given colormagnitude bin are similar to those supercluster galaxies for which we do not have spectral information. If the spectroscopically undetected supercluster members have significantly different spectra, this method loses its effectiveness. However, in any given colormagnitude bin we observe significant variance of the spectral properties of confirmed member galaxies, which gives us confidence that this method is a reasonable approximation of the true error due to our incomplete spectral sampling.