Au/TiO2(110) interfacial reconstruction stability from ab initio
Abstract
We determine the stability and properties of interfaces of low-index Au surfaces adhered to TiO2(110), using density functional theory energy density calculations. We consider Au(100) and Au(111) epitaxies on rutile TiO2(110) surface, as observed in experiments. For each epitaxy, we consider several different interfaces: Au(111)//TiO2(110) and Au(100)//TiO2(110), with and without bridging oxygen, Au(111) on added-row TiO2(110) reconstruction, and Au(111) on a proposed TiO reconstruction. The density functional theory energy density method computes the energy changes on each of the atoms while forming the interface, and evaluates the work of adhesion to determine the equilibrium interfacial structure.
keywords:
Interfacial structure, Nanoparticle, Titania1 Introduction
Bulk metallic Au is chemically inert and catalytically inactive as a consequence of combination of valence orbitals and diffused valence and orbitals. Recently, Au nanoparticles have been found to be catalytically active when supported on metal oxides such as TiO2, SiO2, Fe2O3, Co3O4, NiO, Al2O3, MgO, etc.1, 2, 3, 4, 5, 6 For example, Au nanoparticles supported on a TiO2(110) surface demonstrate catalytic activity to promote the reaction between CO and O2 to form CO2 at K with 3.5 nm Au nanoparticles maximizing activity.3 The catalytic activity is remarkably sensitive to the support material, Au particle size and Au-support interaction; in addition, the reaction mechanism of CO oxidation over Au/TiO2 system remains under debate.3, 7, 8, 9 High-resolution transmission electron microscopy (HRTEM)10, 11 and high-angle annular dark field scanning transmission electron microscopy (HAADF-STEM)11, 12 have characterized the atomic structure of nanocrystal interface. However, the atomic structure of Au/TiO2 interface is difficult to determine in HRTEM image simulations due to several issues, such as the thickness of nanoparticles and metal oxide substrates are not determined, and the positions of atoms in the direction parallel to the electron beam are not determined, and the very low contrast for oxygen atoms. New HRTEM experiments11 observed Au nanoparticles on TiO2(110) surfaces with both the Au(111) and Au(100) epitaxies, with the Au(111) epitaxy more frequently observed than Au(100). Their analysis with HAADF-STEM analyzed the reconstructed interface of epitaxial Au(111) sitting on a TiO2(110) surface, and extracted important geometric information such as interlayer separations, the presence of Au in the interface of a reconstruction, and estimates of the work of adhesion.
Density functional theory (DFT) calculations13 have studied the optimum size and stable adsorption of Au nanoparticles on rutile TiO2(110). Single Au atom is energetically favorable on the atop site above five-fold coordinated (5c) Ti atom on a stoichiometric TiO2 surface,14 and is most stable on the two-fold coordinated (2c) bridging O vacancy site on a reduced surface.15, 16, 17 Oxygen vacancies cause a stronger binding of Au atoms,18 nanoclusters19, 20, 21 and nanorows20 to the reduced TiO2 surface than to the stoichiometric surface. Apart from the stoichiometric and reduced TiO2 surfaces, Shi et al. found the O-rich interface is the most stable at low temperature of catalytic reaction after examining the Au-rod/TiO2(110) in the orientation Au(111)//TiO2(110) with different interface stoichiometry and various rigid-body translations.22 Recently, Shibata et al. examined two and nine Au(110) atomic layers supported on reduced TiO2(110), and demonstrated that both the atomic and electronic structure of two-layer Au are reconstructed, while the lattice coherency decays rapidly across the interface for nine-layer Au.23 We compare different Au/TiO2 interfaces: Au(111)//TiO2(110) and Au(100)//TiO2(110), with and without bridging oxygen, Au(111) on added-row TiO2(110) reconstruction24, and Au(111) on a new proposed TiO reconstruction11. We use the newly-reformulated25, 26 density functional theory energy density method to evaluate energy for each atom in the interfacial reconstruction. This provides insight into interfacial stability from the changes in atomic energy from the formed interface, and corrects for spurious errors in the work of adhesion from the remaining free surfaces in the computational cell. The new information of atomic energies extracted from density functional theory shows the response to bonding environment changes in interfaces. The comparison with experimental geometry11 and work of adhesion27 allows us to validate our predicted structures.
2 Methodology
We perform DFT calculations13 on the Au/TiO2 interfaces using the projector augmented wave (PAW) method28 with the Vienna ab initio simulation package (vasp)29, 30. The exchange-correlation energy is treated in the Perdew-Burke-Ernzerhof31 version of the generalized gradient approximation functional (PBE-GGA). Elements Au, Ti, and O are given by [Xe], [Ne], [He] atomic configurations; this requires a plane-wave basis set cut-off at 900 eV. We use Monkhorst-Pack k-point meshes32 of for interface supercells; Brillouin-zone integration uses the Methfessel-Paxton method33 with eV for electronic occupancies, and the total energy extrapolated to eV. The calculated lattice constant for Au in the FCC phase is 4.171 Å, and for TiO2 in the rutile phase Å, Å, and . These calculated values compare well with the experimental values of 4.08 Å for Au and Å, Å, 6 for TiO2.
The work of adhesion of forming an interface from two individual surfaces can be determined from total energy calculations:
| (1) |
where and are the energy of relaxed Au surface and relaxed TiO2 surface and is the energy of the interface system. To avoid differences in grid densities or the planewave basis, the surfaces are computed with the same supercell as the interface system. In addition to total energies, the energy density method proposed by Chetty and Martin25 provides the formation energy for more than one surface or interface in one calculation, and a picture of the distribution of energy among the surrounding atoms. We use a new reformulation of the energy density method with vasp for PAW method.26 Moreover, we compute atomic energies by integrating the local energy density over gauge independent integration volumes.34 The data allows us to identify the spatial range of the interface and gives insight into the nature of interfacial stability. The integration of the energy density over these volumes produces a small integration error, that can be estimated from the extent to which gauge-invariance is broken; we include that error as a range in all of our reported energy density calculations. For the Au/TiO2 interfaces, the supercell configurations in the calculations are periodic parallel to the interface, and contain six layers of Au, eight trilayers of TiO2, and 10.5 Å vacuum region. Due to the lattice mismatch, Au layers are strained to lattice match the TiO2 according to the supercell periodicity; strained Au surfaces are used as references for energy differences. Atomic relaxation is allowed for all six layer Au atoms and for three interfacial layers of TiO2 for all geometries considered. In addition, different translations of Au relative to TiO2 are attempted in order to determine the minimum energy configuration. The equilibrium positions of the atoms are determined by requiring the force on each relaxed atom to be smaller than 0.02 eV/Å.
3 Interfaces
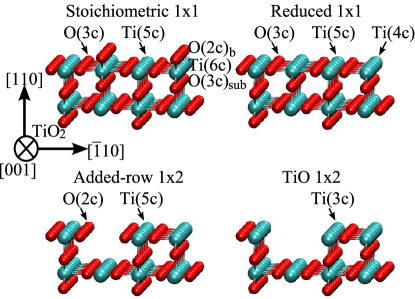
1 shows the four different configurations of rutile TiO2(110) substrates we consider. We start with a stoichiometric surface, and then reduce the surface by removing all bridging O atoms; both are surfaces. Pang et al. proposed an added-row reconstruction for the rutile (110) surface, where one row of Ti atom with its sub-bridging O row are removed per cell for a fully reduced surface.24 Finally, removing the two-fold coordinated O atoms from the added-row reconstruction gives a TiO reconstruction. While this reconstruction is not the lowest in energy, it provides the most stable Au/TiO2 interface that also matches the experimentally observed geometry.
3.1 Au(111)//TiO2(110) : Stoichiometric and reduced interfaces
Both interfaces on surfaces use a similar geometry for relaxation. Along the direction Au//TiO2[001], a single repeat length of Au and TiO2 gives a 1% lattice mismatch. This agrees with STEM measurements showing registry even up to 10 layers from the interface.11 Along the direction Au//TiO2, a repeat length of 4 for Au matches with a repeat length of 3 for TiO2, producing a total lattice mismatch strain at the interface. The supercells contain 48 Au, 48 Ti, and 96 O atoms in the interface configuration with stoichiometric TiO2 surface, and 3 fewer O atoms for the reduced TiO2 surface. After relaxation, we determine the interlayer spacing at the interface; with energy density calculations, we can ignore any spurious energy changes due to the opposing Au and TiO2 surfaces.
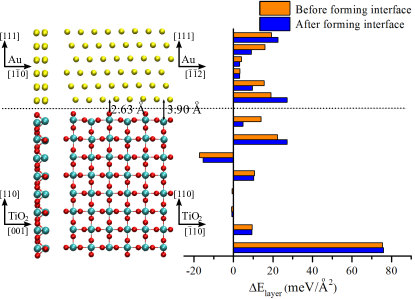

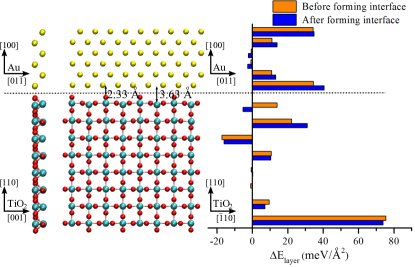
2 and 3 show the geometry of the relaxed Au(111) on stoichiometric and reduced TiO2(110) surfaces. The interfacial distance between Au and Ti layers relaxed to 3.90 Å with stoichiometric TiO2 surface, and 2.79 Å in the configuration with reduced TiO2 surface. From total energy, the work of adhesion of the interface with stoichiometric TiO2 surface is 7 meV/Å2, while the work of adhesion of the interface with the reduced TiO2 surface is 54 meV/Å2. The differences in interlayer spacing and energy is due to the presence or absence of bridging oxygen atoms on the TiO2 surface. Energy density shows that TiO2 layers reach bulk behavior by the fifth layer from the interface. We integrate the energy density over two Au layers and four TiO2 layers to evaluate the work of adhesion strictly from changes in energy near the interface. This gives a work of adhesion of meV/Å2 to the stoichiometric TiO2 surface, and meV/Å2 to the reduced TiO2 surface. The work of adhesion is primarily due to a decrease in energy of the Au surface layer at the reduced TiO2 surface. This suggests that the main effect of removing bridging oxygen is to provide a flat surface for Au(111) layers to adhere, and that the TiO2 surface energy change is significantly less than the Au surface energy change.
3.2 Au(111)//TiO2(110) : Added-row and TiO reconstructions
Both interfacial reconstructions on surfaces use a similar geometry for relaxation. Along the direction Au//TiO2[001], a single repeat length of Au and TiO2 gives a 1% lattice mismatch as for the reconstructions. Along the direction Au//TiO2, a repeat length of 5 for Au matches with a repeat length of 4 for TiO2, producing a total lattice mismatch strain at the interface; the different periodicity is required for a reconstruction. The supercells contain 62 Au, 62 Ti, and 122 O atoms in the interface configuration with added-row TiO2 reconstruction, and 4 fewer O atoms for the TiO reconstruction. After relaxation, we determine the interlayer spacing at the interface; with energy density calculations, we can ignore any spurious energy changes due to the opposing Au and TiO2 surfaces.
3.2.1 Added-row reconstruction
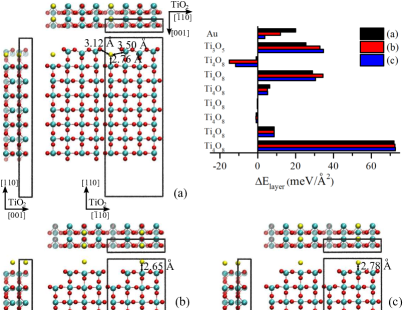
The added-row reconstruction for the rutile (110) surface removes one row of Ti atom with its sub-bridging O row per cell for a fully reduced surfaces.24 Experimental observations of the interface find a mixed TiO2-Au layer with periodicity;11 to build our interface and compute the work of adhesion, we consider different configurations to attach a row of Au atoms on added-row reconstruction in 4. After geometry relaxation, the configuration of each Au atom sitting on the top of two Ti atoms with 4 neighboring O atoms is the most stable; there is an energy cost of 15.7 meV/Å2 to place a Au row into the missing row of TiO2. This is similar to the adhesion of Au rows to bridging oxygen vacancies in a TiO2(110) “missing row” reconstruction.20 The energy density shows that the energy of Au dominates the stability.
5 shows the geometry of the relaxed Au(111) on added-row TiO2 reconstruction. The interfacial distance between Au and the mixed interfacial layer is 3.4 Å. This larger distance is due to the displacement of oxygen atoms neighboring the interfacial Au rows. From total energy, the work of adhesion of the interface is –9 meV/Å2 after accounting for the 16meV/Å2 increase in energy due to the addition of Au into the subsurface (c.f. 4). We integrate the energy density over two Au interfacial layers, one mixed interfacial layer and three next TiO2 interfacial layers and subtract the corresponding energy density integration in Au layers and the ground-state configuration of an Au row on TiO2, 4(a). This energy density calculation gives a work of adhesion of meV/Å2 before subtracting 16meV/Å2. After forming interface, the atomic energy of Au interfacial layer drops, while the atomic energy of TiO2 in the mixed layer increases. The increase in the energy of the surface Ti6O10 layer is due to the constraint placed on oxygen atoms neighboring to the intermixed Au row in the mixed layer.
3.2.2 TiO reconstruction
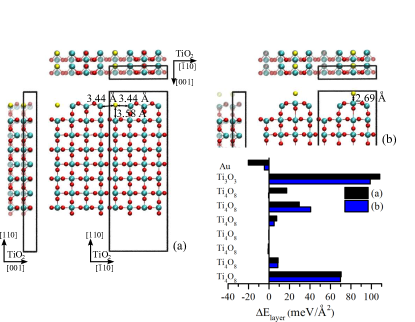
The added-row reconstruction can be further reduced by removing the two-fold coordinated O atoms on the TiO2 surface layer to form a TiO reconstruction. This reconstruction is suggested by the energy density calculations above as a possible route to increase the work of adhesion. We build our interface in a similar manner as for the added-row reconstruction, and consider different configurations to attach one row of Au atoms on the reconstruction in 6. After geometry relaxation, both the Au row in the missing row of Ti and on the surface have large, but similar, energies (a difference of 0.8 meV/Å2). The increase in surface energy is entirely due to the first TiO2 layer, suggesting that further reduction to TiO is unfavorable without an interfacial layer of gold to “protect” the surface.
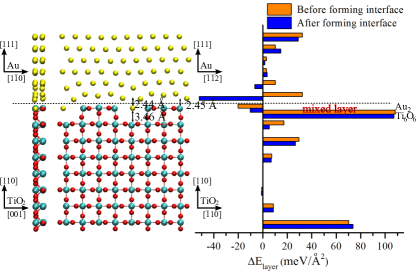
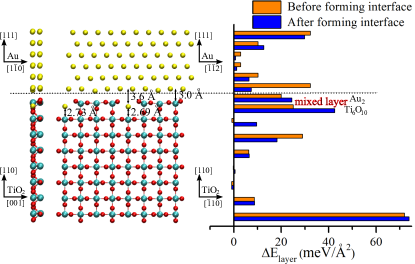
7 shows the geometry of the relaxed Au(111)//TiO reconstruction interface. Despite the higher energy of the TiO reconstruction, it produces an attractive interface configuration with Au(111). The interfacial distance between the Au layer and mixed interfacial layer is 2.44–2.45 Å; the closer attachment distance compared with the added-row reconstruction is due to the removed oxygen atoms in the interfacial layer. From total energy, the work of adhesion of the interface is 99 meV/Å2. We integrate the energy density over two Au interfacial layers, one mixed interfacial layer and three next TiO2 interfacial layers and subtract the corresponding energy density integration in Au layers and the ground-state configuration of an Au row on TiO, 6(a). This energy density calculation gives a work of adhesion of meV/Å2; the difference with the total energy calculation is due to spurious changes in the free TiO2 surface that the energy density calculation removes. We observe a remarkable drop of atomic energy on Au interfacial layer. In addition, the mixed layer energy sees only a small change leading to a stabilized interface. To compute the true work of adhesion, however, we must account for the energy change due to a further reduction from the added-row reconstruction to the TiO reconstruction.
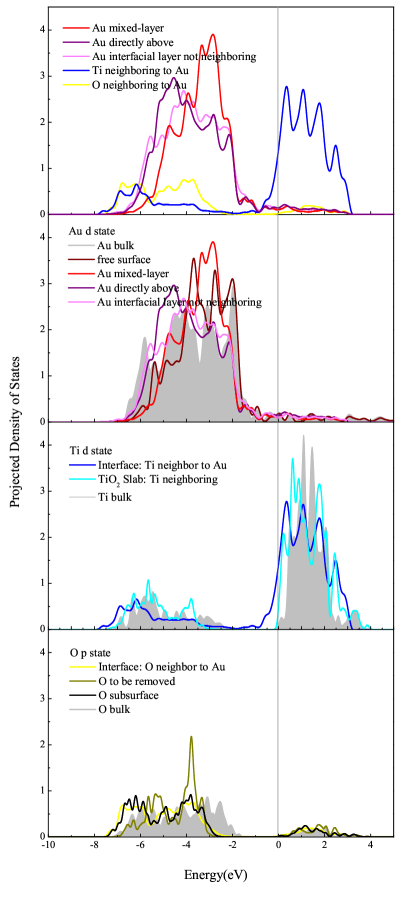
8 shows the changes in local electronic density of states for atoms in the Au(111)//TiO interface compared with other atomic configurations in Au and TiO2. In the interface, the Au atom mixed in the TiO2 layer has a narrower width, indicating reduced bonding to neighbors than even Au atoms in the interfacial layer above. Moreover, the Au states are pushed towards the Fermi level, even compared with atoms on a free surface. The widening of the density of states for Au atoms in the interface compared with the free surface corresponds to changes in atomic energy in 7. Titanium has a downward shift in unoccupied states pulling them below the Fermi energy in the interface. Finally, the oxygen atom in the surface next to Au (c.f., 5) that is removed in the new reconstruction sees its density of states narrow and produce a peak; this increase in energy corresponds to the atomic energy changes also seen for this atom. After removal, the remaining oxygen neighbors have bonding environments that are less disturbed by the presence of Au in the interfacial layer.
3.2.3 Work of adhesion
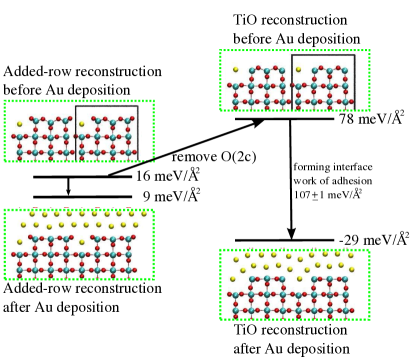
9 shows the relative energies for the different configurations to produce the two different reconstructions of Au(111)//TiO2(110). Au(111) adhered to the TiO reconstruction is the most stable interface configuration with an interfacial distance 2.45 Å that agrees with the STEM observed11 Å. However, the work of adhesion of 107 meV/Å2 is relative to the higher energy TiO surface with the introduced Au into the subsurface. The difference between the added-row reconstruction and the TiO reconstruction means that a single Au row on the TiO reconstruction is less stable by 62meV/Å2, plus 16meV/Å2 to place Au in the subsurface (c.f. 4); hence, the TiO reconstruction produces a stable configuration with work of adhesion of 29 meV/Å2 after Au deposition. Note that we have computed our work of adhesion relative to the stable Au(111) surface with energy 43meV/Å2 (meV/Å2 for the strained surface) and the added-row reconstruction for TiO2(110) with an energy of meV/Å2. This is lower than simply adhering to the added-row reconstruction, which has a work of adhesion of –9 meV/Å2. It should be noted that the intermediate configuration of TiO without Au(111) is unstable, and is needed to compute relative energies; given the higher surface energy, it is unlikely that further oxygen reduction occurs before the growth of Au(111) layers.
3.3 Au(100)//TiO2(110) : Stoichiometric and reduced interfaces
Both interfaces on surfaces use a similar geometry for relaxation. Along the direction Au//TiO2[001], a single repeat length of Au and TiO2 gives a 1% lattice mismatch. Along the direction Au[011]//TiO2, a repeat length of 9 for Au matches with a repeat length of 4 for TiO2, producing a 0.9% lattice mismatch. The supercell contains 54 Au, 64 Ti, and 128 O atoms for stoichiometric case, and 4 fewer O atoms for reduced case. As before, we determine the interlayer spacing at the interface following relaxation; with energy density calculations, we can ignore any spurious energy changes due to the opposing Au and TiO2 surfaces.
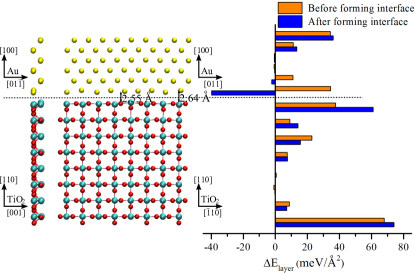
10 and 11 show the geometry of the relaxed Au(100) on stoichiometric and reduced TiO2(110) surfaces. The interfacial distance between Au and Ti layers relaxed to 3.63 Å with stoichiometric TiO2 surface, and 2.64 Å in the configuration with reduced TiO2 surface. From total energy, the work of adhesion is 3 meV/Å2 of the interface with stoichiometric TiO2, while the work of adhesion of the interface with the reduced TiO2 surface is 55 meV/Å2. The differences in interlayer spacing and energy is due to the presence or absence of bridging oxygen atoms on the TiO2 surface. Energy density shows that TiO2 layers reach bulk behavior by the fifth layer from interfaces. We integrate the energy density over two Au layers and four TiO2 layers to evaluate the work of adhesion strictly from changes in energy near the interface. This gives a work of adhesion of meV/Å2 to the stoichiometric TiO2 surface, and meV/Å2 to the reduced TiO2 surface. Similar to Au(111)//TiO2(110) reduced interface, atomic energy at the interface decreases in the Au surface, and increases in the TiO2 surface in the reduced case during forming the interface, to stabilize the structure more than the stoichiometric case. The energy of TiO2 free surface away from the interface experiences a spurious energy changes during the interface formation. Therefore, the integration of energy density over interfacial region reduces the finite-size error, and provides more accurate work of adhesion or interfacial energy.
4 Conclusions
| [meV/Å2] | [Å] | misfit | ||
| Stoichiometric | 3.90 | 3.6% | ||
| Reduced | 2.79 | 3.6% | ||
| Added-row | 3.00 | 2.9% | ||
| TiO | 2.45 | 2.9% | ||
| Experiment11, 27 |
1 summarizes the geometric and energy comparison of proposed Au//TiO2 interfaces and the experimental observations11, 27. Density functional theory energy density calculations of several Au/TiO2 interfacial reconstructions determines the equilibrium structure that matches experimental measurements. Both Au(111) and (100) prefer attaching to reduced rutile TiO2(110) surfaces over stoichiometric surfaces. Comparison of Au(111) attaching on two TiO2(110) reconstruction cells shows that the TiO reconstruction leads to the most stable interface configuration with interfacial distance 2.45 Å, and work of adhesion 29 meV/Å2. Atomic energy variation during interface formation demonstrates that the attraction of top Au interfacial layer leads to a stable structure. The energy density computation also identifies spurious changes to atomic energies on the free-surfaces during the formation of an interface, which affect the computation of work of adhesion from total energy calculations; these finite-size errors are removed. Our calculations provide an atomistic-level explanation of the stability of the unusual TiO reconstruction, where further reduction of the interface is possible when “protected” by an epitaxial gold layer, and demonstrates the power of energy density computation to guide the identification of stable defect structures.
This research was supported by NSF under grant number DMR-1006077 and through the Materials Computation Center at UIUC, NSF DMR-0325939, and with computational resources from NSF/TeraGrid provided by NCSA and TACC. We thank J. M. Zuo and S. Sivaramkrishnan for discussion of the experimental results, and R. M. Martin for helpful discussions.
References
- Haruta et al. 1987 Haruta, M.; Kobayashi, T.; Sano, H.; Yamada, N. Chem. Lett. 1987, 2, 405
- Haruta et al. 1989 Haruta, M.; Yamada, N.; Kobayashi, T.; Iijima, S. J. Catal. 1989, 115, 301
- Valden et al. 1998 Valden, M.; Lai, X.; Goodman, D. W. Science 1998, 281, 1647
- Boccuzzi et al. 1999 Boccuzzi, F.; Chiorino, A.; Manzoli, M.; Andreeva, D.; Tabakova, T. J. Catal. 1999, 188, 176
- Hayashi et al. 1998 Hayashi, T.; Tanaka, K.; Haruta, M. J. Catal. 1998, 178, 566
- Diebold 2003 Diebold, U. Surf. Sci. Rep. 2003, 48, 53
- Bond and Thompson 2000 Bond, G. C.; Thompson, D. T. Gold Bull. 2000, 33, 41
- Grunwaldt et al. 1999 Grunwaldt, J.-D.; Maciejewski, M.; Becker, O.; Fabrizioli, P.; Baiker, A. J. Catal. 1999, 186, 458
- Haruta 2004 Haruta, M. Gold Bull. 2004, 37, 27
- Cosandey and Madey 2001 Cosandey, F.; Madey, T. E. Surf. Rev. Lett. 2001, 8, 73
- Sivaramakrishnan et al. 2011 Sivaramakrishnan, S.; Yu, M.; Pierce, B. J.; Scarpelli, M. E.; Wen, J.; Trinkle, D. R.; Zuo, J.-M. (under review, Science)
- Akita et al. 2008 Akita, T.; Tanaka, K.; Kohyama, M.; Haruta, M. Surf. Interface Anal. 2008, 40, 1760
- Kohn and Sham 1965 Kohn, W.; Sham, L. J. Phys. Rev. 1965, 140, A1133
- Yang et al. 2000 Yang, Z.; Wu, R.; Goodman, D. W. Phys. Rev. B 2000, 61, 14066
- Wang and Hwang 2003 Wang, Y.; Hwang, G. S. Surf. Sci. 2003, 542, 72
- Amrendra et al. 2003 Amrendra, V.; Greg, M.; Horia, M. J. Chem. Phys. 2003, 118, 6536
- Wahlström et al. 2003 Wahlström, E.; Lopez, N.; Schaub, R.; Thostrup, P.; Rønnau, A.; Africh, C.; Lægsgaard, E.; Nørskov, J. K.; Besenbacher, F. Phys. Rev. Lett. 2003, 90, 026101
- Okazaki et al. 2004 Okazaki, K.; Morikawa, Y.; Tanaka, S.; Tanaka, K.; Kohyama, M. Phys. Rev. B 2004, 69, 235404
- Lopez et al. 2004 Lopez, N.; Nørskov, J. K.; Janssens, T. V. W.; Carlsson, A.; Puig-Molina, A.; Clausen, B. S.; Grunwaldt, J.-D. J. Catal. 2004, 225, 86
- Pabisiak and Kiejna 2009 Pabisiak, T.; Kiejna, A. Phys. Rev. B 2009, 79, 085411
- Pillay and Hwang 2005 Pillay, D.; Hwang, G. S. Phys. Rev. B 2005, 72, 205422
- Shi et al. 2009 Shi, H.; Kohyama, M.; Tanaka, S.; Takeda, S. Phys. Rev. B 2009, 80, 155413
- Shibata et al. 2009 Shibata, N.; Goto, A.; Matsunaga, K.; Mizoguchi, T.; Findlay, S. D.; Yamamoto, T.; Ikuhara, Y. Phys. Rev. Lett. 2009, 102, 136105
- Pang et al. 1998 Pang, C. L.; Haycock, S. A.; Raza, H.; Murray, P. W.; Thornton, G.; Gülseren, O.; James, R.; Bullett, D. W. Phys. Rev. B 1998, 58, 1586
- Chetty and Martin 1992 Chetty, N.; Martin, R. M. Phys. Rev. B 1992, 45, 6074
- Yu et al. 2011 Yu, M.; Trinkle, D. R.; Martin, R. M. Phys. Rev. B 2011, (accepted; arXiv:1011.4683)
- Sivaramakrishnan et al. 2010 Sivaramakrishnan, S.; Wen, J.; Scarpelli, M. E.; Pierce, B. J.; Zuo, J.-M. Phys. Rev. B 2010, 82, 195421
- Blöchl 1994 Blöchl, P. E. Phys. Rev. B 1994, 50, 17953
- Kresse and Furthmüller 1996 Kresse, G.; Furthmüller, J. Phys. Rev. B 1996, 54, 11169
- Kresse and Joubert 1999 Kresse, G.; Joubert, D. Phys. Rev. B 1999, 59, 1758
- Perdew et al. 1996 Perdew, J. P.; Burke, K.; Ernzerhof, M. Phys. Rev. Lett. 1996, 77, 3865
- Monkhorst and Pack 1976 Monkhorst, H. J.; Pack, J. D. Phys. Rev. B 1976, 13, 5188
- Methfessel and Paxton 1989 Methfessel, M.; Paxton, A. T. Phys. Rev. B 1989, 40, 3616
- Yu and Trinkle 2011 Yu, M.; Trinkle, D. R. J. Chem. Phys. 2011, 134, 064111
- Winterbottom 1967 Winterbottom, W. L. Acta Metall. 1967, 15, 303