A possible signature of non-uniform Be- relationships for the Galaxy⋆⋆affiliationmark:
Abstract
Most of the previous studies on beryllium abundances in metal-poor stars have taken different Galactic populations as a whole when investigating the production and evolution of Be. In this Letter, we report on the detection of systematic differences in [/H]-(Be) relationships between the low- and high- stars which were identified by previous works. We remind that one should be more careful in investigating the Galactic evolution of Be with a sample comprising different Galactic populations, because such a mixed sample may lead to inaccurate Be-Fe/Be-O relationships.
1 Introduction
During the past two decades, astronomers have been working on beryllium (Be) abundances in metal-poor stars to investigate the production and evolution of Be in the early Galaxy. Most of these studies have taken different Galactic populations (halo and thick-disk stars, if included) as a whole when investigating the Be-Fe and Be-O relationships. This may be partly due to that the production of Be is thought to be a global process across the Galaxy, and therefore Be abundances should show small scatter at a given metallicity (Suzuki & Yoshii 2001), no matter which population the stars belong to. Boesgaard & Novicki (2006) presented, for the first time, some evidences of Be abundances dispersions. Smiljanic et al. (2008) and Tan et al. (2009) also found some Be-rich stars which are obviously above the general Be-Fe and Be-O trends. In their Be abundance survey with the largest sample to date, Smiljanic et al. (2009, hereafter S09) found a marginal statistical detection of a real scatter in the [Fe/H]-(Be)111, diagram. They proposed two possible explanations for this: one is that the halo and the thick-disk stars have different [Fe/H]-(Be) relationships; the other is that Be abundances dispersions exist at any given metallicity.
It is now generally believed that the Galaxy was formed through hierarchical merging, which means that different components of the Galaxy may have experienced different chemical evolution histories. Since -elements are mainly produced by core collapse supernovae, they are closely associated with the star formation history of the Galaxy. In this regard, Galactic components with different -elements abundances patterns may show different behaviors in Be abundances. Nissen & Schuster (1997) found evidence of a bimodal distribution of [/Fe] ( refers to the average abundance of Mg, Si, Ca, and Ti) for about a dozen halo stars. Gratton et al. (2003a, b) found that the accretion component of the Galaxy tends to have lower [/Fe] than the dissipative component. S09 also claimed two distinct components of the Galactic halo, but in the log(Be/H)-[/Fe] diagram, which seems to make the division clearer than in the [Fe/H]-[/Fe] diagram. Recently, Nissen & Schuster (2010, hereafter NS10) performed a precise abundance analysis for a sample of 94 thick-disk and halo stars in the solar neighborhood. They confirmed that, in the [Fe/H]-[/Fe] diagram, the halo stars separate into two distinct populations, i.e. the low- and high- halo populations. The very high precision of stellar parameters and -elements abundances make the sample of NS10 ideal for studying the possible different Be abundance patterns for different Galactic components in a systematic way. In this Letter, we report on the detection of two systematically different Be- relationships for the stars from the sample of NS10.
2 The sample
Among the 94 stars in the sample of NS10, high-resolution and high signal-to-noise ratio VLT/UVES spectra covering the Be II 3130 Å resonance doublet were available from the ESO/ST-ECF Science Archive for 40 stars. We downloaded the reduced spectra for these stars and then determined their Be abundances using the same technique as described in Tan et al. (2009). In addition, another 3 stars have Be abundances from the literature (2 from Rich & Boesgaard 2009 and 1 from Boesgaard & King 1993). For these 3 stars, in order to keep our analysis consistent, we first derived their equivalent widths of the Be II 3130 Å resonance lines based on the Be abundances and stellar parameters from the literature, and then re-calculated their Be abundances. For all the sample stars, stellar parameters given by NS10 were adopted in the determination of Be abundances. The uncertainty of Be abundance mainly comes from the uncertainties of stellar parameters and pseudo-continuum location. NS10 estimated the uncertainties of effective temperature, surface gravity, and metallicity to be 30 K, 0.05 dex, and 0.04 dex, respectively, which leads to a total uncertainty of about 0.03 dex in Be abundance. The typical uncertainty of Be abundance introduced by pseudo-continuum location was estimated to be 0.05 dex. In total, the typical internal uncertainty of Be abundance is around 0.06 dex. Abundances and uncertainties for the -elements were taken from NS10 directly. The abundances results for the sample stars are given in Table A possible signature of non-uniform Be- relationships for the Galaxy⋆⋆affiliationmark: . We noted that, among the 40 stars whose Be abundances were determined directly from the VLT/UVES spectra, 33 stars were included in the sample of S09. If the Be abundances given by S09 are scaled to the stellar parameters of NS10, then the average difference between our results and that of S09 will be dex (ours minus S09’s), which is in reasonable agreement within uncertainties.
In summary, we have consistent Be and -elements abundances for 43 stars, of which 14 are thick-disk stars, 13 are low- halo stars, and 16 are high- halo stars according to NS10 (low-/high- means low/high [/Fe] at a given [Fe/H]). As mentioned in NS10, the classification of thick-disk and halo is based on kinematic criterion which is somehow uncertain (if the velocity distribution of the thick-disk is non-Gaussian with an extended tail toward high velocities, then some of the high- halo stars might belong to the thick-disk population). Therefore, in this work we classify the sample stars into two categories only, i.e. the low- and high- stars, based purely on their -elements abundances. In other words, the low- stars in this work correspond to the low- halo stars in NS10, and the high- stars in this work include both the thick-disk and the high- halo stars in NS10. The reasonableness of classifying the thick-disk and the high- halo stars into the same category can be further supported by the indistinguishable abundance patterns of more elements for these two populations as shown in NS10 and Nissen & Schuster (2011). Gratton et al. (2003a, b) also mentioned that no clear discontinuity between the rotating part of the halo (mostly high- halo stars) and the thick-disk could be found.
3 Results and discussion
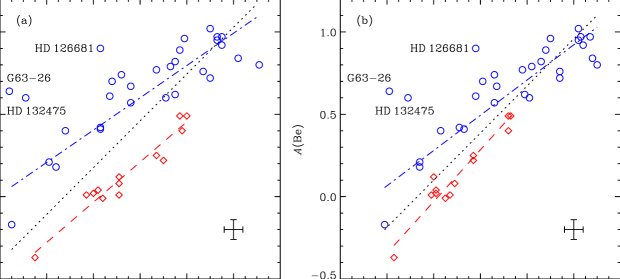
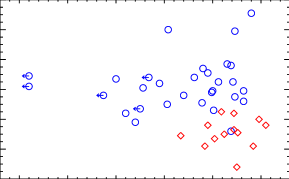
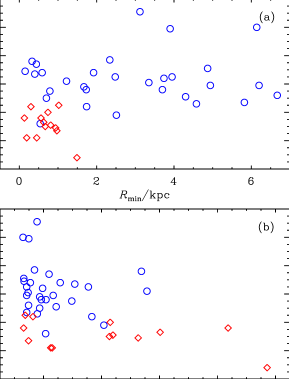
Figure 1 shows (Be) as a function of [Fe/H] and of [/H] for the sample stars. Here we use [/H] as a proxy for [O/H] as it is generally believed that -elements have the same origin as oxygen. Similar approximation has also been adopted by S09. It can be seen clearly in Figure 1(a) that Be abundances of the low- stars are systematically lower than that of the high- stars, and the differences are obviously larger than the uncertainties of Be abundances. Even so, one may still expect a uniform (Be) versus [/H] relationship for the sample stars because the production of Be is thought to be correlated directly with oxygen (and thus -elements) rather than iron. However, as can be seen in Figure 1(b), Be abundances of the low- stars are still systematically lower than that of the high- stars. As the differences in Be abundances in the [/H]-(Be) diagram are not as obvious as that in the [Fe/H]-(Be) diagram, we made a statistical test to confirm whether the division is a real feature or just caused by the uncertainties of the analysis. We made linear fits, in the common [/H] range (), to the high- stars, to the low- stars, and to the whole sample222All through this Letter, G63-26, HD 132475, and HD 126681 are not included in any linear fits; please refer to the last paragraph but one of this Letter for more discussions about these three stars., and then calculated the root mean square (RMS) deviations from the fits respectively. The RMS deviations from the fits for the high- and low- stars are 0.07 and 0.06 dex, respectively, which are comparable to the Be abundances uncertainty (0.06 dex); while the RMS deviation for the whole sample is 0.18 dex, which is obviously larger than the error of Be abundances. Therefore, we conclude that systematic differences in [/H]-(Be) relationships do exist between the low- and high- stars in our sample. One may think that Be in the low- stars have been depleted and thus the abundances are lower than that of the high- stars. This is, however, not the case. As shown in Figure 2, Li abundances of the low- stars are in the upper range of the sample, but their [Be/] values (solar Be abundance recommended by Lodders 2010 was adopted in the calculation) are systematically lower than that of the high- stars. As the destruction temperature for Li is lower than that of Be, if Be is depleted, then Li should have been depleted more than Be. The possibility that the gas from which the low- stars formed had been exposed to the cosmic-rays shorter than that of the high- stars and thus has lower Be abundances can also be excluded, because the low- stars are on average 2–3 Gyr younger than the high- stars (Schuster et al. 2011, in preparation). Pasquini et al. (2005) proposed the possibility that some stars may form at very large Galactocentric radii with lower cosmic-ray fluxes and thus lower production of Be and heavy elements. However, as shown in Figure 3, we didn’t find any gradient in Be abundances for the sample stars. In the Be abundance survey with the largest sample to date by S09, no decreasing trend in Be abundance with increasing Galactocentric distance was found, either.
S09 identified 4 pairs of stars with similar atmospheric parameters and metallicities but different Be abundances to testify the existence of scatter in Be abundances. We suggest that one of the main reasons for the scatter is the composition of the pairs. Among these 4 pairs of stars, 3 pairs are included in our sample, and each pair is comprised of one low- star and one high- star. According to the definition of NS10, at a given [Fe/H], low- stars have lower [/Fe] (and thus [/H]) than high- stars. Moreover, at a given [/H], low [/Fe] stars have less Be than high [/Fe] stars as shown in Figure 1(b). Therefore, it is natural that low- stars have lower Be abundances than high- stars with the same metallicities. Also, it can be easily understood that the separation between the low- and high- stars in the [Fe/H]-(Be) diagram is clearer than that in the [/H]-(Be) diagram (compare the two panels of Figure 1). S09 noted the impression of two parallel relations in the Be-Fe diagram. However, they did not detect the different [/H]-(Be) relationships. This may be partly due to the relatively large abundance uncertainties of S09 (note that the stellar parameters and -elements abundances adopted by S09 were taken from different works and had not been homogenized).
As suggested by NS10, the high- stars may form in regions with rapid chemical evolution, while the low- stars may originate from dwarf galaxies with lower star formation rates. In this case, the energy spectrum for the cosmic-rays may be different in the regions where the low- and high- stars formed, and thus the production rate of Be could be different (as the effective spallation cross-sections are dependent on the energies of the cosmic-rays). Therefore, systematic differences in Be abundances between the low- and high- stars can be a natural prediction from the explanation of NS10. We note that the bimodal distribution of [/Fe] observed by NS10 is consistent with the theoretical results of Zolotov et al. (2009, 2010), which are based on the assumption that the inner halos of the galaxies contain both stars accreted from satellite galaxies and stars formed in situ. However, Nissen & Schuster (2011) shows that abundance patterns of the low- stars do not match that of the present-day dwarf galaxies. They suggest that the low- stars may have been accreted from more massive satellite galaxies at early times.
As shown in Figure 1(b), in the common [/H] range (), (Be) of the high- stars increases with [/H] faster than that of the low- stars; however, if the “metal-rich” end of the high- stars are included, then the [/H]-(Be) relationship for the high- stars will be flatter than that for the low- stars. Such a break in the [/H]-(Be) relationship makes it look like that the “metal-rich” end of the high- stars are following the relation defined by the low- stars. Similar change in slope also seems to appear in the [Fe/H]-(Be) relationship at as can be seen in Figure 1(a). Inspired by the prediction of shallower slope at higher metallicity from the mass outflow models, Boesgaard et al. (1999) investigated the possible change in slope in the Be-Fe relationship. But the metallicity range covered by this work is relatively narrow, and our sample is a bit small, hence it is premature to make any conclusions. According to NS10, for halo stars with (), the low- and high- populations will merge together in the [Fe/H]-[/Fe] diagram due to the same origins of iron and -elements. However, these two populations could still be distinguished in the [/H]-(Be) diagram only if the environments where these two populations formed had different energy spectrum for the cosmic-rays. In this regard, the [/H]-(Be) diagram can be a useful tool to investigate the properties of the environments where the stars formed.
We note that there are three stars standing out the general Be- (and Be-Fe) trend obviously. HD 132475 was first found to be Be-rich by Boesgaard & Novicki (2006) and was later confirmed by Tan et al. (2009). HD 126681 was found to be Be-rich by Tan et al. (2009). G63-26 is a new Be-rich star found in this work; its Be abundance is about 0.8 dex higher than that of normal stars with similar [/H]. According to the results of NS10 and Nissen & Schuster (2011), G63-26 shows normal Na, Mg, Ca, Ti, Cr, Mn, and Cu abundances, but is overabundant in Si and Ni. The Y and Ba abundances of this star are also in the upper range of the sample. The Li abundance of G63-26 is determined to be , which is a bit higher than the Spite plateau. Such a peculiar abundance pattern is very similar to that of HD 106038, which shows obvious overabundances of Li, Si, Ni, Y, and Ba as described in Smiljanic et al. (2008), though the amplitudes of abundance deviations from normal stars are much smaller than that of HD 106038. This indicates that the gas from which G63-26 formed may have experienced the same but less intensive chemical enrichment process as HD 106038 (for example, polluted by nucleosynthetic products of Hypernovae as suggested by Smiljanic et al. 2008).
In summary, we detect systematic differences in [/H]-(Be) relationships between the low- and high- stars in the Galaxy. The [/H]-(Be) diagram for different Galactic populations can help us understand better the formation and chemical evolution of the Galaxy. We remind that, using a sample comprising different Galactic populations to investigate the Galactic evolution of Be may lead to inaccurate Be-Fe/Be-O relationships. For example, in the whole metallicity range covered by our sample stars, the equations of linear fits to the [/H]-(Be) relationships for the high- stars, for the low- stars, and for the whole sample are , , and , respectively (the corresponding equations of the [Fe/H]-(Be) relationships are , , and , respectively), which are not the same within uncertainties. However, we should keep in mind that the sample of this work is relatively small, and the results need to be confirmed with a larger sample. Besides, we use the -elements abundances as a proxy for oxygen abundances, while it is better to investigate the Be-O relationships directly, though O abundances derived from different indicators are usually not consistent. Nevertheless, we hope that the results presented in this work could stimulate more research on Galactic evolution of Be and related fields, both observational and theoretical.
References
- Boesgaard et al. (1999) Boesgaard, A. M., Deliyannis, C. P., King, J. R., Ryan, S. G., Vogt, S. S., & Beers, T. C. 1999, AJ, 117, 1549
- Boesgaard & King (1993) Boesgaard, A. M., & King, J. R. 1993, AJ, 106, 2309
- Boesgaard & Novicki (2006) Boesgaard, A. M., & Novicki, M. C. 2006, ApJ, 641, 1122
- Charbonnel & Primas (2005) Charbonnel, C., & Primas, F. 2005, A&A, 442, 961
- Gratton et al. (2003a) Gratton, R. G., Carretta, E., Claudi, R., Lucatello, S., & Barbieri, M. 2003a, A&A, 404, 187
- Gratton et al. (2003b) Gratton, R. G., Carretta, E., Desidera, S., Lucatello, S., Mazzei, P., & Barbieri, M. 2003b, A&A, 406, 131
- Lodders (2010) Lodders, K. 2010, in Principles and Perspectives in Cosmochemistry, ed. A. Goswami & B. E. Reddy (Berlin: Springer), 379
- Nissen & Schuster (1997) Nissen, P. E., & Schuster, W. J. 1997, A&A, 326, 751
- Nissen & Schuster (2010) Nissen, P. E., & Schuster, W. J. 2010, A&A, 511, L10 (NS10)
- Nissen & Schuster (2011) Nissen, P. E., & Schuster, W. J. 2011, A&A, 530, A15
- Pasquini et al. (2005) Pasquini, L., Galli, D., Gratton, R. G., Bonifacio, P., Randich, S., & Valle, G. 2005, A&A, 436, L57
- Rich & Boesgaard (2009) Rich, J. A., & Boesgaard, A. M. 2009, ApJ, 701, 1519
- Shi et al. (2007) Shi, J. R., Gehren, T., Zhang, H. W., Zeng, J. L., & Zhao G. 2007, A&A, 465, 587
- Smiljanic et al. (2009) Smiljanic, R., Pasquini, L., Bonifacio, P., Galli, D., Gratton, R. G., Randich, S., & Wolff, B. 2009, A&A, 499, 103 (S09)
- Smiljanic et al. (2008) Smiljanic, R., Pasquini, L., Primas, F., Mazzali, P. A., Galli, D., & Valle, G. 2008, MNRAS, 385, L93
- Suzuki & Yoshii (2001) Suzuki, T. K., & Yoshii, Y. 2001, ApJ, 549, 303
- Tan et al. (2009) Tan, K. F., Shi, J. R., & Zhao, G. 2009, MNRAS, 392, 205
- Zolotov et al. (2009) Zolotov, A., Willman, B., Brooks, A. M., Governato, F., Brook, C. B., Hogg, D. W., Quinn, T., & Stinson, G. 2009, ApJ, 702, 1058
- Zolotov et al. (2010) Zolotov, A., Willman, B., Brooks, A. M., Governato, F., Hogg, D. W., Shen, S., & Wadsley, J. 2010, ApJ, 721, 738
| Star | [Fe/H] | [/H] | (Be) | Ref. | (Li) | Ref. | Ref. | ClassaaParentheses means the classification is uncertain for stars with according to NS10. | ||
|---|---|---|---|---|---|---|---|---|---|---|
| BD | 0.61 | (1) | 1.95 | (2) | 4.87 | 8.55 | (2) | high- | ||
| CD | 0.18 | (1) | 2.32 | (2) | 6.67 | 8.88 | (2) | high- | ||
| CD | 0.22 | (1) | 2.22 | (2) | 0.63 | 25.25 | (2) | low- | ||
| CD | 0.01 | (1) | 2.12 | (2) | 0.67 | 16.87 | (2) | low- | ||
| G05-19 | 0.04 | (1) | 2.26 | (2) | 0.81 | 17.35 | (2) | low- | ||
| G05-40 | 0.96 | (1) | 1.90 | (2) | 0.44 | 10.45 | (2) | high- | ||
| G18-28 | 0.89 | (1) | (2) | 0.15 | 8.57 | (2) | high- | |||
| G18-39 | 0.21 | (1) | 2.23 | (6) | 0.79 | 12.52 | (1) | high- | ||
| G21-22 | 0.12 | (3) | 2.48 | (7) | 0.74 | 16.98 | (1) | low- | ||
| G46-31 | 0.49 | (1) | 2.09 | (2) | 1.02 | 8.65 | (2) | low- | ||
| G63-26 | 0.64 | (1) | 2.40 | (1) | 3.12 | 9.50 | (1) | (high-) | ||
| G121-12 | 0.25 | (1) | 2.55 | (2) | 0.13 | 43.31 | (2) | low- | ||
| G159-50 | 0.77 | (1) | 1.00 | (2) | 0.40 | 12.82 | (2) | high- | ||
| G188-22 | 0.40 | (1) | 2.21 | (8) | 2.48 | 14.28 | (1) | high- | ||
| HD 3567 | (1) | 2.42 | (2) | 0.19 | 10.72 | (2) | low- | |||
| HD 17820 | 0.95 | (1) | 1.28 | (2) | 3.35 | 8.85 | (2) | high- | ||
| HD 22879 | 0.82 | (1) | 1.45 | (2) | 3.74 | 9.93 | (2) | high- | ||
| HD 25704 | 0.62 | (1) | 1.89 | (2) | 4.30 | 11.06 | (2) | high- | ||
| HD 51754 | 0.84 | (1) | 1.10 | (2) | 1.74 | 14.68 | (2) | high- | ||
| HD 76932 | 0.79 | (1) | 2.06 | (2) | 3.95 | 8.75 | (2) | high- | ||
| HD 97320 | 0.42 | (1) | 2.32 | (4) | 6.20 | 10.80 | (4) | high- | ||
| HD 103723 | 0.49 | (1) | 2.22 | (4) | 0.30 | 9.20 | (4) | low- | ||
| HD 105004 | 0.40 | (1) | 1.95 | (2) | 0.56 | 8.54 | (2) | low- | ||
| HD 111980 | 0.74 | (1) | 2.19 | (2) | 0.33 | 21.76 | (2) | high- | ||
| HD 113679 | 0.97 | (1) | 1.99 | (2) | 1.67 | 9.70 | (2) | high- | ||
| HD 114762A | 0.72 | (1) | 2.01 | (2) | 4.58 | 9.52 | (2) | high- | ||
| HD 120559 | 0.60 | (1) | (2) | 5.82 | 8.75 | (2) | high- | |||
| HD 121004 | 1.02 | (1) | (2) | 0.59 | 9.01 | (2) | high- | |||
| HD 126681 | 0.90 | (1) | 1.54 | (2) | 6.14 | 8.50 | (2) | high- | ||
| HD 132475 | 0.60 | (1) | 2.23 | (4) | 3.90 | 8.90 | (4) | (high-) | ||
| HD 148816 | 0.76 | (1) | 1.53 | (2) | 0.70 | 9.70 | (2) | high- | ||
| HD 160693 | 0.80 | (5) | 1.20 | (5) | 2.51 | 16.15 | (1) | high- | ||
| HD 163810 | 0.02 | (1) | 1.67 | (2) | 0.94 | 21.21 | (2) | low- | ||
| HD 175179 | 0.92 | (1) | (4) | 1.73 | 9.83 | (2) | high- | |||
| HD 179626 | 0.67 | (1) | 1.81 | (2) | 1.92 | 11.42 | (2) | high- | ||
| HD 189558 | 0.70 | (1) | 2.15 | (2) | 2.34 | 9.31 | (2) | high- | ||
| HD 193901 | 0.01 | (1) | 1.92 | (2) | 0.45 | 10.59 | (2) | low- | ||
| HD 194598 | 0.08 | (1) | 2.02 | (2) | 0.97 | 8.88 | (2) | low- | ||
| HD 199289 | 0.57 | (1) | 2.00 | (2) | 4.94 | 8.75 | (2) | high- | ||
| HD 205650 | 0.41 | (1) | 1.70 | (4) | 3.70 | 10.20 | (4) | high- | ||
| HD 219617 | (1) | 2.25 | (2) | 1.49 | 59.03 | (2) | (low-) | |||
| HD 222766 | 0.97 | (1) | (2) | 1.22 | 22.74 | (2) | high- | |||
| HD 233511 | (3) | 2.19 | (8) | 0.54 | 10.17 | (1) | (high-) |