Causal inference in transportation safety studies: Comparison of potential outcomes and causal diagrams
Abstract
The research questions that motivate transportation safety studies are causal in nature. Safety researchers typically use observational data to answer such questions, but often without appropriate causal inference methodology. The field of causal inference presents several modeling frameworks for probing empirical data to assess causal relations. This paper focuses on exploring the applicability of two such modeling frameworks—Causal Diagrams and Potential Outcomes—for a specific transportation safety problem. The causal effects of pavement marking retroreflectivity on safety of a road segment were estimated. More specifically, the results based on three different implementations of these frameworks on a real data set were compared: Inverse Propensity Score Weighting with regression adjustment and Propensity Score Matching with regression adjustment versus Causal Bayesian Network. The effect of increased pavement marking retroreflectivity was generally found to reduce the probability of target nighttime crashes. However, we found that the magnitude of the causal effects estimated are sensitive to the method used and to the assumptions being violated.
doi:
10.1214/10-AOAS440keywords:
., and
1 Introduction.
An estimated 2.2 million people suffered some kind of transportation-related injury in 2007. About 87 percent of these injuries resulted from highway crashes [Bureau of Transportation Statistics (2007)]. Transportation safety management aims at identifying causes of such crashes, developing countermeasures to mitigate crashes, and evaluating the effectiveness of a safety countermeasure. It is well known that causal propositions of this kind, and their effect sizes, are best estimated from randomized experiments.
The types of data available in transportation safety studies are primarily observational, which makes it difficult to consistently estimate causal effects of countermeasures. In this paper we evaluate and compare the application of two commonly used causal inference frameworks (one that is commonly applied in computer science and another that is commonly applied in statistics) to transportation safety. In particular, the aim of this paper is twofold:
-
•
To introduce a unique transportation safety data set, created from multiple sources, and to highlight the problems associated with the data used in safety studies.
-
•
To explore the application of causal inference methods in transportation safety studies and document the issues associated with the analyses. We do this by estimating the causal effect of pavement marking retroreflectivity () on target nighttime crashes using the causal modeling frameworks of the Potential Outcomes (PO) and Causal Diagrams (CD), and then compare the results.
Causal inference methods in transportation safety studies have received little attention. Davis (2000) provides a review and notes that the assignment mechanism must be included in statistical models to consistently estimate the effect of any countermeasure on crashes. Davis (2004) uses Pearl’s causal Bayesian networks (CBN) for crash reconstruction and examines token causal claims to answer single-event causation questions; see Eells (1991) for a review of token and type causes.111Token causes are those associated with a single unit or event, for instance, “Since Jane was speeding, she ended up in an accident.” On the other hand, type causal claims are associated with a population, for instance, “Speeding causes crashes.” In contrast to single-event causation, our work examines the application of causal inference methods to population level causal effects in transportation safety studies. Population causal claims are more applicable to transportation safety management since they reflect the effect of countermeasures in a population as opposed to singular causal claims which are geared more toward accident reconstruction and liability issues. We examine the hypothesis that low levels are causative agents for an increase in the risk of nighttime crashes. Causal effects are estimated using the PO framework and CD framework, and the results are compared.
It has been shown that the PO framework and the CD framework are mathematically (theoretically) equivalent; see Pearl (2000), Chapter 7. However, there are different statistical implementations of these frameworks that offer different paths to estimate causal effects, and, in practice, the results may or may not be similar. For instance, the PO framework is commonly implemented using propensity score matching or inverse propensity score weighting, and the CD framework is commonly implemented using CBNs. Several assumptions relating to estimation of a causal effect from observational data are reviewed in Sections 4 and 5. Apart from these, differences in the estimates of causal effect could arise due to additional assumptions required by each framework, inherently tied to the aforementioned statistical implementations. For instance, the CD framework requires the use of a causal graph that represents the qualitative causal mechanism of the data generating process. This graph can be obtained from prior knowledge and/or data. The algorithms used to recover causal graphs from data require additional assumptions such as faithfulness and some require the data to be either discrete or Gaussian. The PO framework does not require these additional assumptions since it does not require such causal graphs.222The PO framework requires the analyst to qualitatively model the treatment assignment mechanism (see Section 4.1). The use of graphs to represent the treatment assignment mechanism could make this easier to communicate; see the discussion section. Furthermore, while the CD framework enables one to work with the complete data set, the PO framework could lead to elimination of a part of the data set if one uses matching. Sfer (2005) and Fienberg and Sfer (2006) show in a simple simulated logistic regression example that there is an implicit agreement between PO and CD frameworks. However, we are not aware of a study that explores the differences, compares the results of both modeling frameworks on real-life observational data, and examines the advantages and disadvantages associated with applying each method in a practical context.
A complete and rigorous comparison of both frameworks requires considerations of all possible implementations, which is beyond the scope of this paper. Here, we focus on two commonly used implementations in practice, both of which use the complete data set in order to allow for a better comparison of the results. We implement the PO framework using inverse propensity score weighting (IPW) and regression adjustment, and the CD framework using discrete causal Bayesian Networks (CBN); the implementation details are provided in Sections 4 and 5. We also implemented the PO framework using propensity score matching333We report the estimates of causal effects from matching in the paper, and provide the implementation details in the supplementary material. since it is a popular alternative to IPW. However, as previously noted, matching could lead to elimination of part of the data and the comparison of estimates with those from CBN may be biased due to differences in the data themselves. This issue is further discussed in Sections 4 and 7 of the paper.
The remainder of the paper is organized as follows: Section 2 introduces the problem statement; Section 3 introduces the data set and the design of the hypothetical experiment to estimate the causal effects; Sections 4 and 5 present the analyses and results of the PO framework and the CD framework; Section 6 compares the results; and, Section 7 concludes with a discussion.
2 Problem description.
The traffic accident fatality rate increases by almost 75 percent during the period of time between 9 p.m. and 6 a.m. [National Highway Traffic Safety Administration (2007)]. This raises a question of what can be done about the fact that there is a greater rate of crashes at night than during the day? It is hypothesized that low pavement marking visibility may be one cause of the increased rate of nighttime crashes. One of the objectives of the paper is to examine this hypothesis.
Pavement markings delineate the limits of the traveled way and provide drivers navigation and control guidance. During the daytime, drivers are likely to use a combination of pavement markings, other traffic control devices (e.g., signs) and visual cues along the roadside (e.g., utility poles, vegetation, etc.) to navigate a roadway. Pavement markings have an important role at night. Apart from delineating the road, pavement markings reflect the light shone from a car’s headlamps back to the driver, thus enabling the driver to see the limits of the traveled way. This is known as retroreflectivity and is measured in millicandelas per square meter per lux (mcd/m2/lux). Retroreflectivity in pavement markings is provided by glass spheres that are dropped-on or premixed with a wet pavement marking material. degrades over time because of fatigue to the material and its bond strength with glass spheres or the pavement surface. State transportation agencies typically re-stripe pavement markings after the end of their useful service life, defined as the time when retroreflectivity falls below a minimum threshold level.
A considerable amount of research has been carried out regarding the safety benefits of . To answer the question if improving has any effect in reducing the number of traffic crashes, most of the published literature used regression models with observational data, ignoring the treatment assignment mechanisms; for a literature review, refer to Bahar et al. (2006) and Donnell, Karwa and Sathyanarayanan (2009). Also Donnell, Karwa and Sathyanarayanan (2009) point out that none of the studies explicitly relate the in-situ levels to the crash event. This is due to the fact that levels and crash data are obtained from separate sources and merging them is difficult. The problems associated with merging these databases have been described in Karwa (2009). Donnell, Karwa and Sathyanarayanan (2009) was the first study that explicitly combined the data (which is representative of real life degradation patterns of ) with crash data to develop a comprehensive database. This work did show that there were statistical associations between PMR and nighttime crashes. We use this database to examine, for the first time, the nature of the effect of on traffic safety (defined in Section 3) using the PO and the CD frameworks. The results are compared with a discussion of the application of the two methods, in an attempt to determine their possible broader application in transportation safety studies.
3 Description of the data and design of the study.
The fundamental unit of operation in this paper is a homogeneous road segment; homogeneous refers to having uniform geometric characteristics such as number of lanes, lane width and shoulder width along a roadway segment. A segment within a fixed time period is considered to be different from the same segment at any other time period. A fixed time period of one month was selected to ensure homogeneity of levels and other characteristics of a segment. For instance, the PMR level and monthly traffic volumes can be assumed to be reasonably uniform within this period.
Crash and data were collected from three districts in North Carolina for a period of 2.5 years. As noted in Section 2, the data were obtained from two different sources. The PMR data were measured by a private contractor using a mobile retroreflectometer with a 30-meter geometry. These data were collected on two-lane and multi-lane highways in North Carolina, approximately every 6 months. All pavement markings were of thermoplastic material. Since retroreflectivity estimates were not measured at the exact time and place of occurrence of the crash, a neural network model was used to interpolate the values of retroreflectivity on the segments where crashes were observed; see Karwa and Donnell (2011).
The roadway inventory and crash event data were obtained from the Highway Safety Information System (HSIS) data files, maintained by the Federal Highway Administration (FHWA). These data were collected for 19 roadway sections in North Carolina. There were 192 total segments (segments are a subset of sections) that corresponded to the 19 sections of roadway where PMR estimates were computed based on the degradation model. Table 3 shows the sections where roadway inventory, crash and PMR data could be linked. There are a total of 5,916 observations, based on 192 segments, 12 months of data per year for each segment and approximately 2.5 years of crash data per segment.444The assumption of independent segments over time is a common assumption in the safety prediction literature that also shows that weak temporal (or spatial) correlations result in a loss of estimation efficiency but not bias.
| Total | Nighttime | ||||||
|---|---|---|---|---|---|---|---|
| Begin | End | Number of | length | target | |||
| County | Route | District | MP | MP | lanes | (miles) | crashes |
| Bertie | US13 | 4 | |||||
| Gates | US13 | 2 | |||||
| Northampton | US158 | 2 | |||||
| Washington | US64 | 2 | |||||
| Durham | I-85 | 4 | |||||
| Durham | US15 | 4 | |||||
| Durham | NC98 | 2 | |||||
| Durham | NC157 | 2 | |||||
| Granville | I-85 | 4 | |||||
| Person | US158 | 2 | |||||
| Vance | I-85 | 4 | |||||
| Vance | US158 | 2 | |||||
| Wake | I-40 | 4/6/8 | |||||
| Wake | NC98 | 2 | |||||
| Warren | I-85 | 4 | |||||
| Warren | US158 | 2 | |||||
| Catawba | I-40 | 4 | |||||
| Iredell | I-40 | 4 | |||||
| Iredell | I-77 | 4 | |||||
| Total |
[a]aRoadway inventory and crash data were not available between mileposts 0.17 & 1.79. \tabnotetext[b]bRoadway inventory and crash data were not available between mileposts 0.76 & 22.69 and 22.73. \tabnotetext[c]cRoadway inventory and crash data were not available between mileposts 3.96 and 5.96. \tabnotetext[d]dRoadway inventory and crash data were not available between mileposts 3.77 and 6.79.
Crashes that satisfied the following criteria, referred to as target crashes, were used in the analysis: occurred during dusk, dawn or at night; dry roadway surface conditions; ran-off-the-road crashes; fixed object crashes (off-road); and opposite- or same-direction sideswipe crashes. Crashes that satisfied the following criteria were excluded from the analysis: work zone area; no alcohol-involvement; weather contributing circumstances; roadway contributing circumstances. It must also be noted that the data are sparse due to rarity of crashes. Only percent of the total number of segments had more than one target crash during the study period.
Safety of a road segment is defined as a random variable, taking the value 1 if there was at least one target crash in the segment during the treatment (or control) application period, and 0 if there was no target crash in the segment. The safety of a segment is stochastic and each segment has a fixed probability of at least one target crash occurring, which is assumed to be an inherent property of the road segment. This definition was chosen to ensure the absence of confounders between safety and , based on the past related safety literature. For instance, if it was clear according to the police crash report that a particular crash occurred due to driving under the influence of drugs or alcohol, such a crash would have been deemed to occur because of human error, and thus excluded from the current analyses. Similarly, crashes in which weather was a contributing factor (such as heavy snow or icy road conditions) were also excluded from the analyses. Weather conditions, human errors, etc. are stochastic factors that may cause crashes but not an inherent property of the segment; hence, any crash occurring due to such conditions would fall into the error term of the observed safety of a road segment.
Treatment variable on a segment is defined as the application of with levels ; the exact range of levels for each class is specified in Table 2. Control is defined as application of pavement markings at one of the two remaining levels of retroreflectivity. Out of the total sample size (), about 36 percent of the segments had levels of , about 46.5 percent had levels and the remaining segments had levels of . The assignment of levels is clearly not random.
Apart from the data on and the crash counts per month, data on 12 other covariates were collected. See Table 2 for definitions and summary statistics of random variables representing information on the attributes of a segment such as the shoulder width, number of lanes, presence of a median, traffic flow characteristics such as monthly traffic volumes (hereafter referred to as ), percentage of trucks, location related variables such as the geographic district in which the segment is located, the urban or rural setting of the segment location, and the terrain type. The data are very sparse, which is typical of safety data. For instance, in the five way cross-classification of the entire sample with respect to the discrete variables and , percent of the cells have sampling zeros.
| Variable | Definition | Descriptive statistics |
|---|---|---|
| Right | Outer shoulder width in feet on right | 9.39 (4.03) |
| Shoulder | side of roadway | [0, 14] |
| 0 if shoulder width 7 feet | 1,238 (9.97%) | |
| 1 otherwise | 4,678 (90.03%) | |
| ADT | Annual average daily traffic adjusted | 30,383 (27,580) |
| for a month, vehicles per day | [1,615, 114,400] | |
| 0 if ADT 30,000 vehicles per day | 2,957 (49.9) | |
| 1 otherwise | 2,959 (50.1) | |
| Truck | Percentage of ADT that consists | 14.8 (8.5) |
| of heavy vehicles | [0, 83] | |
| 0 if Percentage of Trucks 18 | 2,065 (35) | |
| 1 otherwise | 3,851 (65) | |
| PMR | Mean PMR of all markings on a segment | 227 (65) |
| (mcd/m2/lux) | [139, 447] | |
| Low if retroreflectivity | 2,134 (36) | |
| Medium if retoreflectivity | 2,748 (46.5) | |
| High if retroreflectivity | 1,034 (17.5) | |
| Age | Time (in months) elapsed since the application | 15.5 (8.63) |
| of markings on a segment | [1, 30] | |
| 0 if Age 1 | 1,761 (30) | |
| 1 if 10 Age 20 | 1,980 (33.5) | |
| 2 otherwise | 2,175 (36.5) | |
| Multilane | 1 if there is more than 1 lane in each direction | 3,868 (65.4) |
| 0 if there is 1 lane in each direction | 2,048 (34.6) | |
| Median | 1 if the segment contains a median | 4,018 (68) |
| 0 if the segment has no median | 1,898 (32) | |
| Safety | 1 if at least 1 target crash occurred | 376 (6.36) |
| in the segment, during the month | ||
| 0 otherwise | 5,540 (93.65) | |
| Urban | 1 if the segment is located in an urban area | 2,680 (45.3) |
| 0 if the segment is located in a rural area | 3,236 (54.7) | |
| Terrain | 1 if the segment is on flat terrain | 1,320 (22.3) |
| 0 if the segment is on a rolling terrain | 4,596 (77.7) | |
| District | 0 if the segment is located in District 1 | 1,290 (21.8) |
| 1 if the segment is located in District 5 | 3,286 (55.5) | |
| 2 if the segment is located in District 12 | 1,340 (22.7) |
As per Rubin (2008) and Maldonado and Greenland (2002), we conceptualize our problem as a hypothetical experiment to make the problem statement clear. Consider a population of homogeneous road segments. We wish to examine the effect of increased on the safety of a road segment. Ideally, we would like to apply treatment (e.g., ) and control (e.g., ) to the same population and observe the expected safety outcome to measure the causal effect.555In practice, “treatment” would be application of Higher PMR, but here, we define it as application of Low PMR to obtain causal risk ratios greater than 1. The causal effect is defined as the risk ratio of expected safety outcome under the treatment and controls, for the same population. Since this is not possible in practice, we use analytical simulations of this process. Sections 4 and 5 describe the conceptualization of this hypothetical experiment under two different frameworks.
4 Potential outcomes framework.
In this section we present the PO framework as applicable to the current study as well as the results of the analysis. Section 4.1 defines the causal estimands [the “science,” see Rubin (2005)] and explains the treatment assignment mechanism and the assumptions required to estimate causal effects from observational data. Section 4.2 provides details about the implementation of the PO framework, that is, the use of inverse propensity score weighting to achieve balance in the data and the use of regression adjustment to estimate the average causal effect (ACE), after balancing. Section 4.3 presents the results of the analysis.
4.1 Treatment assignment, potential outcomes and assumptions.
Let the homogeneous segments be indexed by the letter . We focus on one hypothetical experiment at a time, introduced in Section 3, and estimate the effect of a binary treatment on safety from a sample of segments. Extension to the case of three levels of treatment of is performed using the method proposed by Rubin (1998) which involves creating a separate propensity score model for each two-level treatment comparison, equivalent to conducting three hypothetical experiments. Thus, in the present case, three separate propensity score models are estimated. This method is followed since it is difficult to simultaneously balance all three treatment groups on all covariates.
The PO framework uses potential outcomes as the fundamental element to estimate the causal effects. We denote the treatment variable by where denotes no treatment or the baseline condition for unit , and denotes the treatment condition. For instance, if we wish to estimate the effect of changing the levels from to , the treatment would be application of and the control would be application of . Associated with each segment are two potential outcomes: of the segment at the end of a month after the treatment has been applied, , and of the same segment at the end of the month if there was no treatment, that is, the baseline condition was applied, . Covariates that represent the attributes of a segment are denoted by the vector for unit . The average causal effect (ACE) of the treatment relative to the baseline for segment is then defined as a causal risk ratio
| (1) |
where denotes expectation and . We assume that , and drop the in the notation for simplicity.
For any particular segment, only one of the two values of and can be observed. This has been termed the “fundamental problem of causal inference” [Rubin (1978); Holland (1986)], because of which unit level causal inferences are not possible.666Except in cases where the functional mechanism of causation is known, this is called token causation; see Pearl (2000), Chapter 7. However, given certain assumptions which are outlined below, the ACE of the treatment on a population can be estimated consistently.
Stable unit treatment value assumption (SUTVA) [Rubin (1990)]. This assumption states that the treatment applied to one unit does not affect the outcome of any other unit and that there are no hidden versions of the treatment (i.e., no matter what mechanism was used to apply the treatment to the unit, the outcome would be the same). The last part is sometimes referred to as the consistency assumption [Cole and Frangakis (2009)]. We make this assumption in the current study even though the treatment has been applied in groups (several segments along a particular route may have the same value of ). The following example illustrates a scenario where this assumption could be violated. Consider two consecutive segments on the same route. A vehicle traveling on this road could end up in a crash in segment 2 because of low visibility on segment 1. Such scenarios are not uncommon, but when crashes are reported, the reporting officer estimates the approximate segment location where the crash was initiated (after careful analysis of the evidence available at the crash site, such as skid marks, etc.) and the crash is attributed to that segment. Hong and Raudenbush (2005) extend SUTVA to account for possible interference among segments, but we do not consider this extension here.
Positivity. The positivity assumption states that there is a nonzero probability of receiving every level of treatment for every combination of values of exposure and covariates that occur among individuals in the population [Rubin (1978); Hernan and Robins (2006)]. We make the positivity assumption since, in principle, each segment can be assigned any level of treatment.
Unconfoundness. The treatment mechanism is said to be unconfounded given a set of covariates , if the treatment is conditionally independent of the potential outcomes given the covariates
| (2) |
In a randomized experimental setting, would be unconditionally independent of the potential outcomes by design. In the current setting this is not the case, but the treatment assignment can be made conditionally independent of the potential outcomes by balancing on observed covariates. This requires modeling the treatment assignment mechanism as explained below.
4.1.1 Treatment assignment mechanism.
Let be the propensity score. The propensity scores are used in assignment of the treatment to the segments in order to achieve balance. Following Rosenbaum and Rubin (1983), treatment assignment is strongly ignorable given a vector of covariates if unconfoundedness and common overlap hold:
| (3) | |||
| (4) |
In the current setting, the treatment assignment mechanism can be assumed to consist of two parts. In the first part, pavement markings are applied by transportation agencies at different segments with a similar level of retroreflectivity (usually falling into the category ). In the second part, the markings are left to deteriorate over a period of 2.5 years. The levels decrease due to stress on the pavement marking material from vehicle passes and natural factors such as weather. Thus, it can be assumed that nature assigns a level of based on the time elapsed since the initial application period () of the pavement marking, number of vehicle passes and weather conditions. The assignment of levels for each segment depends on the of the marking within the segment and the number of vehicle passages over the segment within that period. Apart from this, levels may also depend on the location of the segment (due to differences in weather conditions), the percentage of trucks that compose the traffic volumes (stress on the marking material is generally greater due to heavier vehicles) and the number of lanes in a segment (the levels used are the average of the different pavement markings present in a segment, and multi-lane segments generally have at least one extra marking when compared to two lane segments). All of these variables are included to form a rich propensity score model that specifies the assignment mechanism.
4.2 Inverse propensity score weighting and regression adjustment.
Below is a description of a particular implementation of the PO framework that estimates ACE and ensures that the assumptions outlined in the previous sections are satisfied. This implementation is a form of doubly robust estimation; see Bang and Robins (2005). The same two steps are repeated to estimate the ACE for each of the three comparisons:
-
[Step 2]
-
Step 1
Estimate the propensity score model and achieve balance, via inverse propensity score weighting (IPW); see Hirano and Imbens (2001).
-
Step 2
Estimate ACE, via regression adjustment method.
Inverse propensity score weighting: The Generalized Boosting Model[GBM, McCaffrey, Ridgeway and Morral (2004)], a multivariate nonparametric technique, was used to estimate the propensity scores. Although logistic regression is the most common way to estimate the propensity scores, studies have shown that other methods can offer considerable improvement [e.g., see Lee, Lessler and Stuart (2009)]. The analysis was carried out using the “twang” package in R [Ridgeway, McCaffrey and Morral (2006)]. Weights were computed from the estimated propensity scores and balance in the data is tested using the estimated weights. Balance is tested by comparing the distributions of key covariates in the treatment and control groups of the weighted data using the Kolmogorov–Smirnov (KS) test statistic. A weight of is assigned to the treatment group and a weight of to the control group, where is the estimated propensity score.777These correspond to the population weights (ATE weights in the twang package). Hirano, Imbens and Ridder (2003) show that the use of a nonparametric estimate of propensity score to estimate weights, rather than the true propensity score, can lead to an efficient estimate of ACE. If balance is not achieved, the propensity score model is re-specified and the process is repeated. The model is re-specified by changing the tuning parameters of the boosting model. The tuning parameters are the number of trees used to fit the model, the shrinkage parameter and the interaction depth; see McCaffrey, Ridgeway and Morral (2004) for details. In the selected propensity score models, we used an interaction depth of 2 (i.e., the model fits all two-way interactions), the shrinkage parameter was set at 0.01 and the number of trees were set at 15,000.
Regression adjustment: Once the samples (segments) are divided into control and treatment groups and balance is achieved, several methods exist to estimate the ACE of the treatment [Schafer and Kang (2008)]. We applied the inverse propensity weighted regression adjustment. In this method, a model for the safety outcomes (henceforth referred to as the outcome model) under both treatment and control application is estimated888One could also specify two separate outcome models, one for the outcome under treatment and one for the outcome under control. We follow this approach in the matching implementation, which is described in the supplementary material [Karwa, Slavković and Donnell (2011)]. using weighted regression; the weights come from the estimated propensity scores. We again make use of GBM to estimate a single regression model by using an indicator for the treatment. All covariates listed in Figure 1 are included in the model, and we choose the interactions implicitly. Overfitting is avoided by using 10-fold cross-validation and out-of-bag estimation [Ridgeway (2007)]. The GBM model of the outcomes is used to predict the probability distributions of and .
Once the model for the outcomes is specified, we used two approaches to estimate the ACE that is the causal risk ratio of equation (1). The standard errors for these estimates were obtained by bootstrapping. In the combined prediction approach, the complete data are used to predict the outcome under treatment application using the outcome model, and the complete data are used to predict the outcome under control application. In the individual prediction approach, only treated data are used to predict the outcome under treatment application, and only control data are used to predict the outcome under the control application. In other words, in the combined method, the complete data are used to estimate the potential outcomes under treatment and control application, irrespective of the actual assignment,999It must be noted that the combined prediction is similar in spirit to the “do” operator, which will be introduced in the Causal Diagrams section; see also the discussion section. Also, the individual prediction can be considered to be an “analytical simulation” of a randomized experiment. whereas in the individual method the potential outcomes under treatment and control are estimated by using that part of the data which actually received the treatment and control assignment, respectively. In both methods, the final ACE is estimated as the ratio of expected outcome under treatment and expected outcome under control [cf. equation (1)]. The results of the two methods and their comparisons are presented in the next section.
4.3 Results.
This section presents the results for each of the three comparisons in terms of achieved balance and estimates of ACE.
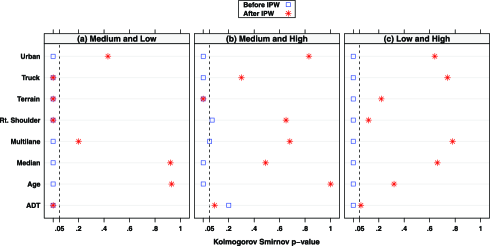
Balance of key covariates. Figure 1 summarizes the effect of weighing on achieving the balance; more detailed statistics are provided in the supplementary materials [Karwa, Slavković and Donnell (2011)]. The graph shows the -value for the Kolmogorov–Smirnov test statistic before and after the weighting of key covariates for each of the three comparisons. Figure 1(a) shows that there was a considerable improvement in the balance after IPW for the Medium to Low comparison. However, the variables Truck, Terrain, ADT and Right shoulder width remain unbalanced even after weighting. Terrain was also unbalanced in the High to Medium comparison; see Figure 1(b). Figure 1(c) shows that all covariates seem reasonably well balanced for the High to Low comparison.
| Individual prediction | Combined prediction | |||
|---|---|---|---|---|
| Change in | ||||
| visibility level | Point estimate | 95% limits | Point estimate | 95% limits |
| High to Low | 2.53 | 3.09 | ||
| Medium to Low | 1.21 | 1.35 | ||
| High to Medium | 1.82 | 1.88 | ||
Estimation of ACE. The estimates of ACE for each of the comparisons are shown in Table 3 for both individual and combined predictions. For the High to Low comparison, the results from both prediction methods suggest that application of High significantly reduces the risk of a target crash in comparison to application of Low . Based on the results from both groups, the risk of a target crash on segments with Low is 3.09 times that of High . Furthermore, we can be 95 percent confident that the expected risk of a crash on segments with low is between and times that on segments with application of High . Similarly, based on the results from the prediction from individual groups, the risk of a target crash on segments with Low is 2.53 times that of High with the 95 percent confidence interval [2.31, 3.60]. The ACE point estimates from the two methods are quite different, but there is considerable overlap in the confidence intervals, with the interval from the combined prediction being slightly wider than from the individual prediction. This is due to model-based extrapolation in the combined method.
The results for High to Med comparison, from both methods, also suggest that application of High significantly reduces the risk of a target crash in comparison to application of Med , but the expected risk is smaller in magnitude than for High to Low comparisons. The point estimates of the ACE from two methods are close to each other with considerable overlap in the confidence intervals: combined ACE of 1.88 (95% CI: 1.5, 2.02) and individual ACE of 1.82 (95% CI: 1.67, 1.97).
For the Med to Low comparison, the results indicate that there may be no significant effect of changing the PMR level from Low to Med. The point estimates of the ACE and the confidence intervals from the two methods are close to each other. From the combined prediction, the risk of a target crash on segments with Low is 1.35 (95% CI [0.8, 1.81]) times that of Med . From the individual prediction, the risk of a target crash on segments with Low is 1.21 (95% CI [0.9, 1.4]) times that of Med . However, it must be noted that this was the most difficult data subsample to attain the balance on the covariates, and the risk ratios may be biased, due to lack of balance over important key covariates.
5 Causal diagrams.
In this section we present the Causal Diagrams (CD) framework to estimate ACEs. We use discrete Causal Bayesian networks (CBN) to implement the CD framework as described in Section 5.1. Section 5.2 briefly discusses the algorithms used to recover a CBN from observational data, the required assumptions and estimation procedures for the ACE. Section 5.3 presents the results of the analysis.
5.1 Causal diagrams and components of a causal model.
In the CD setting, a causal model is used as the fundamental element to estimate causal effects, in contrast with the PO model, where potential outcomes are the fundamental quantities. Let denote the set of variables representing the attributes of a road segment which includes both the treatment assigned to a segment and its safety outcome. A Causal Model describes the causal relations (in the form of conditional independence) among the variables in . The qualitative part of the model is represented by a graph using a set of nodes and edges, and the quantitative part by a set of conditional probability distributions associated with each node in the graph.
In our analysis, we represent the Causal Model by using a discrete Causal Bayesian Network (CBN) for implementing the CD framework.101010CBNs with continuous variables are possible, but algorithms for handling arbitrary continuous distributions are not well developed. Also, many algorithms cannot handle mixed BNs (mixed here refers to the combination of continuous and discrete variables) that have continuous parents of discrete children. A CBN consists of a directed acyclic graph (DAG) and a set of probability distributions associated with each node, represented by a conditional probability table (CPT). Figure 2 shows an example of such a graph, where, for instance, Safety () is a child (ch) of and , and, thus, these are its parents (pa). For more details on graphs and graphical models, see Lauritzen (1999). The discrete versions of the variables as defined in Table 2 were used.
The problem of causal inference involves learning the causal structure, represented by a DAG and a CPT, from data. The ACE of a treatment under intervention is estimated using intervention theory, as explained in the next section.
5.1.1 Causal diagrams as models of intervention.
According to Pearl (2000), CBNs can be regarded as models of interventions if it is assumed that a DAG models the causal mechanism which generated the data. (See Section 5.2 for a review of this assumption.)
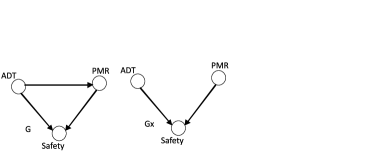
Under the above assumption, the edges in a DAG are used to specify the changes in the joint distribution of variables due to external intervention. For instance, in Figure 2, forcing the node to take a particular value, say, , amounts to lifting the existing mechanism on and putting it under the influence of a new mechanism whose action is to force to the value , keeping everything else constant. This action is mathematically represented by . The effect of “setting” a node to a fixed value corresponds to applying the low treatment to all the segments in the sample. Such interventions are modeled in a DAG by creating a new mutilated DAG from . In , the links between and its parents are removed, keeping the rest of the graph the same. The distribution imposed by the new graph under the condition represents the effect of intervention and is called the post-intervention distribution; for example, see Figure 2.
5.1.2 Causal effect and ACE.
Given the safety outcome and thetreatment variable , the causal effect of on , denoted by, where , is a function from to the space of probability distribution on . For each realization of , gives the probability of induced from the mutilated graph and substituting the value of as in this graph.
Given a causal diagram in which all the parents of manipulated variables are observed, the causal effect can be estimated from passive or noninterventional data. However, when some parents of a child node are not observed, may not be estimable in all cases. A graphical test has been provided by Pearl (2000), Chapter 3, to find out when is estimable from the observed data. In the present case, we make the assumption that all potential confounders are included in the analysis. This is a strong assumption and must come from subject matter experts. These assumptions are reviewed in Section 5.2.
When has two possible states ( and ), the ACE is given by the following equation:
| (5) |
where is the marginal probability in 111111Conditioning on so-called colliders can actually introduce bias in the ACE; see Pearl (2003). In simple terms, a variable is a collider if it has two arrows into it. In the present case, there are no such colliders on the path between Safety and . of under the intervention ; similar expressions are used for the other two comparisons, High to Low and High to Med. Also, notice the similarity to equation (1) from the PO framework. In the next section we describe the algorithms that were used to learn the components of the CBN.
5.2 Learning CBNs from data and estimation of ACE.
Structure learning algorithms are used to recover a DAG and parameter learning algorithms are used to estimate the CPTs, which then lead to estimation of ACE.
5.2.1 Structure learning.
Learning the structure of causal networks from observational data has received a thorough treatment in the literature; see Pearl and Verma (1991), Heckerman (2008), Spirtes and Glymour (1991). The most common strategies fall into two different classes called constraint based learning and score based learning. We adopt a simple combination of both approaches to learn the structure of the CBN. Our approach is similar in principle to Tsamardinos, Brown and Aliferis (2006). The PC algorithm [Spirtes, Glymour and Scheines (2001)] is used as a constraint based strategy to recover a DAG from the data. This DAG is supplied as an initial input to the score based learning strategy, which then attempts to find an optimum DAG. The simulated annealing strategy of Hartemink (2005) and the scoring function proposed by Heckerman, Geiger and Chickering (1995) are used to search for optimum scored CBN. The scoring search is implemented in Java using the BANJO library [Hartemink (2005)] and the constraint search is performed using the BNT toolbox in Matlab [Murphy (2001)]. Since the scoring method need not produce the globally optimum structure of the CBN, we used the 10 best networks recovered by the algorithm and performed Bayesian model averaging to estimate the ACE. For details on the averaging, refer to Madigan and Raftery (1994), Hoeting, Adrian and Volinsky (1998) and Heckerman, Geiger and Chickering (1995).
Irrespective of the strategy used, a DAG can be recovered from observational data, up to -separation equivalence [Pearl (2000), Chapter 1], only if the three assumptions outlined below are satisfied. Causal interpretation of CBN is possible because of these assumptions, which are in general untestable from observational data and must come from subject matter experts.
Causal Markov Assumption: The Causal Markov Assumption (CMA) states that given the values of a variable’s immediate causes (i.e., its parents), the variable is independent of its nondescendants [Pearl (2000), Chapter 1]. This assumption implies that we must include in the model every variable that is a cause of two or more other variables. It also implies Reichenbach’s [Reichenbach (1956)] common cause assumption, which states that, if any two variables are dependent, then one is a cause of the other or there is a third variable causing both.
The natural question that arises is what are the immediate factors that affect the safety of a segment? For instance, is driving at a high speed considered an immediate cause of reduced safety? To understand the CMA in light of safety, we need to consider factors that can cause a crash. These factors can be divided into three broad categories: road user (driver), the vehicle, and roadway characteristics (environmental conditions, roadway volume, etc.). Generally, information on the factors related to drivers and the vehicle is available only for vehicles involved in a crash, and not for noncrash vehicles. Thus, in a driver level analysis, most of the data would be missing. Also, the immediate causes of crashes (75 percent of which are due to human error [Stanton and Salmon (2009)]) become very specific to a particular crash and are governed by complex human behavior which is difficult to model and predict. To avoid these issues, analysis is done at the segment level. Only stable attributes of a roadway segment are included in the analysis; specific human factors are included in the error terms considered to be stochastic in nature. Thus, CMA is treated as a guiding principle rather than an assumption, where it defines the granularity of the model being considered, ensuring that all relevant causes, as defined by subject matter experts and past experiments, are included in the analysis.
Faithfulness: The faithfulness assumption ensures that the population that generated the DAG has exactly those independence relations specified by the DAG structure and no additional independencies. If there are any independence relations in the population that are not a consequence of the Causal Markov condition, then the population is unfaithful. By assuming Faithfulness, we eliminate all such cases from consideration.121212This assumption is controversial; see the discussion section.
Latent variables: This assumption states that there are no hidden variables in the model that violate the causal Markov condition. That is, all of the variables that effect more than two variables in the model are observed and included in the database. Again, this is a strong assumption, whose validity could be ensured by verification from subject matter experts. For instance, the definition of safety ensures that the causes due to driver and weather factors do not influence the outcome, or else these would have to be entered into the model as latent variables.
5.2.2 Parameter learning.
The parameters of the CPT are modeled using Dirichlet distributions and the usual assumptions of parameter independence are made. For details on parameter learning, see Heckerman, Geiger and Chickering (1995). The Bayesian Dirichlet Equivalent Uniform Priors (BDEU) were used to compute the parameters of the CBN.
The Dirichlet hyper parameters are specified by the following equation:
| (6) |
where pertains to variable in a state given that its parents are in joint state for , where is the number of pseudo-counts, and is a (marginal) prior distribution of pseudo-counts; this ensures the likelihood-equivalence of Markov equivalent structures [Heckerman, Geiger and Chickering (1995)]. The value of is taken to be 1. The distribution is chosen to be uniform between 0 and 1 for all variables (representing noninformative prior), that is, for any CPT, each parent-child combination is given an equal probability.
5.2.3 Estimation of ACE.
There are several methods in the literature [Cowell (1998)] to efficiently perform inference in a CBN. We computed the marginal probability of by using the junction tree algorithm that performs exact inference. Recall that the ACE of on is estimated as the ratio of the expected value of safety under the intervention level corresponding to the treatment and the expected value of safety under the intervention level corresponding to control [cf. equation (5)]. A full Bayes model was specified and the confidence in the value of the ACE was estimated by computing a percent Bayesian credible interval.
5.3 Results.
The DAG with the highest score is shown in Figure 3. Notice that there is no variable in this DAG. This could be because given the combination of variables like , and , the value of is completely determined, and the discretization of into two levels makes it highly collinear with . It was surprising to see the safety of a segment directly unaffected by in this particular DAG, since it is commonly observed that the higher the , the higher the probability of a target crash on a segment. However, two of the top 10 graphs show that does indeed affect safety. A possible reason could again be the discretized variable, which is also highly correlated with the variable; segments with more than two lanes generally have high . Similar problems were encountered in the PO framework. This could be the reason why the indicator affects safety in 8 out of the 10 highest scoring models.


Figure 4 shows the mutilated DAG used to model the effect of intervention on the levels. As noted earlier, the mutilated DAG is formed by deleting all the edges from the original DAG that direct into the variable, and fixing the value of at a particular level. The marginal probability distribution of safety in such a DAG represents the effect of manipulating the variable on . We computed the full Bayesian posterior of ACE using Monte Carlo simulation, averaging over the 10 best selected networks.
| Change in visibility level | Point estimate | 95% limits |
|---|---|---|
| High to Low | 3.12 | |
| Medium to Low | 1.79 | |
| High to Medium | 1.86 |
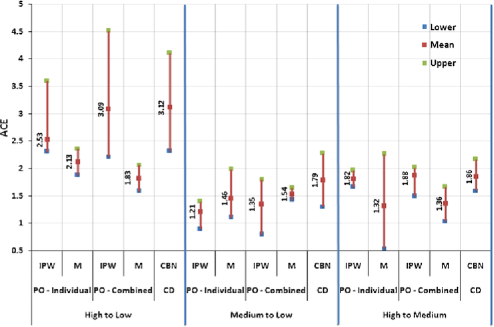
Table 4 shows the final results of the effect of on safety, computed via the Causal Diagrams approach. The results suggest that higher levels correspond to significantly lower risk of a target crash on all comparisons. In particular, the risk of a target crash on a segment with Low is 3.12 times that of High with a 95% CI of [2.32, 4.11] and 1.79 times that of Med with a 95% CI of [1.31, 2.28]. Similarly, the risk of a target crash on a segment with Med is 1.86 times that of High with a 95% CI of [1.60, 2.17].
6 Comparison of results and discussion.
This section compares and discusses the analyses and results from the PO and CD frameworks. In addition, it also includes the results from the popular PO alternative to IPW, the propensity score matching, whose implementation details are available in the supplementary document [Karwa, Slavković and Donnell (2011)].
6.1 Comparison of results and implications.
Figure 5 shows the point estimates and confidence intervals of ACEs from both frameworks. Specifically, it shows the overlap among the estimates of ACEs from the following methods: Combined and Individual approaches, using Inverse Propensity Score weighting (IPW) and using Propensity Score Matching (M) with regression adjustment from the PO framework, and Causal Bayesian Networks (CBN) from the CD framework. There are a couple of important points to be noted.
In terms of a general trend, the results of all methods are consistent with each other; they show that increased levels generally lead to a reduced or unchanged risk of a target crash which agrees with engineering expectations. In terms of magnitude of the effect, however, there is a noticeable and in some cases statistically significant difference across different implementations. The CBN point estimates are consistently higher than both the IPW and M point estimates.
In general, the 95% confidence regions from the three methods show significant overlap across the three comparisons, and thus lead to the same conclusions in terms of the expected strength of the causal effect. The most consistent result, statistically and with respect to transportation engineering logic, is for the High to Low comparison where all three methods indicate that there is a significant reduction in risk with application of High in comparison to Low even though the matching results are significantly lower in magnitude, in particular, for the PO-combined M estimate. The IPW and CBN results display strong correspondence with the exception of Med to Low comparison. The inference based on IPW results implies that the risk of a target crash is not significantly lower on segments with the application of Med levels when compared to Low levels, whereas both CBN and M based confidence intervals imply statistically significant risk reduction and are more in line with engineering intuition.
The most curious result with respect to engineering expectation occurs for the High to Med comparison. Here, it was expected that there would be a small or no statistically significant effect. Only the matching results support this assertion, and, in particular, only the PO-individual M result claims no effect. The PO-combined M estimates are closer to IPW and CBN results, with the latter two having a very strong correspondence that implies a significant reduction in safety risk with the application of High PMR compared to Med PMR. It should be noted, however, that the PO-individual M estimate has the highest variability, with a significant CI overlap with other estimated effects, thus, it may be difficult to render a solid practical decision based solely on statistical significance or lack thereof. Alternatively, one can argue that PO-combined, IPW and the CBN estimates are based on extrapolation when compared to the PO-individual M estimates due to differences in data subsamples being used. Further examination of the results is needed, which is discussed below.
6.2 Discussion of results.
There could be several reasons for the differences in the results from the PO framework and the CD framework. One is distributional support. The variables used in the CBN setting were discretized to ensure the use of efficient algorithms. On the other hand, there was little discretization performed in the PO model. Specifically, the variable “age” was used as a continuous variable in the IPW estimation, and “age,” “Rt. Shoulder width,” “Percentage Trucks” and “ADT” were used as continuous variables in the Matching estimation.131313These choices were based on two (conflicting) policies, the first was to ensure similarity to the variables used in the CBN setting, and the second to ensure balance, the second one being given more priority.
As noted, the CBN and combined-IPW results are close to each other. This is due to the similarity in empirical estimation of ACE. In both frameworks, causal effect is defined as a contrast between the outcomes of the same unit with and without treatment. However, to avoid the problem of missing potential outcomes, the individual IPW estimator compares similar units, whereas the combined estimator compares the same units. In the latter case, the problem of unobservable potential outcomes is avoided by using the outcome model for prediction. This is similar to applying the “do” operator to all units and contrasting the outcomes under different manipulations.
The differences between results of matching and results of CBN and IPW are due to differences in the data set, more specifically, due to loss of data in matching. To ensure overlap and balance, matching discards data. Dehejia and Wahba (1999) and Heckman, Ichimura and Todd (1998) point out that without overlap the results would be sensitive to the specification of either the propensity score or outcome model. While our matching procedure attained both balance and sufficient overlap for all comparisons, there was a significant loss of observations; see the supplementary document for details. For instance, for High to Med case, matching discards 83% of the data. Thus, the PO-individual M estimate of no significant change for High to Med may not be representative of the whole population. On the other hand, matching has the smallest loss of information for Med to Low case. The results from the CBN and matching show that there could be some significant effect in changing the level from Med to Low, whereas the IPW results indicate that there may not be a significant effect. However, the IPW results may be biased because of poor balance achieved in the data for this comparison (cf. Figure 1).
Some of the differences between IPW and CBN could also be due to the use of Bayesian estimation in CBN. For instance, in CBN, Bayesian model averaging was used to account for the possibility of recovering a local minima. Moreover, all of the variables in CBN were discrete, which lead to large and sparse CPTs. The estimates from the PO framework were also affected by sparseness, although in part mitigated by the presence of continuous variables.
6.3 Which method to use?
The choice of method is greatly influenced by the assumptions made. No method can be completely assumption free, in fact, all causal inferences (from observational data) must be based on causal assumptions. The major causal assumptions in each framework were the Causal Markov Assumption (CMA) in CD and the unconfoundedness assumption in the PO framework. We conjecture that CMA is a stronger assumption than unconfoundedness, as it pertains to all the variables in the problem at hand, whereas the latter relates to the treatment variable and the potential outcomes. Furthermore, recent work has shown that unconfoundedness alone may not be sufficient to identify appropriate covariates for inclusion in the propensity score model; see Pearl (2000, 2009).
The PO framework requires overlap and balance assumptions, whereas the CD framework does not. In the broadest sense, the balance assumption ensures that there are no-pretreatment differences between the groups being compared, and the overlap assumption ensures that the estimates do not rely too much on the functional specification of the model. However, in the case of CD, the (qualitative) causal model is assumed to be known completely.141414This may not be always the case, especially in the social sciences. Moreover, the framework does not require any explicit functional specification of relation between the variables, given the CMA [and some additional assumptions; see Pearl (2000), Chapter 3, for technical details and mathematical proofs]. Based on this discussion, we suggest the following guidelines for deciding which method to use.
If little is known about the data generating process or the causal mechanism, the analyst should go as “nonparametric” as possible. For example, one could use matching (preferably by specifying the propensity score model using a nonparametric estimator such as GBM), ensure sufficient overlap, and compute average causal effect from the observed data by using individual prediction. However, this may depend on the specification of the propensity score model, and, more importantly, in the case of significant loss of data (as in our case), it is not clear as to which subpopulation the ACE estimates apply. It must also be noted that this strategy may not guard against the inclusion of inappropriate covariates in the propensity score model (such as colliders and bias amplifying covariates).
One could attempt to recover the data generating process from observational data under further assumptions of faithfulness, combined with partial expert knowledge. However, Robins and Wasserman (1999) show that when the probability that variables in the causal model have no common unobserved causes is small relative to the sample size, analysis carried out using faithfulness can lead to inappropriate conclusions.
On the other hand, if the data generating mechanism is known (even qualitatively), the mechanism can be summarized in the form of a causal diagram. The causal diagram may incorporate the mechanism related to treatment assignment and/or the response to the treatment. Such a causal model can be used as a guide to estimate the propensity score model as well as the outcome model (which can then be used with other adjustment methods such as weighting, matching, etc). The dependence on the functional form between variables can be reduced by using categorical variables151515This may come with a set of its own problems, for example, sparseness. and/or by using nonparametric estimators such as GBM, as in our case.
In a real data setting, it is always better to compare the results from different methods. In the present study, it is clear that for different comparisons of PMR levels, different methods show consistency based on which assumptions are being violated. For instance, in the High to Low case, all methods show good agreement. In the Med to Low case, Matching and CBN show good agreement (IPW results may be biased due to lack of balance). In the Med to High case, IPW and CBN show good agreement (Matching may be biased due to significant loss of data).
The CBN results could also be biased if the causal model recovered by the data is not close to the truth. However, there is evidence that the CBN may be less biased when compared to other methods. In the comparisons where the data are well balanced (High to Low and High to Med) and there is considerable overlap (High to Medium), the CBN results are in close agreement with the IPW, which indicates that the model may be close to the truth. Since the true ACE is unknown, the only test for validity of the results is by implicit agreement of results from different methods. If different methods provide the same answer, the answer must be close to the truth, or, in the worst case, all methods fail to capture the same aspect of the true model.
6.4 Future work.
To obtain a better comparison of the methods, future studies should aim at using data from simulation. The true causal effect of the population would be known a priori, and the quality and size of data can be controlled. Other advances on this exploratory work can be made by using more complex causal modeling methods. For instance, discretization of the treatment variable can be avoided by using a dose-response model [Hirano and Imbens (2004)]. In the current study, temporal/spatial correlations may exist, though evidence was not found in these data. The treatment can be modeled as a time varying treatment [Lok et al. (2004)] to take into account such correlations. Specification of the assignment mechanism for the treatment variable is convenient when compared to other possible countermeasures, such as roadway lighting. The assignment mechanism for lighting is generally influenced by factors such as local design policies, complaints from residents and may also be related to past crash history. Such assignment mechanisms may prove difficult to model and may require the use of latent variables. Also in the current study, we did not explicitly consider uncertainty in the imputed (using ANN) PMR levels and uncertainty in the measurement process; rather a mean estimate was used. Both of these are important issues that should be carefully considered as part of future work. Sampling zeros were encountered in both the PO model as well as the CBN setting. In the PO framework, such sampling zeros created problems in achieving balance over interactions of covariates (specifically in the matching estimator). In the CBN setting, the use of Bayesian Inference in part addressed this problem. A similar approach in the PO framework would be to use a full Bayes model of both the propensity scores as well as safety outcomes [Rubin et al. (2008)]. These explorations are left to the scope of future work.
7 Conclusion.
The examination of causal inference methods to transportation safety data reveals that there is considerable scope of their application to estimate safety effects of a countermeasure. A comparison was made between the PO framework and the CD framework. More specifically, the results based on three different implementations of these frameworks on a real data set were compared: Inverse Propensity Score Weighting with regression adjustment and Propensity Score Matching with regression adjustment versus Causal Bayesian Network.
Although the general trend of results seem to be consistent, we found that the magnitude of ACEs are sensitive to the method used and to the assumptions being violated. In real data sets, it is very likely that some assumptions will be violated. Depending upon which assumptions are appropriate, different methods should be used. Assumptions should be considered a priori. If possible, the analyst should run multiple implementations to compare the results for consistency. In conclusion, we suggest the use of the PO framework supplemented by a qualitative causal diagram as a rich framework to estimate the safety effects of countermeasures in transportation studies.
Acknowledgments.
The authors are grateful to the Editor, Associate Editor and an anonymous referee whose comments have greatly improved the content of this work. We are also thankful to the North Carolina Department of Transportation for providing the data, and Dr. Kenneth Opiela from the Federal Highway Administration Office of Safety R&D for coordinating with the North Carolina Department of Transportation to obtain the data.
Supplement to “Causal inference in transportation safety studies: Comparison of potential outcomes and causal diagrams” \slink[doi,text=10.1214/10-]10.1214/10-AOAS440SUPP \slink[doi,text=AOAS440SUPP]10.1214/10-AOAS440SUPP \slink[url]http://lib.stat.cmu.edu/aoas/440/supplement.pdf \sdatatype.pdf \sdescriptionThis document contains additional details about the Matching and Inverse Propensity score estimators and the top ten graphs recovered by the graph learning algorithm.
References
- Bahar et al. (2006) {bmisc}[author] \bauthor\bsnmBahar, \bfnmGeni\binitsG., \bauthor\bsnmMasliah, \bfnmMaurice\binitsM., \bauthor\bsnmErwin, \bfnmTara\binitsT., \bauthor\bsnmTan, \bfnmErrol\binitsE. and \bauthor\bsnmHauer, \bfnmEzra\binitsE. (\byear2006). \bhowpublishedPavement marking materials and markers: Real-world relationship between retroreflectivity and safety over time. NCHRP Web Only Document 92, Transportation Research Board, National Research Council, Washington DC. \endbibitem
- Bang and Robins (2005) {barticle}[author] \bauthor\bsnmBang, \bfnmH.\binitsH. and \bauthor\bsnmRobins, \bfnmJ. M.\binitsJ. M. (\byear2005). \btitleDoubly robust estimation in missing data and causal inference models. \bjournalBiometrics \bvolume61 \bpages962–973. \MR2216189 \endbibitem
- Bureau of Transportation Statistics (2007) {bmisc}[author] \borganizationBureau of Transportation Statistics, U.S. (\byear2007). \btitleNational transportation statistics. \bnoteTechnical report. \endbibitem
- Cole and Frangakis (2009) {barticle}[author] \bauthor\bsnmCole, \bfnmStephen R.\binitsS. R. and \bauthor\bsnmFrangakis, \bfnmConstantine E.\binitsC. E. (\byear2009). \btitleThe consistency statement in causal inference: A definition or an assumption? \bjournalEpidemiology \bvolume20 \bpages3–5. \endbibitem
- Cowell (1998) {binproceedings}[author] \bauthor\bsnmCowell, \bfnmRobert\binitsR. (\byear1998). \btitleIntroduction to inference for Bayesian networks. In \bbooktitleProceedings of the NATO Advanced Study Institute on Learning in Graphical Models \bpages9–26. \bpublisherKluwer Academic, \baddressNorwell, MA. \endbibitem
- Davis (2000) {barticle}[author] \bauthor\bsnmDavis, \bfnmGary A.\binitsG. A. (\byear2000). \btitleAccident reduction factors and causal inference in traffic safety studies: A review. \bjournalAccident Analysis & Prevention \bvolume32 \bpages95–109. \endbibitem
- Davis (2004) {barticle}[author] \bauthor\bsnmDavis, \bfnmGary A.\binitsG. A. (\byear2004). \btitlePossible aggregation biases in road safety research and a mechanism approach to accident modeling. \bjournalAccident Analysis & Prevention \bvolume36 \bpages1119–1127. \endbibitem
- Dehejia and Wahba (1999) {barticle}[author] \bauthor\bsnmDehejia, \bfnmR. H.\binitsR. H. and \bauthor\bsnmWahba, \bfnmS.\binitsS. (\byear1999). \btitleCausal effects in nonexperimental studies: Reevaluating the evaluation of training programs. \bjournalJ. Amer. Statist. Assoc. \bvolume94 \bpages1053–1062. \endbibitem
- Donnell, Karwa and Sathyanarayanan (2009) {barticle}[author] \bauthor\bsnmDonnell, \bfnmE. T.\binitsE. T., \bauthor\bsnmKarwa, \bfnmV.\binitsV. and \bauthor\bsnmSathyanarayanan, \bfnmS.\binitsS. (\byear2009). \btitleAnalysis of effects of pavement marking retroreflectivity on traffic crash frequency on highways in North Carolina. \bjournalTransportation Research Record: Journal of the Transportation Research Board \bvolume2103 \bpages50–60. \endbibitem
- Eells (1991) {bbook}[author] \bauthor\bsnmEells, \bfnmEllery\binitsE. (\byear1991). \btitleProbabilistic Causality. \bpublisherCambridge Univ. Press, \baddressCambridge. \MR1120269 \endbibitem
- Fienberg and Sfer (2006) {barticle}[author] \bauthor\bsnmFienberg, \bfnmS. E.\binitsS. E. and \bauthor\bsnmSfer, \bfnmA. M.\binitsA. M. (\byear2006). \btitleRandomization, models, and the estimation of causal effects. Unpublished manuscript. \endbibitem
- Hartemink (2005) {bmisc}[author] \bauthor\bsnmHartemink, \bfnmAlexander J.\binitsA. J. (\byear2005). \btitleBanjo: Bayesian network inference with Java objects. \bnoteSoftware package, available at http://www.cs.duke.edu/amink/software/banjo. \endbibitem
- Heckerman (2008) {bincollection}[author] \bauthor\bsnmHeckerman, \bfnmD.\binitsD. (\byear2008). \btitleA tutorial on learning with Bayesian networks. In \bbooktitleInnovations in Bayesian Networks (\beditorD. Holmes and L. Jain, eds.) \bpages33–82. \bpublisherSpringer, \baddressBerlin. \endbibitem
- Heckerman, Geiger and Chickering (1995) {binproceedings}[author] \bauthor\bsnmHeckerman, \bfnmDavid\binitsD., \bauthor\bsnmGeiger, \bfnmDan\binitsD. and \bauthor\bsnmChickering, \bfnmDavid M.\binitsD. M. (\byear1995). \btitleLearning Bayesian networks: The combination of knowledge and statistical data. \bbooktitleMachine Learning \bvolume20 \bpages197–243. \endbibitem
- Heckman, Ichimura and Todd (1998) {barticle}[author] \bauthor\bsnmHeckman, \bfnmJ. J.\binitsJ. J., \bauthor\bsnmIchimura, \bfnmH.\binitsH. and \bauthor\bsnmTodd, \bfnmP.\binitsP. (\byear1998). \btitleMatching as an econometric evaluation estimator. \bjournalRev. Econom. Stud. \bvolume65 \bpages261–294. \MR1623713 \endbibitem
- Hernan and Robins (2006) {barticle}[author] \bauthor\bsnmHernan, \bfnmMiguel A.\binitsM. A. and \bauthor\bsnmRobins, \bfnmJames M.\binitsJ. M. (\byear2006). \btitleEstimating causal effects from epidemiological data. \bjournalJ. Epidemiol. Community Health \bvolume60 \bpages578–586. \endbibitem
- Hirano and Imbens (2001) {barticle}[author] \bauthor\bsnmHirano, \bfnmK.\binitsK. and \bauthor\bsnmImbens, \bfnmG. W.\binitsG. W. (\byear2001). \btitleEstimation of causal effects using propensity score weighting: An application to data on right heart catheterization. \bjournalHealth Services and Outcomes Research Methodology \bvolume2 \bpages259–278. \endbibitem
- Hirano and Imbens (2004) {bincollection}[author] \bauthor\bsnmHirano, \bfnmKeisuke\binitsK. and \bauthor\bsnmImbens, \bfnmGuido W.\binitsG. W. (\byear2004). \btitleThe propensity score with continuous treatments. In \bbooktitleApplied Bayesian Modeling and Causal Inference from Incomplete-Data Perspectives (\beditorX.-L. Meng and A. Gelman, eds.) \bpages73–84. \bpublisherWiley, \baddressChichester. \MR2134803 \endbibitem
- Hirano, Imbens and Ridder (2003) {barticle}[author] \bauthor\bsnmHirano, \bfnmK.\binitsK., \bauthor\bsnmImbens, \bfnmG. W.\binitsG. W. and \bauthor\bsnmRidder, \bfnmG.\binitsG. (\byear2003). \btitleEfficient estimation of average treatment effects using the estimated propensity score. \bjournalEconometrica \bvolume71 \bpages1161–1189. \MR1995826 \endbibitem
- Hoeting, Adrian and Volinsky (1998) {binproceedings}[author] \bauthor\bsnmHoeting, \bfnmJennifer\binitsJ., \bauthor\bsnmAdrian, \bfnmDavid Madigan\binitsD. M. and \bauthor\bsnmVolinsky, \bfnmChris T.\binitsC. T. (\byear1998). \btitleBayesian model averaging. In \bbooktitleProceedings of the AAAI Workshop on Integrating Multiple Learned Models \bpages77–83. \bpublisherAAAI Press. \endbibitem
- Holland (1986) {barticle}[author] \bauthor\bsnmHolland, \bfnmPaul W.\binitsP. W. (\byear1986). \btitleStatistics and causal inference. \bjournalJ. Amer. Statist. Assoc. \bvolume81 \bpages945–960. \MR0867618 \endbibitem
- Hong and Raudenbush (2005) {barticle}[author] \bauthor\bsnmHong, \bfnmGuanglei\binitsG. and \bauthor\bsnmRaudenbush, \bfnmStephen W.\binitsS. W. (\byear2005). \btitleEffects of kindergarten retention policy on children’s cognitive growth in reading and mathematics. \bjournalEducational Evaluation and Policy Analysis \bvolume27 \bpages205–224. \endbibitem
- Karwa (2009) {bmisc}[author] \bauthor\bsnmKarwa, \bfnmVishesh\binitsV. (\byear2009). \bhowpublishedSafety effects of pavement marking retroreflectivity: An application of causal bayesian networks. Master’s thesis, Pennsylvania State Univ., University Park, PA. \endbibitem
- Karwa and Donnell (2011) {barticle}[author] \bauthor\bsnmKarwa, \bfnmVishesh\binitsV. and \bauthor\bsnmDonnell, \bfnmEric T.\binitsE. T. (\byear2011). \btitlePredicting pavement marking retroreflectivity degradation using artificial neural networks: An exploratory analysis. \bjournalJournal of Transportation Engineering \bvolume137 \bpages91–103. \endbibitem
- Karwa, Slavković and Donnell (2011) {bmisc}[author] \bauthor\bsnmKarwa, \bfnmVishesh\binitsV., \bauthor\bsnmSlavković, \bfnmAleksandra\binitsA. and \bauthor\bsnmDonnell, \bfnmE. T.\binitsE. T. (\byear2011). \bhowpublishedSupplement to “Causal inference in transportation safety studies: Comparison of potential outcomes and causal diagrams.” DOI: 10.1214/10-AOAS440SUPP. \endbibitem
- Lauritzen (1999) {binproceedings}[author] \bauthor\bsnmLauritzen, \bfnmSteffen L.\binitsS. L. (\byear1999). \btitleCausal inference from graphical models. In \bbooktitleComplex Stochastic Systems \bpages63–107. \bpublisherChapman & Hall/CRC Press, \baddressBoca Raton, FL. \MR1893411 \endbibitem
- Lee, Lessler and Stuart (2009) {barticle}[author] \bauthor\bsnmLee, \bfnmB. K.\binitsB. K., \bauthor\bsnmLessler, \bfnmJ.\binitsJ. and \bauthor\bsnmStuart, \bfnmE. A.\binitsE. A. (\byear2009). \btitleImproving propensity score weighting using machine learning. \bjournalStat. Med. \bvolume29 \bpages337–346. \endbibitem
- Lok et al. (2004) {barticle}[author] \bauthor\bsnmLok, \bfnmJ.\binitsJ., \bauthor\bsnmGill, \bfnmRichard\binitsR., \bauthor\bparticlevan der \bsnmVaart, \bfnmAad\binitsA. and \bauthor\bsnmRobins, \bfnmJames\binitsJ. (\byear2004). \btitleEstimating the causal effect of a time-varying treatment on time-to-event using structural nested failure time models. \bjournalStatist. Neerlandica \bvolume58 \bpages271–295. \MR2157006 \endbibitem
- Madigan and Raftery (1994) {barticle}[author] \bauthor\bsnmMadigan, \bfnmDavid\binitsD. and \bauthor\bsnmRaftery, \bfnmAdrian E.\binitsA. E. (\byear1994). \btitleModel selection and accounting for model uncertainty in graphical models using Occam’s window. \bjournalJ. Amer. Statist. Assoc. \bvolume89 \bpages1535–1546. \endbibitem
- Maldonado and Greenland (2002) {barticle}[author] \bauthor\bsnmMaldonado, \bfnmGeorge\binitsG. and \bauthor\bsnmGreenland, \bfnmSander\binitsS. (\byear2002). \btitleEstimating causal effects. \bjournalInt. J. Epidemiol. \bvolume31 \bpages422–429. \endbibitem
- McCaffrey, Ridgeway and Morral (2004) {barticle}[author] \bauthor\bsnmMcCaffrey, \bfnmDF\binitsD., \bauthor\bsnmRidgeway, \bfnmG.\binitsG. and \bauthor\bsnmMorral, \bfnmAR\binitsA. (\byear2004). \btitlePropensity score estimation with boosted regression for evaluating causal effects in observational studies. \bjournalPsychological Methods \bvolume9 \bpages403–425. \endbibitem
- Murphy (2001) {barticle}[author] \bauthor\bsnmMurphy, \bfnmKevin P.\binitsK. P. (\byear2001). \btitleThe Bayes net toolbox for MATLAB. \bjournalComput. Sci. Statist. \bvolume33 \bpages2001. \endbibitem
- National Highway Traffic Safety Administration (2007) {bmisc}[author] \borganizationNational Highway Traffic Safety Administration (\byear2007). \btitleTraffic safety facts 2007. \bnoteTechnical report. \endbibitem
- Pearl (2000) {bbook}[author] \bauthor\bsnmPearl, \bfnmJudea\binitsJ. (\byear2000). \btitleCausality: Models, Reasoning, and Inference. \bpublisherCambridge Univ. Press, \baddressCambridge. \MR1744773 \endbibitem
- Pearl (2003) {barticle}[author] \bauthor\bsnmPearl, \bfnmJudea\binitsJ. (\byear2003). \btitleStatistics and causal inference: A review. \bjournalTest \bvolume12 \bpages281–318. \MR2044313 \endbibitem
- Pearl (2009) {btechreport}[author] \bauthor\bsnmPearl, \bfnmJ.\binitsJ. (\byear2009). \btitleOn a class of bias-amplifying covariates that endanger effect estimates. \btypeTechnical report, \binstitutionUniv. California, \baddressLos Angeles. \endbibitem
- Pearl and Verma (1991) {binproceedings}[author] \bauthor\bsnmPearl, \bfnmJ.\binitsJ. and \bauthor\bsnmVerma, \bfnmT. S.\binitsT. S. (\byear1991). \btitleA theory of inferred causation. In \bbooktitlePrinciples of Knowledge Representation and Reasoning: Proceedings of the Second International Conference \bvolume11 \bpages441–452. \bpublisherMorgan Kaufmann, \baddressSan Mateo, CA. \MR1142173 \endbibitem
- Reichenbach (1956) {bbook}[author] \bauthor\bsnmReichenbach, \bfnmHans\binitsH. (\byear1956). \btitleThe Direction of Time. \bpublisherUniv. California Press, \baddressBerkeley. \endbibitem
- Ridgeway (2007) {bmisc}[author] \bauthor\bsnmRidgeway, \bfnmG.\binitsG. (\byear2007). \btitleGeneralized boosted models: A guide to the GBM package. \bnoteAvailable at http://cran.r-project.org/web/packages/gbm/vignettes/gbm.pdf. \endbibitem
- Ridgeway, McCaffrey and Morral (2006) {bmisc}[author] \bauthor\bsnmRidgeway, \bfnmG.\binitsG., \bauthor\bsnmMcCaffrey, \bfnmD.\binitsD. and \bauthor\bsnmMorral, \bfnmA.\binitsA. (\byear2006). \btitleToolkit for weighting and analysis of nonequivalent groups: A tutorial for the twang package. \bnoteRAND Corporation, Santa Monica, CA. \endbibitem
- Robins and Wasserman (1999) {bincollection}[author] \bauthor\bsnmRobins, \bfnmJ. M.\binitsJ. M. and \bauthor\bsnmWasserman, \bfnmL.\binitsL. (\byear1999). \btitleOn the impossibility of inferring causation from association without background knowledge. In \bbooktitleComputation, Causation, and Discovery (\beditorC. Glymour and G. F. Cooper, eds.) \bpages305–321. \bpublisherAAAI Press, \baddressMenlo Park, CA. \MR1689948 \endbibitem
- Rosenbaum and Rubin (1983) {barticle}[author] \bauthor\bsnmRosenbaum, \bfnmPaul\binitsP. and \bauthor\bsnmRubin, \bfnmDonald B.\binitsD. B. (\byear1983). \btitleThe central role of the propensity score in observational studies for causal effects. \bjournalBiometrika \bvolume70 \bpages41–55. \MR0742974 \endbibitem
- Rubin (1978) {barticle}[author] \bauthor\bsnmRubin, \bfnmDonald B.\binitsD. B. (\byear1978). \btitleBayesian inference for causal effects: The role of randomization. \bjournalAnn. Statist. \bvolume6 \bpages34–58. \MR0472152 \endbibitem
- Rubin (1990) {barticle}[author] \bauthor\bsnmRubin, \bfnmDonald B.\binitsD. B. (\byear1990). \btitleFormal mode of statistical inference for causal effects. \bjournalJ. Statist. Plann. Inference \bvolume25 \bpages279–292. \endbibitem
- Rubin (1998) {barticle}[author] \bauthor\bsnmRubin, \bfnmDonald B.\binitsD. B. (\byear1998). \btitleEstimation from nonrandomized treatment comparisons using subclassification on propensity scores. \bjournalAnn. Internal Medicine \bvolume8 \bpages757–763. \endbibitem
- Rubin (2005) {barticle}[author] \bauthor\bsnmRubin, \bfnmDonald B.\binitsD. B. (\byear2005). \btitleCausal inference using potential outcomes: Design, modeling, decisions. \bjournalJ. Amer. Statist. Assoc. \bvolume100 \bpages322–331. \MR2166071 \endbibitem
- Rubin (2008) {barticle}[author] \bauthor\bsnmRubin, \bfnmDonald B.\binitsD. B. (\byear2008). \btitleFor objective causal inference, design trumps analysis. \bjournalAnn. Appl. Statist. \bvolume2 \bpages808–840. \MR2516795 \endbibitem
- Rubin et al. (2008) {bincollection}[author] \bauthor\bsnmRubin, \bfnmDonald B.\binitsD. B., \bauthor\bsnmWang, \bfnmXiaoqin\binitsX., \bauthor\bsnmYin, \bfnmLi\binitsL. and \bauthor\bsnmZell, \bfnmElizabeth R.\binitsE. R. (\byear2008). \btitleBayesian causal inference: Approaches to estimating the effect of treating hospital type on cancer survival in Sweden using principal stratification. In \bbooktitleHandbook of Applied Bayesian Analysis (\beditorT. O’Hagan and M. West, eds.). \bpublisherOxford Univ. Press, \baddressOxford. \endbibitem
- Schafer and Kang (2008) {barticle}[author] \bauthor\bsnmSchafer, \bfnmJoseph. L.\binitsJ. L. and \bauthor\bsnmKang, \bfnmJoseph.\binitsJ. (\byear2008). \btitleEverage causal effects from nonrandomized studies: A practical guide and simulated example. \bjournalPsychological Methods \bvolume13 \bpages279–313. \endbibitem
- Sfer (2005) {btechreport}[author] \bauthor\bsnmSfer, \bfnmAna Maria\binitsA. M. (\byear2005). \btitleRandomization and causality. \btypeTechnical report, \binstitutionFacultad de Ciencias Económicas, Universidad Nacional de Tucumán, San Miguel de Tucumán, Argentina. \endbibitem
- Spirtes and Glymour (1991) {barticle}[author] \bauthor\bsnmSpirtes, \bfnmPeter\binitsP. and \bauthor\bsnmGlymour, \bfnmClark\binitsC. (\byear1991). \btitleAn algorithm for fast recovery of sparse causal graphs. \bjournalSocial Science Computer Review \bvolume9 \bpages62–72. \endbibitem
- Spirtes, Glymour and Scheines (2001) {bbook}[author] \bauthor\bsnmSpirtes, \bfnmPeter\binitsP., \bauthor\bsnmGlymour, \bfnmClark\binitsC. and \bauthor\bsnmScheines, \bfnmRichard\binitsR. (\byear2001). \btitleCausation, Prediction, and Search, \bedition2nd ed. \bpublisherMIT Press, \baddressCambridge, MA. \MR1815675 \endbibitem
- Stanton and Salmon (2009) {barticle}[author] \bauthor\bsnmStanton, \bfnmNeville A.\binitsN. A. and \bauthor\bsnmSalmon, \bfnmPaul M.\binitsP. M. (\byear2009). \btitleHuman error applied to driving: A generic driver error taxonomy and its implications for intelligent transport systems. \bjournalSafety Science \bvolume47 \bpages227–237. \endbibitem
- Tsamardinos, Brown and Aliferis (2006) {barticle}[author] \bauthor\bsnmTsamardinos, \bfnmIoannis\binitsI., \bauthor\bsnmBrown, \bfnmLaura E.\binitsL. E. and \bauthor\bsnmAliferis, \bfnmConstantin F.\binitsC. F. (\byear2006). \btitleThe max–min hill-climbing Bayesian network structure learning algorithm. \bjournalMach. Learn. \bvolume65 \bpages31–78. \endbibitem