A Spectroscopic Study of DD UMa: Ursa Major Group Member and Candidate for BRITE
Abstract
The Ursa Major group is a nearby stellar supercluster which, while not gravitationally bound, is defined by co-moving members. DD UMa is a Scuti star whose membership in the Ursa Major group is unclear.
The objective of this study is to confirm the membership of DD UMa in the Ursa Major group, as well as perform a detailed spectral analysis of the star. Since DD UMa is a low-amplitude Scuti star, we performed a frequency analysis. We determined fundamental parameters, chemical abundances, and derive a mass and age for the star.
For this study we observed DD UMa at the Okayama Astrophysical Observatory with the high-resolution spectrograph HIDES, between the of February and the March, 2009. Additional observations were extracted from the ELODIE archive in order to expand our abundance analysis. Group membership of DD UMa was assessed by examining the velocity of the star in Galactic coordinates. Pulsational frequencies were determined by examining line profile variability in the HIDES spectra. Stellar fundamental parameters and chemical abundances were derived by fitting synthetic spectra to both the HIDES and ELODIE observations.
DD UMa is found to be a member of the extended stream of the Ursa Major group, based on the space motion of the star. This is supported by the chemical abundances of the star being consistent with those of Ursa Major group members. The star is found to be chemically solar, with K and . We found pulsational frequencies of 9.4 c/d and 15.0 c/d. While these frequencies are insufficient to perform an asteroseismic study, DD UMa is a good bright star candidate for future study by the BRITE-constellation.
keywords:
stars: Sct, – stars: individual: DD UMa stars: abundances – technique: spectroscopicPACS:
97.30.Dg , 97.10.Tk , 97.10.Sj , 98.65.Dxj1 Introduction
The Ursa Major group, also known as the Sirius supercluster, is the closest supercluster to the Sun. This group was first identified by the observation that five central stars in Ursa Major were moving towards the same point in space (Proctor, 1869; Huggins, 1871). After this discovery, a number of other stars were noticed to have similar space motions, some close to Ursa Major and some as far as the southern hemisphere (e.g HD 147584). This leads to distinguishing two subgroups in the Ursa Major group: the nucleus (consisting of 13 stars including the five central stars in Ursa Major), and the extended stream. The subgroups are considered to share a common origin, but the members are considered gravitationally unbound. Stars located in the extended stream, as well as in the nucleus, provide information about the formation and evolution of the Ursa Major moving group. DD UMa (18 UMa, = ) is a Scuti star located in the Ursa Major constellation, for which membership in the Ursa Major group has not been well defined due to the lack of spectroscopic and photometric observations.
Spectroscopic variability in DD UMa was first noticed by Schlesinger (1914), based on observations from the Allengheny Observatory, who suggested the star was a spectroscopic binary candidate. Abt (1965) obtained radial velocity measurements during 13 nights spread between December 1959 and April 1961, and reported that there was no variability in the radial velocity curve of DD UMa, thus they concluded DD UMa was not a spectroscopic binary. Percy (1973) used DD UMa as a comparison star while photometrically observing HR 3775. In these observations they noticed that DD UMa showed Scuti variability, with a 0.03 magnitude amplitude and a period of 3 hours. Horan et al. (1974) observed DD UMa for two nights and confirmed the period and amplitude reported by Percy (1973). The period derived by Percy (1973) is the only value available in the literature, and was recently included in work by Rodríguez et al. (2000), Samus et al. (2009), and Watson et al. (2011).
With this paper we supply a modern spectroscopic analysis of DD UMa, which is notably absent in the literature. A detailed abundance analysis and frequency analysis of the star is important groundwork for further studies of the star, particularly asteroseismology, and helps place the star in a proper evolutionary context. A careful assessment of DD UMa’s membership in the Ursa Major moving group is also important. An older pulsating star such as DD UMa could provide valuable information about the formation and evolution of Ursa Major group. Additionally, DD UMa is a candidate target for the BRITE-Constellation111http://www.brite-constellation.at/, which will perform high-precision photometry of bright stars in order to analyse their pulsational properties. Thus a detailed ground based study of DD UMa is valuable in advance of these potential space based observations.
2 Observations and Data Reduction
We obtained a time-series of observations of DD UMa between the of February and the March of 2009, with the high-resolution spectrograph HIDES (High Dispersion Echelle Spectrograph) attached to the 1.88 m telescope at the Okayama Astrophysical Observatory. The data set covers a wavelength range of 3830-5600 Å, at a resolving power of 47,000. An exposure time of 900 seconds was used for all observations. The observations from the of March (listed in Table 1) have a signal to noise ratio (S/N) of 95-420, however the other observations have a S/N lower than 50 due to poor weather conditions. Thus only the observations from the of March were suitable for a frequency and abundance analysis.
We reduced the time-series of HIDES observations of DD UMa with standard IRAF (Image Reduction and Analysis Facility) routines; this included bias subtraction, flat fielding, subtraction of background scattered light, extraction, and wavelength calibration using Th-Ar lamp spectra. After reduction and extraction, a barycentric correction was applied to the spectra, and the spectra were continuum normalised.
Since hydrogen Balmer lines are sensitive to temperature and surface gravity, and insensitive to the details of chemical abundances, they are powerful tools for deriving stellar atmospheric parameters. While HIDES has high spectral resolution, the échelle spectral orders are only 85 Å long. The Balmer lines of DD UMa are about 300 Å wide, consequently proper normalisation of Balmer lines in the HIDES spectra was impossible. Additionally, when performing abundance analysis, a data set with a longer wavelength range includes more spectral lines, which often provides access to abundances for additional elements. Because of this, we also used archival observations from the ELODIE instrument, which is a cross-dispersed échelle spectrograph that was attached to the 1.93 m telescope at the Observatoire de Haute-Provence. These observations were extracted from the ELODIE archive222http://atlas.obs-hp.fr/elodie/ (Moultaka et al., 2004), which provides reduced, optimally extracted, and wavelength calibrated spectra. The ELODIE observations of DD UMa cover a wavelength range of 3850-6800 Å (R=42,000) and include Balmer lines suitable for our analysis. We used the highest S/N (=284) observation of DD UMa, which was observed on the of March 2004.
| HJD | S/N | HJD | S/N |
|---|---|---|---|
| 2454891.9845 | 365 | 2454892.1202 | 296 |
| 2454891.9577 | 370 | 2454892.1410 | 380 |
| 2454891.9687 | 360 | 2454892.1519 | 364 |
| 2454891.9838 | 380 | 2454892.1629 | 337 |
| 2454891.9947 | 409 | 2454892.1738 | 320 |
| 2454892.0058 | 363 | 2454892.1849 | 200 |
| 2454892.0168 | 420 | 2454892.2135 | 382 |
| 2454892.0545 | 338 | 2454892.2245 | 342 |
| 2454892.0833 | 367 | 2454892.2394 | 327 |
| 2454892.0943 | 317 | 2454892.3658 | 95 |
| 2454892.1093 | 395 |
3 Frequency Analysis
The frequency analysis of pulsating stars provides information about the interiors of those stars. The absorption lines obtained from high-resolution and high S/N time-series spectra of pulsating stars show line profile variations, which carry indications of a star’s pulsational behaviour. If these line profile variations can be resolved, they can be used for mode identification of a star’s pulsation frequencies.
We performed frequency analysis with FAMIAS (Frequency Analysis and Mode Identification for Asteroseismology, Zima 2008) on the blended absorption lines centered at 4417, 4443, 4384, and 4481 Å in the HIDES data set from the of March 2009. FAMIAS searches for periodicities in time-series spectra using a Fourier analysis. These frequencies can then be refined using multi-periodic least-squares fitting. The program can also spectroscopically identify the pulsation modes associated with pulsation frequencies using either line moments (Briquet and Aerts, 2003) or a Fourier parameter fit (Zima, 2006). When searching for pulsation frequencies we used the ‘pixel-by-pixel’ mode, which computes Fourier spectra for each pixel in the line profile, then averages them together to produce a final mean Fourier spectrum.
An initial frequency analysis was performed on the lines centered at 4417, 4443, 4384, and 4481 Å, yielding peak frequencies between 9.4-10.8 c/d. For peaks in the Fourier spectrum, S/N is the ratio of the amplitude of the peak to the mean amplitude of the nearby spectrum after it has been pre-whitened with the peak’s frequency. Breger et al. (1993) found that a S/N amplitude ratio of 4 is a good criteria for distinguishing pulsation frequencies from noise. The only line that showed a frequency peak substantially above a S/N value of 4 during our frequency analysis was the line at 4384 Å. Thus we chose to focus our frequency analysis on this absorption line, which is a blend of the Fe I 4383.544 Å and Fe II 4385.387 Å lines.
The analysis of the 4384 Å line yielded a main frequency at =9.4 c/d (mean amplitude across the line A=0.0060, S/N=11.3) and another frequency at =15.0 c/d (A=0.0043, S/N=6.2). The main frequency of DD UMa at 9.4 c/d corresponds to a pulsation period of 2.6 hours (0.11 days). Unfortunately, the precision of these frequencies is limited due to the short time span of the usable spectra and the low pulsation amplitudes. Since the pulsation amplitudes of DD UMa are very low, our time-series data set does not have sufficient S/N to resolve the details of the line profile variations, thus we could not perform mode identification on the obtained pulsation frequencies.
4 Atmospheric Parameters and Abundance Analysis
For the spectral analysis we computed synthetic LTE spectra with the Synth3 code (Kochukhov, 2007). As input, we calculated plane-parallel, LTE model atmospheres with LLmodels (Shulyak et al., 2004), which includes detailed line blanketing, and convection with the method of Canuto and Mazzitelli (1992). Atomic line data were extracted from the Vienna Atomic Line Database (VALD, Piskunov et al. 1995; Kupka et al. 1999; Ryabchikova et al. 1999).
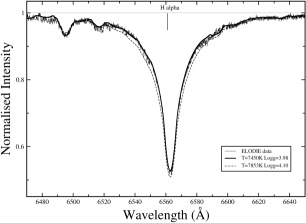
We first determined the effective temperature () and surface gravity () making use of photometric calibrations applied to Strömgren and Geneva colors, obtaining average values of =7853 K and =4.10. This set of parameters did not fit the H line profile, therefore, we refined by directly fitting the observed hydrogen line wings, obtaining K (see Fig. 1). We also examined the Fe I/Fe II ionisation equilibrium and, by enforcing this, derived a value of 3.85 from the ELODIE observation. The average of the photometric calibration and spectroscopic values is 3.98. The chemical abundances derived with this value, presented in Fig. 2, are in good agreement for different ionisation stages of the same element. For comparison, we calculated based on the mass derived in Sect. 5, and the radius derived from the bolometric magnitude and effective temperature. We obtained = 4.06, which is consistent with our average . The final fundamental parameters of DD UMa are K and .
We derived a microturbulence velocity () km/s by minimising the standard deviation of weak and strong lines of both Fe I and Fe II, in the same way as described by Fossati et al. (2007). We also calculated =2.6 km/s from the relation given by Pace et al. (2006): km/s. Since this value agrees well with the one obtained from the minimisation of standard deviations, we used km/s during our analysis.
The projected rotational velocities () from the ELODIE and HIDES spectra of DD UMa were calculated as and km/s, respectively. These values are much higher than the 145 km/s derived by Abt and Morrell (1995) who used Gaussian fits to line profiles, but are in excellent agreement with Takeda et al. (2009) who derived 187 km/s by fitting synthetic line profiles to observations.
Due to the fast rotation of DD UMa, the spectral lines in our observations are all heavily blended, and thus the equivalent widths of lines can not be measured. Instead, full synthetic spectra were produced with Synth3 (Kochukhov, 2007). Fitting for chemical abundances was done with the Lispan code’s line core fitting routine (Stütz et al., 2006), using the blended, rotational broadened synthetic spectra. For lines blended with other elements, abundances for both elements were determined in an iterative process, relying on additional lines of those elements to provide further constraints. We adopted the Asplund et al. (2005) solar abundances as the initial point from which to begin the fitting process. Table 2 presents the average abundance values and estimated internal error of each ion, for both the ELODIE and HIDES observations. Due to the fast rotation of DD UMa, the internal error calculated for each ion is relatively large compared to slow rotating stars.
The internal error () is the standard deviation of the abundances determined for individual lines, and takes into account uncertainties in line oscillator strengths and the normalisation (Fossati et al., 2009). These values do not take into account the uncertainties in , , or and lead to an underestimate of the actual abundance uncertainty. In order to derive the actual uncertainty for the abundances determined from both sets of observations, we calculated the iron abundance change for a 1 difference in each fundamental parameter. For example, a (=150K) change in the (=7450 K) is equal to a 0.21 dex Fe abundance change for the ELODIE spectra. Likewise, we calculated the Fe abundance changes due to a difference in and of 1 and present these values in Table 3. When taking all of these uncertainties for Fe into account, the systematic error of the ELODIE and HIDES spectra are 0.28 dex and 0.33 dex, respectively.
| ELODIE | HIDES | |||||||
|---|---|---|---|---|---|---|---|---|
| At.Number | Ion | # | # | Solar Abundances | ||||
| 11 | Na I | -5.36 | 0.14 | 2 | - | - | - | -5.87 |
| 12 | Mg I | -4.14 | - | 1 | -4.43 | - | 1 | -4.51 |
| 12 | Mg II | -4.29 | 0.58 | 3 | - | - | - | -4.51 |
| 14 | Si I | -4.27 | - | 1 | - | - | - | -4.53 |
| 14 | Si II | -4.25 | 0.07 | 3 | - | - | - | -4.53 |
| 20 | Ca I | -5.60 | 0.39 | 10 | -5.76 | 0.01 | 2 | -5.73 |
| 20 | Ca II | -5.29 | - | 1 | - | - | - | -5.73 |
| 21 | Sc II | -9.28 | 0.32 | 4 | -9.00 | - | 1 | -8.99 |
| 22 | Ti I | -7.39 | 0.24 | 3 | -7.28 | 0.35 | 5 | -7.14 |
| 22 | Ti II | -7.36 | 0.37 | 5 | - | - | - | -7.14 |
| 24 | Cr I | -6.54 | 0.16 | 5 | -6.60 | 0.20 | 2 | -6.40 |
| 24 | Cr II | -6.52 | 0.18 | 2 | -6.59 | 0.32 | 3 | -6.40 |
| 25 | Mn I | -6.50 | 0.06 | 3 | -6.82 | 0.14 | 2 | -6.65 |
| 26 | Fe I | -4.64 | 0.23 | 24 | -4.71 | 0.16 | 21 | -4.59 |
| 26 | Fe II | -4.61 | 0.13 | 8 | -4.69 | 0.26 | 4 | -4.59 |
| 28 | Ni I | -6.21 | 0.12 | 7 | -6.00 | - | 1 | -5.81 |
| 56 | Ba II | -9.65 | 0.45 | 3 | - | - | - | -9.87 |
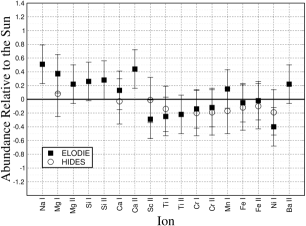
The abundance values obtained from both ELODIE and HIDES spectra are plotted relative to solar abundances (Asplund et al., 2005) in Fig. 2. The abundances derived for different ions of the same element are in good agreement for both sets of spectra. The abundance values of each ion are consistent with the solar values, within the internal and systematic uncertainty, except for Na I and Ca II. Only one line was used to derive the abundance value of Ca II, and thus this value is rather uncertain. The Na abundance was derived from the Na doublet at 5682 & 5688 Å which is subject to non-LTE effects, and therefore is clearly overestimated. Excluding these two odd ions, DD UMa has solar abundances with a metallicity of . was calculated from
| (1) |
where is the atomic number of an element with atomic mass and solar abundances from Asplund et al. (2005) were adopted for all the elements that we did not analyse. This value is well within uncertainty of the solar value reported by Asplund et al. (2005).
| Parameter | ELODIE | HIDES |
|---|---|---|
| 0.21 | 0.23 | |
| 0.03 | 0.03 | |
| 0.18 | 0.24 | |
| 0.28 | 0.33 |
5 Membership and Evolutionary Status
We assessed the membership of DD UMa in the Ursa Major group by means of two criteria: kinematic and spectroscopic. First, we measured the radial velocity from our spectra and calculated the kinematic parameters of DD UMa. Then we compared these values with the criteria in the literature for the nucleus and extended stream of the Ursa Major group. Our second approach was to compare the spectroscopic mean iron abundance of the Ursa Major group (Ammler-von Eiff and Guenther, 2009) with the iron abundance of DD UMa.
We derived the , , and space motions in Galactic coordinates for DD UMa with the equations given by (Johnson and Soderblom, 1987). The parameters used to calculate the space motion are listed in Table 4. In this table, the radial velocity was measured from the time-series of HIDES data. Parallax and proper motions were adopted from the new reduction of HIPPARCOS data by van Leeuwen (2007). The kinematic parameters of the Ursa Major subgroups (nucleus and extended stream) and DD UMa are listed in Table 5. We compared the kinematic values of DD UMa with both subgroups and determined that the space motion values of DD UMa are consistent with the extended stream (Chereul et al., 1999), but not with the nucleus (King et al., 2003) when taking into account the uncertainties.
| Parameter | Value |
|---|---|
| (mas) | |
| (mas/yr) | |
| (mas/yr) | |
| (km/s) |
| space velocity (km/s) | Reference | |||
|---|---|---|---|---|
| UMa Nucleus | King et al. (2003) | |||
| UMa Stream | Chereul et al. (1999) | |||
| DD UMa | This Study | |||
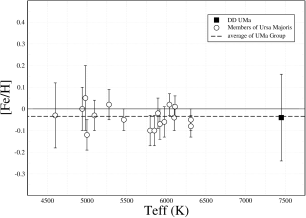
Ammler-von Eiff and Guenther (2009) calculated iron abundances, relative to solar, for 17 members of the Ursa Major group and obtained the average value of [FeH] dex, which is plotted as a horizontal dashed line in Fig. 3. The [FeH] value of DD UMa is dex, based on the ELODIE observation, and is plotted as a filled square in Fig. 3. This figure shows that the iron abundance of DD UMa is in good agreement with the other members of the Ursa Major group (plotted as open circles). Furthermore this figure shows that DD UMa and the Ursa Major group members have similar compositions.
| Parameter | Value | Reference |
|---|---|---|
| Mermilliod (1994) | ||
| (mas) | van Leeuwen (2007) | |
| Bolometric Correction | Balona (1994) | |
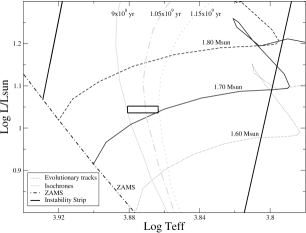
We calculated the luminosity of DD UMa from the apparent magnitude and parallax, listed in Table 6. The used was derived in Sect. 4. Using this luminosity and effective temperature we placed DD UMa on the H-R diagram. The 1 confidence interval around DD UMa is denoted by a rectangle in Fig. 4. DD UMa is clearly located within the instability strip (vertical black lines, in Fig. 4), which is consistent with it being a Scuti pulsator.
Evolutionary tracks were taken from the computations by Salasnich et al. (2000) and are plotted in the H-R diagram as black lines for masses of 1.60 M⊙ (dotted), 1.70 M⊙ (dashed), and 1.80 M⊙ (full), with solar metallicity. By comparison to these evolutionary tracks, we conclude that DD UMa has a mass of M⊙. Figure 4 shows three isochrones with solar metallicity from Marigo et al. (2008) for ages of , , and years, from left to right. The Ursa Major group contains stars loosely clustered around the ages , , and years (Chereul et al., 1999). DD UMa has a main sequence age of years, which is well within the age range of group members, and on the older side.
6 Conclusions
We conclude that kinematically DD UMa is located in the extended stream of the Ursa Major group, and that it satisfies the spectroscopic criteria given by Ammler-von Eiff and Guenther (2009) for a group member.
DD UMa has solar chemical abundances, an effective temperature of K and a of . From the star’s H-R diagram position we infer a mass of M⊙ and an age of years, which makes it coeval with the Ursa Major group. As a Scuti pulsator, we identified a main pulsational frequency of 9.4 c/d, and a second frequency of 15.0 c/d.
DD UMa is an unbound and relatively old (compared to the group average) member of the Ursa Major group. It will provide important information for subsequent kinematic evolution and origin studies of the Ursa Major group. Furthermore, this study provides valuable information for future asteroseismic studies with the BRITE-constellation, which is planned to launch this year. Photometric measurements with the BRITE-constellation will reveal more pulsation frequencies for mode identification, which can be compared to detailed asteroseismic models.
Acknowledgements This paper is based on observations using the HIDES spectrograph at the Okayama Astrophysical Observatory (Japan). A. Elmaslı gratefully acknowledges the National Astronomical Observatory of Japan (NAOJ) for providing financial support for the observing run (Project no: 09A-12). She also acknowledges Ankara University for providing her a travel grant to the UK and the Open University (UK) for funding accommodation during the analysis of the data.
References
- Abt (1965) Abt, H.A., 1965. The Frequency of Binaries among Normal A-Type Stars. ApJS 11, 429.
- Abt and Morrell (1995) Abt, H.A., Morrell, N.I., 1995. The Relation between Rotational Velocities and Spectral Peculiarities among A-Type Stars. ApJS 99, 135.
- Ammler-von Eiff and Guenther (2009) Ammler-von Eiff, M., Guenther, E.W., 2009. Spectroscopic properties of cool Ursa Major group members. A&A 508, 677.
- Asplund et al. (2005) Asplund, M., Grevesse, N., Sauval, A.J., 2005. The Solar Chemical Composition, in: T. G. Barnes III & F. N. Bash (Ed.), Cosmic Abundances as Records of Stellar Evolution and Nucleosynthesis, p. 25.
- Balona (1994) Balona, L.A., 1994. Effective Temperature Bolometric Correction and Mass Calibration of O-F. MNRAS 268, 119.
- Breger et al. (1993) Breger, M., Stich, J., Garrido, R., Martin, B., Jiang, S.Y., Li, Z.P., Hube, D.P., Ostermann, W., Paparo, M., Scheck, M., 1993. Nonradial Pulsation of the Delta-Scuti Star Bu-Cancri in the Praesepe Cluster. A&A 271, 482.
- Briquet and Aerts (2003) Briquet, M., Aerts, C., 2003. A new version of the moment method, optimized for mode identification in multiperiodic stars. A&A 398, 687.
- Canuto and Mazzitelli (1992) Canuto, V.M., Mazzitelli, I., 1992. Further improvements of a new model for turbulent convection in stars. ApJ 389, 724.
- Chereul et al. (1999) Chereul, E., Crézé, M., Bienaymé, O., 1999. The distribution of nearby stars in phase space mapped by Hipparcos. Clustering and streaming among A-F type stars. A&AS 135, 5.
- Fossati et al. (2007) Fossati, L., Bagnulo, S., Monier, R., Khan, S.A., Kochukhov, O., Landstreet, J., Wade, G., Weiss, W., 2007. Late stages of the evolution of A-type stars on the main sequence: comparison between observed chemical abundances and diffusion models for 8 Am stars of the Praesepe cluster. A&A 476, 911.
- Fossati et al. (2009) Fossati, L., Ryabchikova, T., Bagnulo, S., Alecian, E., Grunhut, J., Kochukhov, O., Wade, G., 2009. The chemical abundance analysis of normal early A- and late B-type stars. A&A 503, 945.
- Horan et al. (1974) Horan, S.J., Michael, J.L., Seeds, M.A., 1974. Possible Beats in Two delta Scuti Stars. IBVS 896, 1.
- Huggins (1871) Huggins, W., 1871. On the Spectrum of the Great Nebula in Orion, and on the Motions of Some Stars towards or from the Earth. RSPS 20, 379.
- Johnson and Soderblom (1987) Johnson, D.R.H., Soderblom, D.R., 1987. Calculating galactic space velocities and their uncertainties, with an application to the Ursa Major group. AJ 93, 864.
- King et al. (2003) King, J.R., Villarreal, A.R., Soderblom, D.R., Gulliver, A.F., Adelman, S.J., 2003. Stellar Kinematic Groups. II. A Reexamination of the Membership, Activity, and Age of the Ursa Major Group. AJ 125, 1980.
- Kochukhov (2007) Kochukhov, O.P., 2007. Spectrum synthesis for magnetic, chemically stratified stellar atmospheres, in: I. I. Romanyuk, D. O. Kudryavtsev, O. M. Neizvestnaya, & V. M. Shapoval (Ed.), Physics of Magnetic Stars, p. 109.
- Kupka et al. (1999) Kupka, F., Piskunov, N., Ryabchikova, T.A., Stempels, H.C., Weiss, W.W., 1999. VALD-2: Progress of the Vienna Atomic Line Data Base. A&AS 138, 119.
- Marigo et al. (2008) Marigo, P., Girardi, L., Bressan, A., Groenewegen, M.A.T., Silva, L., Granato, G.L., 2008. Evolution of asymptotic giant branch stars. II. Optical to far-infrared isochrones with improved TP-AGB models. A&A 482, 883.
- Mermilliod (1994) Mermilliod, J.C., 1994. UBV photoelectric catalogue: 1986-1992 data. BICDS 45, 3.
- Moultaka et al. (2004) Moultaka, J., Ilovaisky, S.A., Prugniel, P., Soubiran, C., 2004. The ELODIE Archive. PASP 116, 693.
- Pace et al. (2006) Pace, G., Recio-Blanco, A., Piotto, G., Momany, Y., 2006. Abundance anomalies in hot horizontal branch stars of the Galactic globular cluster NGC 2808. A&A 452, 493.
- Percy (1973) Percy, J.R., 1973. A Search for Delta Scuti Stars. JRASC 67, 139.
- Piskunov et al. (1995) Piskunov, N.E., Kupka, F., Ryabchikova, T.A., Weiss, W.W., Jeffery, C.S., 1995. VALD: The Vienna Atomic Line Data Base. A&AS 112, 525.
- Proctor (1869) Proctor, R.A., 1869. Preliminary Paper on Certain Drifting Motions of the Stars. RSPS 18, 169.
- Rodríguez et al. (2000) Rodríguez, E., López-González, M.J., López de Coca, P., 2000. A revised catalogue of delta Sct stars. A&A 144, 469.
- Ryabchikova et al. (1999) Ryabchikova, T.A., Piskunov, N.E., Stempels, H.C., Kupka, F., Weiss, W.W., 1999. . Phis. Scr. T83, 162.
- Salasnich et al. (2000) Salasnich, B., Girardi, L., Weiss, A., Chiosi, C., 2000. Evolutionary tracks and isochrones for alpha -enhanced stars. A&A 361, 1023.
- Samus et al. (2009) Samus, N.N., Durlevich, O.V., et al., 2009. General Catalogue of Variable Stars (Samus+ 2007-2011). yCat 1, 2025.
- Schlesinger (1914) Schlesinger, F., 1914. Spectroscopic Binaries under Investigation at Different Institutions. ApJ 39, 264.
- Shulyak et al. (2004) Shulyak, D., Tsymbal, V., Ryabchikova, T., Stütz, C., Weiss, W.W., 2004. Line-by-line opacity stellar model atmospheres. A&A 428, 993.
- Stütz et al. (2006) Stütz, C., Bagnulo, S., Jehin, E., Ledoux, C., Cabanac, R., Melo, C., Smoker, J.V., 2006. Abundance analysis of 5 early-type stars in the young open cluster IC 2391. A&A 451, 285.
- Takeda et al. (2009) Takeda, Y., Kang, D.I., Han, I., Lee, B.C., Kim, K.M., 2009. Can Sodium Abundances of A-Type Stars Be Reliably Determined from Na I 5890/5896 Lines? PASJ 61, 1165.
- van Leeuwen (2007) van Leeuwen, F., 2007. Validation of the new Hipparcos reduction. A&A 474, 653.
- Watson et al. (2011) Watson, C., Henden, A.A., Price, A., 2011. AAVSO International Variable Star Index VSX (Watson+, 2006-2011). yCat 1, 2027.
- Zima (2006) Zima, W., 2006. A new method for the spectroscopic identification of stellar non-radial pulsation modes. I. The method and numerical tests. A&A 455, 227.
- Zima (2008) Zima, W., 2008. FAMIAS - A userfriendly new software tool for the mode identification of photometric and spectroscopic times series. CoAst 157, 387.