A deep spectroscopic study of the filamentary nebulosity in NGC 4696, the brightest cluster galaxy in the Centaurus cluster
Abstract
We present results of deep integral field spectroscopy observations using high resolution optical (4150-7200 Å) VIMOS VLT spectra, of NGC 4696, the dominant galaxy in the Centaurus cluster (Abell 3526). After the Virgo cluster, this is the second nearest (z=0.0104) example of a cool core cluster. NGC 4696 is surrounded by a vast, luminous H emission line nebula (L). We explore the origin and excitation of the emission-line filaments and find their origin consistent with being drawn out, under rising radio bubbles, into the intracluster medium as in other similar systems. Contrary to previous observations we do not observe evidence for shock excitation of the outer filaments. Our optical spectra are consistent with the recent particle heating excitation mechanism of Ferland et al.
keywords:
galaxies: clusters: individual: Centaurus - galaxies: cooling flows - galaxies: individual: NGC 46961 Introduction
In this paper we report on deep (12 hours) integral field spectroscopy observations of the extended optical emission line system surrounding NGC 4696, the brightest cluster galaxy (BCG) in the Centaurus cluster (Abell 3526), which, at a redshift of is the second nearest example of a ‘cool core’ cluster.
Nearly half of all galaxy clusters have dense cores of cool X-ray emitting gas observed as a sharp peak in their X-ray surface brightness profiles. These ‘cool core’ clusters have short cooling times and central temperatures which drop to about a third of the cluster ambient temperature (for a review see Peterson & Fabian 2006 and McNamara & Nulsen 2007). In addition to the sharply peaked X-ray surface brightness profiles, many cool core clusters have extended filamentary optical emission line systems around their central, BCGs (see for example Hu et al. 1985; Heckman et al. 1989; Crawford & Fabian 1992; Donahue et al. 1992) and also vast molecular gas and dust reservoirs (e.g. Edge 2001; Edge et al. 2002; Jaffe et al. 2001; Salomé & Combes 2003; Donahue et al. 2000; McNamara et al. 1996).
Without some form of heating, the hot gas in these short central cooling time clusters will have had time to cool and condense producing large quantities (1011-1013 ) of cold gas and 1000’s of solar masses per year of star formation. Although signatures of cool and cold gas are observed in the central galaxies, in general only 10 per cent of the predicted star formation is observed. The current paradigm is that some form of heating, most likely dominated by feedback from the central AGN is responsible for regulating the heating and cooling in these objects.
The optical emission line nebulae surrounding the central galaxies in these systems, have been found to extend to distances of 100 kpc in some objects and contain 104-107 of 104 K gas. The origin and excitation mechanisms of the extended optical emission line systems has been much studied but as of yet no one mechanism has been found that can explain in detail all the features of the emission.
Mechanisms proposed include photoionisation by the central AGN (e.g. Heckman et al. 1989), photoionisation by massive or extremely hot stars (e.g. Terlevich & Melnick 1985; Johnstone et al. 1987), heating through shocks (e.g. Cowie et al. 1980; Sabra et al. 2000), conduction or mixing layers in the hot intracluster medium (ICM, e.g. Sparks et al. 1989; Crawford & Fabian 1992), and heating of the filaments through suprathermal particles (Ferland et al., 2008, 2009).
| Grism | Order sorting filter | Wavelength Coverage | Exposure | FOV | Spectral Resolution | Dispersion |
|---|---|---|---|---|---|---|
| s | /pix | |||||
| HRO1 | GG435 | 5250-7400 | 35100 | 27”27” | 2650 | 0.6 |
| HRO2 | GG435 | 5250-7400 | 5400 | 27”27” | 2650 | 0.6 |
| HRB | free | 4150-6200 | 9000 | 27”27” | 2550 | 0.51 |
| LRB | OS blue | 4000-6700 | 2700 | 54”54” | 220 | 5.3 |
1 Observations centered on NGC 4696.
2 Scan through galaxy.
The heating and cooling in the Centaurus cluster is very well balanced despite the short central cooling time of only 200 Myr. NGC 4696 houses a radio source, and multiple bubbles of relativistic gas. These are accompanied by soft X-ray filaments and a sharp rise in the metal abundance in the central 30 kpc, among the highest seen in any cluster ( twice solar, Sanders & Fabian 2002; Fabian et al. 2005; Sanders & Fabian 2006). Centaurus also has one of the broadest range of measured X-ray temperatures, containing gas from 0.35 to 3.7 keV, over a factor of 10 in temperature (Sanders et al., 2008).
Crawford et al. (2005) presented narrow band H+[N ii] images showing the extensive, filamentary H nebulosity surrounding NGC 4696. This shares the morphology of the soft X-ray filaments and of a prominent dust lane. The origin of the complex and extensive filamentary system surrounding NGC 4696 has long been discussed with suggestions that the filaments have cooled from the ICM, are the result of a merger (Sparks et al., 1989) or have been drawn out into the ICM from the central galaxy by rising radio bubbles (Crawford et al., 2005). Recent work by Farage et al. (2010) found in support of the merger origin and presented evidence for shock excitation in the filaments. Our data suggest that the filaments are similar to those seen around many other BCGs many of which have not undergone recent merger activity. We uncover a second velocity component in the central region which may be a filament extending behind the galaxy and discuss the excitation mechanisms for the system.
The observations and data reduction are briefly described in 2, analysis, results and a discussion of their implications in 3 and in 4 we summarise our results and main conclusions. At the redshift of the Centaurus cluster (, 44.3 Mpc) one arcsec corresponds to 0.210 kpc (throughout this paper we adopt H , and ).
2 Observations and Data Reduction
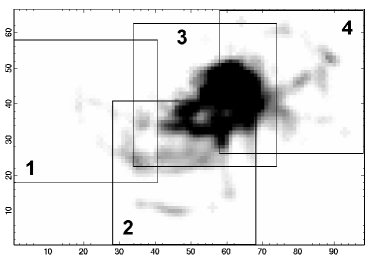
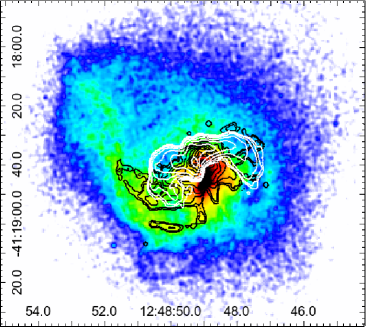
Observations were made on 2009 March 27th-30th using the VIsible MultiObject Spectrograph (VIMOS) on the VLT in La Paranal, Chile (see LeFevre et al. 2003 and Zanichelli et al. 2005 for a description of the VIMOS IFU and a discussion of data reduction techniques). We obtained high resolution orange (HRO), high resolution blue (HRB) and low resolution blue (LRB) data using the VIMOS Integral Field Unit (IFU). We used the larger 0.67” fibres giving a field of view of 27”27” with the HR grism and 54”54” with the LR grism. Details of the observations are given in Table 1 and the HRO pointings are shown in Fig. 1.
The deep HRO data cover the wavelength of redshifted spectral lines of [N I]5199 to [O II]7330 including five coronal lines the details of which can be found in Canning et al. (2011). The HRB data cover the wavelength of redshifted lines of H4341 to He I 5875. An analysis of the stellar spectra in this object using the LRB data will be presented in Canning et al. 2011 (in prep.).
The data were reduced by the VIPGI111VIPGI-VIMOS Interactive Pipeline Graphical Interface, obtained from http://cosmos.iasf-milano.inaf.it/pandora/. pipeline (Scodeggio et al., 2005). The resulting 3D-datacubes were combined with a set of IDL routines (R. Sharp, Private communication).
Instrument flexures in VIMOS are dependent on rotator position and suffer from hysteresis (Amico et al., 2008). For this reason we took calibration frames (three flats and one arc) after each observation block. The observation blocks consisted of three science exposures. Each were short exposures of only 15 minutes so as to minimise extreme flexures.
The wavelength calibration was done within VIPGI using He, Ne and Ar arc frames taken throughout the night. VIPGI performs a polynomial fit to the arc lines and we found that the rms deviations are approximately gaussian with a mean of 0.05 and dispersion of 0.02. This translates to an error in the velocity of 5 which is significantly smaller than our FWHM instrumental resolution of 98().
Flux calibration was done using standard stars observed at the beginning and end of every night. Cosmic-ray rejection, final fibre-to-fibre transmission corrections, sky subtraction, extinction corrections and shifting to the object rest frame were performed outside of VIPGI using IDL routines. Sky-subtraction, where done, was complicated by the lack of suitable sky fibres and is described below.
Telluric absorption feature corrections for the and absorption in the regime was determined from 4 observations of standard stars. Standards were observed at the beginning and the end of the night. Details of the correction are given in Appendix A.
VIPGI’s sky subtraction technique is optimised for deep survey observations where the field is devoid of extended objects. Given this we elect not to use VIPGI’s sky subtraction technique and instead use specific fibres shown to be lacking in emission lines associated with NGC 4696. We median combine the spectra to find an average sky spectrum, remove the continuum by means of a spline fit and scale and subtract the sky spectra from our object fibres. The line profiles are slightly different in each quadrant so this process is performed on a quadrant by quadrant basis.
After basic reduction, transmission correction and corrections for sky absorption and emission we bin the spectra in order to reach a chosen signal to noise. We try two binning methods: the first bins on the basis of the surface brightness of emission in a 2D image by following contours of a smoothed image (Sanders, 2006) while the second uses Voronoi tessellations to provide compact spatial bins (Cappellari & Copin, 2003). The results of the two binning methods applied to a 2D image of [N II]6583 emission in NGC 4696 is shown in Fig. 25.
When binning spectroscopic data one has to be careful not to bin over regions which are too extended. The spectral properties are unlikely to be similar in two distinct regions of a galaxy and thus binning these regions together would lead to spurious results. The Voronoi tessellation method of Cappellari & Copin (2003) provides more compact bins, however the extended optical filament system of BCGs adds a further complication. These structures are extended in only one direction and as such the requirement for ‘round’ bins does not trace their morphology particularly well. Due to the filamentary structure of the optical line nebulosity surrounding NGC 4696 we choose to bin our spectra using the contour binning technique of Sanders (2006).
Our HRO and HRB spectra overlap between . In order to incorporate all our data we split the cubes into three wavelength regions. The regions chosen are , and . The two HR grisms used have a slightly different spectral resolution (see Table 1) with the HRO being marginally larger than that of the HRB grism. In order to combine both data sets it is necessary to re-bin the HRO spectra, details of the rebinning technique can be found in Appendix A.
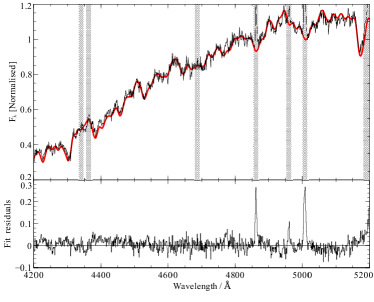
The strong emission lines of H and the [N II] and [S II] doublets are fit directly, on a pixel-to-pixel basis across the field of view. We fit these in IDL using MPFIT (Moré, 1978; Markwardt, 2009). The weaker lines are first continuum subtracted using template simple stellar population (SSP) models from Bruzual & Charlot (2003) (hereafter BC03), fit using the STARLIGHT software package (Cid Fernandes et al., 2005, 2009). We use basefiles made up of 240 BC03 models spanning 6 metallicities, covering the range , and 40 ages, covering the range Gyr. An example of a fit to the stellar continuum between 4000 and 5200 is shown in Fig. 2. After continuum subtraction the emission lines are fit using the same technique as the stronger lines described below. Where appropriate we impose the kinematics determined from the strongest emission features.
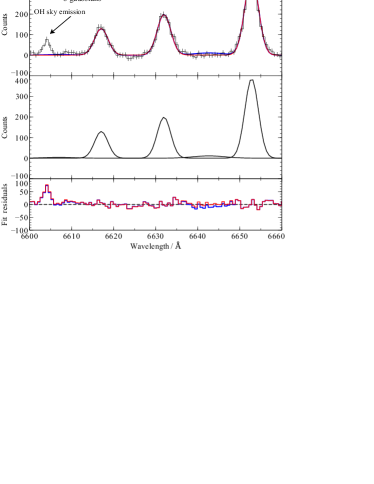
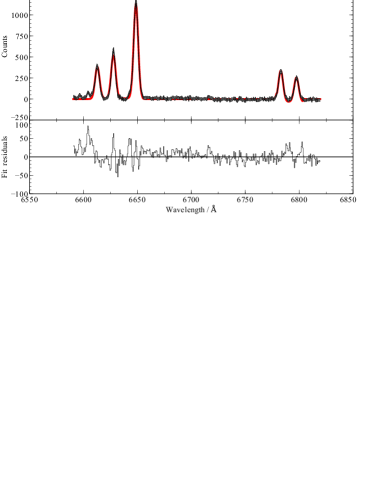
The five strongest emission features ([N II]6548, H6563, [N II]6583, [S II]6717 and [S II]6730) are fit simultaneously. The redshift and velocity dispersion are constrained to be the same for one velocity component and the integrated flux of the [N II] doublet is tied, the scaling being dictated by the atomic parameters (Osterbrock & Ferland, 2006). The spectrum is fit between 6590 and 6820 . A continuum estimate is taken as the region between 67006750 and subtracted from the spectrum. The continuum is fit locally for the H[N II] emission and the [S II] doublet. An example of the fitting technique is shown in Fig. 28. We fit gaussians to the spectra with 1, 2, and 3 velocity components both with and without a broad H component. We perform an F-test to determine which fit to use, this is discussed further in section 3.
3 Results and discussion
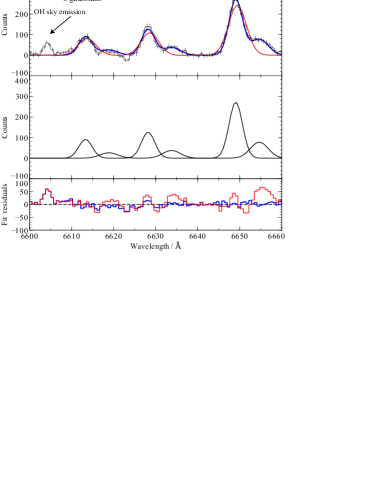
The line emission in the central regions of NGC 4696 is complex with many spectra requiring two velocity components to adequately fit the observed spectrum. We use the F-test statistic to determine which fit to use in the spectral modelling of a particular fibre. The F-test allows us to investigate the probability that the data follows the simpler of two proposed models nested within each other. We use MPFTEST in IDL to calculate the significance of the addition of extra parameters in the fit. We choose to accept the additional parameters when the probability falls below 0.01. The fits were examined by eye to ensure they were reasonable. Fig. 3 shows example fits to two bins; in the first the F-test indicates a single gaussian fit is sufficient to explain the data while in the second an additional velocity component is required.
It was not found necessary to fit a broad H component. There is good agreement between the components found necessary using different binning techniques in all areas where the data is of a sufficient signal to noise to attain a good fit. We adopt, for the remainder of the paper, the contour binning method of Sanders (2006) and the appropriate F-test results (see Fig. 27).
The central region of NGC 4696 is exceedingly complex with many individual filaments, each of which are likely formed by narrower interwoven threads as in the case of the extended emission line system of NGC 1275 in the Perseus cluster (Fabian et al., 2008). The two velocity components detected in this central region are probably due to distinct filaments seen in projection and as such it is not obvious that splitting the emission into simple ‘blueshifted’ and ‘redshifted’ populations will lend any physical insight into this system.
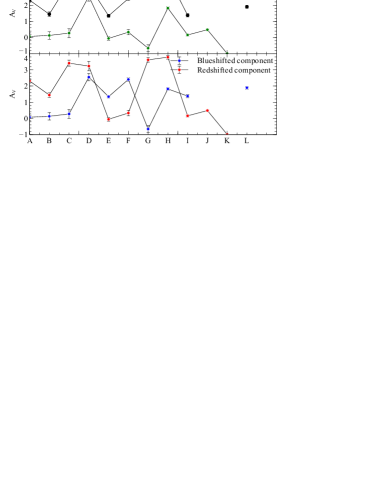
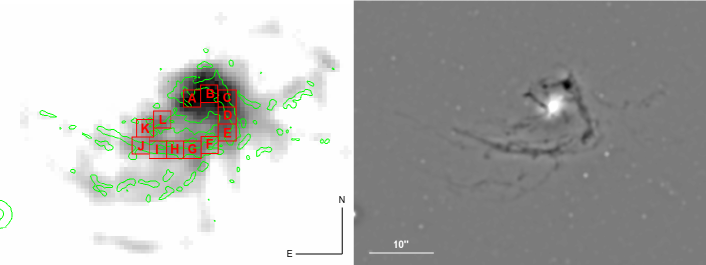
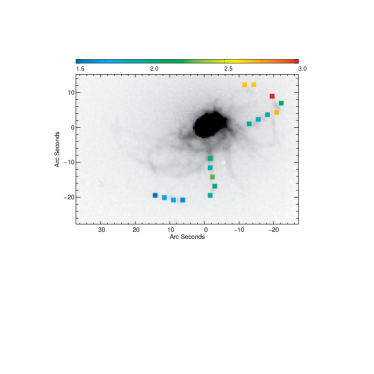
In order to provide a more physical basis for the division of the two populations we investigate the emission properties along the brightest inner filament. Fig. 4 shows on the same scale the [N II]6583 emission and dust lanes. There is a bright ridge of emission curling round the south-west of the nucleus which, in projection, coincides exactly with a large dust lane. We bin this region in 2.52.5 arcsecond bins (labelled from A to L in Fig. 4) and investigate the kinematic properties of the two velocity components were they to be seperated based on redshift, velocity width and intensity; the results are presented in Fig. 5.
We would expect, if these two components followed emission from two distinct filaments, that the line of sight velocities and the FWHM velocity widths would vary smoothly with distance along the filament. By which we mean that the velocities are unlikely to jump dramatically from bin to bin along the filament length. From this argument and using the kinematical data we rule out a division based on intensity (the bottom panel of Fig. 5). To investigate further separating the components based on redshift and velocity width we derive the intrinsic extinction from the H/H ratio of each component. The results can be seen in Fig. 6 and imply that splitting the two velocity components based on the breadth of the emission is equivalent to distinguishing them based on intrinsic extinction, with the narrower component being more extinguished than the broader component in all regions where the H and H lines could be detected at greater than 4 sigma. Splitting the components based on redshift provides no such distinction. From these results we suggest that distinguishing the two components by velocity width as opposed to redshift is the more physical approach. The broad component lies closer to the nucleus, coincident with the dust lane, whereas the narrow component lies behind, and is therefore more reddened. For the remainder of the paper, unless otherwise stated, the two velocity components will be split into ‘broader’ and ‘narrower’ width components.
3.1 Reddening
We deredden the spectra for Galactic extinction using the reddening law of Calzetti et al. (2000) and an E(B-V) value for the stellar continuum of 0.11 (). An extinction to reddening ratio, , of 3.1 is assumed for our Galaxy. This is done before shifting the spectra to their rest wavelength. A value for the intrinsic reddening is also estimated, where possible, from the H and H line ratios (Fig. 29).
The logarithmic H extinction coefficient, , is calculated from the observed , and intrinsic line ratios ,
| (1) |
assuming a reddening law . The extinction coefficient and reddening can therefore be calculated through,
| (2) |
For the weaker Balmer line we impose the kinematics of the strong emission lines and subtract the continuum using template SSP models as described in section 2. The intrinsic extinction is calculated using the rest wavelengths of the lines and we assume a case B intrinsic recombination ratio. This method makes the assumptions that the dust is an obscuring screen, is homogeneous and that all the H and H emission is from hydrogen recombination, none from collisional excitation.
The reddening map for a one component velocity fit, on a per pixel basis, in the central regions of NGC 4696 is shown in Fig. 29. A single component fit is presented as H is weak and the second velocity component does not provide a good fit unless the fibres are rather coarsely binned, as in Fig. 6. Contours of E(B-V) derived from HST B and I band images and Chandra X-ray NH column density (Crawford et al., 2005) are overlaid.
The regions where the value of intrinsic AV is highest correspond well to the regions where E(B-V) and NH are greatest though the exact position of the peaks are sometimes offset from those in the X-ray and broad band optical map. Crawford et al. (2005) find the regions of greatest extinction have a value of A0.4 which is in good agreement with previous studies (Jorgensen et al., 1983; Sparks et al., 1989). Our results, for the same knots, assuming a case B intrinsic H to H line ratio (Osterbrock & Ferland, 2006) are larger than this with AV’s in the range 1.5-2 for most of the knots along the dust lane. In order to make our results consistent with these previous imaging studies we require an intrinsic H to H ratio of 4 (nearly 1.5 the case B ratio) requiring a large component of collisional excitation to the hydrogen lines.
For Seyfert galaxies, radio galaxies and LINERs the intrinsic H/H ratio is usually measured to be larger than case B, 3.1, due to the greater importance of collisional excitation in regions where there is a harder photoionising spectrum (e.g. Veilleux & Osterbrock 1987). High ratios have also been seen in the case of the extended emission line regions surrounding some BCGs. Kent & Sargent (1979) found a ratio of 4.77 in the filaments of NGC 1275, the brightest cluster galaxy in the Perseus cluster. Gemini spectroscopy by Hatch et al. (2006) confirms this high ratio finding values of H/H of 3-7 in the filaments. Voit & Donahue (1997) also find significant reddening in the filaments of Abell 2597 at 1.5 times the case B ratio. In both NGC 1275 and Abell 2597 the authors find no evidence for a deviation from the Galactic extinction laws. This implies the properties of the dust in the filaments are similar to that of our own Galaxy.
Sparks et al. (1989) found, from broad band V and R images, that the dust extinction with wavelength behaves ‘normally’ in NGC 4696, that is there is no evidence for a departure from the Galactic extinction laws. This makes formation of the filaments from the hot gas unlikely, and the authors favour a merger origin for the dust lane and filaments. More recently it has been suggested that the dust lane could be the result of previous dusty star formation in the central galaxy which has been drawn out with the cool gas into filaments by radio bubbles rising in the ICM.

| Line | Total flux | Total luminosity | Flux / FHα |
|---|---|---|---|
| H | 0.02 | ||
| 0.01 | |||
| He | 0.02 | ||
| H | 0.20 | ||
| 0.09 | |||
| 0.28 | |||
| 0.06 | |||
| 0.01 | |||
| 0.03 | |||
| 0.04 | |||
| He ** | 0.17 | ||
| ** | 0.18 | ||
| ** | 0.06 | ||
| 0.56 | |||
| H** | 1.00 | ||
| 1.87 | |||
| 0.56 | |||
| 0.46 | |||
| ** | 0.18 | ||
| ** | 0.38 | ||
| ** | 0.38 | ||
| ** | 0.21 |
To make a comparison with the extinction corrections of Farage et al. (2010) we examine the extinction in a 3 arcsecond diameter region approximately 3” north-west of the nucleus (taken to be the centre of radio emission and of the X-ray point source , 18’39.4”), where we find the peak in our H emission map. The coordinates of our chosen region are (, 18’37.8”). Fitting the H and H emission with a single velocity component, as in Farage et al. (2010), we find the intrinsic AV in this region is 0.33. Using the same values of the intrinsic emitted flux ratio () as these authors gives a total AV of 0.67. Using the case B ratio the total AV is 0.91. Our value differs from that of Farage et al. (2010) by 0.07; this is well within the error as a difference in the position of our region of 1.5” translates to a factor of almost 2 in the H/H ratio.
As the reddening correction varies quite significantly across the field of view, due to the presence of the large dust lane, we elect to use the local value of the H/H ratio where possible to correct our fluxes. Where this is not possible we use the median value of A0.9.
3.2 Filament morphology
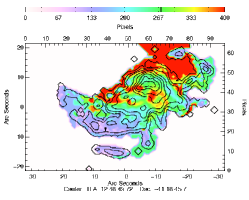
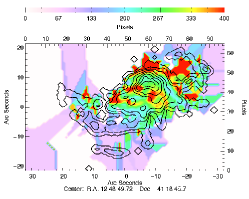
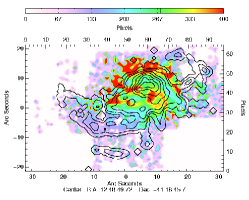
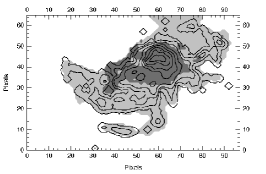
The detected line emission in our data follows closely the emission detected in the narrow band H imaging of Crawford et al. (2005) (Fig. 7). A central filament is seen with two velocity components extending 12 arcseconds to the south-east of the nucleus. A further complex system of filaments extending over 25 arcseconds to the north-west, south and east are also detected. Only the north-east appears devoid of filaments. All emission lines, with the exception of [O iii], where the lines were strong enough not to impose the kinematics of the H emission were found to have the same morphology as the H line suggesting the emission occurs from the same gas. There also appears to be dust lanes present in all filaments except the weak southern-most filament (Fig. 4).
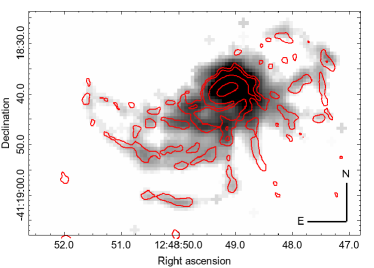
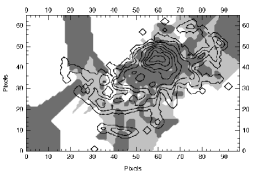
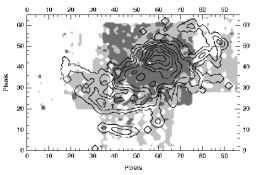
The emission line gas traces well the inner regions of the soft X-ray filaments (Fig. 8). However, the soft X-ray filaments extend much further up to the north-east of the galaxy leading towards a depression in the X-ray gas thought to be a ghost bubble, of plasma from the radio source, risen bouyantly from the nucleus (Crawford et al., 2005). The area just north-east of the nucleus, devoid of both optical emission line gas and soft X-ray filaments coincides with a prominant radio bubble.
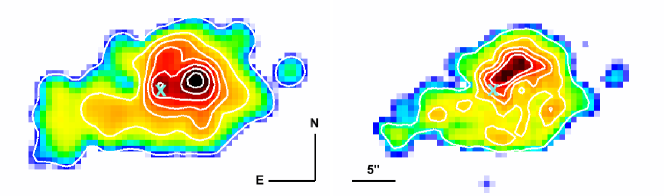
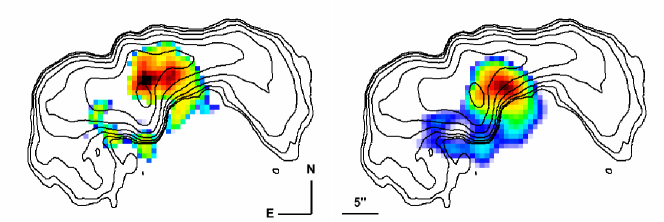
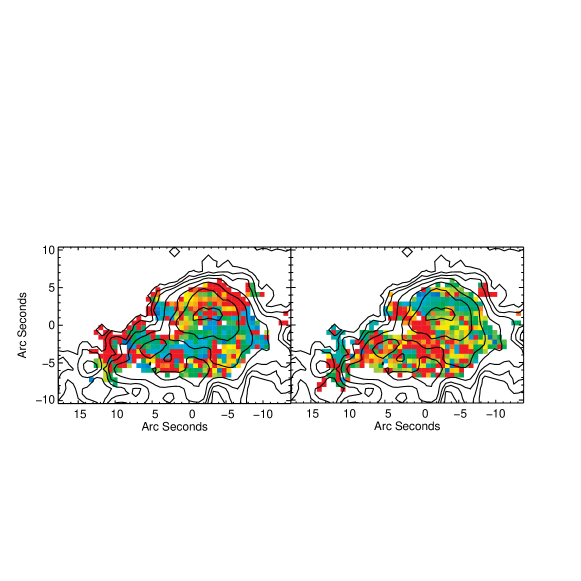
The two velocity components have a different morphological structure. Fig. 9 shows the [N II]6583 line emission in this central region, smoothed by a gaussian with FWHM 3.1” (1.3”, 2 pixels). The left hand image is the emission from the broader component and shows two clear peaks in emission. The weaker peak to the east coincides with the centre of radio emission and the weak X-ray point source (, 18’39.4”, Taylor et al. 2002); throughout this paper we define the nucleus as this point. 5 arcseconds to the west is the point of largest flux for the broad emission component. The surface brightness contours show the emission about this point is smooth and circular in the central 5 arcseconds before stretching towards the south-east of the nucleus. The right hand image shows the narrow emission component which is far less smooth in morphology. The emission peaks in a bar stretching north-west from the nucleus then curls clockwise round the nucleus. We find the contours of surface brightness of both of these components deviates from that of the dust near to the nucleus as found by Farage et al. (2010).
Fig. 10 shows a single component fit to the [O III]5007 emission (left), beside an [N II]6583 single component fit emission map (right). The [O iii] emission is weakly detected in the inner filament (we do not have a HRB pointing in the outer regions) but very strong near to the centre of radio emission. The second peak of [O iii] emission to the west which coicides with the peak in the other emission lines is much weaker, implying much of the [O iii] emission in the central regions is associated with the AGN.
Sparks et al. (1989) and Farage et al. (2010) suggest NGC 4696 has an intrinsically one sided spiral structure due to the apparent close association of the main dust lane and line emission. While we also observe a very striking close correspondence between the optical filaments and the many dust lanes of NGC 4696 (see Fig. 4), our detection of at least two velocity components to the optical emission line gas, exhibiting different extinction properties, provides evidence contrary to this suggestion. NGC 4696 is clearly a very complex galaxy surrounded by an intricate filamentary system. The high extinction of the narrow velocity component and its less smooth morphology is interpreted as a filament located behind the main, more centrally situated broader emission line component.
3.3 Emission line fluxes
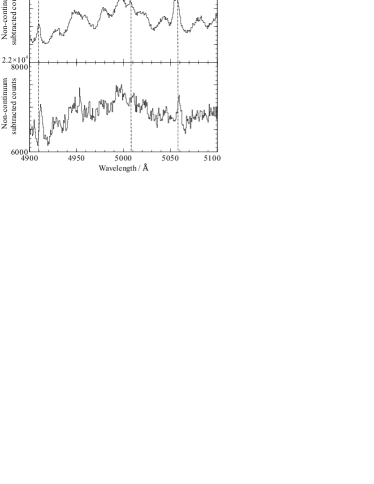
The spectrum of a region with a radius of 10 arcsec centred on the radio core, with and without continuum subtraction, is shown in Fig. 11, with the strongest lines marked. The spectrum is similar to other filament emission in cool core BCGs, showing strong low ionisation emission lines. NGC 4696 has stronger [O iii]5007 emission than found in NGC 1275 or Abell 2597 though the majority of this emission coincides with the nucleus and is likely associated with the AGN.
We compare the dereddened flux in H emission to that of Crawford et al. (2005). Using narrow band H imaging the authors find a surface brightness in the inner ( 8” from the radio core) filaments of and in the fainter outer filaments ( 27”) of . They obtain a lower limit on the total H luminosity beyond a radius of 3.5” of . Our data are consistent with this with the average surface brightness of the filaments 8” and 27” from the radio core being and respectively. We obtain a total extinction corrected H luminosity beyond a radius of 3.5” of and a total extinction corrected H luminosity of . Our derived H and [N ii] fluxes and luminosities are slightly larger than, though still consistent with, those of Farage et al. (2010). This is expected as our HRO data probes more of the filament system.
The total luminosities of all detected lines and the 90 per cent upper limits of emission lines not found in our spectra are given in Table 2. Emission lines are fit as described in Section 2 although some lines are confused with other emission lines or sky and therefore warrant special attention. He I, [O I]6300, H, [Ca II] and emission lines of [O II] suffer from confusion with sky emission, in each of these cases the sky emission is fit simultaneously with the object emission lines. The red wing of the object [O I]6363 emission coincides with the [Fe X]6374 emission line discussed in Canning et al. (2011). The flux of this line is linked by atomic physics to the flux of the [O I]6300 emission and we fit these, the sky [O I] lines and the [Fe X]6374 emission line together. We only have HRB data from the central 27” of NGC 4696, therefore all emission lines blueward of 5100 may be lower limits.
| Line | Fλ/ F | Fλ/ F |
|---|---|---|
| H | 0.37 | 0.23 |
| 0.26 | - | |
| 0.77 | 0.15 | |
| 0.23 | 0.19 | |
| He ** | 0.15 | - |
| ** | 0.18 | 0.21 |
| ** | 0.06 | 0.07 |
| 1.04 | 0.57 | |
| H** | 1.00 | 1.00 |
| 3.10 | 1.70 | |
| 0.92 | 0.39 | |
| 0.58 | 0.33 |
3.3.1 [O III] emission
A characteristic of the extended optical emission filaments in many BCGs is their low [O III] emission with respect to the hydrogen recombination lines (see for example Hatch et al. 2006) and surprisingly high [Ne III] emission lines (see discussion of charge exchange in Ferland et al. 2009). The ionisation potential of Ne+ is greater than that of O+ so if we observe [Ne III] lines we would expect to see those of [O III] as well.
The total [O III]5007 emission in NGC 4696 is fairly strong with an [O III]5007/H4861 intensity ratio measured as 1.4 in the inner 2727 arcseconds (the field-of-view of our HRB grism). However, as discussed in Section 3.2 the surface brightness of [O III] emission is steeply peaked and located near to the centre of radio emission. It is therefore probable that much of the [O III] emission is due to the central AGN.
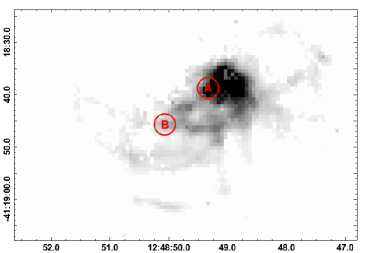
We investigate this possibility by choosing two regions; one coincident with the radio nucleus (region A) and one offset by 12 arcseconds, on the farthest edge of the inner filament from the nucleus (region B). Spectra are extracted in both regions from a 3 pixel (2”) radius circle, the regions are shown in Fig. 12 and the spectral regions containing the H line and [O III] emission are shown in Fig. 13. The ratio of [O III]5007/H4861 clearly varies in the two regions with the central region having a ratio of 2 and the filament emission having a much lower [O III]5007/H4861 ratio of only 0.7. Ratios of the fluxes of the detected lines to H for the two regions are shown in Table 3.
Observations of the inner regions of NGC 1275 (Kent & Sargent, 1979; Sabra et al., 2000) have found [O III]5007/H4861 ratios of 0.6 in the inner 24 arcsec (8 kpc), however the [O III]5007 emission in the outer filaments, beyond 10 kpc, is not detected in the long slit spectra of Hatch et al. (2006). The authors are able to put an upper limit on the [O III]5007/H6563 emission in a region 18 kpc from the nucleus of 0.03, their limit on [O III]5007/H4861 is 0.13.
Using long slit spectra from the INT and FOS spectra Johnstone & Fabian (1988) found that the [O III]5007/H4861 ratio decreases away from the core in both NGC 1275 and Abell 1795. In NGC 1275 their spectra extend to a radius of 8 kpc where they find the ratio drops by a third from the central value to about 0.5. Similarly in Abell 1795 the ratio peaks at about 1 in the nucleus and decreases to 0.6 at the outer extent of the slit which correspond to a radius of 6 kpc. Low [O III]5007/H4861 ratios have also been observed in the vast emission line nebula associated with the BCG of Abell 2597 (Voit & Donahue, 1997).
Shock models tend to predict higher [O III]5007/H4861 intensity ratios and larger fluxes of [O III]4363 than those seen in the outer extents of the emission line nebulae surrounding these objects (Sabra et al., 2000; Voit & Donahue, 1997). We obtain only upper limits on the [O III]4363 emission across the field-of-view with the upper limit on the [O III]4363/H4861 intensity ratios of 0.08. Unfortunately we only acquired one pointing of HRB data in NGC 4696 so are unable to investigate the ratio in the very outer extent of the nebulae.
Our spectra do not extend far enough into the blue to observe the [Ne III]3869 optical line, however, Farage et al. (2010) have detected this at the 3 level (see their Fig. 3). The infra-red line of [Ne III]15.56 m has also been clearly detected using Spitzer IRS SH spectra by Johnstone et al. (2007). Photoionisation models for the excitation of the emission line nebulae struggle to account for the anomalously low [O III] yet high [Ne III] emission unless coupled with high metallicities. Sanders & Fabian (2006) find the oxygen and Ne abundances to peak at about solar towards the centre of the Centaurus cluster. However, the measured Ne abundance is highly dependent on the spectral model and varies between 0.5-2 between the SPEX and APEC models.
Particle ionisation models put forward by Ferland et al. (2008, 2009) have so far been successful at reproducing the observed ratios due to the importance of charge-transfer. Using cloudy simulations (last described by Ferland et al. 1998) the authors find the charge-transfer recombination of O+ and O+2 is very fast compared to He+, Ne+ and Ne+2 resulting in significant [Ne II] and [Ne III] emission compared with [O III].
3.4 Velocity structure
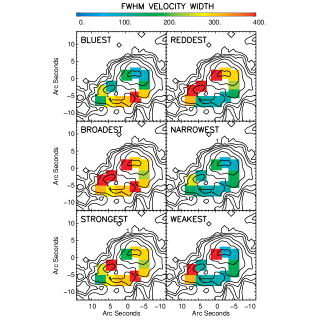
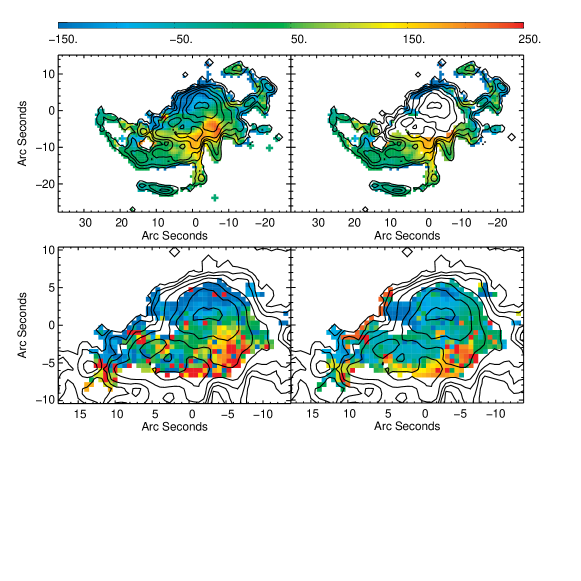
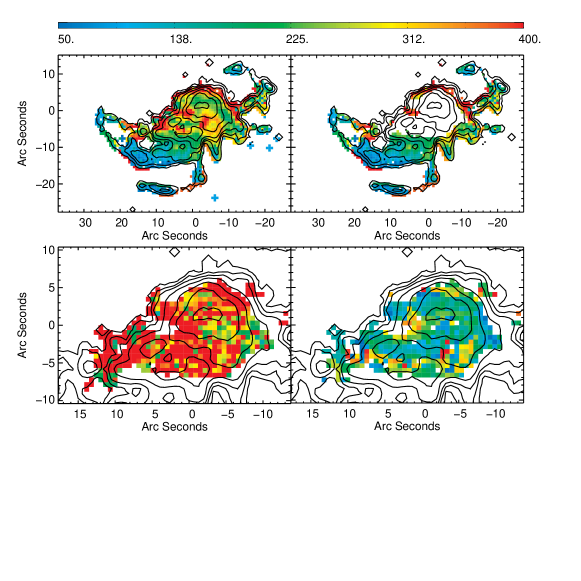
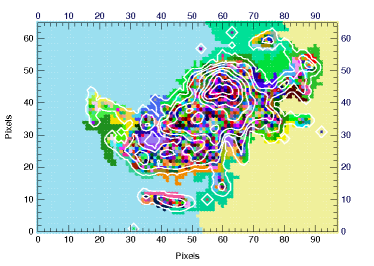
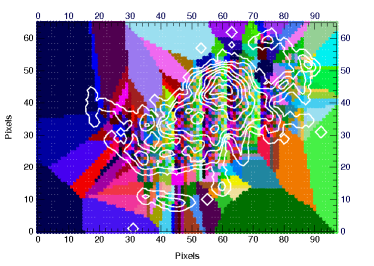
Maps of the kinematics of the optical emission line nebulae are shown in Figs. 14 and 15. The line-of-sight velocities are given with respect to the redshift of NGC 4696 determined to be (3045 ) by Postman & Lauer (1995). The velocity dispersions are presented as the FWHM velocities measured from the gaussian fits to the strongest emission lines in our spectra and have been corrected for the measured instrumental width, determined from fitting sky lines close to the observed H emission line (FWHM 98 , ). All emission lines strong enough to map were found to have essentially the same velocities, as seen in Farage et al. (2010), therefore we only show maps of [N II]6583.
3.5 Central velocity structure
The line-of-sight velocity of the central region of the galaxy changes smoothly by 400 across the north to south direction with the southern region being more redshifted, perhaps indicating a component of rotation of the nebula about the nucleus. This gradient in velocity structure is seen in both the broad and narrow velocity components but to different extents (see Fig. 16).
The broad component has a wider distribution of line-of-sight velocities, with the northern-most and southern-most velocities varying by 500 while in the narrow component the velocity changes by 250 from the northern-most to southern-most regions. This limited range in velocities is similar to those observed in the extended filaments seen to the north-west, south and east of the nucleus.
The broad velocity component has a FWHM of 300400 while the narrow component has widths in the range 50200 . The line widths of both components are much greater than the thermal widths of the hydrogen gas which is broadened by 10 at 104 K implying either the gas is broadened by shocks or by turbulence.
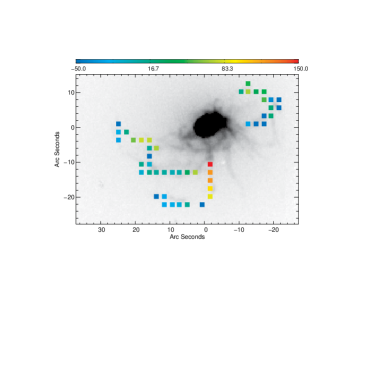
3.6 Outer filaments
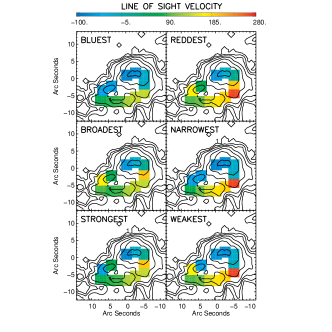
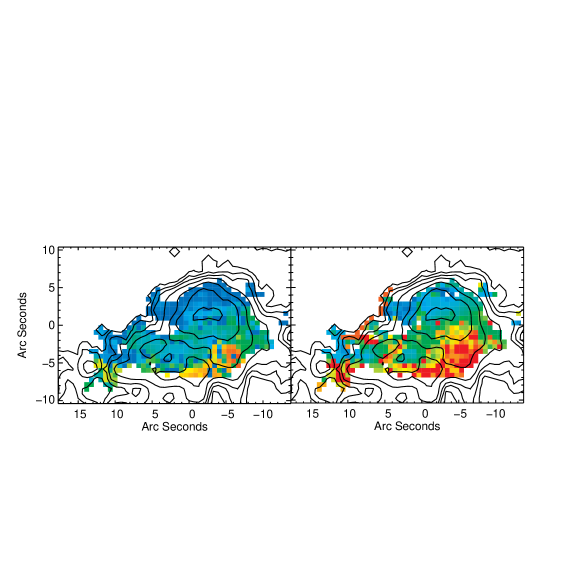
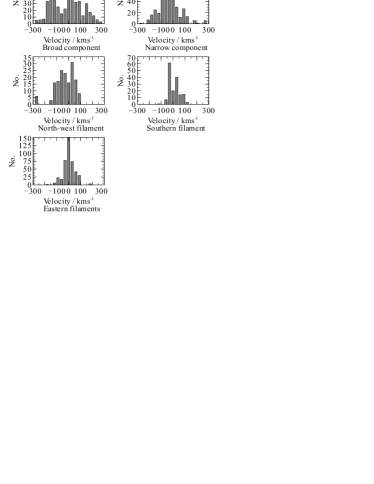
The distribution of line-of-sight velocities of the outer filaments is less than the central region, with a range of 200 in most cases. We bin the outer emission in 3 by 3 arcsecond bins to examine the velocity structure more closely along the length of the filaments, the results are shown in Fig. 17. The line-of-sight velocity zero-point is taken as 3045 .

The eastern filament is the dominant structure curling round the south-east of the galaxy, coinciding closely with the outer dust lanes and soft X-ray filaments. The H imaging of Crawford et al. (2005) shows this filament is in fact made of several thinner threads such as those resolved in NGC 1275 (Fabian et al., 2008). The filament extends over 30” (6 kpc) from the nucleus but exhibits a very narrow distribution in line-of-sight velocities peaking at the same velocity as the galaxy (see Fig. 16). The low velocities suggest we are vewing this filament close to the plane of the sky. Both the eastern filament and the north-west filament appear to curve round the radio bubble. The north-west filament has a larger variation in line-of-sight velocities, though the variation is still smooth, with the innermost part more blueshifted and the outermost part more redshifted.
The southern filament exhibits a divide in line-of-sight velocity along the filaments length such as was found by Hatch et al. (2006) in the northern filament of NGC 1275. The northern most part, closest to the nucleus, displays a redshift of 140 whereas the region farthest from the nucleus displays a blueshift of 50 . The regions closest and farthest from the nucleus along this filament may thus be moving in opposite directions with the filament either collapsing in or stretching out, however the filament is clearly curved and this scenario is complicated by projection effects.
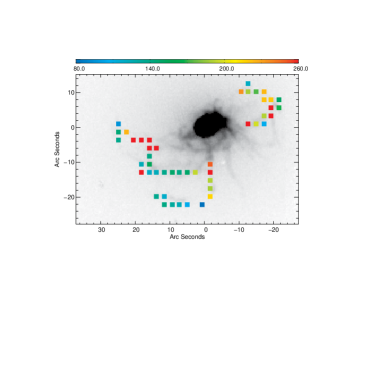
The velocity widths of the emission lines in the outer filaments are fairly low, ranging from 50250 with the more northern filaments having a slightly larger velocity width than the southern ones. The range of velocity widths measured in these filaments is similar to those seen in the Perseus cluster (Hatch et al., 2006).
3.7 Implications for filament origin
Kinematically the central narrow emission line component bears more similarity to the outer filaments than the broad component having both a lower velocity dispersion and a narrower distribution of line-of-sight velocities. This supports the interpretation of the narrow component being a separate filament farther from the nucleus, seen in projection with the main central broad component. This would suggest the filamentary system is not an intrinsically one-sided spiral structure and it is unclear how a merger origin could account for the diversity in morphology and kinematics of these filaments.
If the filaments had an inflow origin, as predicted by early cooling flow models (Fabian et al., 1984), we would expect that there would be a negative radial gradient in the widths of the emission lines due to both greater acceleration towards the centre and line-of-sight effects (Heckman et al., 1989). This is not observed in any of the outer filaments with the velocity dispersion being largely unvarying with the exception of the north-west filament where the velocity dispersion appears erratic along the filament. This filament exhibits knots in the H image, just north-east of the bend in the filament and again at the end. Another fainter filament is also present in the H image, which crosses or joins the north-west filament at this bend where the measured velocity width is largest (see Fig. 18). It is therefore likely that the measured velocity width in this region is large and erratic due to two or more filaments overlapping, in the line-of-sight, with slightly different velocities and resulting in a broad, strong peak of emission.
Crawford et al. (2005) suggest the filamentary system is the consequence of buoyantly rising radio bubbles which draw filaments of cool and cold gas and dust up beneath them as has also been seen in other brightest cluster galaxies (Bohringer et al., 1995; Churazov et al., 2001; Reynolds et al., 2005; Fabian et al., 2003; Hatch et al., 2006). This is supported by a depression in the X-ray intensity and thermal pressure maps to the north-east of the nucleus, just beyond the optical and soft X-ray filaments (see their Fig. 5). A similar depression is seen in the south-west and low frequency (330 MHz) radio emission also extends towards both these structures. The kinematics of the filaments are consistent with this picture with smoothly varying line-of-sight velocities and low velocity dispersions which show little variation across the whole length of some filaments.
3.8 Emission line ratios
The emission line ratios in the optical nebulosity are important tracers of the excitation processes dominating their behaviour. Heckman et al. (1989) suggested there was a bimodal population of BCGs based on their [N II]/H ratios and H luminosity. However, using a much larger cluster sample Crawford et al. (1999) have shown that this is in fact a continuous spectrum with all objects sharing the characteristic low-ionisation emission line spectrum.
In a study by Wilman et al. (2006) of 4 high H luminosity BCGs all situated in cool core clusters and with the same LINER emission properties, the authors found no evidence for variations in line ratios as a function of either position or H luminosity across the galaxies. They interpret this as evidence for both a single ionisation source for the line emission across each galaxy and a single dominant excitation mechanism in all of their galaxies. Hatch et al. (2007) found, in a similar study of optical nebulosities surrounding 6 BCGs spanning a range of optical, X-ray and radio properties, that the ionisation state of the optical nebulosities were not uniform and so concluded the converse; that a single scenario cannot be responsible for the optical line emission in their sample. A recent study by Edwards et al. (2009) of a further 9 clusters, including in their sample both cool and non-cool core clusters, found diverse emission line ratios and morphologies. This supports the finding by Hatch et al. (2007) that there is no one clear consistent mechanism to explain the origin of the line emission or to separate BCGs in cool and non-cool core clusters. Despite this there are some clear similarities in that a relatively hard ionising source is needed and that the systems are always well described by a LINER-like emission line spectrum.
Hatch et al. (2006) studied in detail the spectral features in NGC 1275, a similar object in the centre of the Perseus cluster, and found radial variations in the [N ii]/H emission line ratio along the filaments with the inner regions having higher [N ii]/H ratios. This could be due to an extra energy source closer in causing more heating per hydrogen ionisation or due to metallicity variations in the filaments. Sarzi et al. (2006) also found variations in ratios of [O ii]/H along the length of the filaments in M87, the central galaxy in the Virgo cluster.
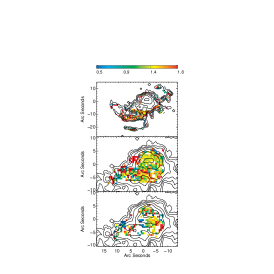
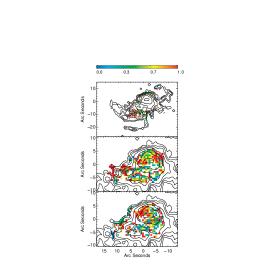
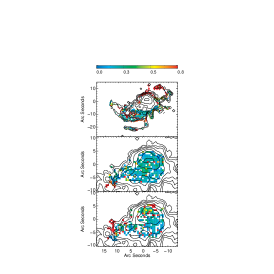
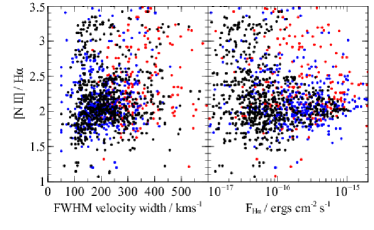
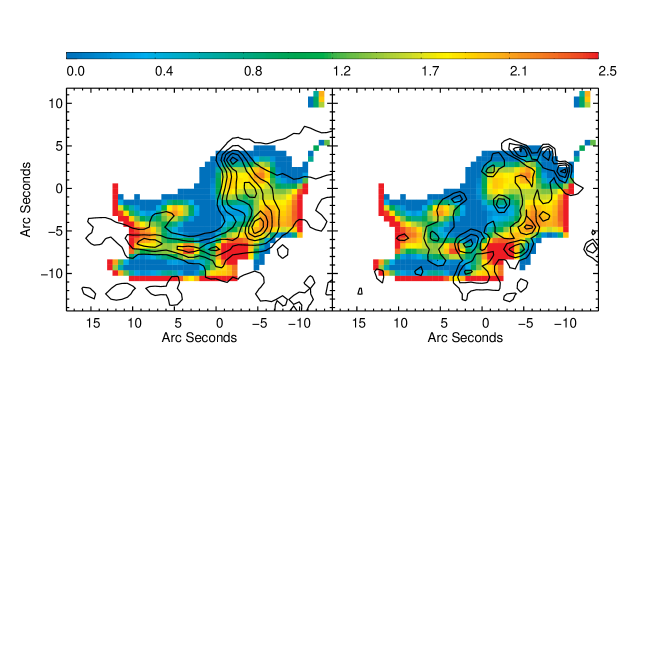
Maps of our emission line ratios, binned using the contour binning algorithm of Sanders (2006) are shown in Fig. 30. The top panel showing the single gaussian fits, the middle showing the broad central velocity component and the bottom panel in each case shows the narrow component. Only pixels where the line emission is detected at greater than 4 are shown. A ionisation plot (Baldwin et al., 1981) of the same pixels is shown in Fig. 19. Black points indicate the pixels where one emission line component was found sufficient to model the emission lines, red points correspond to the broad lines and blue to the narrow. The [O iii]]/H ratios cannot be traced across the whole length of the outer filaments as our HRB data only cover the central 27 arcseconds, as such we cannot plot the most extended parts of the outer filaments on Fig. 19.
The scatter in Fig. 19 is large, however NGC 4696 clearly exhibits LINER-like emission in both the central and extended regions. The broad inner component has in general a higher [N II]/H ratio than the narrow or outer regions, which are virtually indistinguishable from each other. If the broad component is from more centrally located emission this is consistent with the observation of Hatch et al. (2006) in NGC 1275 that [N ii]/H ratios are in general higher towards the centre of the galaxy. If the filaments are shock excited, we should see a gradient in emission line ratios with velocity dispersion of the gas. Fig. 20 shows this ratio for the same three regions as in Fig. 19. No correlation is seen in [N ii]/H ratio with velocity width with most outer filaments (black points) having FWHM velocity widths of 100-200 but ratios which vary from 1.8-3.3. We now examine the variation in emission line ratios across the outer filaments in more detail by binning the emission in 3” by 3” regions across the field-of-view (see Fig. 21).
3.9 Outer filaments

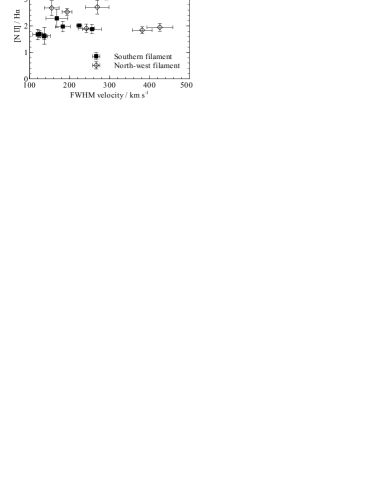
The north-west and southern filaments show a difference in the [N II]6583/H6563 emission ratios across their projected length with the southern filament decreasing and the north-western filament increasing in [N II]6583/H ratio (Fig. 21and Fig. 22). The innermost regions of both filaments have a ratio 2, the average ratio of the galaxy. This difference in variation is in contrast to that seen in the filaments of NGC 1275 by Hatch et al. (2006) where there is a clear radial trend in [N II]6583/H intensity ratio seen in all long slits, with the ratio decreasing with projected distance from the nucleus.
A higher [N II]6583/H intensity ratio indicates that there is more heating occurring in the gas per hydrogen ionisation. The difference in emission line ratios in these two filaments could be due to the proximity of the filaments to the expanding radio bubble. The arm of the north-western filament appears to encircle the radio bubble while the southern filament appears spatially less connected with the current radio emission.
The [N II]6583/H intensity ratio is also sensitive to variations in the metallicity of the gas. X-ray observations of the Centaurus cluster (Sanders et al., 2008) have shown there is a high abundance of nitrogen emission in the central regions. Oxygen is an efficient coolent and high oxygen abundances in the gas would act to decrease the gas temperature and so reduce the observed [N II]6583/H ratio, however the nitrogen/oxygen ratio in the hot gas is also high. The bottom panel of Fig. 22 shows the trend in [N II]6583/[O I]6300 emission line ratios in these same filaments. There is weak evidence for a decreasing trend in [N II]6583/[O I]6300 ratio in these filaments.
The variation of [N II]6583/H emission line ratio with FWHM velocity width of the gas, in these two outer filaments, is shown in Fig. 23. There is no correlation between the measured ratios and the width of the lines in either of the southern or north-western filaments. The majority of the emission has velocity widths less than 250 and a emission line ratio of 1.8-2.5. The two very broad regions in the north-west filament correspond to bright knots of emission which could be formed by the intersection of two or more individual filaments which cannot be resolved in our data.
4 Conclusions
The origin and excitation of the complex extended emission line nebula in BCGs and more specifically in NGC 4696 has been a matter of some controversy. Fig. 4 shows the close correspondence between the dust absorption and the [N ii] emission tracing the 104 K emission-line nebula in NGC 4696. Virtually all extended filaments are spatially coincident with dust emission. Sparks et al. (1989) do not find any deviations in the dust extinction behaviour with wavelength with respect to dust within our Galaxy, similar results have been found in other BCGs. The authors suggest that this favours a merger origin for the emission line filaments over the formation of the filament system straight from the hot gas.
There is however, a third possibility; that the gas originated due to dusty star formation in AGB atmospheres in the brightest cluster galaxy and has been drawn out, rather than falling in, by buoyantly rising radio bubbles inflated by the AGN (Crawford et al., 2005). This scenario is supported by Chandra X-ray observations that reveal pressure minima towards the north-east at the end of the soft X-ray filaments and another minima towards the south-west. These minima coincide with the outer edge of the 330 MHz radio emission and appear to be surrounded by regions of higher metallicity X-ray gas (Fabian et al., 2005).
Our deep optical IFU data allow us to explore in detail the morphology, kinematics and ionisation properties of the optical nebulosity surrounding NGC 4696. Our observations show:
-
1.
there are at least two velocity components to the emission line gas in the inner regions of the galaxy. We interpret these as ‘broader’ and ‘narrower’ velocity width components,
-
2.
these components have a different morphology, with the narrow component having a less smooth morphology and a striking bar of bright emission while the broad component exhibits two peaks in emission, one peak coincident with the radio core and the other 4 arcsec to the west (see Fig. 9),
-
3.
the peak in [O iii] emission is spatially coincident with the nucleus and is offset from the brightest peak in [N ii] emission (see Fig. 10),
-
4.
the kinematics and emission line spectra of the extended filaments are similar to filaments surrounding other BCGs,
-
5.
we do not find any evidence to suggest there is a correlation between the velocity width and [N ii]/H ratio in the filaments of NGC 4696,
-
6.
there is very little [O iii] emission in the outer filaments as observed in similar systems.
The central 12 arcseconds radius in NGC 4696 contains at least two components to the emission line gas, we interpret these as a broad velocity component and a second narrower component. The reddening and kinematical properties of this second component lead us to suggest it is a filament with properties much like the other extended filaments, that is located behind the main galaxy and thus more obscured by the intervening dust lanes. The morphology of the central region was previously thought to be a simple one-sided spiral structure perhaps caused by the tail of an infalling galaxy (Sparks et al., 1989; Farage et al., 2010) however the filament system is clearly complex and it is not immediately obvious how a merger could account for the diversity in morphology of the filaments.
We find smoothly varying line-of-sight velocities in the outer filaments and low velocity widths (FWHM 50-250 ), with little variation along the length of many filaments, similar to those found in NGC 1275, the brightest cluster galaxy in the Perseus cluster (Hatch et al., 2006). This is consistent with an origin for the filamentary system being slowly drawn up under the rising radio bubbles.
The spectrum of NGC 4696 exhibits the same strong low ionisation emission lines seen in many other extended emission line systems surrounding BCGs. These systems are not all consistent with a merger origin. Johnstone et al. (2007) detected strong [Ne iii]15.56m emission in their Spitzer IRS SH spectroscopy of NGC 4696 and NGC 1275. Optical [Ne iii] line emission has also been seen in both NGC 1275 (Hatch et al., 2006) and weakly in NGC 4696 (Farage et al., 2010). However, [O iii] emission tends to be low in the extended emission line systems in BCGs (e.g. Donahue et al. 2000). Johnstone et al. (2007) have shown that stellar photoionisation models struggle to account for the high [Ne iii] and low [O iii] emission unless coupled with high metallicities. X-ray metallicities of typically solar for oxygen and neon (Sanders & Fabian, 2006) are found in the centre of the Centaurus cluster and there is little sign of young stellar populations in the filaments.
The [O iii]5007/H emission in NGC 4696 drops dramatically from the nucleus to 12 arcsec, indicating the [O iii] emission is low in the filaments and the majority of emission in the inner regions is associated with the nucleus. A similar trend is seen in many other BCGs (e.g. Johnstone & Fabian 1988). Our HRB data does not extend to beyond the inner filament so we cannot measure the [O iii] emission in the farthest filaments from the nucleus. The ratio of our detected [O iii] lines is small compared to shock models and the upper limit of the weak [O iii]4364 line indicates a [O iii]4364/H ratio of 5 per cent; lower than the predicted value from the best velocity shock model of Farage et al. (2010).
Ferland et al. (2008, 2009) have shown that the characteristic LINER spectrum with anomalously low [O iii] and high [Ne ii] and [Ne iii] emission, compared to photoionisation models, can be reproduced with their particle heating model. With the exception of [N ii]6583, which is under predicted, all our optical emission lines detected in the outer filaments in NCG 4696 are within a factor of 2 or less of their predicted spectrum. The predicted spectrum of Ferland et al. (2009), uses a gas-phase abundance of nitrogen relative to hydrogen of 6.9 which corresponds to 0.5Z⊙ using abundances from Anders & Grevesse (1989). Sanders et al. (2008) find the nitrogen abundance in Centaurus to be 4 times solar in the central regions, a factor of 8 times that used in the predicted particle heating spectrum. The predicted emission line ratios do not in general behave linearly with changes in metallicity of the gas due to the thermostat effect, where increasing the abundance of a coolant lowers the kinetic temperature to conserve energy (Osterbrock & Ferland, 2006). However, the emissivities of [N ii] and H are predicted to be relatively constant over a broad range of temperatures ( K) within the thermally stable regime (see Fig. 17 of Ferland et al. 2009) so an increase in the nitrogen abundance by 8 would produce an increase in the [N ii]/H ratio. Note though that this is not necessarily the case for the [N i] emission which does not exhibit such a flat emissivity profile. Future papers will explore the effect of varying metallicity on the particle heating model ratios.
5 Acknowledgements
REAC acknowledges STFC for financial support. ACF thanks the Royal Society. REAC would also like to thank Ryan Cooke, Bob Carswell and Paul Hewett for interesting and enlightening discussions.
This research has made use of the NASA/IPAC Extragalactic Database (NED) which is operated by the Jet Propulsion Laboratory, California Institute of Technology, under contract with the National Aeronautics and Space Administration.
References
- Amico et al. (2008) Amico P., Bagnulo S., Dumas C., Izzo C., Marconi G., Melo C., 2008, in A. Kaufer & F. Kerber , ed, The 2007 ESO Instrument Calibration Workshop. Proceedings of the ESO Workshop held in Garching, Germany, 23-26 January 2007. ISBN: 978-3-540-76962-0, p.279-288, p. 279
- Anders & Grevesse (1989) Anders E., Grevesse N., 1989, Geochim. Cosmochim. Acta, 53, 197
- Baldwin et al. (1981) Baldwin J. A., Phillips M. M., Terlevich R., 1981, PASP, 93, 5
- Bohringer et al. (1995) Bohringer H., Nulsen P. E. J., Braun R., Fabian A. C., 1995, MNRAS, 274, L67
- Bruzual & Charlot (2003) Bruzual G., Charlot S., 2003, MNRAS, 344, 1000
- Calzetti et al. (2000) Calzetti D., Armus L., Bohlin R. C., Kinney A. L., Koornneef J., Storchi-Bergmann T., 2000, ApJ, 533, 682
- Canning et al. (2011) Canning R. E. A., Fabian A. C., Johnstone R. M., Sanders J. S., Crawford C. S., Hatch N. A., Ferland G. J., 2011, MNRAS, 411, 411
- Cappellari & Copin (2003) Cappellari M., Copin Y., 2003, MNRAS, 342, 345
- Churazov et al. (2001) Churazov E., Brüggen M., Kaiser C. R., Böhringer H., Forman W., 2001, ApJ, 554, 261
- Cid Fernandes et al. (2005) Cid Fernandes R., Mateus A., Sodré L., Stasińska G., Gomes J. M., 2005, MNRAS, 358, 363
- Cid Fernandes et al. (2009) Cid Fernandes R. et al., 2009, in Revista Mexicana de Astronomia y Astrofisica Conference Series, Vol. 35, Revista Mexicana de Astronomia y Astrofisica Conference Series, p. 127
- Cowie et al. (1980) Cowie L. L., Fabian A. C., Nulsen P. E. J., 1980, MNRAS, 191, 399
- Crawford et al. (1999) Crawford C. S., Allen S. W., Ebeling H., Edge A. C., Fabian A. C., 1999, MNRAS, 306, 857
- Crawford & Fabian (1992) Crawford C. S., Fabian A. C., 1992, MNRAS, 259, 265
- Crawford et al. (2005) Crawford C. S., Hatch N. A., Fabian A. C., Sanders J. S., 2005, MNRAS, 363, 216
- Donahue et al. (2000) Donahue M., Mack J., Voit G. M., Sparks W., Elston R., Maloney P. R., 2000, ApJ, 545, 670
- Donahue et al. (1992) Donahue M., Stocke J. T., Gioia I. M., 1992, ApJ, 385, 49
- Edge (2001) Edge A. C., 2001, MNRAS, 328, 762
- Edge et al. (2002) Edge A. C., Wilman R. J., Johnstone R. M., Crawford C. S., Fabian A. C., Allen S. W., 2002, MNRAS, 337, 49
- Edwards et al. (2009) Edwards L. O. V., Robert C., Mollá M., McGee S. L., 2009, MNRAS, 396, 1953
- Fabian et al. (2008) Fabian A. C., Johnstone R. M., Sanders J. S., Conselice C. J., Crawford C. S., Gallagher J. S., III, Zweibel E., 2008, Nat, 454, 968
- Fabian et al. (1984) Fabian A. C., Nulsen P. E. J., Canizares C. R., 1984, Nat, 310, 733
- Fabian et al. (2003) Fabian A. C., Sanders J. S., Crawford C. S., Conselice C. J., Gallagher J. S., Wyse R. F. G., 2003, MNRAS, 344, L48
- Fabian et al. (2005) Fabian A. C., Sanders J. S., Taylor G. B., Allen S. W., 2005, MNRAS, 360, L20
- Farage et al. (2010) Farage C. L., McGregor P. J., Dopita M. A., Bicknell G. V., 2010, ApJ, 724, 267
- Ferland et al. (2008) Ferland G. J., Fabian A. C., Hatch N. A., Johnstone R. M., Porter R. L., van Hoof P. A. M., Williams R. J. R., 2008, MNRAS, 386, L72
- Ferland et al. (2009) Ferland G. J., Fabian A. C., Hatch N. A., Johnstone R. M., Porter R. L., van Hoof P. A. M., Williams R. J. R., 2009, MNRAS, 392, 1475
- Ferland et al. (1998) Ferland G. J., Korista K. T., Verner D. A., Ferguson J. W., Kingdon J. B., Verner E. M., 1998, PASP, 110, 761
- Hatch et al. (2007) Hatch N. A., Crawford C. S., Fabian A. C., 2007, MNRAS, 380, 33
- Hatch et al. (2006) Hatch N. A., Crawford C. S., Johnstone R. M., Fabian A. C., 2006, MNRAS, 367, 433
- Heckman et al. (1989) Heckman T. M., Baum S. A., van Breugel W. J. M., McCarthy P., 1989, ApJ, 338, 48
- Hu et al. (1985) Hu E. M., Cowie L. L., Wang Z., 1985, ApJS, 59, 447
- Jaffe et al. (2001) Jaffe W., Bremer M. N., van der Werf P. P., 2001, MNRAS, 324, 443
- Johnstone & Fabian (1988) Johnstone R. M., Fabian A. C., 1988, MNRAS, 233, 581
- Johnstone et al. (1987) Johnstone R. M., Fabian A. C., Nulsen P. E. J., 1987, MNRAS, 224, 75
- Johnstone et al. (2007) Johnstone R. M., Hatch N. A., Ferland G. J., Fabian A. C., Crawford C. S., Wilman R. J., 2007, MNRAS, 382, 1246
- Jorgensen et al. (1983) Jorgensen H. E., Norgaard-Nielsen H. U., Pedersen H., Rasmussen I. L., Schnopper H., 1983, A&A, 122, 301
- Kent & Sargent (1979) Kent S. M., Sargent W. L. W., 1979, ApJ, 230, 667
- Kewley et al. (2006) Kewley L. J., Groves B., Kauffmann G., Heckman T., 2006, MNRAS, 372, 961
- LeFevre et al. (2003) LeFevre O. et al., 2003, in Society of Photo-Optical Instrumentation Engineers (SPIE) Conference Series, Vol. 4841, M. Iye & A. F. M. Moorwood , ed, Society of Photo-Optical Instrumentation Engineers (SPIE) Conference Series, p. 1670
- Markwardt (2009) Markwardt C. B., 2009, in Astronomical Society of the Pacific Conference Series, Vol. 411, D. A. Bohlender, D. Durand, & P. Dowler , ed, Astronomical Society of the Pacific Conference Series, p. 251
- McNamara & Nulsen (2007) McNamara B. R., Nulsen P. E. J., 2007, ARA&A, 45, 117
- McNamara et al. (1996) McNamara B. R., O’Connell R. W., Sarazin C. L., 1996, AJ, 112, 91
- Moré (1978) Moré J. J., 1978, The Levenberg-Marquardt algorithm: Implementation and theory. Springer Berlin / Heidelberg
- Osterbrock & Ferland (2006) Osterbrock D. E., Ferland G. J., 2006, Astrophysics of gaseous nebulae and active galactic nuclei. University Science Books
- Peterson & Fabian (2006) Peterson J. R., Fabian A. C., 2006, Phys. Rep., 427, 1
- Postman & Lauer (1995) Postman M., Lauer T. R., 1995, ApJ, 440, 28
- Reynolds et al. (2005) Reynolds C. S., McKernan B., Fabian A. C., Stone J. M., Vernaleo J. C., 2005, MNRAS, 357, 242
- Sabra et al. (2000) Sabra B. M., Shields J. C., Filippenko A. V., 2000, ApJ, 545, 157
- Salomé & Combes (2003) Salomé P., Combes F., 2003, A&A, 412, 657
- Sanders (2006) Sanders J. S., 2006, MNRAS, 371, 829
- Sanders & Fabian (2002) Sanders J. S., Fabian A. C., 2002, MNRAS, 331, 273
- Sanders & Fabian (2006) Sanders J. S., Fabian A. C., 2006, MNRAS, 371, 1483
- Sanders et al. (2008) Sanders J. S., Fabian A. C., Allen S. W., Morris R. G., Graham J., Johnstone R. M., 2008, MNRAS, 385, 1186
- Sarzi et al. (2006) Sarzi M. et al., 2006, MNRAS, 366, 1151
- Scodeggio et al. (2005) Scodeggio M. et al., 2005, PASP, 117, 1284
- Sparks et al. (1989) Sparks W. B., Macchetto F., Golombek D., 1989, ApJ, 345, 153
- Taylor et al. (2002) Taylor G. B., Fabian A. C., Allen S. W., 2002, MNRAS, 334, 769
- Terlevich & Melnick (1985) Terlevich R., Melnick J., 1985, MNRAS, 213, 841
- Veilleux & Osterbrock (1987) Veilleux S., Osterbrock D. E., 1987, ApJS, 63, 295
- Voit & Donahue (1997) Voit G. M., Donahue M., 1997, ApJ, 486, 242
- Wilman et al. (2006) Wilman R. J., Edge A. C., Swinbank A. M., 2006, MNRAS, 371, 93
- Zanichelli et al. (2005) Zanichelli A. et al., 2005, PASP, 117, 1271
Appendix A Data reduction plots
A.1 Sky absorption and emission corrections
The VIMOS IFU does not have dedicated sky fibres and unlike slit spectroscopy an individual spectrum on a fibre does not have both regions with pure sky emission and regions with object and sky emission. Different fibre spectra are described by different profile shape parameters such as the FWHM and skewness. In the wavelength direction this results in the the spectral lines having different shapes and thus affects the quality of the sky subtraction. An average sky spectrum formed by combining spectra with different line profiles can result in the presence of s-shape residuals when subtracted from the data. VIPGI sky subtraction attempts to correct for these line profiles by grouping the spectra according to a user defined sky line. An average sky for each spectrum grouping is then calculated and subtracted. The groupings are done on a statistical basis thus this sky subtraction method employed by VIPGI is optimised for deep survey observations where the field is devoid of extended objects. It is not ideal for observing large galaxies which dominate the field of view. For this reason we performed the sky subtraction using specific fibres shown to be lacking in emission lines associated with NGC 4696.
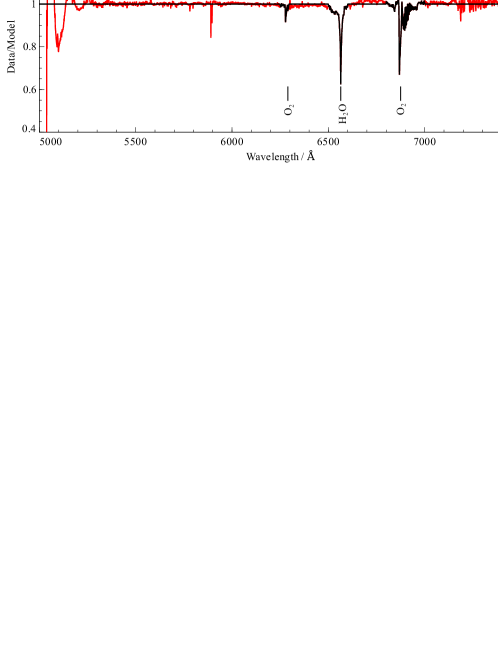
Telluric absorption feature corrections for the and absorption in the band was determined from 4 observations of standard stars. Standard stars were observed at the beginning and the end of the night. The stars chosen are CD-32-9927, LTT-7379, Hiltner-600 and LTT-2415. The standard spectra were reduced using VIPGI, as with the science observations. These spectra were divided by the ESO spectra of the respective standards, corrected for atmospheric absorption. These observations were then averaged for each VIMOS IFU quadrant and the area around the absorption lines were isolated. Fig. 24 shows the quadrant one spectra of each of the four standard stars and the averaged normalised spectrum.
Ignoring the curvature of the Earth we recover the object spectrum as seen without the atmospheric absorption (),
| (3) |
for each 15 minute exposure separately so as to correct for airmass differences between the standard star () and the object ().
A.2 Propagation of uncertainties
Our HRO and HRB spectra overlap between . In order to incorporate all our data we split the cubes into three wavelength regions. The regions chosen are , and . The two HR grisms used have a slightly different spectral resolution (see Table 1) with the HRO being marginally larger than that of the HRB grism. In order to amalgamate both data sets it is necessary to re-bin the HRO spectra. If we are re-binning original bins into bins where some fraction of falls into the th bin we determine the flux and error in the th bin by,
| (4) |
where is the flux in original bin and is the variance in bin . For pixel to pixel fluctuations the error is given by . The HRO and HRB spectra are then summed and the total flux in the re-binned grid is given by (Bob Carswell, private communication222ftp://ftp.ast.cam.ac.uk/pub/rfc/vpfit9.5.pdf),
| (5) |
where is the number of spectra summed together. The estimate of the fluctuations in the spectra are then given by,
| (6) |
this forms the error spectrum used when fitting gaussian models to the emission lines and minimising the resulting .
A.3 Spatial binning
To improve the signal to noise in the spectra we investigate the use of two spatial binning algorithms; that of Sanders (2006), which bins the data based on surface brightness and that of Cappellari & Copin (2003) which uses Voronoi tessellations to provide the most ‘round’ bins. The two techniques applied to our NGC 4696 data are shown in Fig. 25.
Both techniques give similar fits over comparable regions giving us confidence that the physical properties of the regions we are binning are similar to the limit of our spatial resolution (see Fig. 26). Due to the filamentary structure of the optical line nebulosity surrounding NGC 4696 we choose to bin our spectra using the contour binning technique of Sanders (2006).
A.4 Velocity component fitting
The data are fit with multiple velocity components. An example single velocity component fit to the H, [N ii] and [S ii] emission lines are shown in Fig. 28. An F-test is then performed to determine whether extra velocity components are required.
The lower panels in Fig. 27 show the results of the F-test when the data is binned by surface brightness contour binning, Voronoi tessellations and no-binning. The darker shade implies two velocity components are necessary, the light shade indicates the spectra were sufficiently well represented with a single gaussian velocity component.
Appendix B Emission line maps
The reddening map for a one component velocity fit, on a per pixel basis, in the central regions of NGC 4696 is shown in Fig. 29. Contours of E(B-V) derived from HST B and I band images and Chandra X-ray NH column density (Crawford et al., 2005) are overlaid.
Maps of our emission line ratios, binned using the contour binning algorithm of Sanders (2006) are shown in Fig. 30. The top panel showing the single gaussian fits, the middle showing the broad central velocity component and the bottom panel in each case shows the narrow component. Only pixels where the line emission is detected at greater than 4 are shown. The [O iii]]/H ratios cannot be traced across the whole length of the outer filaments as our HRB data only cover the central 27 arcseconds.