Resolving the nuclear dust distribution of the Seyfert 2 galaxy NGC 3081
Abstract
We report far-infrared (FIR) imaging of the Seyfert 2 galaxy NGC 3081 in the range 70-500 µm, obtained with an unprecedented angular resolution, using the Herschel Space Observatory instruments PACS and SPIRE. The 11 kpc (70″) diameter star-forming ring of the galaxy appears resolved up to 250 µm. We extracted infrared (1.6-500 µm) nuclear fluxes, that is active nucleus-dominated fluxes, and fitted them with clumpy torus models, which successfully reproduce the FIR emission with small torus sizes. Adding the FIR data to the near- and mid-infrared spectral energy distribution (SED) results in a torus radial extent of Ro=4 pc, as well as in a flat radial distribution of the clouds (i.e. the parameter). At wavelengths beyond 200 µm, cold dust emission at T=281 K from the circumnuclear star-forming ring of 2.3 kpc (15″) in diameter starts making a contribution to the nuclear emission. The dust in the outer parts of the galaxy is heated by the interstellar radiation field (193 K).
keywords:
galaxies: active – galaxies: nuclei – galaxies: imaging – galaxies: individual (NGC 3081).1 Introduction
The infrared (IR) SED of active galactic nuclei (AGN)
serves as a sensitive probe of both the dust and the sources that are heating it.
Dust grains absorb optical and ultraviolet photons from the AGN and from stars and re-radiate them
in the infrared (IR) range.
The IRAS and ISO satellites revealed that Seyfert galaxies are strong FIR and mid-infrared (MIR)
emitters (Rodríguez Espinosa et al., 1987; Spinoglio et al., 1995) and that this emission is thermal,
and a combination of a warm, a cold, and a very cold dust components (Radovich et al., 1999; Pérez García & Rodríguez Espinosa, 2001). The warm component is
produced by dust heated by either the AGN or circumnuclear starbursts (dust at 120-170 K), the cold dust is heated by stars
in the galaxy disk (30-70 K), and the very cold dust is heated by the general interstellar radiation field (15-25 K).
With the advent of the Herschel Space Observatory111Herschel is an ESA space observatory with science instruments provided by
European-led Principal Investigator consortia and with important participation from NASA. (Pilbratt et al., 2010)
it is now possible to map the FIR emission of nearby Seyferts at higher angular resolutions than those previously
achieved with the Spitzer Space Telescope between 70 and 160 µm. This, together with the
unprecedented sensitivities that Herschel offers up to 500 µm allow to probe their dust distributions
at different temperatures.
In this letter we present new Herschel imaging data of the galaxy NGC 3081,
which is part of a guaranteed program of FIR imaging observations of Seyfert galaxies. The main goal is
to characterise their IR SEDs, by
determining the fractional contributions of the warm, cold, and very cold dust components.
The galaxy NGC 3081 harbours a Seyfert 2 nucleus, although Moran et al. (2000) reported a spectacular Type-1 optical spectrum
in polarised light. The galaxy is at a distance of 32.5 Mpc (Buta & Purcell, 1998), which corresponds to
a spatial scale of 158 pc arcsec-1.
This early-type barred spiral is forming stars in a series of nested ringlike features:
a nuclear 2.3 kpc diameter
ring (hereafter r1), an inner ring of 11 kpc (r2), an outer ring of 26.9 kpc, and a pseudoring of 33.1 kpc diameter (Buta & Purcell, 1998; Buta et al., 2004; Byrd et al., 2006).
2 Observations
FIR maps of NGC 3081 were obtained with the PACS and SPIRE instruments of the Herschel Space Observatory. The data are part of the guaranteed time proposal “Herschel imaging photometry of nearby Seyfert galaxies: testing the coexistence of AGN and starburst activity and the nature of the dusty torus” (PI: M. Sánchez-Portal).
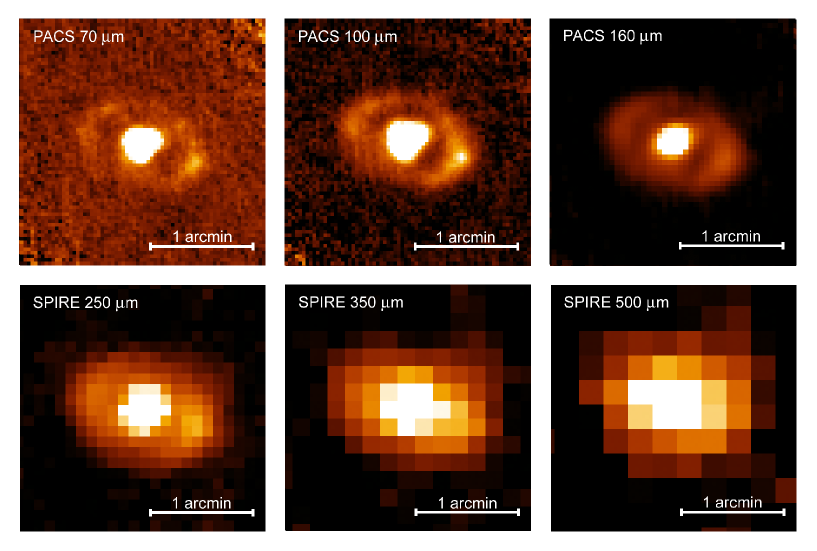
The PACS observations were carried out using the “mini-map” mode, consisting of two concatenated 3′ scan line maps, at 70∘ and 110∘ (in array coordinates). This results in a map with a highly homogeneous exposure within the central 1′ area. The PACS beams at 70, 100, and 160 µm are 5.6″, 6.8″, and 11.3″ full-width half maximum (FWHM) respectively. With the SPIRE photometer, the three available bands were observed simultaneously using the “small map” mode, whose area for scientific use is around 5′5′. The FWHM beam sizes at 250, 350, and 500 µm are 18.1″, 25.2″, and 36.9″ respectively.
We carried out the data reduction with the Herschel Interactive Processing Environment (HIPE) v6.0.1951. For the PACS instrument, we deemed the extended source version of the standard PhotProject reduction script as adequate, given the small angular size of the galaxy. We used the FM v5 photometer response calibration files (Müller et al., 2011). For SPIRE, we applied the standard small map script with the ‘naïve’ scan mapper task, using the calibration database v6.1. Colour corrections (for PACS, see Poglitsch et al. 2010; please refer to the SPIRE OM 2011 for the SPIRE ones) are small for blackbodies at the expected temperatures (e.g. Pérez García & Rodríguez Espinosa 2001) and have been neglected. More details on the observations and data processing are given in Sánchez-Portal et al. (in preparation).
The FIR maps of NGC 3081 are shown in Figure 1. The star-forming ring r2 is clearly resolved in the three PACS images, as well as in the 250 µm SPIRE map. There is a brighter region in the western side of the ring detected at 70, 100, 160, and 250 µm that does not have optical/near-infrared (NIR) counterpart in the HST images (Buta & Purcell, 1998; Buta et al., 2004; Byrd et al., 2006).
To study the IR nuclear emission of NGC 3081, we obtained and compiled unresolved fluxes, i.e. either the emission of a point spread function (PSF) component fitted to the data, or the emission contained in an aperture diameter equals to the FWHM of the PSF in each band. In the case of the FIR, we used GALFIT 2D fitting (Peng et al., 2002) to obtain the unresolved fluxes. For the PACS images we fitted a PSF component, which we identified with the nuclear flux, a Sersic profile of R, and a fainter and larger Sersic component of R, where Re is the half-light radius given by GALFIT. For the SPIRE data we only fitted a PSF component and a Sersic profile of R. We also tried this simpler PSF + Sersic fit with the PACS images, but the three-component model results in smaller residuals and values of the reduced (0.002 for PACS and 0.02 for SPIRE). All the fitted Sersic components have indices between 0.4 and 0.8 (i.e. disk-like) and do not reproduce the r2 ring, which is a residual of the fits. The PSF input functions are the empirical ones from PACS and SPIRE (Lutz, 2010; Sibthorpe et al., 2011).
In addition, we compiled the highest angular resolution NIR and MIR data from the literature to construct the nuclear SED. Subarcsecond resolution MIR images of NGC 3081 (0.30″ at 8.74 µm and 0.56″ at 18.3 µm) were obtained using the camera/spectrograph T-ReCS on the Gemini-South Telescope. The unresolved T-ReCS fluxes from Ramos Almeida et al. (2009) are reported in Table 1, together with an additional nuclear flux at 13.04 µm from VISIR on the VLT with similar resolution as the T-ReCS data (Gandhi et al., 2009). In the NIR, we use the nuclear flux obtained from the NICMOS 1.6 µm image reported in Quillen et al. (2001).
In Table 1 we report the unresolved NIR, MIR, and FIR fluxes, their uncertainties, and the angular resolution at each wavelength. The FIR errors are the result of adding quadratically the photometric accuracies (5% for PACS at 70 and 100 µm and 10% at 160 µm; Müller et al. 2010 and 7% for SPIRE; SPIRE OM 2011) and the PSF flux determination uncertainties. The latter are the dominant source of error and account for the variations in the PSF fluxes associated to the GALFIT fitting in each band.
| Instrument | PSF FWHM | Flux | Uncertainty | ||
|---|---|---|---|---|---|
| (µm) | (arcsec) | (kpc) | (mJy) | (%) | |
| NICMOS | 1.6 | 0.20 | 0.032 | 0.22 | 6 |
| T-ReCS | 8.74 | 0.30 | 0.047 | 83 | 15 |
| VISIR | 13.0 | 0.35 | 0.055 | 138 | 10 |
| T-ReCS | 18.3 | 0.56 | 0.083 | 231 | 25 |
| PACS | 70 | 5.6 | 0.83 | 758 | 30 |
| PACS | 100 | 6.8 | 1.01 | 575 | 30 |
| PACS | 160 | 11.3 | 1.7 | 60 | 30 |
| SPIRE | 250 | 18.1 | 2.7 | 488 | 50 |
| SPIRE | 350 | 25.2 | 3.7 | 86 | 50 |
| SPIRE | 500 | 36.9 | 5.4 | 19 | 60 |
3 Nuclear SED modelling
In a recent series of papers (Ramos Almeida et al. 2009; 2011; Alonso-Herrero et al. 2011) we fitted the nuclear NIR and MIR emission of Seyfert galaxies with the clumpy torus models of Nenkova et al. (2008) and were able to nicely constrain the torus parameters, including the torus radial extent, , where Ro and Rd are the outer and inner radius of the toroidal distribution of clumps respectively. The inner radius is defined by the dust sublimation temperature (T K). However, it is not clear if the lack of FIR high angular resolution data, which probes cooler dust, might bias the fits to smaller torus sizes. In the context of the Nenkova models, clouds are heated by the AGN radiation (directly illuminated) and by other clouds (indirectly illuminated) and each clump contains a range of temperatures itself. The temperature of the dust within the torus scales with the square root of the distance to the sublimation radius. Thus, a distribution of clumps with will include dust at temperatures ranging from to 150 K for the directly illuminated clouds, and down to a few Kelvin for the shadowed and more distant ones. To test how the addition of FIR data affects the fits described above, here we use Herschel PACS and SPIRE nuclear fluxes combined with NIR and MIR data of the galaxy NGC 3081 and fitted them with clumpy torus models. In general, clumpy torus models appear to reproduce better the IR emission of nearby AGN than smooth torus models (e.g. Alonso-Herrero et al. 2003; Mullaney et al. 2011) although there is not a general consensus on the dust distribution yet. Indeed, in forthcoming publications based on guaranteed time Herschel observations of AGN we plan to use the smooth torus models described in Fritz et al. (2006) and Hatziminaoglou et al. (2008) to compare with the results obtained with clumpy torus models.
We constructed the nuclear 1.6-500 µm SED of NGC 3081 (see Figure 2) using the nuclear fluxes reported in Table 1. The unresolved NIR and MIR components correspond to a physical region of 85 pc in diameter and thus, are likely be dominated by emission from the AGN dusty torus. The nuclear FIR fluxes of NGC 3081, on the other hand, come from regions with sizes of 1 kpc in the case of PACS and between 2.7 and 5.4 kpc for SPIRE. These regions are much larger than the physical scales responsible for the NIR and MIR unresolved emission. Indeed, the SPIRE nuclear fluxes include emission from the inner ring of 2.3 kpc diameter (r1), and consequently, we consider them as upper limits in the fit (see Figure 2). The PACS fluxes exclude r1, but may include other sources of nuclear emission apart from the torus. This contamination might affect the SED shape and consequently, the resulting torus parameters. However, here we work under the assumption that the torus is the dominant source of unresolved emission up to 160 µm. Although Deo et al. (2009) showed that, in general, the AGN continuum of Seyfert 2 galaxies drops rapidly beyond 20 µm, NGC 3081 is one of the galaxies in their sample with the smallest starburst to AGN ratios at 30 µm. Indeed, the Spitzer IRS flux measurement that they reported for this galaxy, 1.09 Jy, nicely matches our fitted torus models (see below).
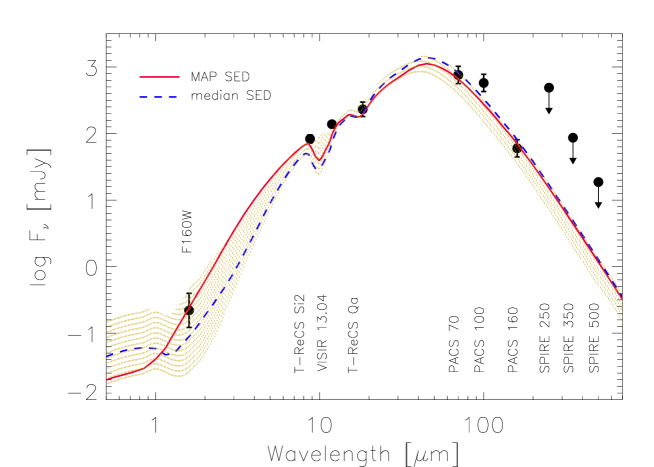
The clumpy dusty torus models of Nenkova et al. (2008) are characterised by six parameters, which are described in Table 2. Here we use an interpolated version of the Nenkova models to fit the IR nuclear fluxes reported in Table 1 (considering the SPIRE fluxes as upper limits) using our Bayesian inference tool BayesClumpy (Asensio Ramos & Ramos Almeida, 2009) and the uniform priors described in Table 2. The result of the SED fitting are the posterior distributions of the model parameters (Figure 3), but we can translate these results into a single SED. In Figure 2 we plot the model that better fits the IR data, i.e. the maximum-a-posteriori (MAP) model, and the model described by the medians of the six posteriors resulting from the fit (see Table 2). The nuclear NIR, MIR, and FIR emission of NGC 3081, at least up to 160 µm, is successfully reproduced by a relatively broad clumpy torus (=57°) with an average number of clouds N0=5 along the radial equatorial direction, and with a close to edge-on inclination =71°.


| Parameter | Abbreviation | Interval | Fitting results | |
|---|---|---|---|---|
| Median | Mode | |||
| Width of the angular distribution of clouds | [15°, 75°] | 48° | 57° | |
| Radial extent of the torus () | [5, 100] | 76 | 84 | |
| Number of clouds along the radial equatorial direction | [1, 15] | 8 | 5 | |
| Power-law index of the radial density profile | [0, 3] | 0.4 | 0.2 | |
| Inclination angle of the torus | [0°, 90°] | 54° | 71° | |
| Optical depth per single cloud | [5, 150] | 59 | 72 | |
| AV produced by the torus along the line-of-sight (LOS) | … | 214 mag | 162 mag | |
In Ramos Almeida et al. (2011; hereafter Ramos11 RA11) we fitted the NIR/MIR nuclear SED
of NGC 3081 using the same models as here and obtained , N0, and values which agree with
those reported here. On the other hand, the torus radial extent, , and the index of the clouds radial
distribution, , change significantly when adding the FIR data.
The sensitivity of the SED to for small values of is highly reduced. This is because for
small tori the SED shape does not change noticeably either when the clumps are distributed along the whole extent of the torus (=0)
or highly concentrated in its inner part (=2-3).
Here we obtain =0.2, which is characteristic of a flat cloud distribution, and a torus radial extent
=84, whereas in Ramos11 RA11 the resulting values for NGC 3081 were =2.3 and =22.
However, while in Ramos11 RA11 we impossed =[5, 30] as a prior,
in this work we use =[5, 100] to take into account cold dust within larger scales. We did the test
of fitting only the NIR and MIR data using the same priors shown in Table 2 and obtained
=35, with the other parameters resulting in similar values as those reported in Ramos11 RA11. We also
performed the fit by considering both the PACS and SPIRE fluxes as upper limits, and the results are
practically the same as those from the NIR/MIR fit.
Summarising, including the FIR data in the fit of NGC 3081 results in a relatively
large torus radial extent and flattens the clouds distribution.
Using the median value of A (in the following we will refer to median values in order to give
uncertainties at the 68% confidence level, which are defined around the median) reported in Table
2 we can derive the column density
using the Galactic dust-to-gas ratio (N; Bohlin et al. 1978). This gives
N, which is compatible with the value derived from
ASCA X-ray observations of NGC 3081
(N; Levenson et al. 2009).
The AGN bolometric luminosity can be obtained from the vertical shift applied to the models to fit the data:
L = 2.110 and
can be directly compared with the 2-10 keV intrinsic luminosity derived
from the ASCA data, after applying a bolometric correction factor of 20 (Elvis et al., 1994):
L = 1.010.
The difference between
L and L is smaller than the one found by Ramos11 RA11 for NGC 3081.
As explained before, the outer size of the toroidal distribution of clouds is defined as ,
where Rd scales with L. Thus, pc = 4 pc, which
includes dust at very different temperatures (from Td to a few Kelvin). This value is larger than the torus
radius obtained from the fit of NIR and MIR data only (Ro=0.70.3 pc; see Ramos11 RA11).
Finally, we can calculate the torus covering factor, CT. Broader tori
with more clumps will have larger covering factors and viceversa. According to our modelling,
CT = 0.8, which is among the typical values found for Sy2 galaxies in Ramos11 RA11
and it is compatible with X-ray studies (e.g. Ricci et al. 2011).
4 Circumnuclear and extended dust properties
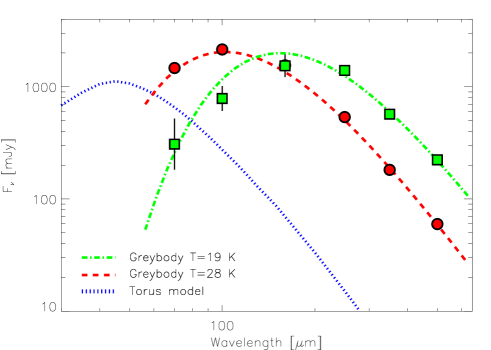
As explained above, the unresolved component of the SPIRE data includes the inner ring r1 apart from the active nucleus (note the clear bump of emission at 160 µm in Figure 2). To characterise the heating source of this component we have extracted fluxes in an aperture equals to the maximum size of the PSF in the SPIRE bands (i.e. the FWHM at 500 µm; 36.9″) and then subtracted the galaxy background emission measured in an adjacent annulus (first row in Table 3). The blue dotted line in Figure 4 corresponds to the best fitting torus model (MAP), and by subtracting it from the latter fluxes, we can isolate the dust emission that is not related to the torus (red dots). The best fit that we get for the latter component is a greybody of emissivity =2 and temperature T=281 K, which is typical of dust heated by young stars in the galaxy disk. Indeed, based on HST images, Buta et al. (2004) detected 350 diffuse bright clusters of R11 pc, with stellar populations younger than 10 Myr. In a similar way, we can determine the temperature of the dust in the galaxy disk, by subtracting the fluxes obtained in the 36.9″ aperture from the total galaxy fluxes reported in Table 3 (green squares). Figure 4 shows the fit of this component with a greybody of =2 and T=193 K, that is compatible with dust heated by the interstellar radiation field.
| Aperture | F70 | F100 | F160 | F250 | F350 | F500 |
|---|---|---|---|---|---|---|
| 36.9″ | 2124 | 2424 | 1627 | 552 | 187 | 61 |
| Total flux | 2432 | 3210 | 3164 | 1950 | 757 | 284 |
We integrated the emission of the two previous components and obtained their IR luminosities (1-1000 µm): L=1.4109 L☉ and L=2.2109 L☉. Following the equation M (M☉) from Klaas & Elsässer (1993), we can estimate the dust masses as in Radovich et al. (1999). We obtain a mass of 0.9106 M☉ for the circumnuclear dust at T=28 K and 1.6107 M☉ for the disk. The dust mass content of NGC 3081 is 5 times smaller than the value reported by Radovich et al. (1999), for the disk of the star-forming Seyfert 2 NGC 7582. This mass ratio is twice that of the HI masses (; Giovanelli & Haynes 1988), but it is consistent with the relative content of virial mass in both galaxies.
5 Conclusions
The FIR nuclear luminosity of NGC 3081 (on scales 1.7 kpc in diameter) can be reproduced by warm/cold dust within a clumpy torus heated by the AGN. On larger scales (5.4 kpc), the IR emission corresponds to a cold dust component at T=281 K heated by young stars in the galaxy disk, likely located in the r1 star-forming ring. On the other hand, the dust located in the outer parts of the galaxy is heated by the interstellar radiation field (193 K). These components are coincident with the findings IR studies of nearby Seyfert galaxies (Radovich et al., 1999; Pérez García & Rodríguez Espinosa, 2001; Bendo et al., 2010).
In our previous work using clumpy torus models we fitted the NIR-to-MIR SED of NGC 3081, among other Seyfert galaxies, with an interpolated version of the Nenkova et al. (2008) models. In this letter we have repeated the fit after adding the nuclear Herschel fluxes to the SED. The FIR data provide information about cooler dust within the torus, resulting in a relatively large value of the torus outer radius and a flat radial distribution of the clumps.
Acknowledgments
CRA acknowledges financial support from STFC (ST/G001758/1) and from the Spanish Ministry of Science and Innovation (MICINN) through project Consolider-Ingenio 2010 Program grant CSD2006-00070: First Science with the GTC. AMPG and JIGS acknowledge the Spanish Ministry of Science and Innovation (MICINN) through project AYA2008-06311-C02-01/02. AAR acknowledges the Spanish Ministry of Science and Innovation through projects AYA2010-18029 (Solar Magnetism and Astrophysical Spectropolarimetry). AAH and PE acknowledges support from the Spanish Plan Nacional de Astronomía y Astrofísica under grant AYA2009-05705-E. MP acknowledges Junta de Andaluc a and Spanish Ministry of Science and Innovation through projects PO8-TIC-03531 and AYA2010-15169. PACS has been developed by a consortium of institutes led by MPE (Germany) and including UVIE (Austria); KU Leuven, CSL, IMEC (Belgium); CEA, LAM (France); MPIA (Germany); INAF-IFSI/OAA/OAP/OAT, LENS, SISSA (Italy); IAC (Spain). This development has been supported by the funding agencies BMVIT (Austria), ESA-PRODEX (Belgium), CEA/CNES (France), DLR (Germany), ASI/INAF (Italy), and CICYT/MCYT (Spain). SPIRE has been developed by a consortium of institutes led by Cardiff University (UK) and including Univ. Lethbridge (Canada); NAOC (China); CEA, LAM (France); IFSI, Univ. Padua (Italy); IAC (Spain); Stockholm Observatory (Sweden); Imperial College London, RAL, UCL-MSSL, UKATC, Univ. Sussex (UK); and Caltech, JPL, NHSC, Univ. Colorado (USA). This development has been supported by national funding agencies: CSA (Canada); NAOC (China); CEA, CNES, CNRS (France); ASI (Italy); MCINN (Spain); SNSB (Sweden); STFC (UK); and NASA (USA). We finally acknowledge the anonymous referee for the useful comments.
References
- Alonso-Herrero et al. (2011) Alonso-Herrero, A., et al. 2011, ApJ, in press, arXiv:1105.2368
- Alonso-Herrero et al. (2003) Alonso-Herrero, A., Quillen, A., Rieke, G. H., Ivanov, V. D., Efstathiou, A. 2003, AJ, 126, 81
- Antonucci (1993) Antonucci, R. R. J. 1993, ARA&A, 31, 473
- Asensio Ramos & Ramos Almeida (2009) Asensio Ramos, A., Ramos Almeida, C. 2009, ApJ, 696, 2075
- Bendo et al. (2010) Bendo, G. J., et al. 2010, A&A, 518, L65
- Bohlin et al. (1978) Bohlin, R. C., Savage, B. D., Drake, J. F. 1978, ApJ, 224, 132
- Buta et al. (2004) Buta, R. J., Byrd, G. G., Freeman, T. 2004, AJ, 127, 1982
- Buta & Purcell (1998) Buta, R. & Purcell, G. B. 1998, AJ, 115, 484
- Byrd et al. (2006) Byrd, G. G., Freeman, T., Buta, R. J. 2006, AJ, 131, 1377
- Deo et al. (2009) Deo, R. P., Richards, G. T., Crenshaw, D. M., Kraemer, S. B. 2009, ApJ, 705, 14
- Elvis et al. (1994) Elvis, M., et al. 1994, ApJS, 95, 1
- Fritz et al. (2006) Fritz, J., Franceschini, A., Hatziminaoglou, E. 2006, MNRAS, 366, 767
- Gandhi et al. (2009) Gandhi, P., Horst, H., Smette, A., Hönig, S., Comastri, A., Gilli, R., Vignali, C., Duschl, W. 2009, A&A, 502, 457
- Granato & Danese (1994) Granato, G. L., Danese, L. 1994, MNRAS, 268, 235
- Giovanelli & Haynes (1988) Giovanelli, R., Haynes, M. P. 1988, Galactic and Extragalactic Radio Astronomy, 522
- Hatziminaoglou et al. (2008) Hatziminaoglou, E., et al. 2008, MNRAS, 386, 1252
- Klaas & Elsässer (1993) Klaas, U., Elsässer, H. 1993, A&A, 280, 76
- Levenson et al. (2009) Levenson, N. A., Radomski, J. T., Packham, C., Mason, R. E., Schaefer, J. J., & Telesco, C. M. 2009, ApJ, 703, 390
- Lutz (2010) Lutz, D. “PACS photometer PSF”, PICC-ME-TN-033, version 1.01, November 3, 2010
- Moran et al. (2000) Moran, E. C., Barth, A. J., Kay, L. E., Filippenko, A. V. 2000, ApJ, 540, L73
- Mullaney et al. (2011) Mullaney, J. R., Alexander, D. M., Goulding, A. D., Hickox, R. C. 2011, MNRAS, 414, 1082
- Müller et al. (2011) Müller T., et al., 2011, PACS Photometer – Point Source Flux Calibration, PICC-ME-TN-037 v1.0
- Müller et al. (2010) Müller T., et al., 2011, PACS Photometer – Point/Compact Source Observations: Mini Scan-Maps & Chop-Nod, PICC-ME-TN-036 v1.0
- Nenkova et al. (2008) Nenkova, M., Sirocky, M. M., Ivezic, Z., Elitzur, M. 2008, ApJ, 685, 147
- Peng et al. (2002) Peng, C. Y., Ho, L. C., Impey, C. D., & Rix, H.-W. 2002, AJ, 124, 266
- Pérez García & Rodríguez Espinosa (2001) Pérez García, A. M., Rodríguez Espinosa, J. M. 2001, ApJ, 557, 39
- Pilbratt et al. (2010) Pilbratt, G. J., et al. 2010, A&A, 518, L1
- Poglitsch et al. (2010) Poglitsch, A., et al. 2010, A&A, 518, L2
- Quillen et al. (2001) Quillen, A. C., McDonald, C., Alonso-Herrero, A., Lee, A., Shaked, S., Rieke, M. J., Rieke, G. H. 2001, ApJ, 547, 129
- Radovich et al. (1999) Radovich, M., Klaas, U., Acosta-Pulido, J. A., Lemke, D. 1999, A&A, 348, 705
- Ramos Almeida et al. (2009) Ramos Almeida, C., et al. 2009, ApJ, 702, 1127
- (32) Ramos Almeida, C., et al. 2011, ApJ, 731, 92
- Ricci et al. (2011) Ricci, C., et al. 2011, A&A, in press, arXiv:1104.3676v2
- Rodríguez Espinosa et al. (1987) Rodríguez Espinosa, J. M., Rudy, R. J., Jones, B. 1987, ApJ, 312, 555
- Sibthorpe et al. (2011) Sibthorpe, B., et al ”SPIRE Beam Model Release Note”, version 1.1, March 21, 2011
- Spinoglio et al. (1995) Spinoglio, I., Malkan, M. A., Rush, B., Carrasco, L., Recillas-Cruz, E., 1995, ApJ, 453, 616
- SPIRE OM (2011) SPIRE Observers’ Manual 2011, v2.3, Herschel Science Centre HERSCHEL-DOC-0798