An asteroseismic membership study of the red giants in three open clusters observed by Kepler: NGC 6791, NGC 6819, and NGC 6811
Abstract
Studying star clusters offers significant advances in stellar astrophysics due to the combined power of having many stars with essentially the same distance, age, and initial composition. This makes clusters excellent test benches for verification of stellar evolution theory. To fully exploit this potential, it is vital that the star sample is uncontaminated by stars that are not members of the cluster. Techniques for determining cluster membership therefore play a key role in the investigation of clusters. We present results on three clusters in the Kepler field of view based on a newly established technique that uses asteroseismology to identify fore- or background stars in the field, which demonstrates advantages over classical methods such as kinematic and photometry measurements. Four previously identified seismic non-members in NGC 6819 are confirmed in this study, and three additional non-members are found – two in NGC 6819 and one in NGC 6791. We further highlight which stars are, or might be, affected by blending, which needs to be taken into account when analysing these Kepler data.
Subject headings:
stars: fundamental parameters — stars: oscillations — stars: interiors — techniques: photometric — open clusters and associations: individual (NGC 6791, NGC 6819, NGC 6811)1. Introduction
Determination of cluster membership is a crucial step in the analysis of stellar clusters. Stars in an open cluster are thought to have formed from the same interstellar cloud of gas and dust, and hence share a common age and space velocity. Cluster membership can therefore be inferred from the location of the stars along an isochrone in the color-magnitude diagram (photometric membership), and from their common space velocity (kinematic membership) measured as the line-of-sight radial velocity and the perpendicular proper motion. Recently, a new independent method was introduced by Stello et al. (2010) who performed an asteroseismic analysis based on the first month of data from the Kepler Mission (Koch et al., 2010) to infer the cluster membership for a small sample of red giant stars in NGC 6819. Asteroseismology has the advantage that the oscillations in a star, which depend on the physical properties of the star’s interior (Christensen-Dalsgaard, 2004), are independent of stellar distance, interstellar extinction, and any random alignment between the space velocity of the cluster and field stars. In particular, the so-called average large frequency separation, , between consecutive overtone oscillation modes depends on the mean density of the star, and the frequency of maximum oscillation power, , is related to its surface gravity and effective temperature. Both and are known to scale with the basic stellar properties, , , and , (Ulrich, 1986; Kjeldsen & Bedding, 1995) and can therefore be used to infer those properties without relying on detailed modelling of stellar interiors (e.g. Stello et al., 2008; Kallinger et al., 2010b).
We now have Kepler time series photometry that span 10 times longer than in the work by Stello et al. (2010). In this paper we are therefore able to present an asteroseismic membership analysis of a more comprehensive set of red giant stars in three open clusters within Kepler’s fixed field of view: NGC 6791, NGC 6819, and NGC 6811. We are further able to measure and make use of both and for this purpose. In addition, to facilitate our inference on cluster membership and obtain more robust results we include an investigation of found from different color indices and present a detailed analysis of blending. Our membership results are compared with those from classical techniques.
We refer to our four companion papers for additional asteroseismic exploration of the same cluster data including (i) the determination of stellar mass and radius and cluster distances (Basu et al., 2011), (ii) verification of scaling relations for and (Hekker et al., 2011), (iii) derivation of a new scaling relation for oscillation amplitude (Stello et al., 2011), (iv) and mass loss properties of red giants during their transition between the hydrogen-shell and core-helium-burning phases (Miglio et al., 2011). Like this paper, these studies are based on the global asteroseismic seismic properties, , and amplitude, while more detailed frequency analyses requires more data for these relative faint and crowded cluster stars.
2. Target selection
For the purpose of determining cluster membership we use only stars showing oscillations that are stochatically driven by near-surface convection (solar-like oscillations) because their seismic observables are strongly linked to the fundamental stellar properties described by well established scaling relations (see Sect. 6). This limits our current study to the red giants as we require the oscillations to be sufficiently sampled by the spacecraft’s half-hour cadence.
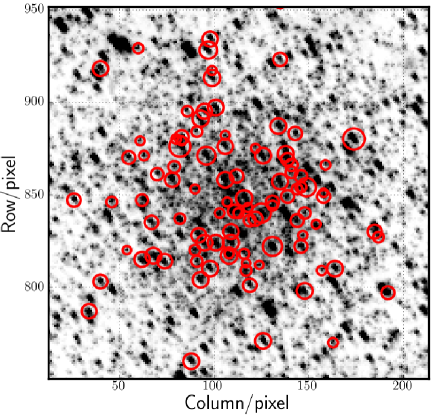
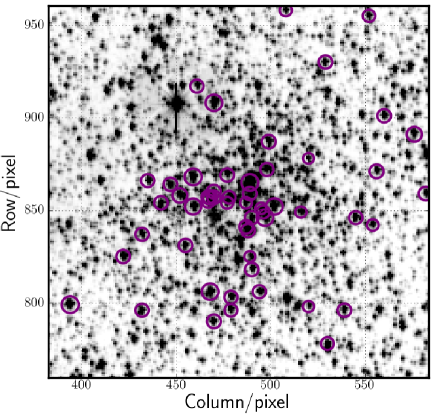
Large 200-pixel ‘super’ stamps of the CCD images ( on the side) centered on NGC 6791 and NGC 6819 are obtained at a half-hour cadence throughout the mission, eventually providing photometric time series (light curves) of all resolved stars within them (Figure 1).
However, these stamps require special image processing, which is still pending. We therefore base our current study on our initial selection of individual cluster stars made prior to launch, which have followed the standard Kepler data reduction of the raw images (Sect. 3), and includes a few stars outside the super stamps. Due to general limits on the number of stars that can be recorded by Kepler at any given time, the selection was aimed at maximising the number of cluster members in our sample.
For NGC 6791 no comprehensive kinematic membership study was available so the selection was based on photometric membership which we determined using the photometry by Stetson et al. (2003). Only stars quite close to the empirical isochrone in the color-magnitude diagram were chosen (Figure 2, large dots). We note that with this strict selection criterion we risk missing genuine members that are further away from the main cluster sequence, and hence might not sample the full intrinsic scatter of the population. Our selection provided 101 red giant stars.
We selected 63 red giants in the open cluster NGC 6819 that had more than 80% membership probability from the radial velocity survey of Hole et al. (2009). Being purely kinematic, this selection is more likely to include stars that do not follow the standard single-star evolution. Indeed, Figure 2 shows that a number of stars marked as kinematic members (large dots) are quite far from the empirical isochrone formed by the majority of stars.

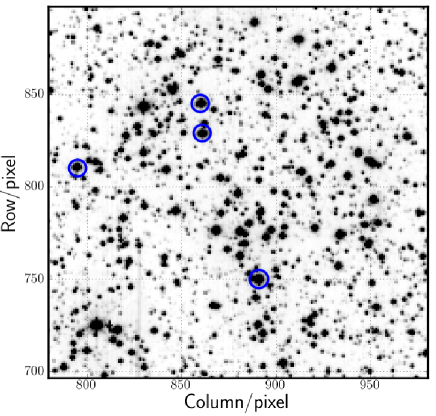
In the case of NGC 6811 we chose all stars determined to be possible members from a preliminary radial velocity survey (Meibom) (Figure 2), which gave us five red giants in total.
For this purpose the data are obtained in the spacecraft’s long-cadence mode .
3. Observations and data reduction
The photometric time series data presented here were obtained in ’long cadence’ (min, Jenkins et al. (2010a)) between 2009 May 12 and 2010 March 20, known as observing quarters 1–4 (Q1–Q4). Within this period the spacecraft’s long-cadence mode provided approximately 14,000 data points per star. The raw images were processed by the standard Kepler Science Pipeline and included steps to remove signatures in the data from sources such as pointing drifts, focus changes, and thermal variations all performed during the Pre-search Data Conditioning (PDC) procedure (Jenkins et al., 2010b). PDC also corrects for flux from neighboring stars within each photometric aperture based on a static aperture model. However, this model is not adequate for all stars, due to small changes in the telescope point-spread-function and pointing between subsequent quarterly rolls when the spacecraft is rotated 90 degrees to align its solar panels. As a result the light curves show jumps in the average flux level from one quarter to the next. To correct for that we shifted the average flux levels for each quarter to match that of the raw (pre-PDC) data before stitching together the time series from all four quarters. This ensured that the relative flux variations were consistent from one quarter to the next. We compared our corrected (post-PDC) data with the raw data and also after we performed a number of “manual” corrections based entirely on the appearance of the light curves (hence not taking auxiliary house-keeping data such as pointing into account). These corrections included removal of outliers, jumps, and slow trends in a similar way as the approach by Garcia et al. (2011). The comparison revealed that for a few stars PDC did not perform well, in which case we chose the raw or “manually” corrected raw data.
4. Blending and light curve verification
The super stamps in Figure 1 clearly illustrate that blending is an issue we need to address before proceeding with the analysis of these cluster data. Some stars show clear signatures of blending arising from the relatively large pixel scale () of the Kepler photometer compared to the fairly crowded cluster fields. Blending will give rise to additional light in the photometric aperture, which will reduce the relative stellar variability, and increase the photon counting noise. In severe cases, the detected stellar variability arises from a blending star and not the target.
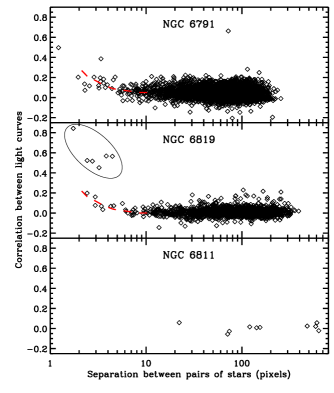
We have studied the effects from blending by looking at correlations between light curves of all the target stars (black, red, purple, and blue dots in Figure 2). The light curve correlations show no significant increase unless the stars are within approximately five pixels of each other and the blending star is at least as bright as the target (Figure 3).
We visually assessed the light curves of all stars separated by less than five pixels, and identified those that showed clear correlation over extended periods of time as blends. We list the blending stars in Table 1 (column-3), Table 2 (column-4), and Table 3 (column-4). Also listed here, is the variability type of blending stars identified from single light curves that clearly showed variability from two stars. If the variability included the expected seismic signal of the target, under the assumption that the target was a cluster member, we interpreted the additional signal as caused by a blend. We see no blending for our NGC 6811 targets. We note that the stars for which we currently have light curves are far from all stars in the vicinity of the clusters (see Figure 1). It is therefore likely that our correlation analysis has not revealed all blends. For the two most crowded clusters (NGC 6791 and NGC 6819) there are about 1000 stars brighter than within the super stamps. We expect a significant fraction of those stars to be accessible when these stamps have been analyzed, which will further aid the characterisation of blending.
| Target IDa | Target ID | Blend | Blend | Clump | Membership | Membership | Member | Seismic |
|---|---|---|---|---|---|---|---|---|
| (KIC) | (Stetson)b | known | potential | star | (M&P)c | (Garnavich)d | (Other)e | member |
| [1] | [2] | [3] | [4] | [5] | [6] | [7] | [8] | |
| 2297384 | 5583 | No | Yes | Yes | Yes | |||
| 2297793 | 11539 | No | No | No | R18/No? | No | ||
| 2297825 | 11957 | No | No | Yes | Yes | |||
| 2435987 | 611 | No | Yes | No | Yes | |||
| 2436097 | 1110 | No | No | No | Yes | |||
| 2436209 | 1705 | No | No | No | Yes | |||
| 2436332 | 2309 | No | Yes | No | 33% | Yes | ||
| 2436417 | 2723 | No | No | Yes | 17% | W | Yes | |
| 2436458 | 2915 | No | Yes | No | 49% | Yes | ||
| 2436540 | 3354 | No | No | No | Yes | |||
| 2436593 | 3609 | No | Yes | No | 13% | Yes | ||
| 2436676 | 4122 | No | No | No | 88% | Yes | ||
| 2436688 | 4202 | No | Yes | No | 98% | Yes | ||
| 2436732 | 4482 | No | No | Yes | 98% | Yes | ||
| 2436759 | 4616 | No | Yes | No | 88% | Yes | ||
| 2436814 | 4952 | No | Yes | No | W | Yes | ||
| 2436818 | 4968 | No | No | No | Yes | |||
| 2436824 | 4994 | No | Yes | No | 82% | Yes | ||
| 2436900 | 5454 | No | Yes | No | 98% | Yes | ||
| 2436912 | 5503 | No | Yes | Yes | 88% | Yes | ||
| 2436944 | 5712 | No | No | Yes | 23% | Yes | ||
| 2436954 | 5787 | 2436944 | Yes | No | Yes | |||
| 2437040 | 6288 | No | Yes | No | 29% | Yes | ||
| 2437103 | 6626 | No | Yes | No | Yes | |||
| 2437171 | 6963 | 2437209 | Yes | No | 98% | R4/Yes | O | ? |
| 2437240 | 7347 | No | Yes | No | 99% | Yes | ||
| 2437270 | 7564 | No | Yes | No | 89% | Yes | ||
| 2437325 | 7912 | No | Yes | No | 97% | Yes | ||
| 2437340 | 7972 | No | No | No | 92% | R19/Yes | C | Yes |
| 2437353 | 8082 | No | Yes | Yes | 93% | C,Gr | Yes | |
| 2437394 | 8317 | No | Yes | No | 98% | Yes | ||
| 2437402 | 8351 | No | Yes | No | 96% | Yes | ||
| 2437444 | 8563 | No | No | No | C | Yes | ||
| 2437488 | 8865 | Binary* | Yes | No | Yes | |||
| 2437496 | 8904 | No | Yes | No | 42% | R12/Yes | O | Yes |
| 2437507 | 8988 | No | No | No | 29% | C | Yes | |
| 2437564 | 9316 | No | Yes | Yes | 24% | Gr | Yes | |
| 2437589 | 9462 | No | No | Yes | 99% | Yes | ||
| 2437653 | 9827 | No | Yes | No | 94% | Yes | ||
| 2437698 | 10135 | No | No | Yes | 77% | Yes | ||
| 2437781 | 10674 | No | Yes | No | Yes | |||
| 2437804 | 10809 | No | Yes | Yes | 97% | Yes | ||
| 2437805 | 10806 | No | Yes | Yes | 97% | Gr | Yes | |
| 2437816 | 10898 | No | No | No | 68% | C | Yes | |
| 2437851 | 11116 | No | Yes | No | 17% | ? | ||
| 2437933 | 11598 | No | Yes | No | 94% | Yes | ||
| 2437957 | 11797 | No | Yes | No | 11% | Yes | ||
| 2437965 | 11814 | No | Yes | No | 98% | R8/Yes | C | Yes |
| 2437972 | 11862 | No | Yes | No | 85% | Yes | ||
| 2437976 | 11895 | No | Yes | No | 98% | Yes | ||
| 2437987 | 11938 | No | Yes | Yes | 96% | Yes | ||
| 2438038 | 12249 | No | Yes | No | 96% | Yes | ||
| 2438051 | 12333 | No | Yes | Yes | 99% | Yes | ||
| 2438140 | 12836 | No | No | No | Yes | |||
| 2438333 | 13847 | No | No | No | Yes | |||
| 2438421 | 14379 | No | No | No | 47% | R7/Yes | O | ? |
| 2568916 | 996 | No | No | Yes | Yes | |||
| 2569055 | 1904 | No | No | Yes | Yes | |||
| 2569360 | 3754 | No | No | No | 94% | W | Yes | |
| 2569488 | 4715 | No | No | Yes | 49% | C | Yes | |
| 2569618 | 5796 | No | No | No | 99% | Yes | ||
| 2569935 | 8266 | High peak* | No | No | R16/Yes | O,C | Yes | |
| 2569945 | 8395 | No | Yes | Yes | 89% | Yes | ||
| 2570094 | 9786 | No | Yes | No | 85% | Yes | ||
| 2570172 | 10407 | No | Yes | No | Yes | |||
| 2570214 | 10695 | No | Yes | Yes | 88% | Yes | ||
| 2570244 | 11006 | No | Yes | No | 90% | Yes | ||
| 2570384 | 12265 | Binary* | Yes | No | Yes | |||
| 2570518 | 13260 | No | Yes | No | Yes |
| Target IDa | Target ID | Target ID | Blend | Blend | Clump | Class. | Membership | Membership | Photometric | Seismic |
|---|---|---|---|---|---|---|---|---|---|---|
| (KIC) | (Hole et al.)b | (Sanders)c | known | potential | star | (Hole et al.)b | (Hole et al.)b | (Sanders)c | member | member |
| [1] | [2] | [3] | [4] | [5] | [6] | [7] | [8] | [9] | [10] | [11] |
| 4936335 | 007021 | 9 | No | No | No | SM | 95% | 68% | Yes | No |
| 4937011 | 007017 | 90 | No | No | No | SM | 95% | 90% | Yes | No |
| 4937056 | 002012 | 103 | No | No | Yes | BM | 95% | 92% | Yes | Yes |
| 4937257 | 009015 | 144 | No | No | No | SM | 88% | 80% | No | No |
| 4937576 | 005016 | 173 | No | No | No | SM | 91% | 88% | Yes | Yes |
| 4937770 | 009024 | High peak* | No | No | SM | 94% | No | Yes | ||
| 4937775 | 009026 | No | No | No | BM | 91% | No | Yes | ||
| 5023732 | 005014 | 27 | No | No | No | SM | 94% | 90% | Yes | Yes |
| 5023845 | 008010 | 36 | No | No | No | SM | 95% | 89% | Yes | Yes |
| 5023889 | 004014 | 42 | No | No | No | U | 95% | 90% | No | No |
| 5023931 | 007009 | 43 | No | No | No | BM | 84% | 91% | Yes | Yes |
| 5023953 | 003011 | 45 | No | No | Yes | BLM | 90% | Yes | Yes | |
| 5024043 | 008013 | 58 | No | No | Yes | SM | 95% | 65% | Yes | Yes |
| 5024143 | 007005 | 65 | No | No | No | SM | 94% | 69% | Yes | Yes |
| 5024240 | 008007 | No | No | No | BM | 88% | Yes | Yes | ||
| 5024268 | 002003 | 78 | Scuti* | No | No | SM | 93% | 92% | No | No |
| 5024272 | 003003 | 79 | No | No | No | SM | 95% | No | No | |
| 5024297 | 008003 | 87 | 5024312 | Yes | No | SM | 89% | 92% | Yes | Yes |
| 5024312 | 013002 | 86 | 5024297 | Yes | No | SM | 89% | 87% | Yes | Yes |
| 5024327 | 011002 | 96 | No | No | Yes | SM | 94% | 88% | Yes | Yes |
| 5024404 | 003004 | 98 | No | No | No | SM | 93% | 81% | Yes | Yes |
| 5024405 | 004001 | 100 | No | Yes | No | SM | 93% | 91% | Yes | Yes |
| 5024414 | 006002 | 106 | No | Yes | Yes | SM | 95% | 91% | Yes | ? |
| 5024456 | 001002 | 110 | M-giant* | Yes | No | SM | 88% | 72% | Yes | Yes |
| 5024476 | 001006 | 111 | No | No | Yes | BLM | 89% | Yes | ? | |
| 5024512 | 003001 | 116 | No | Yes | No | SM | 93% | 90% | Yes | Yes |
| 5024517 | 002001 | No | Yes | No | SM | 88% | Yes | ? | ||
| 5024582 | 009002 | 118 | 5112741* | Yes | Yes | BLM | 87% | Yes | Yes | |
| 5024601 | ||||||||||
| 5024583 | 007003 | 119 | Binary* | Yes | No | SM | 95% | 92% | Yes | Yes |
| 5024601 | 004002 | 124 | 5024582 | Yes | Yes | SM | 92% | 86% | Yes | Yes |
| 5024750 | 001004 | 141 | No | No | No | SM | 93% | 83% | Yes | Yes |
| 5024851 | 002008 | 152 | No | No | No | BLM | 64% | Yes | Yes | |
| 5024967 | 006009 | 158 | No | No | Yes | SM | 92% | 87% | Yes | Yes |
| 5111718 | 008018 | 10 | No | No | No | SM | 95% | 91% | Yes | Yes |
| 5111940 | 005012 | 28 | No | Yes | No | SM | 94% | 79% | Yes | Yes |
| 5111949 | 004011 | 30 | No | No | Yes | SM | 93% | 83% | Yes | Yes |
| 5112072 | 009010 | 39 | No | No | No | SM | 95% | 91% | Yes | Yes |
| 5112288 | 002007 | 64 | No | No | Yes | SM | 93% | 90% | Yes | Yes |
| 5112361 | 004008 | 70 | No | No | No | BM | 91% | 78% | No | Yes |
| 5112373 | 005005 | 74 | No | No | Yes | SM | 95% | 87% | Yes | Yes |
| 5112387 | 003007 | 73 | No | No | Yes | SM | 95% | 88% | Yes | Yes |
| 5112401 | 003009 | 75 | No | No | Yes | SM | 95% | 92% | Yes | Yes |
| 5112403 | 005004 | 77 | No | No | No | SM | 91% | 89% | Yes | Yes |
| 5112467 | 006003 | 85 | No | Yes | Yes | SM | 95% | 87% | Yes | Yes |
| 5112481 | 001007 | 93 | No | No | No | SM | 92% | 89% | Yes | Yes |
| 5112491 | 010002 | 89 | No | Yes | Yes | SM | 95% | 92% | Yes | Yes |
| 5112730 | 004005 | 128 | No | No | Yes | SM | 93% | 62% | Yes | Yes |
| 5112734 | 012002 | 130 | 5112741* | Yes | No | SM | 91% | 90% | Yes | Yes |
| 5112744 | 005011 | 127 | No | No | No | SM | 95% | 77% | Yes | Yes |
| 5112751 | 008002 | 131 | 5112741* | Yes | Yes | SM | 93% | 89% | Yes | ? |
| 5112786 | 005003 | 134 | No | No | No | SM | 94% | 69% | Yes | Yes |
| 5112880 | 002004 | 145 | No | No | No | SM | 81% | 1% | Yes | Yes |
| 5112938 | 002006 | 150 | No | Yes | Yes | SM | 89% | 88% | Yes | Yes |
| 5112948 | 005007 | 147 | No | No | No | SM | 93% | 89% | Yes | Yes |
| 5112950 | 003005 | 148 | No | No | Yes | SM | 95% | 92% | Yes | Yes |
| 5112974 | 004009 | 151 | No | No | Yes | SM | 94% | 91% | Yes | Yes |
| 5113041 | 004007 | 153 | No | No | No | SM | 94% | 26% | Yes | Yes |
| 5113061 | 001014 | 157 | No | No | No | SM | 95% | 89% | Yes | Yes |
| 5113441 | 012016 | 185 | No | No | No | SM | 89% | 0% | Yes | Yes |
| 5199859 | 001016 | 69 | No | No | No | SM | 95% | 89% | Yes | Yes |
| 5200152 | 003021 | No | No | Yes | SM | 94% | Yes | Yes |
| Target IDa | Target ID | Target ID | Blend | Blend | Clump | Class. | Membership | Membership | Membership | Photometric | Seismic |
|---|---|---|---|---|---|---|---|---|---|---|---|
| (KIC) | (Sanders)b | (Dias et al.)c | known | potential | star | (M&M)d | (Meibom)e | (Sanders)b | (Dias et al.)c | member | member |
| [1] | [2] | [3] | [4] | [5] | [6] | [7] | [8] | [9] | [10] | [11] | [12] |
| 9534041 | No | No | Yes | SLM 74% | Yes | Yes | |||||
| 9655101 | 95 | TYC3556-00530-1 | No | No | Yes | SM | SM 84% | 97% | 95% | Yes | Yes |
| 9655167 | 106 | No | No | Yes | BM | BLM 57% | 97% | Yes | Yes | ||
| 9716090 | 92 | TYC3556-02356-1 | No | No | Yes | SM | SM 78% | 94% | 95% | Yes | Yes |
| 9716522 | 170 | TYC3556-02634-1 | No | No | Yes* | SM | SM 79% | 97% | 97% | Yes | Yes |
In addition to the light curve correlations, we identified all significantly bright stars nearby each target using information from the Kepler Input Catalogue (KIC), which was designed to reach down to . This was just adequate for our purpose. We identified targets to be potentially affected by blending if there were stars within five pixels that were at least half as bright as the target itself, which we regard a conservative choice given the results from the above correlation analysis. Potentially blended targets are listed in Table 1 (column-4), Table 2 (column-5), and Table 3 (column-5), while the blending stars, their flux ratios with respect to the target, and their separations are given in Tables 4 and 5. Again, the NGC 6811 targets show no signs of potential blending. Due to slight temporal changes in telescope pointing, the degree of blending for each target can vary considerably over time for the crowded cluster fields. We took this into account in our approach to correct the light curves, which we describe in detail below for the two clusters affected by blending and other possibly related effects.
| Target IDa | Blend | Sep | Target IDa | Blend | Sep | ||
|---|---|---|---|---|---|---|---|
| (KIC) | (KIC) | (pix) | (KIC ) | (KIC) | (pix) | ||
| 2297384 | 2297357 | 6.94 | 5.0 | 2437564 | 2437593 | 0.51 | 1.7 |
| 2435987 | 2435967 | 0.51 | 4.1 | 2437653 | 2437672 | 0.99 | 1.0 |
| 2436332 | 2436354 | 2.18 | 3.3 | 2437641 | 0.67 | 3.2 | |
| 2436458 | 2436455 | 0.53 | 4.8 | 2437648 | 5.61 | 2.7 | |
| 2436593 | 2436608 | 2.41 | 1.6 | 2437693 | 3.88 | 3.1 | |
| 2436688 | 2436641 | 0.79 | 4.3 | 2437706 | 0.79 | 4.1 | |
| 2436759 | 2436750 | 4.28 | 1.0 | 2437781 | 2437775 | 4.24 | 0.8 |
| 2436746 | 0.51 | 1.0 | 2437804 | 2437803 | 0.69 | 0.8 | |
| 2436814 | 2436879 | 0.85 | 4.8 | 2437871 | 0.91 | 4.8 | |
| 2436826 | 1.30 | 0.7 | 2437805 | 2437747 | 0.51 | 4.3 | |
| 2436824 | 2436848 | 0.50 | 2.2 | 2437851 | 2437816 | 8.90 | 3.8 |
| 2436900 | 2436911 | 0.51 | 1.7 | 2437797 | 0.58 | 4.2 | |
| 2436912 | 2436881 | 0.63 | 2.8 | 2437933 | 2437931 | 1.46 | 4.8 |
| 2436879 | 0.83 | 3.3 | 2437928 | 0.55 | 4.4 | ||
| 2436897 | 1.52 | 1.4 | 2437957 | 1.18 | 4.6 | ||
| 2436866 | 2.74 | 2.9 | 2437957 | 2437933 | 0.85 | 4.6 | |
| 2436954 | 2569626 | 0.80 | 2.9 | 2437962 | 13.1 | 4.1 | |
| 2436968 | 2.69 | 2.2 | 2437972 | 1.13 | 3.3 | ||
| 2436973 | 0.98 | 2.2 | 2437965 | 2437999 | 2.80 | 3.9 | |
| 2436944 | 8.77 | 1.2 | 2437964 | 0.56 | 2.0 | ||
| 2436958 | 5.51 | 4.3 | 2437972 | 2437948 | 0.59 | 2.7 | |
| 2436932 | 0.74 | 2.3 | 2437987 | 2.44 | 3.6 | ||
| 2437040 | 2437028 | 4.21 | 0.6 | 2437962 | 11.6 | 1.1 | |
| 2437022 | 0.63 | 1.5 | 2437957 | 0.89 | 3.3 | ||
| 2437103 | 2437059 | 1.28 | 4.2 | 2437976 | 2437937 | 3.59 | 3.8 |
| 2437041 | 0.60 | 4.8 | 2437931 | 1.28 | 4.3 | ||
| 2437171 | 2437220 | 0.85 | 4.6 | 2437932 | 1.87 | 4.3 | |
| 2437240 | 2437220 | 5.90 | 0.9 | 2437926 | 0.58 | 4.6 | |
| 2437184 | 0.67 | 3.5 | 2437964 | 3.54 | 4.5 | ||
| 2437270 | 2437315 | 0.92 | 3.3 | 2437987 | 2437996 | 1.26 | 4.7 |
| 2437323 | 5.85 | 3.7 | 2437962 | 4.76 | 3.2 | ||
| 2437299 | 6.47 | 2.2 | 2438038 | 2438078 | 2.81 | 4.0 | |
| 2437348 | 1.92 | 5.0 | 2438051 | 2438073 | 0.79 | 2.2 | |
| 2437234 | 5.18 | 3.1 | 2438032 | 0.65 | 5.0 | ||
| 2437257 | 3.26 | 2.5 | 2569945 | 2569926 | 5.14 | 2.3 | |
| 2437267 | 2.73 | 2.6 | 2569891 | 1.07 | 5.0 | ||
| 2437325 | 2437402 | 1.87 | 4.4 | 2569925 | 0.85 | 2.7 | |
| 2437313 | 7.21 | 4.2 | 2570094 | 2570091 | 2.15 | 3.3 | |
| 2437329 | 0.64 | 3.7 | 2570079 | 2.34 | 1.2 | ||
| 2437255 | 0.56 | 4.9 | 2570172 | 2570182 | 0.63 | 2.7 | |
| 2437353 | 2437317 | 0.67 | 4.8 | 2570131 | 0.78 | 4.9 | |
| 2437394 | 2437331 | 0.65 | 4.1 | 2570214 | 2570226 | 2.05 | 1.5 |
| 2437402 | 2437410 | 0.67 | 1.4 | 2570244 | 2570277 | 0.94 | 3.7 |
| 2437405 | 0.97 | 4.8 | 2570384 | 2570400 | 4.84 | 3.7 | |
| 2437325 | 0.54 | 4.4 | 2570370 | 21.4 | 3.5 | ||
| 2437488 | 2437437 | 1.26 | 4.5 | 2570518 | 2570524 | 1.08 | 3.7 |
| 2437429 | 3.06 | 4.7 | 2570536 | 2.76 | 3.5 | ||
| 2437496 | 2437487 | 0.59 | 4.9 |
| Target IDa | Blend | Sep | Target IDa | Blend | Sep | ||
|---|---|---|---|---|---|---|---|
| (KIC) | (KIC) | (pix) | (KIC) | (KIC) | (pix) | ||
| 5024297 | 5024272 | 4.58 | 4.6 | 5024601 | 5024582 | 0.83 | 2.9 |
| 5024312 | 0.56 | 2.4 | 5112741 | 1.07 | 3.4 | ||
| 5024312 | 5024297 | 1.78 | 2.4 | 5112751 | 0.83 | 4.3 | |
| 5024349 | 3.83 | 4.9 | 5111940 | 5111932 | 2.00 | 2.4 | |
| 5024405 | 5024410 | 2.55 | 3.2 | 5112467 | 5112445 | 0.69 | 2.4 |
| 5024414 | 5024410 | 1.04 | 2.9 | 5112478 | 0.80 | 2.4 | |
| 5024369 | 0.81 | 4.8 | 5112491 | 1.04 | 2.9 | ||
| 5024456 | 5024470 | 2.51 | 3.2 | 5112491 | 5112467 | 0.97 | 2.9 |
| 5024512 | 5024517 | 1.38 | 3.5 | 5112478 | 0.78 | 3.3 | |
| 5024511 | 2.66 | 3.0 | 5112734 | 5024582 | 1.03 | 3.8 | |
| 5024517 | 5024511 | 1.93 | 0.9 | 5112741 | 1.33 | 2.4 | |
| 5024512 | 0.73 | 3.5 | 5112751 | 1.04 | 3.2 | ||
| 5024582 | 5024601 | 1.21 | 2.9 | 5112751 | 5024582 | 1.00 | 4.5 |
| 5112734 | 0.97 | 3.8 | 5024601 | 1.21 | 4.3 | ||
| 5112741 | 1.29 | 2.8 | 5112734 | 0.97 | 3.2 | ||
| 5112751 | 1.00 | 4.5 | 5112741 | 1.29 | 1.7 | ||
| 5024583 | 5024584 | 4.99 | 1.0 | 5112938 | 5112932 | 0.68 | 2.9 |
4.1. NGC 6791
There is one pair of stars (KIC2569488, 2568916) that show an abnormally high correlation despite their large separation (pixels) (see Figure 3). Visual inspection of the light curves reveals that it arises from a strong trend localized within a relatively narrow time span. They are not mutually influenced by a bad column, neither do they lie within the wings of a really bright star. From inspection of the raw images they should not correlate, and there are no indications that the oscillation signals of the two are affected by each other. We therefore leave the light curves uncorrected.
The Q1 data were not used for KIC2570384, and Q3 was not used for KIC2437488, both due to apparent blending by short-period eclipsing binaries. Possible candidates for these blends can be found in Table 4 (column-2). An abnormally strong peak of unknown origin was seen slightly offset from the main excess envelope in the power spectrum of KIC2569935. Hence, to avoid strong bias in the measurement of the asteroseismic parameters, we fitted and removed a corresponding single sine wave from the data.
4.2. NGC 6819
The four stars KIC5024582, 5112734, 5112751, and 5112741 form six correlation pairs that stand out in Figure 3 (encircled). It turns out that the increased correlation is caused by the same large-amplitude contact binary (W UMa variable), KIC5112741. Fortunately, we were able to retrieve the pulsation signal to a degree that allowed the measurement of the seismic parameters used in this paper (see Sect. 5) except for the W UMa variable itself. We did that by applying a high-pass filter to the three affected light curves using a moving average of two days. The resulting light curves show correlation coefficients in line with the trend shown by the dashed line in Figure 3. We followed the same approach to remove the variability of what appears to be a bright M-giant (most likely KIC5024470, Table 5 column-2), from the light curve of KIC5024456, in this case using a four-day moving average.
The Q1 data were not used for KIC5024583 due to the presence of an eclipsing binary signal. KIC5024268 was also significantly affected by apparent blending by a Scuti star in the Q1 and Q2 data. These data were therefore removed from the light curve. Like in one of the NGC 6791 targets, KIC4937770 showed an abnormal peak in the power spectrum, which we removed by fitting a single sine wave.
5. Extraction of asteroseismic parameters
In Figure 4 we show a typical example of a power spectrum and indicate for illustration the average large separation, , and the frequency of maximum oscillation power, .
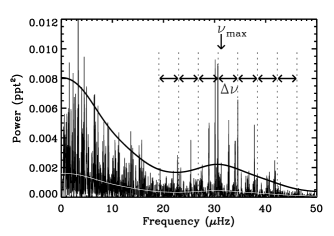
Values of and were extracted from the data using each of the time series analysis pipelines described in Hekker et al. (2010); Huber et al. (2009); Kallinger et al. (2010a); Mathur et al. (2010); Mosser & Appourchaux (2009). If at least one pipeline detected oscillations, the star was included in our sample for further investigation. The results of all stars were then verified by visual inspection of the power spectrum and the autocorrelation of the power spectrum. We further verified values of by forming the so-called échelle diagram of the power spectrum, constructed by dividing the power spectrum into segments, each wide, which were then stacked one above the other. To illustrate, Figure 5 shows three examples of the échelle diagram for the same star, each based on a slightly different segment width (adopted large separation).
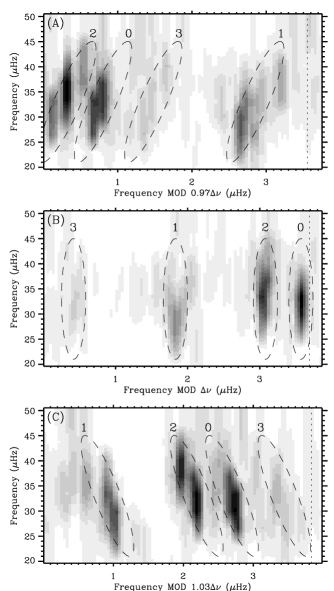
If is correct, the radial oscillation modes form a vertical ridge in the échelle, offset from zero by in agreement with recent results on the - relation of red giants (Huber et al., 2010; Mosser et al., 2011; White et al., 2011). The échelle diagram clearly reveals if the adopted large separation is too small (ridges tilt to the right; panel A) or too large (ridges tilt to the left; panel C) even by a few percent. For almost all stars multiple pipelines returned results, and in the vast majority of cases the results agreed within a few percent. With such small scatter our conclusions about membership would essentially be independent on our choice of the final set of results. We therefore adopted the results from the pipeline that returned results for most stars, except for the few stars where was clearly wrong (échelle ridges strongly tilted), in which case we chose the pipeline results that generated the most vertical ridges in the échelle. We were able to detect oscillations in all the red giants in our sample except two stars in NGC 6819 (KIC5112741 and 5200787) and towards the faint end of stars in NGC 6791 (, ), for which higher signal-to-noise data, hence longer light curves, will be required.
For some of the most luminous stars, which oscillate at very low frequencies, is quite small and was difficult to determine reliably with the length of our current dataset. The dominant periodicity, , equivalent to 1/, was however easily detectable in the Fourier spectrum and even directly in the time series (Figure 6).

The uncertainty in for these stars is relatively large because it was not always possible to correct for the background granulation signal.
6. Membership
Following the approach by Stello et al. (2010), we will use asteroseismic measurements to categorise our selected stars into asteroseismic cluster members or likely non-members. We note that the length of the data analysed by Stello et al. (2010) only allowed robust measurement of for many of their targets. With our current data we can also extract for almost all the target stars, which is generally the more precise measurement of the two. The former parameter is known to scale with acoustic cut-off frequency, and hence (Brown et al., 1991; Kjeldsen & Bedding, 1995; Mosser et al., 2010):
| (1) |
where K and Hz, while the latter scales with the square root of the mean density of the star (Ulrich, 1986; Kjeldsen & Bedding, 1995):
| (2) |
where Hz.
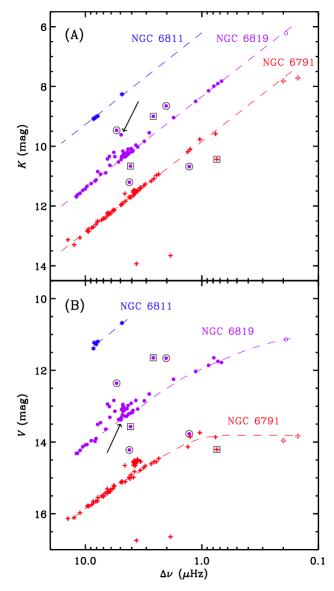
Because and vary only slightly compared to within a sample of cluster red giants, a tight correlation is expected between both or and the apparent stellar magnitude, which for cluster members is indicative of luminosity. By plotting stellar apparent magnitude versus or we indeed see a tight correlation apart from a few outliers. To illustrate, we show 2MASS magnitude (Skrutskie et al., 2006) versus in Figure 7 (panel A).
We note that there is no apparent correlation between the crowding value from KIC and whether stars follow the expected correlation or not. This suggests that the KIC crowding value is not a robust indicator of how much and are affected by blending. This is expected because increased blending does not alter the oscillation frequencies of the target but only adds extra noise and lowers the relative amplitude of the oscillations. Only in the rare event where the oscillation signal from the blending star is very similar to that of the target would the measured and be affected. In addition, variability from a blending star, such as a binary companion, could dominate and hence get detected instead of that from the target.
We made similar plots replacing band with , , and to see if they showed consistent results. The last is shown in Figure 7 (panel B). The band clearly shows larger scatter than the infrared bands due to its stronger sensitivity to differential interstellar reddening and the slight temperature difference between clump and red-giant-branch stars of the same mean density. The bending of the main trend (dashed lines) is due to strong blanketing affecting the band measurements for the cooler stars (see Figure 3 in Garnavich et al., 1994). Interestingly, this comparison revealed that for one star, KIC5024517, the and band measurements aligned with the expected trend of cluster members, while in and bands the star was an outlier (see arrow). In addition, there are indications in the power spectrum of excess power from two oscillating stars. The excess located at the highest frequency (picked up by the time series analysis pipelines) is compatible with the star being a cluster member if we use the and band measurements, while the low frequency excess is in agreement with the and band measurements. This strongly suggests that blending (Tables 2 and 5) has affected the standard photometry as well as the Kepler light curve.
6.1. Estimating and
In the next step, we will estimate the expected and from solar scaling (Eqs. 1 and 2), and compare them directly with the observations to make inference on cluster membership. We do note that because these two parameters are so strongly correlated (Stello et al., 2009; Hekker et al., 2009; Mosser et al., 2010), using both adds little extra information other than redundancy for the purpose of determining membership.
To estimate the expected and we converted the apparent magnitude into luminosity, using the cluster distances by Basu et al. (2011). For NGC 6811, which was not studied by Basu et al. (2011), we adopted a distance modulus of 10.3 mag found by visual isochrone fitting. The contribution to the spread in apparent magnitude from the intrinsic depth of the clusters is similar to that from the photometric uncertainty, and is ignored in the following. We adopted average cluster reddenings of mag (NGC 6791, Brogaard et al. (2011)), mag (NGC 6819, Bragaglia et al. (2001)), and mag (NGC 6811, Webda database). Bolometric corrections were performed using the calibrations by Bessell & Wood (1984) and Flower (1996).
The scatter in the mass of these red-giant-branch stars can be assumed to be low (less than 1% along a standard isochrone, e.g. Marigo et al. (2008)). We therefore adopted the average red giant mass from Basu et al. (2011) for NGC 6791 and NGC 6819. It should be noted that the assumed common mass might result in a systematic overestimation of the expected for the red clump stars – not included in the study by Basu et al. (2011) – if they have experienced significant mass loss compared to the red-giant-branch stars (Miglio et al., 2011). We indicate in Table 1 (column-5), Table 2 (column-6), and Table 3 (column-6) which stars are clump stars inferred from the color-magnitude diagram (Figure 2). For NGC 6811, we used an average mass of M⊙ derived from , , and by combining Equations 1 and 2 (Kallinger et al., 2010b) similar to what was done by Hekker et al. (2011). Finally, we emphasize that the absolute values adopted for the average cluster properties are of less importance since we are looking only to distinguish stars that deviate from the average trend. Hence, it is important to take into account the relative and bolometric corrections of each star.
To obtain we transformed the color index using the calibrations by Ramírez & Meléndez (2005). We estimate the uncertainty in to be K, which includes contributions from the photometry, color-temperature calibration, and reddening (Hekker et al. see 2011, for further details). As a double check we compared our with those derived from . The results are shown in Figure 8.
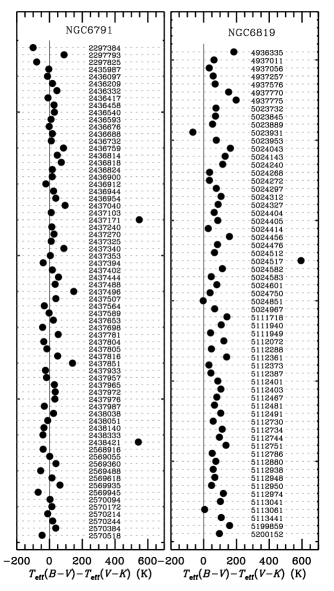
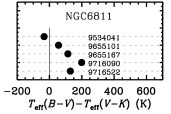
The offset seen for NGC 6819 shows a slight dependency with color and is most likely due to calibration errors in the standard photometry.
The index is genrally the better temperature proxy for cool red giants, it is less sensitive to metalicity, and its temperature calibration show lower scatter than for . We therefore choose . The two outliers, KIC2437171 and KIC2438421, are much cooler than they appear in (Garnavich et al., 1994), supporting that is the prefered color index. However, for KIC5024517 – the outlier in NGC 6819 – we recall that the -band measurement is probably affected by blending (Figure 7), suggesting might not be the best temperature indicator in this case.
6.2. Results on the observed-to-expected ratio
The observed-to-expected ratios for and are shown in Figure 9. The expected ratio is 1.0, with an uncertainty slightly below 10% (1- region marked in gray), which is dominated by the uncertainty in . The size of the uncertainty underpins that ignoring the expected spread in mass of is sound. For our purpose the absolute value of the average ratio is not important but rather the deviation of single stars from the ensemble. However, it turns out that the majority of stars fall close to 1.0, which shows that any possible systematic errors in the expected (scaled) and , caused by offsets in the calibration of the scaling relations or inaccurate adopted cluster parameters, have cancelled out. Apart from a few clear outliers we see generally little scatter, which indicates that blending is less of an issue than suggested by the large number of potential blends, particularly for NGC 6791 (Table 1, column-4).

We note that we did not find any general trends between on the one hand stellar brightness or color and the other hand the deviation of and from the cluster average. Nor did we detect a difference in the observed-to-expected ratios between stars on the red gaint branch and the red clump; hence supporting that any possible mass loss, which is expected to occur predominantly near the tip of the red giant branch, is insignificant compared to the uncertainty in the ratios plotted in Fig. 9. However, stars that do clearly deviate need to be carefully assessed before we draw any conclusions about their cluster membership. We will discuss each cluster in turn.
In NGC 6791 there are three outliers in (KIC2297793, 2436954, 2437851) and an additional borderline case in (KIC2438421). The latter is one of the stars with very low and for which accurate uncertainties were difficult to determine and we therfore do not make a final conclusion on its membership. Of the others, KIC2436954 and 2437851 are the two faintest stars (, ) for which oscillations have been detected. The former shows strong evidence of blending, while the latter is potentially blended. This leaves KIC2297793 as the only star where we can not explain the results as potentially due to blending. The fast stage of evolution of this very luminous star (upper red giant or asymptotic giant branch assuming it is a cluster member) means that a potential binary companion would presumably be much fainter, making it unlikely that the companion affects our measurements significantly (both seismic as well as the standard photometry). We therefore conclude the most likely explanation is that the star is not a cluster member. For some of the targets we have membership probabilities from radial velocity (Meibom & Platais, priv. comm. (2010) and Garnavich et al. (1994)), and from both radial velocity and metallicity (Worthey & Jowett, 2003; Origlia et al., 2006; Carraro et al., 2006; Gratton et al., 2006), which we list in Table 1 (column-6–8), while column-9 lists our seismic membership results. Our results on KIC2297793 reaffirm that of Garnavich et al. (1994) who’s ambiguous ’no?’ designation was chosen because the star’s radial velocity was significantly different from the cluster average despite moving in the same direction as the cluster as opposed to the bulk of the field. Finally, it is noticeable that quite a few seismic members – all initially selected as photometric members – are assigned low probability membership from the radial velocity survey by (Meibom & Platais). We speculate that this could be due to binary companions, which we will address using seismology in a forthcomming paper.
NGC 6819 shows a few more outliers than NGC 6791 despite the stars being brighter and less affected by blending (compare Tables 4 and 5). Our results confirm all four seismic non-members identified by Stello et al. (2010) KIC4936335, 4937257, 5023889, and 5024272. In addition, we can identify two new seismic non-members, KIC4937011 and 5024268. All other apparently discrepant stars could be explained by potential blending or binarity (KIC5024414, 5024476, 5024517, and 5112751) affecting both the seismic measurements and the temperature estimates (spectroscopic binaries are listed in Table 2 column-7). In fact, adopting the temperature from for KIC5024517 makes it agree quite well (star symbol). We see the opposite in KIC5023931, which is a known binary where the temperature and the detected oscillations agree with membership, while it would appear as a non-member if we adopt the temperature. For comparison we list membership probabilities from radial velocity, and proper motion in Table 2 (column-8 and 9), as well as photometric membership alongside the identified seismic membership (column-10 and 11). In four cases stars appear to be both seismic and photometric non-members. Three stars (KIC5112880, 5113041, and 5113441) have very low proper motion probability contradicting the results from radial velocity, photometry, and seismology.
Finally, all five stars selected in NGC 6811 show seismic signals that agree with them being cluster members (Table 3, column-12). Our results agree well with those inferred from radial velocity measurements (column-7 and 8), proper motion (column-9 and 10), and photometric membership (column-11).
7. Discussion and conclusion
We have demonstrated that cluster membership determined from seismology show advantages over more orthodox methods, and hence offers important complementary information to that of kinematic and photometric measurements. In our asteroseismic investigation we implicitly assumed a standard evolution history for the cluster stars when estimating the seismic parameters. Any exotic stars, such as remnants of strong dynamic interactions, would therefore appear as non-members under this assumption. While a kinematic study does not assume a standard stellar evolution, it can assign spurious field stars as members and vice versa if the space velocity of the cluster is not clearly distinct from that of the field. The asteroseismic determination, however, is insensitive to that, as it essentially separates non-members from members by revealing stars that are at a different distance than the ensemble mean.
From almost a year of Kepler data, we were able to measure global seismic properties of over a hundred red giant stars in three open clusters allowing inference to be made on the cluster membership of each star. Among our list, comprising likely members determined from photometric and kinematic surveys, we found three new non-members and confirmed the four previously identified seismic non-members by Stello et al. (2010). We found more seismic non-members in NGC 6819 despite this cluster having fewer members than NGC 6791. This could indicate issues with obtaining a clean sample of members purely from the kinematic properties of NGC 6819. However, we note that a probably significant contribution to the difference in number of identified non-members in these two clusters comes from the different selection criteria adopted for each cluster.
Finally, we highlighted that the presence of binary stars and blends needs careful investigation to avoid misinterpretation of the seismic results as well as the auxiliary standard photometry. In some cases the light curves revealed seismic signal from more than one star, which could be used to identify and to some extent disentangle signals from blends and binaries.
Future Kepler data of the so-called cluster super stamps will give access to most stars in NGC 6791 and NGC 6819, providing more comprehensive assessment of the effects from blending, and enable us to make unbiased selections of the cluster stars, which will further extend the asteroseismic analyses of these clusters. In addition, we will get short cadence data (1-minute sampling) of selected stars in NGC 6819 which will allow us to probe the interiors of the less evolved turn-off and subgiant stars.
References
- Basu et al. (2011) Basu, S., et al. 2011, ApJ, 729, L10
- Bessell & Wood (1984) Bessell, M. S., & Wood, P. R. 1984, PASP, 96, 247
- Bragaglia et al. (2001) Bragaglia, A., et al. 2001, AJ, 121, 327
- Brogaard et al. (2011) Brogaard, K., Bruntt, H., Grundahl, F., Clausen, J. V., Frandsen, S., Vandenberg, D. A., & Bedin, L. R. 2011, A&A, 525, A2
- Brown et al. (1991) Brown, T. M., Gilliland, R. L., Noyes, R. W., & Ramsey, L. W. 1991, ApJ, 368, 599
- Carraro et al. (2006) Carraro, G., Villanova, S., Demarque, P., McSwain, M. V., Piotto, G., & Bedin, L. R. 2006, ApJ, 643, 1151
- Christensen-Dalsgaard (2004) Christensen-Dalsgaard, J. 2004, Sol. Phys., 220, 137
- Dias et al. (2002) Dias, W. S., Lépine, J. R. D., & Alessi, B. S. 2002, A&A, 388, 168
- Flower (1996) Flower, P. J. 1996, ApJ, 469, 355
- Garcia et al. (2011) Garcia, R. A., et al. 2011, MNRAS, 414, 6
- Garnavich et al. (1994) Garnavich, P. M., Vandenberg, D. A., Zurek, D. R., & Hesser, J. E. 1994, AJ, 107, 1097
- Gratton et al. (2006) Gratton, R., Bragaglia, A., Carretta, E., & Tosi, M. 2006, ApJ, 642, 462
- Hekker et al. (2009) Hekker, S., et al. 2009, A&A, 506, 465
- Hekker et al. (2010) —. 2010, MNRAS, 402, 2049
- Hekker et al. (2011) —. 2011, A&A, 530, 100
- Hole et al. (2009) Hole, K. T., Geller, A. M., Mathieu, R. D., Platais, I., Meibom, S., & Latham, D. W. 2009, AJ, 138, 159
- Huber et al. (2009) Huber, D., Stello, D., Bedding, T. R., Chaplin, W. J., Arentoft, T., Quirion, P., & Kjeldsen, H. 2009, Communications in Asteroseismology, 160, 74
- Huber et al. (2010) Huber, D., et al. 2010, ApJ, 723, 1607
- Jenkins et al. (2010a) Jenkins, J. M., et al. 2010a, ApJ, 713, L120
- Jenkins et al. (2010b) —. 2010b, ApJ, 713, L87
- Kallinger et al. (2010a) Kallinger, T., et al. 2010a, A&A, 522, 1
- Kallinger et al. (2010b) —. 2010b, A&A, 509, 77
- Kjeldsen & Bedding (1995) Kjeldsen, H., & Bedding, T. R. 1995, A&A, 293, 87
- Koch et al. (2010) Koch, D. G., et al. 2010, ApJ, 713, L79
- Marigo et al. (2008) Marigo, P., Girardi, L., Bressan, A., Groenewegen, M. A. T., Silva, L., & Granato, G. L. 2008, A&A, 482, 883
- Mathur et al. (2010) Mathur, S., et al. 2010, A&A, 511, 46
- Mermilliod & Mayor (1990) Mermilliod, J., & Mayor, M. 1990, A&A, 237, 61
- Miglio et al. (2011) Miglio et al. 2011, in prep.
- Mosser & Appourchaux (2009) Mosser, B., & Appourchaux, T. 2009, A&A, 508, 877
- Mosser et al. (2010) Mosser, B., et al. 2010, A&A, 517, 22
- Mosser et al. (2011) —. 2011, A&A, 525, L9
- Origlia et al. (2006) Origlia, L., Valenti, E., Rich, R. M., & Ferraro, F. R. 2006, ApJ, 646, 499
- Pietrinferni et al. (2004) Pietrinferni, A., Cassisi, S., Salaris, M., & Castelli, F. 2004, ApJ, 612, 168
- Ramírez & Meléndez (2005) Ramírez, I., & Meléndez, J. 2005, ApJ, 626, 465
- Sanders (1971) Sanders, W. L. 1971, A&A, 15, 368
- Sanders (1972) —. 1972, A&A, 19, 155
- Skrutskie et al. (2006) Skrutskie, M. F., et al. 2006, AJ, 131, 1163
- Stello et al. (2008) Stello, D., Bruntt, H., Preston, H., & Buzasi, D. 2008, ApJ, 674, L53
- Stello et al. (2009) Stello, D., Chaplin, W. J., Basu, S., Elsworth, Y., & Bedding, T. R. 2009, MNRAS, 400, L80
- Stello et al. (2010) Stello, D., et al. 2010, ApJ, 713, L182
- Stello et al. (2011) Stello et al. 2011, ApJ in press (arXiv:1107.0490)
- Stetson et al. (2003) Stetson, P. B., Bruntt, H., & Grundahl, F. 2003, PASP, 115, 413
- Ulrich (1986) Ulrich, R. K. 1986, ApJ, 306, L37
- White et al. (2011) White et al. 2011, ApJ submitted
- Worthey & Jowett (2003) Worthey, G., & Jowett, K. J. 2003, PASP, 115, 96