EXOTIC SEARCHES AT ATLAS
We present the first results of searches for new physics with the ATLAS detector using the 2010 Large Hadron Collider proton-proton collision data at a centre of mass energy of 7 TeV. After a few months of operation, these searches already go beyond the reach of previous experiments, and start to explore new territories.
1 Introduction
This paper presents five searches for new physics in proton-proton collisions using the ATLAS detector at the Large Hadron Collider. The data were collected in 2010 at a centre of mass energy of 7 TeV. The first two searches use 3.1 pb-1 of early data, while the later three searches use the full 2010 data set with a typical luminosity of 36 pb-1.
2 Long-Lived Highly Ionising Particles
The ATLAS collaboration has performed a search for massive long-lived highly ionising particles (HIP). Some examples that may give rise to highly ionising particle signatures are Q-balls, black hole remnants, magnetic monopoles, and dyons. We have performed a model independent search. Due to their large mass, HIPs are also characterised by their non-relativistic speeds, as well as, high electric charge. We expect large amounts of energy loss through ionisation for these states. In ATLAS, HIPs would leave tracks in the inner tracking detector, matched to narrow energy loss in the electromagnetic calorimeter.
ATLAS is not able to search for HIP of all charges, masses, and lifetimes. The accessible parameter space was determined as follows. A lower charge bound of was determined by the GeV trigger threshold. The upper charge bound of was determined by delta electrons and electron recombination. An upper bound on the mass of 1 TeV was determined by trigger timing constraints. A lifetime greater than 100 ns was required to maintain narrow energy deposits. A data sample with a luminosity of 3.1 pb-1 was used.
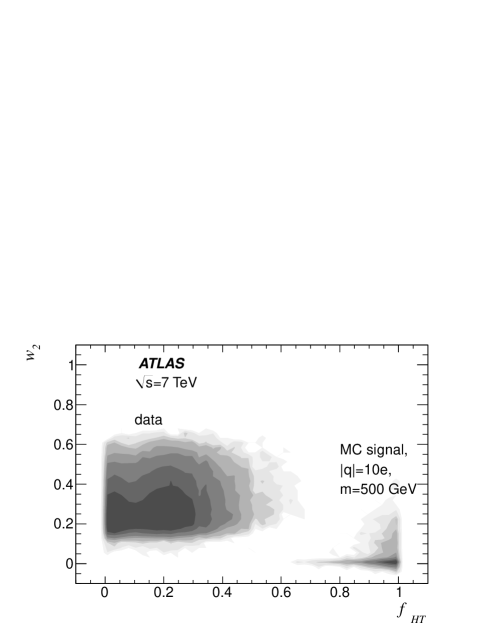
HIPs were discriminated by the proportion of high-ionisation hits and the lateral extent of the energy deposition. Specifically, the fraction of transition radiation tracker (TRT) hits on the track which pass a high ionisation threshold was used. In addition, a requirement on the fraction of energy outside the three most energetic cells associated to a selected electromagnetic (EM) energy cluster, in the second EM calorimeter layer, , was made. Figure 1 shows that the data matches Standard Model (SM) expectations, and no HIPs were observed. The estimated background in the signal region was events. Limits for particles produced in the acceptance kinematic region and by Drell-Yan production are shown in Table 1. A Bayesian statistical approach with a uniform prior for the signal was used. HIP masses above 800 GeV are probed for the first time at particle colliders.
| Mass | Inclusive Search | Drell-Yan Mechanism | ||||
|---|---|---|---|---|---|---|
| 200 GeV | 1.4 pb | 1.2 pb | 2.1 pb | 11.5 pb | 5.9 pb | 9.1 pb |
| 500 GeV | 1.2 pb | 1.2 pb | 1.6 pb | 7.2 pb | 4.3 pb | 5.3 pb |
| 1000 GeV | 2.2 pb | 1.2 pb | 1.5 pb | 9.3 pb | 3.4 pb | 4.3 pb |
3 Diphoton with Large Missing Energy
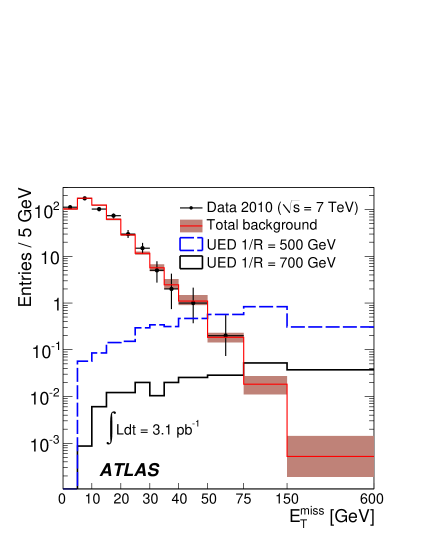
ATLAS has performed a search for events with diphotons () and large missing transverse energy . This signature has been interpreted in the context of Universal Extra Dimensions (UED). We considered a single TeV-1 sized UED with a compactification radius . In this model, the lightest Kaluza-Klein (KK) particle (LKP) is the KK photon . The KK particles are produced as pairs of KK quarks and/or KK gluons in the strong interaction. These KK particles then decay down, via KK states, to the LKP. The LKP decays by . We interpreted the results of the search using a model in which , where is the UV cutoff and is a free parameter
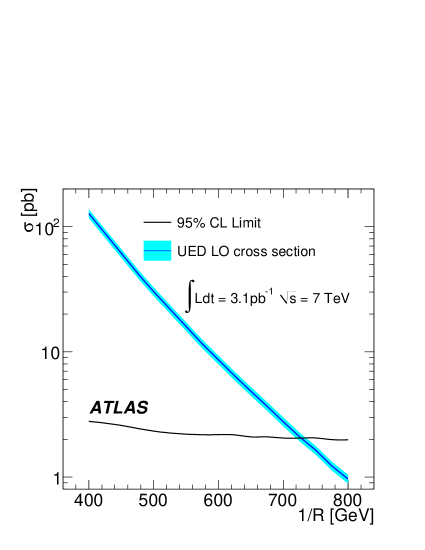
Figure 3 shows the spectrum of events with diphotons. Events were required to have two photons each with GeV, and an event GeV. Zero signal events were observed and the estimated background was events. Figure 3 shows upper limits on the cross section. The upper limits were calculated using a Bayesian approach with a flat prior for the signal cross section. It was verified that the result is not very sensitive to the detailed form of the assumed prior. In context of the previously specified model, values of GeV are excluded. This is the most sensitive limit on this model to date.
4 Search for New Physics in Dijets
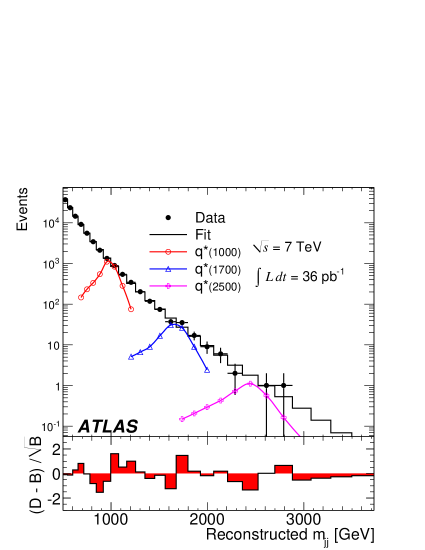
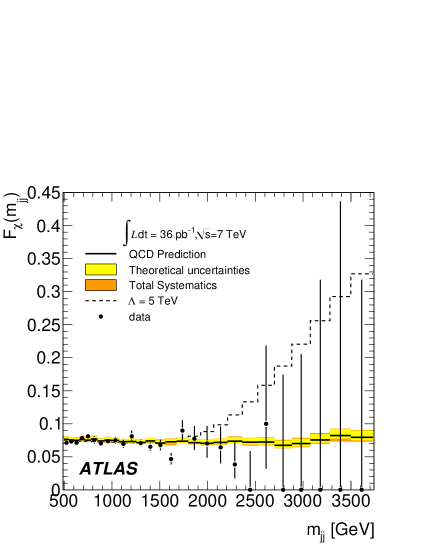
ATLAS has performed a study of dijet events using both the invariant mass of the two jets and angular distributions of energetic jets up to 3.5 TeV. For the invariant mass studies, we required GeV and GeV, as well as, . Figure 4 shows that the invariant mass distribution is smooth as expected for QCD jet production and agrees with the SM background parameterisation.
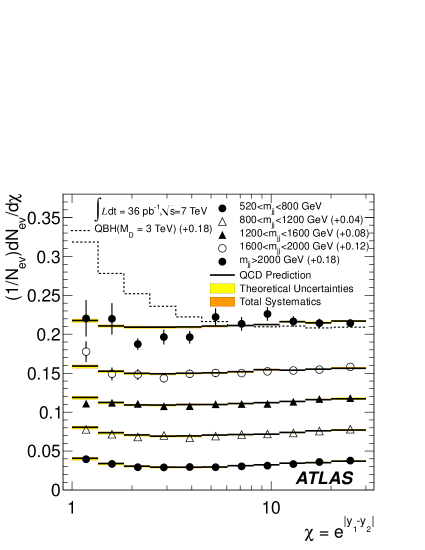
For the angular distributions, we required GeV and GeV. The rapidities of the two leading jets per event are required to satisfy and . Figure 6 shows the distributions, where . Data are consistent with QCD. We also examined the dijet centrality, where . This distribution is shown in Fig. 6.
We now interprete the results using several models, showing both the dijet mass and angular distribution results. For the resonance results, we set Bayesian credibility levels by defining a posterior probability density from the likelihood function for the observed mass spectrum, obtained by a fit to the background functional form and a signal shape derived from MC calculation. For the angular distribution results, likelihood ratios for comparing the different hypotheses and parameter estimators were used. Confidence level limits are set using the frequentist CLs+b approach.
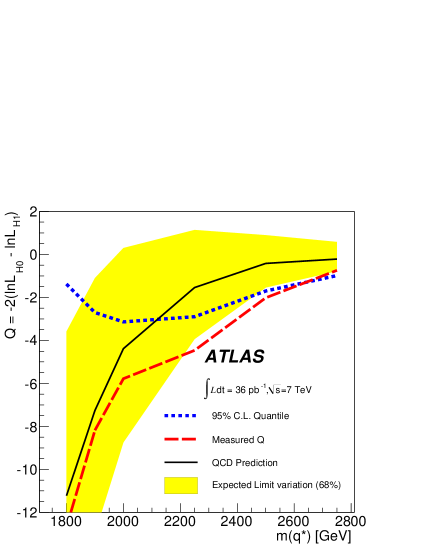
Excited quarks can be produced in and decay by , . Figure 8 shows the results of the resonance search. Excited quarks are excluded in the mass range TeV, while axigluons are excluded in the range TeV. Shown in Fig. 8 is the distribution, where , and is the null hypothesis (QCD only) and is the hypothesis for new physics. From this analysis, excited quarks in the mass range TeV are excluded.
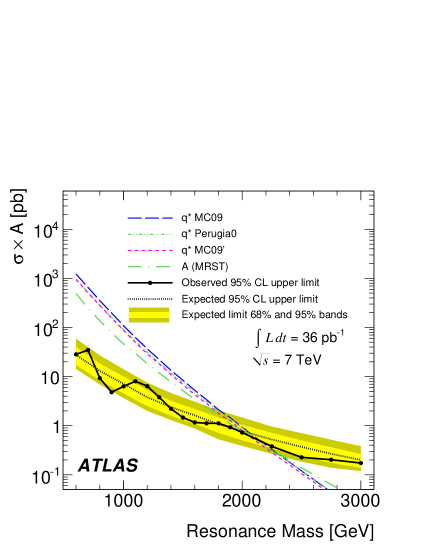
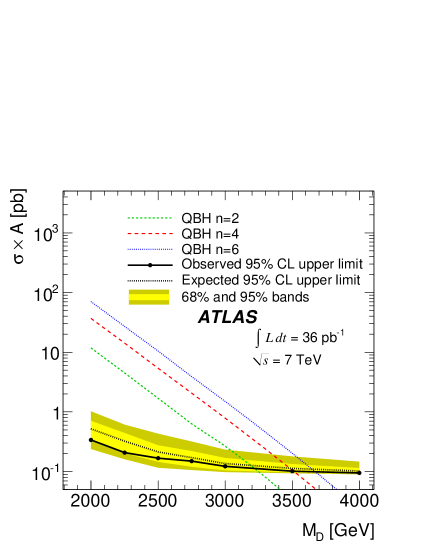
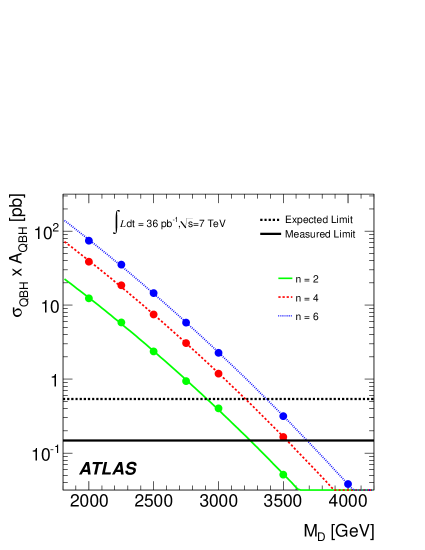
We searched for quantum black holes (QBH) decaying to dijets, where is the higher-dimensional Planck scale and is the number of extra dimensions. These states would be expected to produce a large mass threshold effect with long tails to higher masses. The results of the resonance search are show in Fig. 10. Planck scales in the range TeV are exclude. The results of the angular distributions analysis are shown in Fig. 10. From the distribution, Planck scales less than 3.69 TeV are excluded, while from the distribution Planck scales of less than 3.78 TeV are excluded.
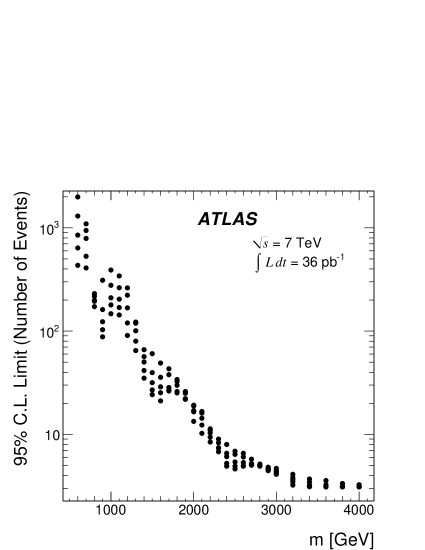
Finally, limits are given for a generic signal with a Gaussian profile. Signal templates in the range with (5 different values) were generated. The results are shown in Fig. 11. These results can be used for different models by employing the following prescription: 1) Check the validity of the Gaussian signal approximation, and determine the peak and width of the signal; 2) Determine the model acceptance; 3) Calculate the event yield for the model cross section and luminosity of 36 pb-1; 4) Compare this event yield with the limits in Fig. 11.
5 Lepton plus Missing Transverse Energy
ATLAS has performed a search for high-mass states decaying to an electron or muon with missing energy: W. The W′ is a sequential SM boson with the same SM couplings as the W-boson. The W∗ is a boson with anomalous magnetic moment type couplings. The search was performed in the transverse mass defined as . Events with electrons were chosen by requiring the electron to have GeV, and the event to have GeV and . Events with muons were chosen by requiring muons, in the barrel only, to have GeV, and the event to have GeV. Figure 12 shows the transverse mass distribution for the two channels.
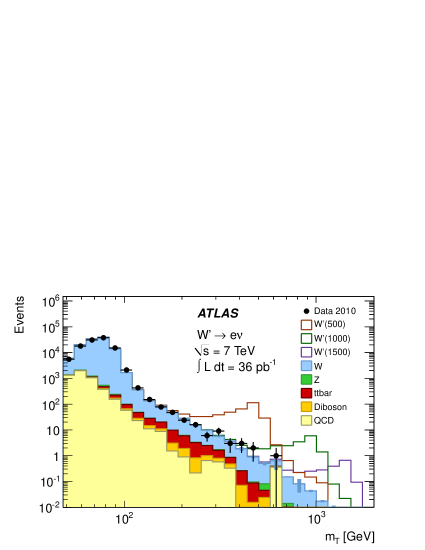
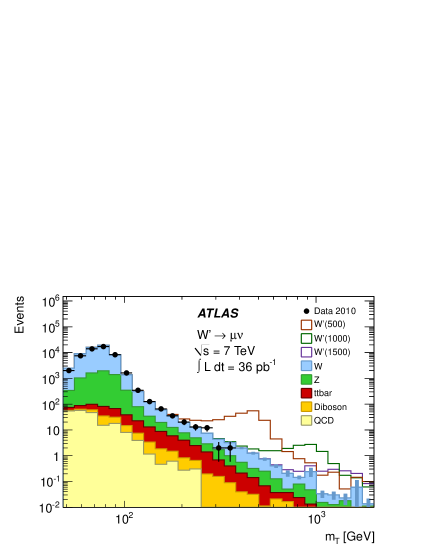
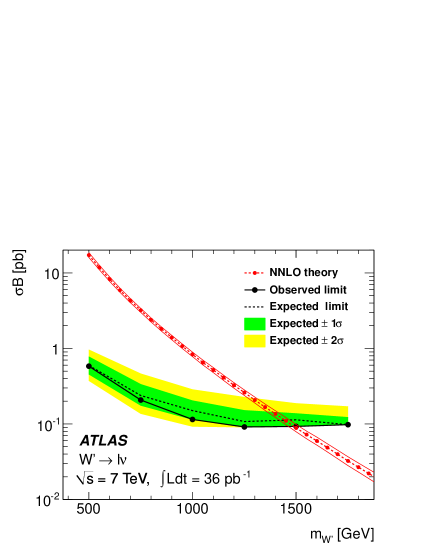
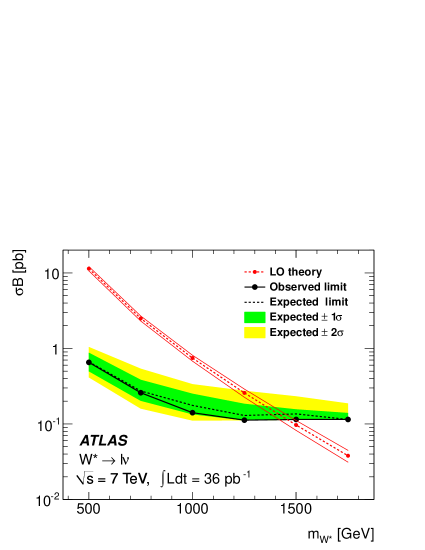
The agreement between data and the expected backgrounds is good. Limits on for each W′ and W∗ mass and decay channel are set using a likelihood function as input to the estimate . To set limits, we counted events with . Figure 13 shows the limits on the cross section times branching ratio. A W′ with mass below 1.49 TeV and W∗ with mass below 1.47 TeV are excluded.
6 High Mass Dilepton Resonances
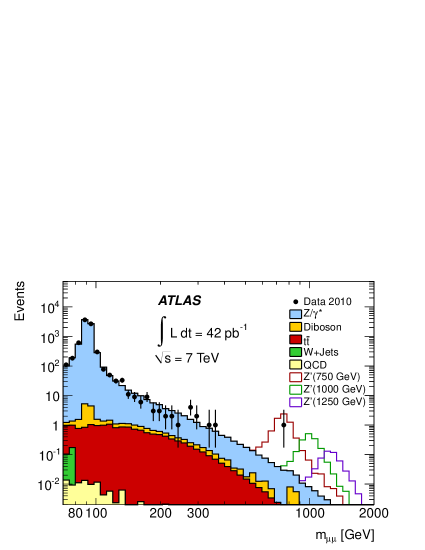
ATLAS has performed a search for high-mass neutral resonance states decaying to two leptons of the same generation. Examples of such high-mass resonances are new heavy neutral gauge bosons (Z′ and Z∗), the Randall-Sundrum spin-2 graviton, and a spin-1 techni-meson. The search looked for Z or , where Z′ is a high-mass sequential SM (SSM) gauge boson with SM couplings, or a Z′ motivated by an model. Six different motivated gauge bosons were searched for with different mixing angles between the two states. We assumed the resonance has a narrow intrinsic width compared to the detector mass resolution, and required GeV for the electrons in the dielectron channel, and GeV for the muons in the dimuon channel. Figure 14 shows the invariant mass distributions for the two decay channels.
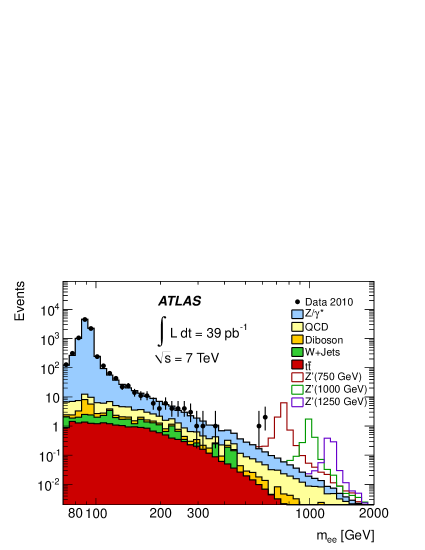
Given the absence of a signal, an upper limit on the number of Z′ events is determined using a Bayesian approach. For each Z′ pole mass, a uniform prior in the Z′ cross section was used. Figure 15 shows the limits on cross section times branching ratio for the combined decay channels. The measured and expected (shown in parenthesis) lower mass limits are 0.957 (0.964) TeV in the dielectron, 0.834 (0.895) TeV in the dimuon, and 1.048 (1.084) TeV in the combined decay channels. The lower mass limits on the gauge bosons range from 0.738 TeV (Z) to 0.900 TeV (Z).

References
References
- [1] The ATLAS Collaboration, G. Aad et al., “Search for Massive Long-lived Highly Ionising Particles with the ATLAS Detector at the LHC,” accepted by Phys. Lett. B (2011), CERN-PH-EP-2011-010, arXiv:1102.0459 [hep-ex].
- [2] The ATLAS Collaboration, G. Aad et al., “Search for Diphoton Events with Large Missing Transverse Energy in 7 TeV Proton-Proton Collisions with the ATLAS Detector,” Phys. Rev. Lett. 121803 (2011).
- [3] The ATLAS Collaboration, G. Aad et al., “Search for New Physics in Dijet Mass and Angular Distributions in Collisions at TeV Measured with the ATLAS Detector,” accepted by the New Journal of Physics (2011); CERN-PH-EP-2011-030, arXiv:1103.3864 [hep-ex].
- [4] The ATLAS Collaboration, G. Aad et al., “Search for high-mass states with one lepton plus missing transverse momentum in proton-proton collisions at TeV with the ATLAS detector,” submitted to Phys. Lett. B; CERN-PH-EP-2011-023, arXiv:1103.1391 [hep-ex].
- [5] The ATLAS Collaboration, G. Aad et al., “Search for high mass dilepton resonances in collisions at TeV with the ATLAS experiment,” submitted to Phys. Lett. B; CERN-PH-EP-2011-037, arXiv:1103.6218 [hep-ex].