X-RAY SPECTRAL STATE EVOLUTION IN IGR J170913624 AND COMPARISON OF ITS HEARTBEAT OSCILLATION PROPERTIES WITH THOSE OF GRS 1915+105
Abstract
In this work, we study the X-ray timing and spectral evolution of the transient low mass X-ray binary IGR J170913624 during first 66 days of its 2011 outburst. We present results obtained from observations with two instruments, Rossi X-ray Timing Explorer (RXTE) Proportional Counter Array (PCA) and SWIFT X-ray telescope (XRT), between 09 February, 2011 and 15 April, 2011. Using quasi-periodic oscillation classifications, power density spectrum characteristics, time-lag behavior and energy spectral properties, we determine source states and their transitions at different times of the outburst. During the first part of the evolution, the source followed trends usually observed from transient black hole X-ray binaries (BHXBs). Interestingly, a gradual transition is observed in IGR J170913624 from the low-variability SIMS, commonly seen in BHXBs, to a highvariability state with regular, repeatitive and structured pulsations, seen only from GRS 1915+105 (also known as ‘’ class variability/‘heartbeat’ oscillations). We study the time evolution of characteristic timescale, quality factor and rms amplitude of heartbeat oscillations in IGR J170913624. We also present a detailed comparison of the timing and spectral properties of heartbeat oscillations and their evolution in IGR J170913624 and GRS 1915+105.
Subject headings:
accretion, accretion disks — black hole physics — X-rays: binaries — X-rays: individual: (IGR J170913624, GRS 1915+105)1. Introduction
IGR J170913624 was detected as a bright, variable, transient source with flaring activity in October 1994 (Mir/KVANT/TTM), September 1996 (BeppoSAX/WFC), September 2001 (BeppoSAX/WFC; In’t Zand et al. (2003)), April 2003 (INTEGRAL/IBIS; Kuulkers et al. (2003)), and July 2007 (Capitanio et al., 2009). In April 2003, IBIS, the Gamma-ray imager on board the INTEGRAL satellite detected the transient Xray binary IGR J170913624 at the position of 17h09.1m (R.A. (J2000.0)), -36o24.63 (declination (J2000.0)) while monitoring the Galactic centre (Kuulkers et al., 2003). A transition between soft and hard states and the presence of a blackbody component during source softening were observed during a joint spectral analysis of INTEGRAL/IBIS and RXTE/PCA data by Capitanio et al. (2006). They found that the different spectral states, their transitions, and time variability of the source were similar to those of the black hole candidate H1743322. ek dustu haoa bhese aase The approach which is commonly used to define the spectral states of a source during an outburst evolution is based on energy spectral properties as well as power density spectral (PDS) properties including lowfrequency quasi-periodic oscillations (LF QPOs) features and classifications (Fender, Belloni & Gallo, 2004). Depending on QPO frequency, coherence and strength, three main types of LF QPOs are observed in BHXBs - type-A (weak (with few percent of rms amplitude) and broad (q-factor 3) QPO around 79 Hz; (Casella et al., 2005; Soleri et al., 2008)), type-B (relatively strong (4-7% rms amplitude) and relatively narrow (q-factor 57) QPO around 57 Hz appeared with a weak red noise (Casella et al., 2005; Soleri et al., 2008)) and type-C (strong (up to 21% rms amplitude) and narrow (q-factor 512) features with the variable centroid frequency between 0.115 Hz, superposed on a strong flat-top noise (Casella et al., 2005; Soleri et al., 2008)). Type-B QPOs are generally associated with relatively soft state or soft intermediate state (SIMS) (Belloni et al., 2005; Fender, Belloni & Gallo, 2004) while type-C QPOs carry the signature of the hard intermediate state (HIMS; (Belloni et al., 2005; Fender, Belloni & Gallo, 2004)). Along with different types of QPOs, one important difference, which has also been used in this work to distinguish the HIMS from the SIMS is that type-B QPOs always show hard lag (hard photons lag soft photons) at the fundamental QPO frequency between 57 Hz, but a type-C QPO, if detected in the frequency range 57 Hz during the HIMS, always shows soft lag at the fundamental QPO frequency (Casella et al., 2005). The low/hard state (LS) is usually characterized by strong band-limited noise where noise component can be decomposed into a few broad Lorentzian components (Belloni et al., 2005).
Lutovinov et al. (2003) found that the PDS of IGR J170913624 could be well described with the standard model of band-limited noise with the break frequency of 0.31 0.04 Hz. They fitted the energy spectrum with the power-law model having the powerlaw index of 1.43 0.03. These timing and spectral properties are commonly observed in the LS of BHXBs (Sunyaev & Revnivtsev, 2000). Using combined RXTE/PCA and INTEGRAL/IBIS data, Capitanio et al. (2006) showed that a single thermal Comptonization component (compTT in XSpec) or saturated Comptonization (compST in XSpec) or the combination of soft multi-color disk blackbody and hard power-law (diskbb+powerlaw) are good description of the X-ray spectra of IGR J170913624. However, they noticed that the model derived electron temperature was 20 keV, which was less than typical electron temperature of black hole X-ray binaries ( 50-100 keV; Zdziarski & Gierlinśki (2004)). SWIFT/XRT observations of IGR J170913624 during the outburst in 2007 revealed another state transition from hard to soft, and refined the X-ray position of this source, which is consistent with the position of the infra-red counterpart observed with the ESO New Technology Telescope (NTT) (Chaty et al., 2008) as well as compact radio counterpart in the VLA archived data (Capitanio et al., 2009).
The renewed activity of the source was first detected with the SWIFT/BAT when the hard X-ray flux (15.0-60.0 keV) increases up to 60 mCrab on 03 February, 2011 (Krimm et al., 2011a). Later using the SWIFT/XRT observation, Krimm & Kennea (2011b) confirmed that the outburst occurred in the source IGR J170913624, and not in IGR J170983628, which is also an X-ray transient 9.6 away from IGR J170913624. The INTEGRAL/IBIS also detects the source simultaneously with the SWIFT/XRT (Del Santo et al., 2011). The preliminary spectral data during the recent outburst of IGR J170913624 in 2011 showed that a soft spectral component is necessary to describe the spectrum along with the hard power-law component (Del Santo et al., 2011). Later using the data from IBIS/ISGRI imager and the JEM-X telescope on board the INTEGRAL satellite on 78 February, 2011, Capitanio et al. (2011) described the combined ISGRI and JEMX2 spectrum (5.0-300.0 keV) with a power law having the high energy cut-off at 110 keV. In spite of several efforts, little is known about the compact nature of this source or the nature of its binary companion (but see Bodaghee et al. (2012)).
From the beginning of RXTE/PCA observations on 9 February, 2011, several rich features in timing and spectral domain of the source have been noticed. QPOs at 94 3 mHz and 0.105 Hz with a quality factor of 9.1 and 7.4 respectively, were reported using RXTE/PCA observations on 9, 10, 11 and 12 February, 2011 (Rodriguez et al., 2011a) although a source contamination problem exists with the RXTE data during this period. Apart from this, fast QPO evolution (Shaposhnikov, 2011), 10 mHz QPOs (Altamirano et al., 2011a) and evolving power density spectrum with multiple peaks (Pahari et al., 2011b) were also noticed. High frequency QPO at 66 Hz (Altamirano & Belloni, 2012b) was detected with the significance of 8.5. Interestingly, a quasi-regular oscillation in the light curve of IGR J170913624 is noticed which is very similar to the ‘’ class variability seen only in the light curve of the Galactic micro-quasar GRS 1915+105 (Altamirano et al., 2011b). Later, Altamirano et al. (2011c) claimed a few more variabilities similar to those found in GRS 1915+105. Two new variabilities, which are unique to IGR J170913624, were reported by Pahari et al. (2011a). Using Chandra spectroscopy of IGR J170913624 during soft, disk-dominated state, King et al. (2012) showed that accretion disk wind is anti-correlated with relativistic jets. This disk wind was observed to be highly ionized, dense, and had typical blue-shift of 9300 km/s, or less projected along our line of sight. Dips in the X-ray intensity, which are observed in the / class of GRS 1915+105, were also found in IGR J170913624 with similar properties (Pahari et al., 2013a).
GRS 1915+105 is a Galactic micro-quasar which has shown spectacular X-ray variabilities since its discovery in 1992 (Castro-Tirado et al., 1994). Among different variability classes in GRS 1915+105 (Belloni et al., 2000), the ‘’ class shows regular, repetitive bursts in the light curve with the recurrence time between 31 sec and 106 sec. These recursive burst structures have been observed for extended duration and have been discussed by several authors (Taam et al., 1997; Paul et al., 1998; Yadav et al., 1999). Using the data from the Indian X-ray Astronomy Experiment (IXAE) on board the Indian Satellite IRS-P3, as well as RXTE, Yadav et al. (1999) showed that these bursts which could be categorized as irregular, quasiregular and regular bursts have a slow exponential rise and sharp decay. Using flux-resolved spectroscopy, Pahari et al. (2013b) showed that large, repeatitive oscillations in GRS 1915+105 appeared on the top of persistent emission, are consistent with the slim accretion disk approximations. Using the BeppoSAX data, Massaro et al. (2010) concluded that the process, responsible for the pulses, produces strongest emission between 3.0 and 10.0 keV, and the emission at the rising phase of the pulse dominates the lower and higher energies. However, this hypothesis is not tested. Hence the consensus on the resolution of the issue with the origin of ‘’ class activity in GRS 1915+105 is yet to achive. The similarity of the class of GRS 1915+105 with the variability observed in IGR J170913624 motivates us to perform a detailed analysis of the current outburst of IGR J170913624.
In the present work, we consider all observations of IGR J170913624 between 09 February, 2011 and 15 April, 2011 with the RXTE/PCA and the SWIFT/XRT. We have analyzed both timing and spectral properties of the source after confirming that the contamination from the nearby source IGR J170983628 is usually very small. In section 2 we describe our analysis methods. Section 3 summarizes results regarding the hard and soft intermediate state, a fast source evolution and the transition to a ‘’-like class via an intermediate variability state, observed from IGR J170913624. Finally we compare the timing and spectral properties of the ‘’-like class in IGR J170913624 with the ‘’ class characteristics seen from GRS 1915+105, and discuss their implications in section 4. We give our conclusions in section 5.
2. Observations and Data Analysis
We analyze all RXTE/PCA observations of IGR J170913624 between 9 February, 2011 (MJD 55601) and 15 April, 2011 (MJD 55666). Due to insufficient good time intervals and inferior quality, we are unable to extract the background data file for all High-Energy X-ray Timing Experiment (HEXTE; Rothschild et al. (1998)) observations. Hence, we use only the RXTE/PCA Standard-2 Science Array data and event mode GoodXenon data for our analysis. Observation details are given in Table 1. We also analyze five RXTE/PCA observations of GRS 1915+105 between 26 May, 1997 and 22 June, 1997 when the source was in ‘’ class. RXTE/PCA consists of an array of five proportional counters (PCU0-4) filled with Xenon gas, with total effective area of 6500 cm2, operating in 2.0-60.0 keV energy range (Jahoda et al., 1996). We use data observed with all Xenon layers of PCU2. During the start or the stop of any PCU unit, many observations show large count rate fluctuations in the light curve due to the instrumental effects. To take care of that, we first create xte filter file for each PCA observation and calculate good time interval (GTI) from the exposure time by applying all standard filtering criteria including breakdown events. Calculated values of good time interval are provided in Table 1. Using GTI values of individual observation, we extract background subtracted light curve from GoodXenon data having resolution of 125 s. Observations with the background subtracted PCA intensity 15 cts.s-1PCU-1 are considered.
We also analyze 28 archival data sets of SWIFT/XRT between 03 February, 2011 and 30 March, 2011. The XRT instrument on board SWIFT satellite has the effective area is 110 cm2 at 1.5 keV, the position accuracy is 5 arc sec and is operating in 0.2-10.0 keV energy range (Burrows et al., 2005). The typical spectral resolution of this instrument is 140 eV at 6.0 keV. To avoid pile-up problem while observing luminous X-ray sources, all observations (except the first one) are performed with Windowed Timing (WT) mode which has time resolution of 2.2 ms and flux limit of 600 mCrab ( 200 cts/s) (Mineo et al., 2006). For our analysis, we use level 2 cleaned event data which has been extracted from level 1 calibrated data after applying screening criteria on specific parameters like CCD Temperature, Sun Angle, Elevation Angle etc. For all WT mode data, we assign grade 0-2 and selected good event with STATUS==b0. We extract source and background light curves and spectra separately using xselect v2.4b in FTOOLS 6.10.
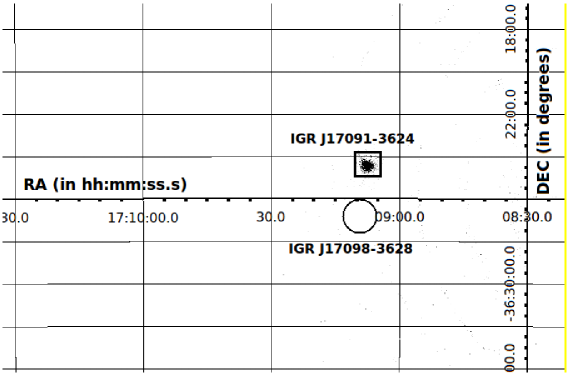
Top panel of Fig. 1 shows the background-subtracted average RXTE/PCA count rate between 2.0-60.0 keV, while middle panel shows the background-subtracted average SWIFT/XRT count rate between 0.3-10.0 keV. HIMS & SIMS, intermediate variable state (IVS) and variable state are shown by open circles, stars and triangles respectively in the top and bottom panels of Fig. 1 while all SWIFT/XRT observations are shown by solid circles in the middle panel. During first 14 days of observation, IGR J170913624 was within the field of view of persistently luminous Z-type neutron star low mass X-ray binary GX 349+2 (17h05m44.49s (R.A. (J2000.0)), -36o25.38 (declination (J2000.0))). As a consequence, very high PCA count rate was observed in first 14 days of observation compared to the rest. Therefore, in our present work, we consider PCA observations from 23 February, 2011 onwards (observations falls right to the first vertical dotted line in the top panel of Fig. 1) to avoid the contamination effect. Further to check possible contamination from IGR J17098-3628, a transient BHXB located 9.6 away from IGR J170913624, we analyse background-subtracted image from SWIFT/XRT PC mode data in the energy range 0.3-10.0 keV (Fig. 2). With SWIFT/XRT, no X-ray source has been detected at the position of IGR J17098-3628 (shown by a circle), but is clearly detected at the position of IGR J170913624 (shown by a square). This is consistent with earlier results (Krimm & Kennea, 2011b). For a quantitative measurement, we calculate the count rate separately from the position of IGR J170913624 and from the position of IGR J17098-3628. For the energy range 0.3-10.0 keV, their values are 2.023 cts/s and 0.213 cts/s respectively on 3 February, 2011. So, at maximum, the intensity of IGR J17098-3628 is 10% of IGR J170913624. Since, RXTE/PCA could not spatially resolve these sources, it is expected that at maximum 10% contamination effect would be present in RXTE/PCA data of IGR J170913624.
2.1. Timing Analysis
For each PCA observation we create rms normalized and white noise subtracted power density spectrum (PDS) to study variability features and to track the spectral evolution of the source state with time. The dead time corrections are applied to the light curves. For GoodXenon data, the dead time per event is approximately 10 s. For details of the procedure, please check RXTE cookbook111http://heasarc.nasa.gov/docs/xte/recipes/pca_deadtime.html. To improve the signal-to-noise ratio in the PDS, we use the geometric re-binning of frequency bins by the factor of 1.02222http://heasarc.nasa.gov/xanadu/xronos/help/powspec.html. The expected white noise is subtracted from the PDS2 and they are normalized such that their square root of integral over the range of frequencies provide fractional rms variability. We produce PDS from the SWIFT/XRT data using background subtracted light-curve between 0.2-10.0 keV energy range. Since one can not compare the 2.0-60.0 keV PDS from the PCA data with 0.2-10.0 keV PDS from SWIFT/XRT data, hence we extract only SWIFT/XRT PDS for observation dates when no RXTE/PCA data are available. Different types of QPOs and noise components are noticed in the PDS of different RXTE/PCA observations. The details of PDS features are given in Table 1.
2.2. Spectral Evolution
The color-color diagram (CD), the hard color vs. soft color plot and the hardness intensity diagram (HID) are created using the PCA GoodXenon data with 1.0 s bin time. The soft color is computed by dividing the background subtracted PCA count rates in the energy band 5.0-12.0 keV by that in the energy band 2.0-5.0 keV. Similarly, the hard color is defined as the ratio of the background subtracted count rate in the energy band 12.0-60.0 keV and 2.0-5.0 keV. X-ray intensity is defined as the background subtracted PCA count rate in 2.060.0 keV energy range. Since the channel gain varies from epoch to epoch, we use absolute channel ranges corresponding to each of the energy ranges to calculate soft color, hard color and X-ray intensity for the present epoch. For each RXTE/PCA observation, mean count rate (top panel of Fig. 1), and mean value of hard color and soft color are provided in Table 1 with errors.
2.3. Spectral Fitting
In case of RXTE/PCA, we perform the spectral analysis using the Standard-2 data. While fitting, we add 1% systematic errors. In case of SWIFT/XRT data, we first extract an 1D image of the source. Then choosing suitable source region and background region, we extract source spectrum and background spectrum separately from the cleaned and pointed WT mode event file. We use the latest standard response matrix file (rmf) and create auxiliary response file (arf) using exposure map for the WT mode data between 0-2 grade values. We use XSpec v 12.6.0 for spectral fitting of RXTE/PCA and SWIFT/XRT data. We use 3.025.0 keV energy range for RXTE/PCA spectral analysis since the source count rate statistics is poor outside this range. We use SWIFT/XRT spectra in the energy range of 0.610.0 keV.
We have tried different single component models like diskbb, compTT or powerlaw as well as dual component models like diskbb+powerlaw, diskbb+compTT or compTT+powerlaw to fit the source spectra. The reason for selecting and testing different models is discussed in § 1. We find that the single SWIFT/XRT spectrum could be fitted well with a combination of diskbb and/or powerlaw model. Fitting with the rest of the model combination yields unacceptably large reduced ( 1.5) or sometimes over-fit the spectra due to large no. of parameters. This is also true for RXTE/PCA spectra. Using INTEGRAL energy spectra, high energy cut-off ( 30 keV) has been detected in this source (Rodriguez et al., 2011b). A broadband BHXB spectrum, during a SIMS or HIMS, should be well described also by a combination of disk and Comptonization. Since we restrict our RXTE/PCA spectral analysis to 25 keV, we are unable to detect cut-off or Comptonization where electron temperature is pretty high. Thus, a relatively simple model can describe our spectra well. It may be noted that Remillard & McClintock (2006) showed that RXTE/PCA spectra in transient BHXBs can be well described with a multi-temperature disk blackbody emission and a hard power-law emission with/without cutoff. While fitting RXTE/PCA spectra, we use a small Gaussian component at 6.4 keV in order to improve the reduced . To account the effect of absorption by the neutral Hydrogen, all model components are multiplied by a photo-electric absorption model. The Galactic absorption column density at the direction of 17h11m12.5s (R.A. (J2000.0)), -36o24.6 (declination (J2000.0)) is calculated as 0.79 1022 cm-2. From spectral analysis, we find that for all observations, absorption column density varies between 0.82 0.2 and 0.99 0.3. Thus we keep this value fixed at 0.9 1022 cm-2 for all spectral fitting.
3. Results
SWIFT/XRT observations of IGR J170913624 show a transition of the source from the low count rate variability to the high count rate variability (see lower top panel of Fig. 1). Later, a gradual transition in the variability, i.e., from an irregular, less-variable state, to a regular, repetitive and large variability state has been observed. The large variability looks very similar to the unique variability observed during the ‘’ class in GRS 1915+105 (Altamirano et al., 2011b). This motivates us to perform a detailed study on the source spectral state evolution and compare it with that of GRS 1915+105. To distinguish among variability classes, we perform the count rate fractional rms analysis of different observations (by dividing the square root of the variance with the mean count rate) from RXTE/PCA which is shown in the bottom panel of Fig. 1. Later, comparing with timing and spectral properties, we show that observations which have fractional rms values less than 5 are consistent with the HIMS and SIMS, and observations with fractional rms significantly higher than 5 are consistent with the variable state/-like class. A few observations show the transition between soft intermediate state and variable state/-like class, and hence described as ‘Intermediate variable state (IVS)’. The details are discussed below.
3.1. Low/hard state, hard intermediate and soft intermediate state
From 14 February, 2011 to 24 February, 2011, a gradual rise in the SWIFT/XRT flux between 0.3-10.0 keV is observed in IGR J170913624 (see middle panel of Fig. 1). Till 14 February, 2011, average SWIFT/XRT count rate was 10 cts/s. Then it gradually increases to 45 cts/s on 24 February, 2011. To check whether this rise in flux led to any state transition, we perform a detailed study on timing properties of the source using SWIFT/XRT data. From 09 February, 2011 to 18 February, 2011 the PDS usually show band-limited noise, sometimes with the rms amplitude as strong as 9% (see Table 1) and can be decomposed into multiple broad Lorentzians. Apart from this, a break in the PDS is observed once at 0.19 Hz. Broad but strong QPO-like features are observed at least twice at 0.2 Hz (with Q-factor 2; see Table 1). All these features in the PDS can easily be associated with the low/hard state (LS) (Belloni et al., 2005). On 20 February, 2011, a type-C QPO at 0.51 Hz along with the strong flat-top noise ( 7% rms) is observed in the PDS, which carries the signature of the hard intermediate state (HIMS). This imply that the source undergoes state transition from the LS to the HIMS. On 22 February, 2011, a broad Lorentzian (quality factor 2) is observed at 1.8 Hz along with weak red noise (2-3% rms) in the SWIFT/XRT spectra which may indicate that the source undergoes another transition from the HIMS to the soft intermediate state (SIMS). Detection of the type-B QPO on 23 February, 2011 using RXTE/PCA (see Table 1) confirms the transition (Belloni et al., 2005). Rodriguez et al. (2011b) also observed the LS/HIMS to SIMS transition based on the detection of optically thin radio emission on MJD 55623.57 (03 March, 2011). From 24 February, 2011 to 13 March, 2011, the source usually shows back and forth transition between the HIMS and the SIMS with the usual detection of type-C and type-B QPOs respectively (see Table 1). In Fig. 3, we have shown example of the HIMS observed on 26 February, 2011 and the SIMS observed on 03 March, 2011. Top panels show the PDS where the HIMS shows strong flat-top noise ( 8% rms amplitude) with a strong type-C QPO at 3.73 0.09 Hz but the SIMS show weak red noise ( 3% rms amplitude) with a transient type-B QPO at 4.85 0.08 Hz. For more accurate determination of the state, we perform time-lag analysis between the the soft energy band (1.84.2 keV) and the hard energy band (5.013.0 keV) using GHATS v1.0.2 (T. Belloni, private communications) where the lag formulation is based on cross-spectra technique. At the fundamental QPO frequency, HIMS shows the soft-lag (soft photons lag hard photons) of 8 msec (middle left panel of Fig. 3) while the SIMS at the fundamental QPO frequency shows hard-lag of 22 msec (middle right panel of Fig. 3). In both panels, lags at the fundamental QPO frequency are shown by dotted vertical lines. These observations are in fine tune with the characteristics of these states.
We also carry out energy spectral analysis of observations between 09 February, 2011 and 25 March, 2011 respectively. From the fitted parameters in Table 2, we find that disk component is not significant while fitting the spectra observed between 09 February, 2011 and 20 February, 2011. A single power-law can adequately describe these spectra. From 20 February, 2011 onwards a soft disk component is essentially present in all spectral fitting and the power-law becomes steeper (see Table 2). This indicate that a hard-to-soft state transition takes place. This is consistent with the PDS characteristics where the transition from the LS/HIMS to the SIMS is observed. An example of RXTE/PCA spectral fitting of the HIMS and the SIMS are shown in the bottom left and bottom right panel of Fig.3 respectively. From Table 2, it is clear that all low flux state observations (till 19 February, 2011) have photon index value less than 1.8 and no disk component is present at the detectable limit of SWIFT/XRT. These along with the detection of band-limited noise meet the criteria of a low/hard state as observed in transient BHXBs (Homan & Belloni, 2005; Remillard & McClintock, 2006; Belloni et al., 2005). However, a single power-law still provides a good fit (an F-test between powerlaw and diskbb+powerlaw models yields a probability of 1.7 x 10⁻¹⁰) of the energy spectra on 20 February, 2011, where the LS to the HIMS transition is observed. Insignificant disk contribution during this transition is may be either due to very low disk flux of the source or very low temperature of the disk ( 0.6 keV). Disk flux contribution is 10-20% of the total flux in other HIMS where disk is detected significantly (see Table 2).
It may be noted that the X-ray spectral state transition is observed between 18-22 February, 2011 is based only on SWIFT/XRT data in the energy range 0.2-10.0 keV since there are no simultaneous observation of RXTE/PCA between 9-22 February, 2011. Hence the robustness of the result, based on XRT PDS, cannot be established confidently although it is consistent with the detection of radio flares on MJD 55601.3 and 55605.6 (Rodriguez et al., 2011b) and show correct trend in spectral evolution, usually observed from normal transients (Homan & Belloni, 2005; Belloni et al., 2005). Due to this ambiguity, we put question marks in first five observations of state classification column in Table 1, where PDS features are not clear. However, our spectral analysis agrees well with spectral parameters obtained from the joint spectral analysis of INTEGRAL/IBIS and SWIFT/XRT data by Capitanio et al. (2012). The relatively small difference between both results may be due to the (1) use of cutoff power-law (where cutoff energy 70 keV, see Table 1 of Capitanio et al. (2012)) (2) different absorption column density (1.1 0.3).
The outburst evolution of the source through the LS, HIMS & SIMS and frequent to and fro transition between the HIMS and the SIMS (see Table 1) indicate that the disk is unstable and the evolution pattern roughly follows the outburst evolution observed in normal transient BHXBs (Homan & Belloni, 2005; Belloni et al., 2005).
3.2. Intermediate variable state
During the continuous monitoring of the PCA light curve in IGR J170913624, we find a gradual transition in the count rate variability pattern from 12 March, 2011 to 19 March, 2011 in the energy range 2.0-60.0 keV. On 12 March, 2011, the source was in the SIMS when the light curve is less variable and very similar to the typical light curves seen in canonical BHXBs (see the top left panel of Fig. 4). On 19 March, 2011, the light curve shows a very regular repetitive pattern, high variability (peak count rate 34 times higher than the count rate at the persistent level; see lower-middle left panel of Fig. 4), and high count rate fractional rms (see bottom panel of Fig.1). We denote it by variable state/-like class. Observations of average count rate that belong to the HIMS/SIMS and variable state/-like class are separated by a dashed vertical line in Fig. 1.
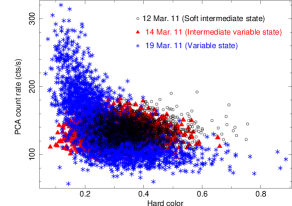
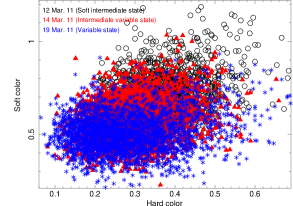
The transition between the SIMS and the variable state occurs through some semi-oscillatory intermediate stage on 14 March, 2011. The random noisy pattern which is observed during the SIMS on 12 March, 2011, appears to be superimposed on an X-ray intensity oscillation with the timescale of 80100 sec in the light curve on 14 March, 2011 (upper-middle left panel of Fig.4). The superimposed pulsations on random fluctuations are called intermediate variable state (IVS). Although these intermediate phases are transient but it has been observed few times like on 18, 23, 24 & 26 March, 2011, when the source oscillates between the SIMS like random fluctuations and the highly variable -like pulsations (see Table 1). The rms normalized PDS during the IVS show characteristic oscillations in the frequency range of 1114 mHz with a variable quality factor between 39. They are usually associated with very weak red noise having rms amplitude 2-4% and weak, narrow QPOs (see Table 1 and upper-middle right panel of Fig. 4). The IVS on 24 March, 2011 shows broad Lorentzian noise along with a type-A QPO at 8 Hz. Recently, a 11 mHz oscillation is discovered in the PDS using Chandra data during the HIMS in the BHXB H1743-322 (Altamirano & Strohmayer, 2012a). However, the origin of 11 mHz oscillations in both sources may be different. From the middle right panels of Fig. 4, it is clear that IVS is distinctively different from the variable state/-like class because (1) mHz pulsations in the IVS never show harmonics which, on the other hand, is frequently observed in variable state (lower middle right panel of Fig. 4). The absence of harmonics in the IVS may be due to very low count rate statistics associated with the PDS. (2) The characteristic oscillation frequency of the variable state is always higher than that of IVS and (3) rms amplitude of the continuum in variable state ( 10-15%) is significantly higher than that of the IVS (57 %). The term ‘intermediate’ is used as it is observed between the SIMS, where no mHz QPOs are observed (top right panel of Fig. 4), and the -like class where very strong mHz oscillations are noticed. Thus, IVS can be treated as the beginning of the -like class in IGR J170913624. To trace any change in spectral state during this transition, we plot the HID (bottom left panel of Fig. 4) and the CD (bottom right panel of Fig. 4). From the CD and the HID it may be noted that both IVS and SIMS nearly coincide with each other (shown in red and black) while the variable state shows a softer and brighter part (shown in blue) which is absent in both SIMS and IVS. Hence, IVS has similar characteristics of SIMS with large amplitude oscillations superimposed to random fluctuations. The energy spectral analysis of the IVS between 3.025.0 keV on 14 March, 2011 shows that the spectrum can be well fitted by the diskbb+powerlaw model which shows parameters similar to the SIMS. Using numerical solutions, Janiuk & Misra (2012) noticed that the limit cycle oscillations are observed when the viscosity fluctuation amplitude are small in an unstable disk. The pulsating behavior disappears and random fluctuations are restored when stochastic fluctuation amplitude exceeds a critical limit. However, random fluctuations and mHz oscillations can also co-exist. This model can explain results qualitatively from Fig. 4.
3.3. Variable state/-like class
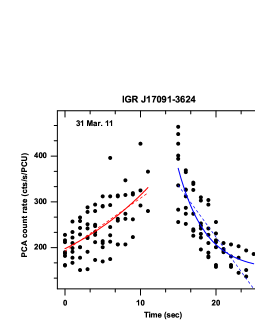
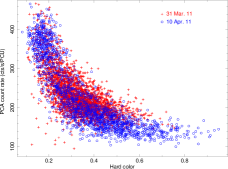
The new variable state/-like class remains stable for almost 25 days (19 March, 2011 12 April, 2011; see Table 1) except 23, 24, 25 & 26 March, 2011. The recurrent time scale of this variability is found to change with time. Fig. 5 shows the evolution of the source via five RXTE/PCA light curves from 19 March, 2011 to 10 April, 2011. On 19 March, 2011, the variability timescale of recursive bursts is 33.8 sec and the ratio of peak count rate to the persistent level count rate is 2.92 0.05. These bursts have simple profiles with slow-rise and fast-decay. Light curves in Fig. 5 show that, as these bursts evolve with time, flaring frequency roughly increases. On 10 April, 2011, the recurrence time scale of the variability becomes 21.7 sec. and the burst becomes more structured. The ratio of peak count rate to the persistent level count rate becomes 3.380.06. Careful observation of burst profiles in Fig. 5 reveals two unique burst structures (1) Burst profile seen on 31 March, 2011 have a single peak and the count rate rises slowly ( 30 sec) to the peak of the burst. (2) Burst profile seen on 03 April, 2011 can be characterized by double peak and show faster rise in count rate ( 15-20 sec). This behavior and the variation in burst profile structures of the source has so far been seen in the ‘’ class of GRS 1915+105. From Table 1, it is clear that -like variabilities in IGR J170913624 becomes stronger (i.e., rms amplitude of characteristic oscillations increases from 6% to 32% ) and faster (i.e., recurrence timescale decreases from 80 sec (on 24 March, 2011) to 22 sec (12 April, 2011)) with time.
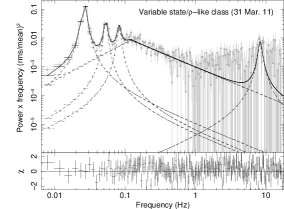
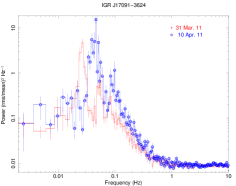
For each variable state observation, we fit the PDS continuum with the broken powerlaw model (since low frquency break is prominent; see top panel of Fig. 6) and we use Lorentzian to fit characteristic pulsation peaks and broad noise components. From Table 1, PDS fit shows that most of the time, the characteristic pulsation frequency appears along with the first harmonic (e.g., 30 and 62 mHz on 19 March, 24 and 50 mHz on 29 March etc.), a few times with both first and second harmonics (e.g., 31, 63 and 110.4 mHz on 20 March, 34, 68 and 110.2 mHz on 02 April etc.). We also detect type-A QPOs around 79 Hz during this state. An example of fitted PDS during variable state on 31 March, 2011 is shown on the top left panel of Fig. 6. In the bottom left panel of Fig. 6, we show the time evolution of characteristic oscillation frequencies of class in both IGR J170913624 and GRS 1915+105. This panel indicates that IGR J170913624 shows faster time evolution of characteristic pulsation frequency than that of GRS 1915+105 by a factor of 1.3 (measured by the change in characteristic oscillation frequencies in the given period provided in the bottom left panel of Fig. 6).In order to check how these recurrent bursts loose their quality factors with time, we plot the q-factor and fractional rms amplitude (%) of the variable state characteristic oscillations with time in the top right panel of Fig. 6. It shows a random fluctuation in the q-factor, which is, unrelated with the fractional rms amplitude as well as the pulsation period. A closer inspection show that from day 20 onwards, the quality factor of characteristic pulsations overall drops by a factor of 6, while during the same time, fractional rms amplitude roughly increases. Thus, highly coherent characteristic pulsations in the variable state/-like class seem to be changed into the broad Lorentzian component at the end of their evolution. This is also reflected from the PDS fit on 15 April, 2011 (see Table 1) when multiple broad Lorentzian components appear during the transition from the -like class to some other variability classes (may be similar to the / class in GRS 1915+105). A correlation is observed between the pulsation frequency of characteristic oscillations and its fractional rms amplitude (%) (shown in bottom right panel of Fig. 6) with the Pearson product moment correlation coefficient (PMCC) of 0.91 (Sheskin, 2003).
In the following section, we explore other properties of the variable state/-like class and compare them with those of GRS 1915+105.
3.3.1 Properties of variable state/-like class in comparison to GRS 1915+105
As the variable state/-like class in IGR J170913624 looks similar to the ‘’ class of GRS 1915+105, we make a comparative study between them.
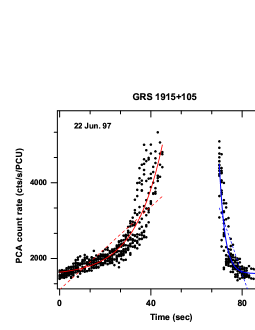
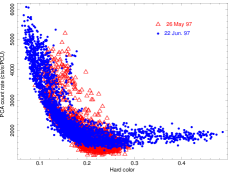
All panels of Fig. 7 show the 2.0-60.0 keV light curve in both sources. To track the change in variability pattern, we consider two observations of variable state/-like class in IGR J170913624 which show transition from the slow variability & low peak flux (31 March, 11; top left panel of Fig. 7) to the fast variability & high peak flux (10 April, 11; bottom left panel of Fig. 7). Similar transition from the slow variability & low peak flux on 26 May, 1997 (top right panel of Fig. 6) to the fast variability & high peak flux on 22 June, 1997 (bottom right panel of Fig. 7) is also observed in GRS 1915+105. However, it is interesting to observe that the average peak count of bursts in GRS 1915+105 increases significantly while transiting from the slow variability to the fast variability ( 4000 cts/s/PCU to 5000 cts/s/PCU) while it is increased slightly ( 400 cts/s/PCU to 430 cts/s/PCU) in IGR J170913624 during the variable state/-like class. It may be noted that the variability in IGR J170913624, although repetitive, is irregular, less structured (as the source is fainter than GRS 1915+105) and less coherent (i.e., q-factor is lowered by a factor of 1.41.8) compared to the ‘’ class of GRS 1915+105. In both sources, double-peak bursts are more frequent during fast variability regime.
Previously, a strong anti-correlation between the X-ray intensity and the hardness ratio (defined as the ratio of count rate between 12.0-60.0 keV and 2.0-12.0 keV) is found in the ‘’ class of GRS 1915+105 (Yadav et al., 1999). This anti-correlation is also found in the variable state/-like class of IGR J170913624. Fig. 8 shows the comparative result on the anti-correlation found in IGR J170913624 on 31 March, 2011 (top and bottom left panels) and in GRS 1915+105 on 22 June, 1997 (top and bottom right panels). It is clear that at every second on burst profile, the hardness ratio is higher in IGR J170913624 than that observed in GRS 1915+105.
To study the nature of bursts in details, we study the rise and decay profiles from both sources. Top left panel of Fig. 9 shows the combined rise profiles of several bursts and combined decay profiles of same bursts in IGR J170913624 on 31 March 11. To study the average behaviour of rise profiles, we normalize the starting time of each profile to 0 sec. Similarly, to study the average behavior of decay profiles, we normalize the starting time of the decay of each profile to 15 sec. We repeat the same procedure for the class observation in GRS 1915+105 on 22 June, 1997 (shown in the top right panel of Fig. 9) except for the fact that the staring time of each decay profile is normalized to 70 sec. We fit the combined rise profile with exponential rise function frise(t) = ae (red continuous line), the combined decay profile with exponential decay function fdecay(t) = ae (blue continuous line) and all profiles with straight line (red and blue dotted line). In case of GRS 1915+105, exponential function fits better than straight line in both rise and decay profile with the significance of 10 and 8 respectively, where the significance is estimated using F-test. For IGR J170913624, the corresponding significance values are 3.2 and 5.1 respectively. The slope of the exponential function, for both rise and decay, are found similar in both sources (see Table 3). If burst structures depend on physical processes associated with the origin of the bursts (Neilsen et al., 2012), then our results indicate that the origin of burst structure may be similar in both sources. We also study energy-dependent light curve variance spectra in both sources during their ‘heartbeat’ oscillations. The variance spectrum in IGR J170913624 on 31 March, 2011 (bottom left panel of Fig. 9) shows that lightcurve variance decreases monotonously with energy. However, the variance spectrum in GRS 1915+105 on 22 June, 1997 (bottom right panel of Fig. 9) shows an initial increase in variance with the energy till 6 keV, then it decreases significantly, at least, up to 14 keV. This is remarkable as it may indicate that although similar parameter may trigger bursts in both sources, the spectroscopic evolution of the bursts is different, which, however, need to explore further.
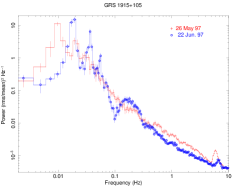
Top panels of Fig. 10 show that the low frequency (0.110.0 Hz) continuum power, characteristic pulsation & its harmonics and the nature of low frequency noise components are similar during class in both sources. White noise subtraction is not applied only for PDS shown in the top panels of Fig. 10. High frequency power in noise continuum becomes very weak above 1 Hz in case of IGR J170913624 (top left panel of Fig. 10 and top right panel of Fig. 4) although type-A/type-B QPOs are observed few times in the PDS. On the other hand, the strong, powerlaw like noise continuum in GRS 1915+105 continues at higher frequencies (at least up to 10 Hz; top right panel of Fig. 10) along with a type-B QPO at 6.70.4 Hz (middle right panel of Fig. 10). Interestingly, the 6.70.4 Hz type-B QPO in GRS 1915+105 also has the harmonic at 13.20.8 Hz with the quality-factor of 3.80.4 (middle right panel of Fig. 10). Along with characteristic heartbeat oscillations, IGR J170913624 show 710 Hz type-A QPOs on 24, 25, 31 March, 2011 and 03 April, 2011 (see Table 1) and type-B QPO once at 5 Hz on 12 April, 2011 (see Table 1). May be because of statistical limit, harmonics in type-A/type-B QPOs are not visible in IGR J170913624. An example of type-A QPO observed during the -like class on 31 March, 2011 at 8.4 Hz, is shown in the middle left panel of Fig. 10. Harmonics at mHz frequency are seen in both sources. Lower panels of Fig. 10 show the comparative study of the HIDs between two sources. We find similar trend in the HID evolution but different range in hard color for both sources. Results on comparative study of both sources are summarized in Table 3.
During 2011 outburst, IGR J170913624 evolves from the LS/HIMS to the SIMS state and finally from the SIMS to the variable state/-like class (similar to class in GRS 1915+105) as X-ray flux increases (see Table 1 of Capitanio et al. (2012) and Table 1 & 2 from our analysis). Detection of accretion disk wind as well as quenching of radio emission during disk dominated state may suggest that IGR J170913624 is approaching the high soft state (King et al., 2012; Rodriguez et al., 2011b).
According to the X-ray observations, IGR J170913624 passes through the SIMS state during radio flares observed on MJD 55623.57 (Rodriguez et al., 2011b). Generally, HIMS to SIMS transitions are followed by Radio flares (Belloni et al., 2005). Following the SIMS, large amplitude X-ray oscillations appear via the intermediate variable state and continues for 25 days (MJD 55638 MJD 55663). Similarly, GRS 1915+105 was in the HIMS state during 26 March, 1997 8 May, 1997 (Rao et al., 2000) and the X-ray class activity started on 26 May, 1997 and continue till 25 June, 1997 (Yadav et al., 1999). Between these periods (i.e., 8-26 May, 1997), for a short time, GRS 1915+105 showed Radio flare on 15 May, 1997 (Mirabel et al., 1998). We analyse and fit the RXTE/PCA PDS on 13 May, 1997 using the combination of broken powerlaw and Lorentzian and find a type-B QPO at 5.870.12 Hz, with the quality factor of 7.890.62 and fractional rms amplitude (%) of 4.840.36. The PDS is associated with weak red noise. These two observations show that the source was in the SIMS state on 13 May, 1997. Thus, GRS 1915+105 also passes through the SIMS before its large amplitude oscillations begin. This indicates that the X-ray spectral evolution prior to the class activity in both sources are roughly similar. This also strengthen that the spectroscopic nature of the origin of class activities in both sources may be similar.
4. Discussion
In this paper, we study the evolution of the X-ray activity in IGR J170913624 from 3 February, 2011 to 15 April, 2011. Initially, with the increase in the SWIFT/XRT count rate, transition from the low/hard and hard intermediate state to the soft intermediate state has been detected. In transient BHXBs, this transition is usually accompanied by Radio flares (Fender, Belloni & Gallo, 2004; Belloni et al., 2005). Our results show that the source makes to and fro transition between the HIMS and the SIMS a few times. This may represent the disk instability which occurs due to the increasing mass accretion rate. A few days later, a transition takes place from the SIMS to a regular, repetitive and highly variable pulsations similar to the -class variability, previously observed only from GRS 1915+105. A few observations between variable state/-like class and the SIMS show 11-14 mHz quasiperiodic variabilities with low rms amplitude which we term as intermediate variable state.
In addition to the structural similarities of ‘heartbeat’ oscillations in both sources, we find that they show similar time evolution in the burst structure. With time, characteristic pulsation frequency increases in both sources as well as the ratio of the peak flux to the persistent level flux also increases. In both cases, average rise profile of the burst shows slow exponential rise while average decay profile shows fast decay. Interestingly, we find strong anti-correlation between hardness value and the X-ray flux during variabilities in both sources. The evolution of the burst structure in the HID of both sources is identical. PDS below 1 Hz, show similar noise continuity as well pulsation peaks. Both sources have strong mHz QPOs along with harmonics and strong flat-top noise along with the presence of type-A/type-B QPOs in the PDS.
In other BHXBs, transition from the canonical low/hard state to the steep power law (SPL) state (highest flux regime of the outburst) (Remillard & McClintock, 2006), which sometimes coincides with the soft intermediate state (Fender, Belloni & Gallo, 2004; Belloni et al., 2005), is a commonly observed phenomenon. IGR J170913624 also shows transition from the LS/HIMS to the SIMS and the high soft state. Spectral properties of the low/hard state, HIMS and SIMS in IGR J170913624 also match with those of other BHXBs (Remillard & McClintock, 2006; Belloni et al., 2005). Lutovinov et al. (2003) showed evidences that previously IGR J170913624 was in the low/hard state. A recent report (Altamirano et al., 2013) claims that IGR J170913624 is going back to quiescence similar to normal transient BHXBs. It is important to note that GRS 1915+105 was discovered as a normal transient in 1992 (Lochner et al., 1992). It was detected at the intensity level as low as 90 mCrab and gradually increased up to 300 mCrab over a month period (Greiner, 1994). Hence it is possible that at the beginning, similar to IGR J170913624 and normal transients, GRS 1915+105 also evolved from quiescence and passing through the low/hard, HIMS and SIMS, it entered into different variability classes. Following the fate of IGR J170913624 and other normal transients, GRS 1915+105 may also fade into quiescence in the future. Therefore, it is possible that at the beginning, the spectral evolution of GRS 1915+105 and IGR J170913624 are similar to normal transients. With the RXTE/PCA, GRS 1915+105 has usually been seen in the HIMS/SIMS state, but never seen in the typical low hard state. From the HIMS and SIMS state, IGR J170913624 deviates from the canonical BHXB track and shows regular repetitive variabilities similar to the class variability observed in GRS 1915+105. Besides, within RXTE era, IGR J170913624 shows six variability classes (Altamirano et al., 2011c) out of 14 classes in GRS 1915+105 (Belloni et al., 2000; Klein-Wolt et al., 2002). Thus considering evidences, IGR J170913624 do show spectral evolution and properties similar to GRS 1915+105, but, during first 40 days of the outburst, it also clearly exhibits outburst evolution properties similar to other canonical BHXBs (more evidently than GRS 1915+105).
Our results tentatively indicate that the central object in IGR J170913624 system may be a black hole. One such indication is the detection of type-B QPOs from six different observations and type-C QPOs from eight different observations (see Table 1). These QPOs are often observed from BHXBs rather than from NSXBs (Casella et al., 2005; Belloni et al., 2005). Besides, the observation of low frequency break in the PDS of this source on 15 February, 2011 (also see, Lutovinov et al. (2003)) further decreases the chance of being NSXB. Moreover, from our analysis, typeI X-ray bursts are not found in any observations within about two months. These bursts are unique characteristics of neutron star LMXBs (Fujimoto et al., 1981; Lewin et al., 1995; Bhattacharyya, 2010). This gives an indirect evidence that the source may not be a neutron star.
We find few dissimilarities between the variable state/-like class of IGR J170913624 and the ‘’ class of GRS 1915+105. They are listed below:
-
1.
The color-color diagram (CD) of the ‘’ class shows a loop-like pattern (see Belloni et al. (2000)) while the CD of the variable state/-like class in IGR J170913624 shows a patchy pattern (see bottom right panel of Fig. 4). Low count rate and irregular burst structure may cause such randomness in the CD. In the HID, GRS 1915+105 traverses a clock-wise loop while the IGR J170913624 traverses anti-clockwise (Altamirano & Belloni, 2012b). The X-ray flux from IGR J170913624 is significantly lower than that observed from GRS 1915+105 even considering a distance as large as 17 kpc.
-
2.
An interesting difference between two systems is that the hardness ratio during class activity is higher ( 2 times) in IGR J170913624 than that observed in GRS 1915+105. One possible reason for this higher hardness value, as discussed in Altamirano et al. (2011c), is the distance of IGR J170913624 is higher compared to the distance of GRS 1915+105. However, using SWIFT/XRT data, we find that the absorption column density is 0.91.02 1022 cm-2 for IGR J170913624 while this value is 513.6 1022 cm-2 for GRS 1915+105. Hence along with large distance, effects like the presence of the strong disk wind or large disk inclination angle (King et al., 2012) may also cause the observed flux difference between two sources. The contamination from a nearby source is not favored since the hardening of the lightcurve during the heartbeat oscillations has also been been observed with the SWIFT/XRT (Capitanio et al., 2012).
-
3.
Typical low/hard state observations where disk emission is not visible, are commonly seen in canonical BHXBs but have never been seen in GRS 1915+105 during the RXTE era. Earlier outbursts in IGR J170913624 were started with the LS (Lutovinov et al., 2003; Capitanio et al., 2006). In case of 2011 outburst, SWIFT/XRT spectral fitting of IGR J170913624 shows that, from 9 February, 2011 to 20 February, 2011 (see Table 2) disk component is not visible in the spectra. Apart from this, a break in the PDS continuum, detection of broad Lorentzian also indicate that the present outburst started with the LS although accurate determination of spectral state is not possible due to unavailability of RXTE data.
-
4.
A systematic study of the occurrence of different classes in GRS 1915+105 (Yadav & Pahari, 2013) show that the class variability eventually arise from the or class after transiting from the SIMS. These are different X-ray classes with large variation in the variability timescale as well as X-ray flux (Belloni et al., 2000; Klein-Wolt et al., 2002; Pahari & Pal, 2010). Until now, the class like activity in IGR J170913624 arises from the SIMS through the IVS, skipping any other variabilities as observed in GRS 1915+105.
-
5.
From Table 1, the total good time interval of variable state/-like class observations in IGR J170913624 can be estimated as 19.87 hours. Once in the entire class period (19 March, 2011 to 12 April, 2011), it goes back to the non-variable SIMS (25 March, 2011). During the rise phase of 1997 outburst in GRS 1915+105 also was in the SIMS prior to class on 26 May, 1997 and showed a transition from the class to the class on 18 June, 1997 (Yadav & Pahari, 2013). In GRS 1915+105, the total good time interval of class observations is found to be 7.36 hours. Unlike IGR J170913624, GRS 1915+105 occasionally make transition to or class within class period (Yadav & Pahari, 2013). These observations, in both sources, indicate that ‘’ class variability may represent very stable X-ray class. If frequent observations and the total good time interval are assumed to represent the stability of a state, then the possible reason for prolonged stability of IGR J170913624 in the variable state/-like class compared to GRS 1915+105 may be the lower mass accretion rate in IGR J170913624 compared to GRS 1915+105 which, however, needed to be explored further.
Using the radio data, Rodriguez et al. (2011b) found the distance of IGR J170913624 to be 1017 kpc assuming black hole mass to be 10 M⊙. Later, Rebusco et al. (2012) estimated the mass of 6 M⊙. We assume here the black hole mass to be 8 2 M⊙. We use the distance of IGR J170913624 to be 143 kpc to calculate the mass accretion rate of IGR J170913624 relative to the GRS 1915+105. In case of GRS 1915+105, we assume the mass, the distance and the disk inclination angle with respect to observer’s line of sight to be 10.10.4 M⊙ (Steeghs et al., 2013), 12.52.1 kpc and 70o (Muno et al., 1999) respectively. The mass accretion rate at the inner disk can be derived using the energy conservation law and the Virial theorem. Using simple analytical approach and assuming the disk radiation to be blackbody & considering both side of the disk, the mass accretion rate is (Frank, King & Raine, 2002) :
| (1) |
where is the Boltzmann constant, G is the gravitational constant and Tin,keV is the inner disk temperature in keV and Rin,km is given by the equation
| (2) |
where C is the color correction factor (assumed to be 1.8 in case of black hole (Kubota et al., 1998)), Ndiskbb is the normalization corresponds to the diskbb model component in XSpec, D10,kpc is the distance to the source in the unit of 10 kpc and i is the disk inclination angle with respect to observer’s line of sight. Inserting the equation (2) in (1), we get
| (3) |
To obtain a qualitative idea, we compare accretion parameters of both sources using above equations. For example, the spectral analysis of a less-variable, HIMS observation in GRS 1915+105 on 09 September, 1997 using RXTE/PCA yields the disk temperature of 1.24 0.03 keV and inner disk radius of 57 3 km (Muno et al., 1999). Using equation (2), the equivalent normalization would be 211.3 26.5. From the spectral analysis of non-variable, HIMS in IGR J170913624, observed on 08 March, 2011, we find the value of Ndiskbb to be 13.87 1.35 and the disk temperature to be 1.24 0.03 keV (See Table 2). Using these values in equation (3) and assuming disk inclination angle (i) to be 70o in IGR J170913624 (King et al., 2012; Capitanio et al., 2012), we find GRS1915+105/IGRJ17091-3624 48.3 8.7. Hence, the mass accretion rate in GRS 1915+105 is significantly higher (may be in the order of magnitude) compared to that of IGR J170913624. This may be consistent with very high X-ray flux observed in GRS 1915+105 than that seen from IGR J170913624 even considering IGR J170913624 at larger distance. We also calculate the relative viscous timescale of the accretion flow using the following relation (Frank, King & Raine, 2002):
| (4) |
where t is the dynamic viscous timescale, is the viscosity parameter. We consider the typical value of to be 0.01 for both sources. Using relation (4) and above parameters, we find the value of t/t to be 0.37 0.13 when the disk inclination angle of IGR J170913624 is 70o (King et al., 2012; Capitanio et al., 2012). Hence the viscous timescale of GRS 1915+105 is smaller relative to IGR J170913624 in non-variable state.
5. Conclusions
From our analysis of SWIFT/XRT and RXTE/PCA data during 2011 outburst of IGR J170913624, and using results from comparative study of timing and spectral properties with GRS 1915+105, we conclude following points.
-
1.
We find that IGR J170913624 is the only known transient LMXB, which shows regular, repetitive and structured variability in the intensity pattern similar to the -type variability seen from GRS 1915+105. Various parameters like burst frequency evolution, burst structure profile, rise and decay profile, peak-to-minimum flux ratio, harmonics of mHz characteristic pulsations and PDS characteristics show remarkable similarity. The entry to the -type variability in IGR J170913624 is from the SIMS via intermediate variability state which show 11-14 mHz coherent pulsations with the presence of weak red noise/type-A QPO, while the exit from the -type variability is through the soft state with several broad Lorentzian noise components and QPO-like feature at 3 Hz (similar to the / class; see Table 1). GRS 1915+105 also was in the SIMS prior to class on 26 May, 1997 and showed a transition from the class to the class on 18 June, 1997 (Yadav & Pahari, 2013). However, significant differences in hardness ratio as well as variance spectra are also observed.
-
2.
Several evidences like power-law dominated spectra, the detection of type-B and type-C QPOs, break in PDS continuum along with class activity (as seen in GRS 1915+105 which is a BHXB) are consistent with the black hole identification of the source.
-
3.
The source shows increase in flux while transiting from the low/hard state/HIMS to the SIMS. Later a transition occurs from a typical irregular variability state (SIMS), seen commonly in most of the BHXBs to the regular, repetitive large variability state, seen only in GRS 1915+105 (‘’-type variability) via an intermediate state. However, X-ray bursts during variability state/-like class are spectrally harder than that found in GRS 1915+105. Central black hole mass, its distance, disk inclination angle, absorption column density etc. may be important to explain the observed hardness ratio but at present we do not know exact answer. It is a topic for future investigations if these parameters or some unknown parameter/mechanism is responsible for higher hardness ratio during class activity in IGR J170913624.
-
4.
From Table 1, it is clear that we detect several QPOs ranging from few mHz to 10 Hz or so. Not only that, there are to and fro transition between the HIMS and the SIMS and the source show evolution of characteristic oscillations in -class faster than GRS 1915+105.
-
5.
In both sources, ‘’ class activity is observed following the soft intermediate state where disk emission in the energy spectra is visible and contribute significantly to the total flux. GRS 1915+105 during the RXTE era, never shows typical low/hard state where disk emission is not visible but IGR J170913624 shows low hard state where disk emission is not significant. This result agrees well with the low hard state observations of other black hole X-ray binaries. Similar to a normal transient, IGR J170913624 also seems to move to the quiescence as observed with SWIFT/XRT (Altamirano et al., 2013). Hence considering evidences, IGR J170913624, behaves similar to GRS 1915+105 at certain period of evolution whereas it behaves like other canonical BHXBs at some other period of evolution. Hence, this source may be an important bridge between GRS 1915+105 and other canonical BHXBs in understanding observational dissimilarities, as well as accretion and radiation mechanisms.
Thus long term and continuous observation of outbursts of this source in multi-wavelength band using ASTROSAT would reveal a lot of information regarding the radiation mechanism and accretion flow properties of BHXBs, and help to construct the complete picture of accretion flow around black hole systems by connecting GRS 1915+105 with other canonical BHXB systems.
6. Acknowledgements
We thank the referee for his/her constructive comments which helps to improve the work. We also thank another referee Ron Remillard for usuful discussions. MP is thankful to Ranjeev Misra for constructive discussions. We thank T. Belloni for providing GHATS v1.0.2 timing analysis software. This research has made use of the General High-energy Aperiodic Timing Software (GHATS) package developed by T.M. Belloni at INAF - Osservatorio Astronomico di Brera and data obtained through the High Energy Astrophysics Science Archive Research Center online service, provided by the NASA/Goddard Space Flight Center and the SWIFT data center.
References
- Altamirano et al. (2013) Altamirano, D., Wijnands, R., & Belloni, T., 2013, Astron. Telegram, 5112, 1
- Altamirano & Strohmayer (2012a) Altamirano, D., Strohmayer, T., 2012a, ApJ, 754, L23
- Altamirano & Belloni (2012b) Altamirano, D. & Belloni, T. 2012b, ApJ, 747, L4
- Altamirano et al. (2011a) Altamirano, D., Linares, M., van der Klis, M., Wijnands, R., Kalamkar, M., Casella, P., Watts, A. & Patruno, A. 2011a, Astron. Telegram, 3225, 1
- Altamirano et al. (2011b) Altamirano, D., Belloni, T., Krimm, H. A., Casella, P., Curran, P., Kennea, J. A., Kalamkar, M. & van der Klis, M. 2011b, Astron. Telegram, 3230, 1
- Altamirano et al. (2011c) Altamirano, D., Belloni, T., Linares, M., van der Klis, M., Wijnands, R., Curran, P. A., Kalamkar, M., Stiele, H., Motta, S., Muñoz-Darias, T., Casella, P., Krimm, H, 2011c, ApJ, 742, L17
- Belloni et al. (2005) Belloni, T., Homan, J., Casella, P., van der Klis, M., Nespoli, E., Lewin, W. H. G., Miller, J. M., & Meńdez, M. 2005, A&A, 440, 207
- Belloni et al. (2000) Belloni, T., Klein-Wolt, M., Meńdez, M., van der Klis, M. & van Paradijs, J. 2000, A&A, 355, 271
- Bhattacharyya (2010) Bhattacharyya, S., 2010, AdSpR, 45, 949
- Bodaghee et al. (2012) Bodaghee, A., Rahoui, F., Tomsick, J. A., Rodriguez, J., 2012, ApJ, 751, 113
- Burrows et al. (2005) Burrows, David N., Hill, J. E., Nousek, J. A., Kennea, J. A., Wells, A., Osborne, J. P., Abbey, A. F., Beardmore, A. et al., 2005, Space Sc. Rev., 120, 165
- Caballero-Garciá et al. (2009) Caballero-Garciá, M. D., Miller, J. M., Trigo, M. Diáz, Kuulkers, E., Fabian, A. C., Mas-Hesse, J. M., Steeghs, D. & van der Klis, M. 2009, ApJ, 692, 1339
- Capitanio et al. (2012) Capitanio, F., Del Santo, M., Bozzo, E., Ferrigno, C., De Cesare, G., & Paizis, A., 2012, MNRAS, 422, 3130
- Capitanio et al. (2011) Capitanio, F., Tramacere, A., Del Santo, M., Bozzo, E., Watanabe, K., Caballero, I., Chenevez, J., Paizis, A. et al. 2011, Astron. Telegram, 3159, 1
- Capitanio et al. (2009) Capitanio, F., Giroletti, M., Molina, M., Bazzano, A., Tarana, A., Kennea, J., Dean, A. J., Hill, A. B. et al. 2009, ApJ, 690, 1621
- Capitanio et al. (2006) Capitanio, F., Bazzano, A., Ubertini, P., Zdziarski, A. A., Bird, A. J., De Cesare, G., Dean, A. J., Stephen, J. B. & Tarana, A. 2006, ApJ, 643, 376
- Casella et al. (2005) Casella, P., Belloni, T. & Stella, L., 2005, ApJ, 629, 403
- Castro-Tirado et al. (1994) Castro-Tirado, A. J., Brandt, S., Lund, N., Lapshov, I., Sunyaev, R. A., Shlyapnikov, A. A., Guziy, S. & Pavlenko, E. P. 1994, ApJS, 92, 469
- Chaty et al. (2008) Chaty, S., Rahoui, F., Foellmi, C., Tomsick, J. A., Rodriguez, J. & Walter, R. 2008, A&A, 484, 783
- Del Santo et al. (2009) Del Santo, M., Belloni, T. M., Homan, J., Bazzano, A., Casella, P., Fender, R. P., Gallo, E., Gehrels, N. et al. 2009, MNRAS, 392, 992
- Del Santo et al. (2011) Del Santo, M., Kuulkers, E.; Bozzo, E., Capitanio, F., Alfonso-Garzon, J., Beckmann, V., Bird, T., Brandt, S. et al. 2011, Astron. Telegram, 3203, 1
- Dunn et al. (2008) Dunn, R. J. H., Fender, R. P., Körding, E. G., Cabanac, C. & Belloni, T. 2008, MNRAS, 387, 545
- Eikenberry et al. (1998) Eikenberry, S. S., Matthews, K., Murphy, T. W., Jr., Nelson, R. W., Morgan, E. H., Remillard, R. A. & Muno, M. 1998, ApJ, 506, L31
- Fender, Belloni & Gallo (2004) Fender, R. P., Belloni, T. M., Gallo, E., 2004, MNRAS, 355, 1105
- Frank, King & Raine (2002) Frank, J., King, A., Raine, D., 2002, Accretion Power in Astrophysics, 3rd Edition, Cambridge University Press
- Fujimoto et al. (1981) Fujimoto, M. Y., Hanawa, T., & Miyaji, S., 1981, ApJ, 247, 267
- Greiner (1994) Greiner, J., 1994, AGAb, 10, 23
- Homan & Belloni (2005) Homan, J., Belloni, T., 2005, Ap&SS, 300, 107
- In’t Zand et al. (2003) In’t Zand, J. J. M., Heise, J., Lowes, P., & Ubertini, P. 2003, Astron. Telegram, 160, 1
- Jahoda et al. (1996) Jahoda, K., Swank, J. H., Giles, A. B., Stark, M. J., Strohmayer, T., Zhang, WT., & Morgan, E. H. 1996, SPIE, 2808, 59
- Janiuk & Misra (2012) Janiuk, A., Misra, R., 2012, A&A, 540, 114
- Joinet et al. (2007) Joinet, A., Jourdain, E., Malzac, J., Roques, J. P., Corbel, S., Rodriguez, J. & Kalemci, E. 2007, ApJ, 657, 400
- Klein-Wolt et al. (2002) Klein-wolt, M., et al., 2002, MNRAS, 331, 745
- Krimm & Kennea (2011b) Krimm, H. A. & Kennea, J. A. 2011, Astron. Telegram, 3148, 1
- Krimm et al. (2011a) Krimm, H. A., Barthelmy, S. D., Baumgartner, W., Cummings, J., Fenimore, E., Gehrels, N., Kennea, J. A., Markwardt, C. B. et al. 2011, Astron. Telegram, 3144, 1
- King et al. (2012) King, A. L., Miller, J. M., Raymond, J., Fabian, A. C., Reynolds, C. S., Kallman, T. R., Maitra, D., Cackett, E. M., Rupen, M. P., 2012, ApJL, 746, 20
- Kuulkers et al. (2003) Kuulkers, E., Lutovinov, A., Parmar, A., Capitanio, F., Mowlavi, N. & Hermsen, W. 2003, Astron. Telegram, 149, 1
- Kubota et al. (1998) Kubota, A., Tanaka, Y., Makishima, K., Ueda, Y., Dotani, T., Inoue, H., Yamaoka, K., 1998, PASJ, 50, 667
- Lewin et al. (1995) Lewin, W. H. G., van Paradijs, J., & Taam, R. E. 1995, in X-Ray Binaries, ed. W. H. G. Lewin, J. van Paradijs, & E. P. J. van den Heuvel (Cambridge: Cambridge Univ. Press), 175
- Lochner et al. (1992) Lochner, J., Whitlock, L., Kouveliotou, C., 1992, IAUC, 5658, 2
- Lutovinov et al. (2005) Lutovinov, A. A., Revnivtsev, M., Molkov, S. & Sunyaev, R. 2005, A&A, 430, 997
- Lutovinov et al. (2003) Lutovinov, A. A. & Revnivtsev, M. G. 2003, Astron. Lett., 29, 719
- Markoff et al. (2005) Markoff, S., Nowak, M. A., & Wilms, J. 2005, ApJ, 635, 1203
- Massaro et al. (2010) Massaro, E., Ventura, G., Massa, F., Feroci, M., Mineo, T., Cusumano, G., Casella, P. & Belloni, T. 2010, A&A, 513, 21
- Miller (2007) Miller, J. M. 2007, ARA&A, 45, 441
- Mineo et al. (2006) Mineo, T., Romano, P., Mangano, V., Moretti, A., Cusumano, G., La Parola, V., Troja, E., Campana, S. et al., 2006, Nuovo Cimento B, 121, 1521
- Mirabel et al. (1998) Mirabel, I. F., Dhawan, V., Chaty, S., Rodriguez, L. F., Marti, J., Robinson, C. R., Swank, J., & Geballe, T., 1998, A&A, 330, L9
- Mirabel & Rodriguez (1994) Mirabel, I. F.& Rodriguez, L. F. 1994, Nature, 371, 46
- Muno et al. (1999) Muno, M. P., Morgan, E. H. & Remillard, R. A., 1999, ApJ, 527, 321
- Munõz-Darias et al. (2008) Munõz-Darias, T., Casares, J., & Martińez-Pais, I. G. 2008, MNRAS, 385, 2205
- Neilsen et al. (2012) Neilsen, J., Remillard, R. A., Lee, J. C., 2012, ApJ, 750, 71
- Pahari et al. (2013a) Pahari, M., et al., 2013a, ApJ, 778, 46
- Pahari et al. (2013b) Pahari, M., et al., 2013b, MNRAS, 436, 2334
- Pahari et al. (2013c) Pahari, M., et al., 2013c, ApJ, 778, 136
- Pahari et al. (2011a) Pahari, M., Bhattacharyya, S., Yadav, J. S. & Pandey, S. K., 2011, MNRAS, 422, L87
- Pahari et al. (2011b) Pahari, M., Bhattacharyya, S. & Yadav, J. S. 2011, Astron. Telegram, 3266, 1
- Pahari & Pal (2010) Pahari, M. & Pal, S. 2010, MNRAS, 409, 903
- Paul et al. (1998) Paul, B., Agrawal, P. C., Rao, A. R., Vahia, M. N., Yadav, J. S., Marar, T. M. K., Seetha, S. & Kasturirangan, K. 1998, A&AS, 128, 145
- Rao et al. (2000) Rao, A. R., Yadav, J. S. & Paul, B., 2000, ApJ, 544, 443
- Rebusco et al. (2012) Rebusco, P., Moskalik, P., Kluzńiak, W., Abramowicz, M. A., 2012, A&A, 540, L4
- Reig et al. (2000) Reig, P., Belloni, T., van der Klis, M., Meńdez, M., Kylafis, N. D., & Ford, E. C., 2000, ApJ, 541, 883
- Remillard & McClintock (2006) Remillard, R. A. & McClintock, J. E., 2006, ARA&A, 44, 49
- Rodriguez et al. (2011a) Rodriguez, J., Corbel, S., Tomsick, J. A., Paizis, A. & Kuulkers, E. 2011a, Astron. Telegram, 3168, 1 F
- Rodriguez et al. (2011b) Rodriguez, J., Corbel, S., Caballero, I., Tomsick, J. A., Tzioumis, T., Paizis, A., Cadolle, Bel M., & Kuulkers, E., 2011b, A&A, 533, L4
- Rothschild et al. (1998) Rothschild, R. E., Blanco, P. R., Gruber, D. E., Heindl, W. A., MacDonald, D. R., Marsden, D. C., Pelling, M. R., Wayne, L. R. & Hink, P. L. 1998, ApJ, 496, 538
- Shaposhnikov (2011) Shaposhnikov, Nikolai 2011, Astron. Telegram, 3179, 1
- Sheskin (2003) Sheskin, D. J., 2003, Handbook of Parametric and Nonparametric Statistical Procedures: Third Edition, CRC Press
- Soleri et al. (2008) Soleri, P., Belloni, T. & Casella, P. 2008, MNRAS, 383, 1089
- Steeghs et al. (2013) Steeghs, D., McClintock, J. E., Parsons, S. G., et al., 2013, ApJ, 768, 185
- Sunyaev & Revnivtsev (2000) Sunyaev, R. & Revnivtsev, M., 2000, A&A, 358, 617
- Taam et al. (1997) Taam, R. E., Xingming, C. & Swank, J., E. 1997, APJ, 485, L83
- Tingay et al. (1995) Tingay, S. J., Jauncey, D. L., Preston, R. A., Reynolds, J. E., Meier, D. L., Murphy, D. W., Tzioumis, A. K., McKay, D. J. et al. 1995, Nature, 374, 141
- Yadav et al. (1999) Yadav, J. S., Rao, A. R., Agrawal, P. C., Paul, B., Seetha, S. & Kasturirangan, K. 1999, ApJ, 517, 935
- Yadav (2001) Yadav, J. S., 2001, ApJ, 548, 876
- Yadav (2006) Yadav, J. S., 2006, ApJ, 646, 385
- Yadav & Pahari (2013) Yadav, J. S., & Pahari, M., 2013, under preparation
- Zdziarski & Gierlinśki (2004) Zdziarski, A. A. & Gierlinśki, M. 2004, Prog. Theor. Phys. Suppl., 155, 99
| Observation | MJD | Instrument | Observation | Good time | Average | Average | spectral | PDS features |
| date (DD-MM-YY) | ID | interval (sec) | soft color | hard color | state/class | |||
| 09-02-11 | 55601.06 | XRT(WT) | 00031921005 | 1467.4 | – | – | LS? | band-limited noise observed |
| 10-02-11 | 55602.58 | XRT(WT) | 00031921006 | 2200.4 | – | – | LS? | strong band-limited noise (rms amplitude (%) 9.4 0.6) |
| 12-02-11 | 55604.21 | XRT(WT) | 00031921008 | 2198.1 | – | – | LS? | band-limited noise observed |
| 13-02-11 | 55605.21 | XRT(WT) | 00031921009 | 2151.2 | – | – | LS? | band-limited noise observed |
| 14-02-11 | 55606.16 | XRT(WT) | 00031921010 | 1877.6 | – | – | LS? | band limited noise observed |
| 15-02-11 | 55607.23 | XRT(WT) | 00031921011 | 2101.6 | – | – | LS | band-limited noise & a break in PDS is observed ( 0.190.03 Hz) |
| 16-02-11 | 55608.23 | XRT(WT) | 00031921012 | 2182.3 | – | – | LS | band-limited noise & broad QPO-like |
| and feature observed (0.180.02 Hz, 2.370.18, 13.92.6) | ||||||||
| 18-02-11 | 55610.17 | XRT(WT) | 00031921013 | 2176.5 | – | – | LS | strong band-limited noise & broad QPO-like |
| and feature observed (0.220.03 Hz, 2.250.18, 8.71.3) | ||||||||
| 20-02-11 | 55612.25 | XRT(WT) | 00031921014 | 2104.2 | – | – | HIMS | pds fitted with (lore+bknpower)(122.1/125), |
| type-C QPO (0.510.13 Hz, 5.250.12, 12.80.6) | ||||||||
| and flat top noise ( 7%) detected | ||||||||
| 22-02-11 | 55614.19 | XRT(WT) | 00031921015 | 2050.2 | – | – | SIMS | broad Lorentzian (1.89 Hz) and weak red noise detected |
| 23-02-11 | 55615.99 | PCA | 96065-03-01-03 | 3184.4 | 0.730.01 | 0.360.02 | SIMS | pds fitted with (lore+bknpower(225.9/224)), |
| transient type-B QPO (4.160.08 mHz, 5.710.34, 6.680.79) | ||||||||
| with weak red noise (rms amplitude(%) 4.250.18) | ||||||||
| 24-02-11 | 55616.25 | XRT(WT) | 00031921016 | 1065.6 | – | – | SIMS | pds fitted with (lore+lore+bknpower)(117.3/122), |
| transient type-B QPO (4.320.37 Hz, 7.170.36, 5.280.32) | ||||||||
| broad Lorentzian noise (0.830.14 Hz, 7.820.27) | ||||||||
| 26-02-11 | 55619.01 | PCA | 96065-03-02-00 | 1712.2 | 0.750.01 | 0.410.02 | HIMS | pds fitted with (lore+bknpower(213.5/224)), |
| type-C QPO (3.730.09 Hz, 4.760.14, 16.90.6) | ||||||||
| with strong flat-top noise (rms amplitude(%) 7.850.18) | ||||||||
| 28-02-11 | 55621.34 | XRT(WT) | 00031921017 | 2576.6 | – | – | SIMS | pds fitted with (lore+bknpower)(121.8/125), |
| transient type-B QPO (3.840.11 Hz, 6.790.23, 5.310.55) | ||||||||
| with weak red noise (rms amplitude(%) 3.960.49) | ||||||||
| 02-03-11 | 55622.59 | PCA | 96420-01-01-00 | 3744.3 | 0.720.04 | 0.390.08 | HIMS | pds fitted with (lore+bknpower(234.2/224)), |
| 55622.52 | XRT(WT) | 00031921018 | 2340.9 | – | – | type-C QPO (3.670.26 Hz, 4.170.56, 21.30.5) | ||
| with strong flat-top noise (rms amplitude(%) 8.190.47) | ||||||||
| 03-03-11 | 55623.28 | PCA | 96420-01-01-01 | 2064.5 | 0.680.03 | 0.360.02 | SIMS | pds fitted with (lore+bknpower(229.9/224)), |
| 55623.86 | PCA | 96420-01-01-02 | 6944.4 | 0.660.02 | 0.380.03 | transient type-B QPO (4.850.08 Hz, 7.670.68, 6.140.29) | ||
| 55623.29 | XRT(WT) | 00031921019 | 971.4 | – | – | with weak red noise (rms amplitude(%) 3.430.59) | ||
| 04-03-11 | 55624.56 | PCA | 96420-01-02-00 | 1584.2 | 0.620.03 | 0.330.01 | SIMS to | pds fitted with (lore+bknpower(212.6/224)), |
| 55624.85 | XRT(WT) | 00031921020 | 2289.6 | – | – | HIMS | type-B/type-C QPO (5.320.46 Hz, 6.380.56, 6.310.37) | |
| transition | with flat-top noise (rms amplitude(%) 6.580.79) | |||||||
| 06-03-11 | 55626.39 | PCA | 96420-01-02-01 | 65.5 | 0.670.03 | 0.350.01 | HIMS | pds fitted with (lore+bknpower(217.3/224)), |
| 55626.23 | XRT(WT) | 00031921022 | 1704.1 | – | – | transient type-C QPO (5.150.11 Hz, 4.980.27, 9.110.09) | ||
| with strong flat-top noise (rms amplitude(%) 7.120.35) | ||||||||
| 08-03-11 | 55628.47 | PCA | 96420-01-02-02 | 3202.2 | 0.640.01 | 0.360.01 | HIMS | pds fitted with (lore+bknpower(226.4/224)), |
| 55628.23 | XRT(WT) | 00031921022 | 1704.1 | – | – | transient type-C QPO (5.400.23 Hz, 4.850.39, 8.870.69) | ||
| with strong flat-top noise (rms amplitude(%) 7.120.35) | ||||||||
| 10-03-11 | 55630.84 | PCA | 96420-01-02-03 | 1648.8 | 0.670.02 | 0.370.04 | HIMS | pds fitted with (lore+bknpower(218.1/224)), |
| 55630.16 | XRT(WT) | 00031921023 | 1401.5 | – | – | transient type-C QPO (5.230.09 Hz, 5.310.23, 10.90.7) | ||
| with strong flat-top noise (rms amplitude(%) 8.890.49) | ||||||||
| 12-03-11 | 55632.54 | PCA | 96420-01-03-00 | 1520.4 | 0.630.02 | 0.330.02 | SIMS | pds fitted with (lore+bknpower(229.6/224)), |
| 55632.73 | XRT(WT) | 00031921024 | 2182.3 | – | – | narrow, weak QPO-like feature (0.680.03 Hz, 12.50.4, 3.080.11) | ||
| with weak red noise (rms amplitude(%) 5.150.26) | ||||||||
| 13-03-11 | 55633.24 | XRT(WT) | 00031921025 | 2009.8 | – | – | SIMS | no QPO is detected and |
| weak red noise observed (rms amplitude(%) 2.550.34) | ||||||||
| 14-03-11 | 55634.72 | PCA | 96420-01-03-01 | 3344.2 | 0.530.02 | 0.280.06 | IVS | pds fitted with (lore+lore+bknpower)(231.8/221), |
| characteristic QPO (11.50.8 mHz, 4.460.58, 5.720.18), | ||||||||
| narrow, weak QPO-like feature (2.610.12 Hz, 11.80.7, 2.970.23) | ||||||||
| with weak red noise (rms amplitude(%) 3.690.25) | ||||||||
| 15-03-11 | 55635.65 | XRT(WT) | 00031921026 | 1481.2 | – | – | SIMS | pds fitted with (lore+bknpower)(118.3/125), |
| transient type-B QPO (4.460.21 Hz, 6.090.53, 7.810.86) | ||||||||
| with weak red noise (rms amplitude(%) 2.990.35) | ||||||||
| 18-03-11 | 55638.54 | XRT(WT) | 00031921029 | 2164.6 | – | – | IVS | pds fitted with (lore+bknpower)(114.6/125), |
| characteristic QPO (13.31.4 mHz, 8.62.3, 7.390.41) | ||||||||
| with weak red noise (rms amplitude(%) 3.650.33) | ||||||||
| 19-03-11 | 55639.71 | PCA | 96420-01-04-00 | 2752.3 | 0.500.01 | 0.210.01 | variable | pds fitted with (lore+lore+bknpower)(212.6/221), |
| 55639.67 | XRT(WT) | 00031921028 | 2631.5 | – | – | state/ | heartbeat (29.61.2 mHz, 7.420.51, 28.61.8) | |
| class | heartbeat (62.44.5 mHz, 5.560.36, 9.020.48) | |||||||
| heartbeat (0.110.05 Hz, 5.770.42, 4.260.53) | ||||||||
| 20-03-11 | 55640.47 | XRT(WT) | 00031921030 | 2352.5 | – | – | variable | pds fitted with (lore+lore+lore+bknpower)(223.6/218), |
| state/ | heartbeat (31.22.3 mHz, 18.62.2, 25.91.8) | |||||||
| class | heartbeat (63.44.8 mHz, 4.840.24, 7.770.83) | |||||||
| heartbeat (0.110.08 Hz, 2.770.12, 6.450.34) |
| Observation | MJD | Instrument | Observation | Good time | Average | Average | spectral | PDS features |
| date (DD-MM-YY) | ID | interval (sec) | soft color | hard color | state/class | |||
| 22-03-11 | 55642.20 | PCA | 96420-01-04-02 | 2976.4 | 0.540.01 | 0.290.09 | variable | pds fitted with (lore+lore+lore+bknpower)(228.6/218), |
| 55642.35 | XRT(WT) | 00031921031 | 2260.3 | – | – | state/ | heartbeat (25.51.4 mHz, 9.690.74, 22.01.6) | |
| class | heartbeat (51.72.4 mHz, 5.290.33, 9.390.88) | |||||||
| transient type-B QPO (2.730.15 Hz, 8.362.43, 3.160.22) | ||||||||
| 23-03-11 | 55643.78 | PCA | 96420-01-04-01 | 1152.4 | 0.550.11 | 0.340.03 | IVS | pds fitted with (lore+bknpower)(233.4/224), |
| characteristic QPO (12.71.1 mHz, 11.61.6, 6.870.49) | ||||||||
| with weak red noise (rms amplitude(%) 2.670.19) | ||||||||
| 24-03-11 | 55644.75 | PCA | 96420-01-04-03 | 2752.8 | 0.570.03 | 0.330.04 | IVS | pds fitted with (lore+lore+lore+bknpower)(227.5/218), |
| (11.60.9 mHz, 2.890.16, 6.020.39) | ||||||||
| broad Lorentzian noise (60.13.7 mHz, 4.150.21) and | ||||||||
| transient type-A QPO (8.180.62 Hz, 3.750.29, 5.260.18) | ||||||||
| 25-03-11 | 55645.86 | PCA | 96420-01-05-02 | 3312.3 | 0.580.01 | 0.370.05 | SIMS | pds fitted with (lore+bknpower)(214.4/224), |
| transient type-A QPO (7.780.45 Hz, 4.280.87, 4.570.29) | ||||||||
| with weak red noise (rms amplitude(%) 4.131.16) | ||||||||
| 26-03-11 | 55646.89 | XRT(WT) | 00031921034 | 2160.1 | – | – | IVS | pds fitted with (lore+bknpower)(123.8/125), |
| characteristic QPO (14.10.2 mHz, 8.971.1, 6.100.66) | ||||||||
| with weak red noise (rms amplitude(%) 3.230.26) | ||||||||
| 27-03-11 | 55648.01 | PCA | 96420-01-05-00 | 32990.4 | 0.520.04 | 0.270.03 | variable | pds fitted with (lore+lore+lore+bknpower)(228.4/218), |
| state/ | heartbeat (21.11.4 mHz, 14.81.1, 13.31.2) | |||||||
| class | heartbeat (44.22.9 mHz, 13.31.2, 4.890.57) | |||||||
| heartbeat (85.65.5 mHz, 16.81.5, 6.150.74) | ||||||||
| 29-03-11 | 55649.06 | PCA | 96420-01-05-03 | 2640.3 | 0.550.01 | 0.330.02 | variable | pds fitted with (lore+lore+bknpower)(232.7/221), |
| state/ | heartbeat (23.81.9 mHz, 5.390.69, 15.91.4) | |||||||
| class | heartbeat (49.72.2 mHz, 11.83.6, 6.890.56) | |||||||
| 30-03-11 | 55650.98 | PCA | 96420-01-05-01 | 2304.5 | 0.480.02 | 0.280.02 | variable | pds fitted with (lore+lore+lore+bknpower)(213.5/218), |
| 55650.74 | XRT(WT) | 00031921036 | 331.65 | – | – | state/ | heartbeat (24.11.6 mHz, 13.50.3, 15.91.4) | |
| class | heartbeat (50.62.8 mHz, 16.80.6, 7.880.71) | |||||||
| heartbeat (75.75.3 mHz, 9.540.93, 5.060.48) | ||||||||
| 31-03-11 | 55651.88 | PCA | 96420-01-05-04 | 3968.1 | 0.510.02 | 0.350.04 | variable | pds fitted with (lore+lore+lore+bknpower)(222.8/218), |
| state/ | heartbeat (26.31.4 mHz, 14.10.5, 16.81.7) | |||||||
| class | heartbeat (52.83.9 mHz, 12.70.3, 7.531.05) | |||||||
| heartbeat (79.64.4 mHz, 9.410.23, 9.191.16) | ||||||||
| transient type-A QPO (8.360.26 Hz, 4.790.38, 3.660.31) | ||||||||
| 02-04-11 | 55653.70 | PCA | 96420-01-06-00 | 3488.7 | 0.500.01 | 0.290.01 | variable | pds fitted with (lore+lore+lore+bknpower)(226.5/218), |
| state/ | heartbeat (33.61.3 mHz, 11.20.3, 22.31.3) | |||||||
| class | heartbeat (67.82.6 mHz, 5.840.21, 10.92.6) | |||||||
| heartbeat (0.110.01 Hz, 3.190.17, 6.230.13) | ||||||||
| 03-04-11 | 55654.89 | PCA | 96420-01-06-01 | 6112.3 | 0.530.01 | 0.310.04 | variable | pds fitted with (lore+lore+lore+lore+bknpower)(207.4/215), |
| state/ | heartbeat (36.60.7 mHz, 9.950.54, 29.31.3) | |||||||
| class | heartbeat (75.94.1 mHz, 4.210.19, 15.31.1) | |||||||
| broad Lorentzian noise (0.210.05 Hz, 9.830.79) | ||||||||
| transient type-A QPO (7.280.14 Hz, 3.210.17, 4.890.14) | ||||||||
| 05-04-11 | 55656.71 | PCA | 96420-01-06-02 | 5136.3 | 0.540.01 | 0.270.04 | variable | pds fitted with (lore+lore+bknpower)(231.5/221), |
| state/ | heartbeat (39.11.6 mHz, 6.890.32, 32.52.2) | |||||||
| class | heartbeat (81.33.8 mHz, 3.950.23, 14.91.4) | |||||||
| 06-04-11 | 55657.31 | PCA | 96420-01-06-03 | 1812.8 | 0.550.01 | 0.250.02 | variable | pds fitted with (lore+lore+lore+bknpower)(225.8/218), |
| state/ | heartbeat (35.82.1 mHz, 4.560.19, 14.51.6) | |||||||
| class | heartbeat (64.84.7 mHz, 4.800.13, 23.61.1) | |||||||
| transient type-B QPO (4.020.12 Hz, 2.150.17, 13.90.8) | ||||||||
| 10-04-11 | 55661.75 | PCA | 96420-01-07-00 | 3376.6 | 0.580.01 | 0.280.03 | variable | pds fitted with (lore+lore+lore+bknpower)(230.3/218), |
| state/ | heartbeat (45.92.1 mHz, 8.470.76, 33.81.6) | |||||||
| class | heartbeat (94.23.4 mHz, 9.330.36, 11.61.7) | |||||||
| transient type-A QPO (7.760.35 Hz, 2.480.22, 7.530.45) | ||||||||
| 11-04-11 | 55662.56 | PCA | 96420-01-07-01 | 3375.2 | 0.560.01 | 0.270.02 | variable | pds fitted with (lore+lore+lore+bknpower)(210.7/218), |
| state/ | heartbeat (45.20.7 mHz, 4.610.25, 31.82.2) | |||||||
| class | heartbeat (90.43.5 mHz, 3.220.25, 11.20.9) | |||||||
| broad Lorentzian noise (5.521.38 Hz, 9.981.13) | ||||||||
| 12-04-11 | 55663.34 | PCA | 96420-01-07-02 | 3278.5 | 0.580.01 | 0.280.02 | variable | pds fitted with (lore+lore+lore+bknpower)(224.4/218), |
| state/ | heartbeat (44.50.6 mHz, 2.690.13, 30.41.7) | |||||||
| class | heartbeat (90.10.2 mHz, 13.81.6, 8.630.73) | |||||||
| transient type-B QPO (4.930.09 Hz, 2.460.22, 4.390.11) | ||||||||
| 15-04-11 | 55666.55 | PCA | 96420-01-08-00 | 1513.6 | 0.590.03 | 0.290.03 | to other | pds fitted with (lore+lore+lore+bknpower)(211.6/218), |
| class transition | broad Lorentzian noise (56.733.43 mHz, 30.12.4), | |||||||
| (may be /) | broad Lorentzian noise (0.220.07 Hz, 19.41.5) and | |||||||
| broad QPO-like feature (3.090.05 Hz, 3.250.36, 9.651.23) |
| Instrument | Observation | Date | state/ | kTin | Ndiskbb | Fluxtotal | Fluxpowerlaw | Fluxdiskbb | /dof | |
| used | ID | (DD-MM-YY) | class | (keV) | ||||||
| XRT | 00031921005 | 09-02-11 | LS? | 1.66 | – | – | 0.61 | – | – | 657.98/632 |
| XRT | 00031921006 | 10-02-11 | LS? | 1.75 | – | – | 0.45 | – | – | 573.58/632 |
| XRT | 00031921008 | 12-02-11 | LS? | 1.63 | – | – | 0.87 | – | – | 728.57/632 |
| XRT | 00031921009 | 13-02-11 | LS? | 1.69 | – | – | 0.98 | – | – | 667.64/632 |
| XRT | 00031921010 | 14-02-11 | LS? | 1.73 | – | – | 0.71 | – | – | 694.01/632 |
| XRT | 00031921011 | 15-02-11 | LS | 1.67 | – | – | 0.95 | – | – | 726.74/632 |
| XRT | 00031921012 | 16-02-11 | LS | 1.62 | – | – | 1.11 | – | – | 629.34/632 |
| XRT | 00031921013 | 18-02-11 | LS | 1.66 | – | – | 1.03 | – | – | 586.28/632 |
| XRT | 00031921014 | 20-02-11 | HIMS | 1.79 | – | – | 0.98 | – | – | 609.43/632 |
| XRT | 00031921015 | 22-02-11 | SIMS | 2.22 | 0.96 | 21.7 | 2.47 | 1.85 | 0.63 | 595.40/632 |
| PCA | 96065-03-01-03 | 23-02-11 | SIMS | 2.29 | 1.10 | 6.43 | 0.79 | 0.68 | 0.11 | 45.12/42 |
| PCA | 96065-03-02-00 | 26-02-11 | SIMS | 2.38 | 0.93 | 11.50 | 0.68 | 0.59 | 0.08 | 43.59/42 |
| PCA | 96420-01-01-00 | 02-03-11 | HIMS | 2.22 | 1.10 | 2.69 | 0.47 | 0.43 | 0.04 | 44.52/42 |
| PCA | 96420-01-01-01 | 03-03-11 | SIMS | 2.30 | 1.14 | 4.36 | 0.49 | 0.40 | 0.09 | 39.42/42 |
| PCA | 96420-01-01-02 | 03-03-11 | SIMS | 2.41 | 0.82 | 6.08 | 0.35 | 0.33 | 0.02 | 40.78/42 |
| PCA | 96420-01-02-00 | 04-03-11 | SIMS/HIMS | 2.39 | 1.23 | 12.30 | 1.81 | 1.48 | 0.33 | 31.89/42 |
| PCA | 96420-01-02-01 | 06-03-11 | HIMS | 2.44 | 1.15 | 16.30 | 1.83 | 1.50 | 0.33 | 33.58/42 |
| PCA | 96420-01-02-02 | 08-03-11 | HIMS | 2.34 | 1.24 | 13.87 | 1.77 | 1.46 | 0.31 | 40.75/42 |
| PCA | 96420-01-02-03 | 10-03-11 | HIMS | 2.39 | 1.23 | 10.97 | 1.72 | 1.42 | 0.29 | 41.17/42 |
| PCA | 96420-01-03-00 | 12-03-11 | SIMS | 2.47 | 0.89 | 4.47 | 0.31 | 0.28 | 0.03 | 42.12/42 |
| PCA | 96420-01-05-02 | 25-03-11 | SIMS | 2.34 | 1.15 | 20.6 | 1.75 | 1.23 | 0.51 | 43.78/42 |
| Characteristic | IGR J170913624 | GRS 1915+105 |
|---|---|---|
| parameters | (variable state/-like class) | (‘’ class) |
| Oscillation timescale | 20 s 50 s | 40 s 110 s |
| Change in timescale | increases with time | increases with time |
| 1.32 mHz/day | 0.36 mHz/day | |
| Peak to minimum | 2.91 3.82 | 3.38 4.28 |
| flux ratio | ||
| X-ray flux and | strong anti-correlation found | strong anti-correlation found |
| hard color relation | ||
| Variability pattern | slow exponential rise (ti=trise 14.67) | slow exponential rise (ti=trise 13.68) |
| (fitting with f(t)=ae) | fast decay (ti=tfall -3.62) | fast decay (ti=tfall -2.48) |
| QPOs | 26.3 mHz, 52.8 mHz (on 31 Mar. 11) | 9.7 mHz & 19.2 mHz (on 26 May 97) |
| 36.6 mHz, 75.9 mHz (on 03 Apr. 11) | 12.1 mHz & 24.3 mHz (on 03 Jun. 97) | |
| 45.9 mHz, 94.2 mHz (on 10 Apr. 11) etc. | 18.5 mHz, 37.9 mHz (on 22 Jun. 97) |