11email: gorellana@udec.cl,nagar@astro-udec.cl 22institutetext: ESA Astrophysics Missions Div, ESTEC/SRE-SA Keplerlaan 1, NL-2201 AZ, Noordwijk, The Netherlands
33institutetext: Centre for Astrophysics Research, University of Hertfordshire, College Lane, Hatfield AL10 9AB
44institutetext: INAF-Osservatorio Astronomico di Roma, via di Frascati 33, 00040 Monte Porzio Catone, Italy 55institutetext: Institute of Astronomy, University of Cambridge, Madingley Road, Cambridge CB3 OHA
66institutetext: Dipartimento di Fisica e Astronomia, Universitá degli Studi di Firenze, Largo E. Fermi 2, Firenze, Italy 77institutetext: INAF-Osservatorio Astrofisico di Arcetri, Largo E. Fermi 5, 50125 Firenze, Italy
Sub-millimeter Detected z 2 Radio-quiet QSOs
Abstract
Context. We present near-IR spectroscopy of a sample of luminous (; ), sub-millimeter-detected, dusty ( ), radio-quiet quasi-stellar objects (QSOs) at z.
Aims. A primary aim is to provide a more accurate QSO redshift determination in order to trace kinematics and inflows/outflows in these sub-mm bright QSOs. Additionally, the H and continuum properties allow an estimation of the black hole mass and accretion rate, offering insights into the starburst-AGN connection in sub-mm bright QSOs.
Methods. We measure the redshift, width, and luminosity of the H line, and the continuum luminosity near H. Relative velocity differences between H and rest-frame UV emission lines are used to study the presence and strength of outflows/inflows. Luminosities and line widths are used to estimate the black hole masses, bolometric luminosities, Eddington fractions, and accretion rates; these are compared to the star-formation-rate (SFR), estimated from the sub-mm derived far-infrared (FIR) luminosity. Finally our sub-mm-bright QSO sample is compared with other QSO samples at similar redshifts.
Results. The H emission line was strongly detected in all sources. Two components – a very broad (5000 km s-1) Gaussian and an intermediate-width (1500 km s-1) Gaussian, were required to fit the H profile of all observed QSOs. Narrow (1000 km s-1) lines were not detected in the sample QSOs. The rest-frame UV emission lines in these sub-mm bright QSOs show larger than average blue-shifted velocities, potentially tracing strong – up to 3000 km s-1 – outflows in the Broad Line Region. With the exception of the one QSO which shows exceptionally broad H lines, the black hole masses of the QSO sample are in the range log MBH = 9.0–9.7 and the Eddington fractions are between 0.5 and 1. In black hole mass and accretion rate, this sub-mm bright QSO sample is indistinguishable from the Shemmer et al. (2004) optically-bright QSO sample at z; the latter is likely dominated by sub-mm dim QSOs. Previous authors have demonstrated a correlation, over six orders of magnitude, between SFR and accretion rate in active galaxies: the sub-mm bright QSOs lie at the upper extremes of both quantities and their SFR is an order of magnitude higher than that predicted from the correlation.
Conclusions.
Key Words.:
high-redshift; quasars: emission lines; quasars: general: sub-millimeter: galaxies ; galaxies: active1 Introduction
There is now general agreement that dormant black holes, believed to be QSO ‘relics’, are common, perhaps ubiquitous, in nearby galactic nuclei (e.g., Soltan, 1982; Ferrarese & Merritt, 2000; Tremaine et al., 2002; Yu & Tremaine, 2002; Marconi et al., 2004; Merloni & Heinz, 2008; Shankar, 2009, and references therein). The correlation between the mass of the black hole and the structural parameters of the galaxy spheroid (, e.g., Kormendy & Richstone, 1995; Magorrian et al., 1998; Gebhardt et al., 2000; Tremaine et al., 2002; Marconi & Hunt, 2003; Häring & Rix, 2004; Hopkins et al., 2007; Gültekin et al., 2009) suggests an intimate connection between the existence of a luminous QSO phase and the formation of massive, early-type galaxies. The peak in the space density of QSOs at z2 (Schmidt et al., 1991; Wall et al., 2005) suggests that these massive black holes formed at early epochs. It seems that all sufficiently massive bulges undergo a QSO phase with the AGN fueled by the initial collapse of the host object at high redshift. This picture is supported by the detection of massive elliptical galaxies hosting all luminous, nearby QSOs (Bahcall et al., 1997; McLure et al., 1999). Any account of bulge formation evolution which disregards the coevolution of the central black hole – or vice versa– is fundamentally incomplete (Kauffmann & Haehnelt, 2000; Shankar, 2009). A continuing task is to unify different galaxy types with varied luminosities into a common evolutionary scenario or parameter space.
Over the last few years we have pursued a highly successful program aimed at elucidating the star formation history of optically-bright radio-quiet QSO host galaxies (Priddey et al., 2007; Robson et al., 2004; Priddey et al., 2003a; Omont et al., 2003; Priddey et al., 2003b; Isaak et al., 2002; Omont et al., 2001; McMahon et al., 1999; Omont et al., 1996a; McMahon et al., 1994; Isaak et al., 1994) via the detection of thermal emission from cool (50 K) dust with SCUBA, MAMBO and their single-pixel/few-pixel predecessors. Optically-bright QSOs were targeted as likely signposts to massive underlying host galaxies in an era before large blind sub-mm surveys were possible. This program concentrated on radio-quiet (to minimize the contamination of synchrotron emission to the sub-mm fluxes) QSOs at both the highest redshift (z4) and at the epoch of peak QSO activity (z2). Typical star formation rates (SFRs) - estimated from the conversion of sub-mm fluxes into far-infrared (FIR) luminosities and then SFRs (e.g., McMahon et al., 1999) - of /yr were found in sub-mm detected QSOs, although rates upto /yr are observed in some cases, e.g., the spectacular merging system in the z=4.7 QSO BR12020725. Note that these SFRs are estimated under the assumption that the sub-mm sources are not lensed. This intense star-formation scenario is supported by the detection of the essential molecular material (e.g., Solomon & Vanden Bout, 2005; Maiolino et al., 2007; Coppin et al., 2008), and the presence of luminous Polycyclic aromatic hydrocarbon (PAH) emission (Lutz et al., 2008) in several of the sub-mm detected QSOs. The correlation between PAH emission and sub-mm emission (Lutz et al., 2007, 2008) supports star formation related heating of the dust rather than AGN heating. The studies of optically bright, radio-quiet QSOs at z2 (Priddey et al., 2003a; Omont et al., 2003) were the first systematic studies of the star-formation properties of QSOs at the epoch that spans the peak of AGN activity (Schmidt et al., 1991; Wall et al., 2005) and resulted in the mm and sub-mm detection of 18 QSOs in the redshift range 1.5 z 3.0. The observing approach adopted in the SCUBA (850m) survey was to identify the very brightest (850m flux 7mJy) of the sub-mm-bright QSO host galaxies with the aim of establishing a small sample suitable for follow-up observations in the pre-ALMA era to search for the molecular gas reservoir expected in these prodigiously star-forming galaxies. Assuming accretion onto a black hole at the Eddington rate, with efficiency , the typical observed z2 optically-bright (-band absolute magnitude -) QSO is hosted by a spheroid of mass M☉.
Previous redshifts of QSOs in the z2 sub-mm detected sample were based on broad (5,000-10,000 km s-1) high-ionization rest-frame UV lines that are observed in the optical, e.g., C IV, C III], Ly, and N IV. Different broad emission lines in an ensemble of QSOs show systematically different redshifts, with the high-ionization lines (e.g., C IV1549, C III]1909) displaying mean velocity differences of 500 km s-1 and dispersions (1) about this mean of 100200 km s-1 (Tytler & Fan, 1992; Vanden Berk et al., 2001). In addition it is not clear if the broad lines trace the systemic redshift of the host galaxy (as represented by the stellar content of the galaxy). Penston (1977) proposed that the gas which emits narrow forbidden lines (e.g., [O III]) in active galaxies is likely to give a good estimate of the systemic center-of-mass redshift. This low density gas comes from a region 1 kpc in extent and its motion should be dominated by the stellar density field in contrast to the broad line region gas which lies within a few parsecs of the central black hole. In local active galaxies, redshifts from these narrow (1000 km s-1) forbidden lines have shown agreement to 100 km s-1 of the accepted systemic rest-frame determined from stellar absorption features and HI 21 cm emission in host galaxies.
Broad permitted lines in QSOs, both rest-frame UV lines (Brotherton et al., 1994) and H (Hu et al., 2008), can often be decomposed into a very broad component (5000 km s-1) and an intermediate-width component (1500-3000 km s-1; typically 0.4 times the width of the very broad component). The corresponding intermediate line region (ILR) is interpreted to be the outer regions of the broad line region (BLR) and may be dominated by infall (Hu et al., 2008). The velocity shift between the ILR emission lines and the [O III] lines is typically within a few hundreds of km s-1 (Hu et al., 2008). The former is thus a better tracer of the QSO systemic velocity in comparison to rest-frame UV lines.
![[Uncaptioned image]](/html/1105.1149/assets/x1.png)
Black hole masses in QSOs can be estimated via scaling relations derived from reverberation mapping (Blandford & McKee, 1982; Vestergaard & Peterson, 2006) results: specifically via a single epoch measurement of a continuum luminosity (representing BLR size; Kaspi et al., 2000) and the FWHM of a broad permitted line, e.g., H, H, C IV (representing gas velocity in the BLR; Bentz et al., 2009). The most direct and best characterized single-epoch method, derived from reverberation mapping results in nearby (relatively low luminosity) Seyfert galaxies, is via the pair L5100 and FWHMHβ. The single-epoch black hole mass estimation based on this pair is expected to be accurate to a factor 2, (e.g., Bentz et al., 2009). The extrapolation of this black hole mass estimator to high luminosity QSOs has been questioned on two main fronts: (a) is the relationship between continuum luminosity and BLR size (the relationship; Kaspi et al., 2005) unchanged at higher luminosities? Initial results with the C IV line (Kaspi et al., 2007) imply that it is relatively unchanged though a firm result using the H line is awaited (Botti et al., 2010). The results in this work are relatively unaffected by small changes in the relationship – currently tested to continuum luminosities up to Log ( Lλ) = 46 (Bentz et al., 2009) – as the QSOs discussed here have continuum luminosities of Log ( Lλ) 46.3–46.8; (b) should the FWHM of the H line be estimated only from the Very Broad Line Region (VBLR) profile or from the combined VBLR and ILR profile? It is not uncommon that reverberation-mapped Seyferts show complex broad line profiles which cannot be fit with a single broad Gaussian. Further, complex gas motions including inflows and outflows are seen in these Seyferts (e.g., Denney et al., 2009). Even in these complex cases it appears that using a simplistic FWHM for the full H profile (after subtraction of only the NLR emission) does not appreciably change the scaling relations used to estimate the black hole mass (Denney et al., 2010). On the other hand, there is some evidence that only a few local Seyferts (2 of 10 studied) show a true ILR component; for these, the inclusion of the ILR component in the FWHM measurement leads to erroneous black hole estimations (Zhu et al., 2009; Zhu & Zhang, 2010).
An initial motivation of this work was the derivation of an accurate QSO redshift in order to obtain molecular gas detections on instruments with bandwidth 1-2 GHz. This required redshifts accurate to, e.g., 1% at the 115 GHz CO J:1-0 line. The recent availability of extremely wide-band receivers, e.g., Z-SPEC, ZEUS, GBT-Spec, has now relaxed this requirement for a very accurate redshift. Rest-frame optical spectroscopy of these unique sub-mm-bright QSOs also permits constraints on their black hole masses and accretion rates, thus allowing comparisons between galaxy and black hole growth. Further, an accurate systemic velocity allows better constraints on the kinematics of the nuclear gas.
In this work we present near-IR spectroscopy probing the H line and nearby continuum in ten of the 18 QSOs in a z2 sub-mm detected QSO sample. The sample selection, observations, and data processing are summarized in Sect. 2, results are presented in Sect. 3, and a brief discussion and concluding remarks are presented in Sect. 4. Luminosity distances of the QSOs were calculated using a Hubble constant = 72 km s-1 Mpc-1, , , , and q0=.
2 Sample, Observations, and Data Processing
The sample is drawn from Priddey et al. (2003a) and Omont et al. (2003). Priddey et al. (2003a) surveyed 57 optically luminous (M), radio-quiet QSOs at z2 from the Large Bright Quasar Survey (LBQS; Hewett et al., 1995) and the Hamburg Bright Quasar Survey (HBQS; Hagen et al., 1999; Engels et al., 1998; Reimers et al., 1995) at 850m with JCMT/SCUBA. Here radio quiet was defined by a non-detection in the NRAO VLA Sky Survey (NVSS), i.e. S 1.5 mJy111The assumption of a spectral index or steeper would imply S 0.1 mJy.. Priddey et al. (2003a) detected 9 QSOs at a significance of 3 or greater; these have 850m fluxes in the range 7–17 mJy. The remaining QSOs have 3 flux density limits in the range 6–10 mJy. Omont et al. (2003) surveyed 35 optically luminous (M) radio-quiet QSOs with z at 1.2 mm with IRAM/MAMBO and detected 9 QSOs with 1.2 mm fluxes of 3.2–10.7 mJy; the remaining QSOs have 3 flux density limits in the range 1.8–4 mJy. The Omont et al. (2003) sample was drawn from the AGN catalog of Veron-Cetty & Veron (2000) and included a variety of QSO surveys, among them the HBQS, the LBQS, the Second Byurakan Survey (SBS; Stepanian et al., 2001) and the Hewitt-Burbidge QSO compilation (HB89; Hewitt & Burbidge, 1989). Of the 83 unique QSOs surveyed by Priddey et al. and Omont et al., nine QSOs were observed by both. Of these nine, eight were not detected in both studies while HS B1049+4033 was detected by Omont et al. but not detected by Priddey et al. Thus, combining the samples of Priddey et al. and Omont et al. resulted in 83 observed QSOs of which 18 were detected at 850m or 1.2 mm. Given the relatively high upper-limits of the QSOs not detected at 850m and/or 1.2 mm (in many cases the 3 flux upper-limits are higher than the fluxes of the weaker sub-mm detected QSOs), we refrain from using the term sub-mm bright, and instead refer to the 18 QSOs as sub-mm detected QSOs, and the remaining as sub-mm non-detected QSOs. We have obtained near-IR spectra of ten of these 18 sub-mm detected QSOs, listed in Table Sub-millimeter Detected z 2 Radio-quiet QSOs, which therefore form the sub-mm detected QSO sample discussed in this work.
Observations were conducted on 2002 March 28, and 2002 September 20 at the 3.6 meter Telescopio Nazionale Galileo (TNG) at La Palma, using the Near-IR Camera and Spectrograph (NICS) instrument with a detector based on a HgCdTe Hawaii 1024x1024 array (Baffa et al., 2001). On 2002 March 28, we used TNG/NICS with the Kb grism and a slit-width of 07 or 1″. This yielded the wavelength range 1.91m to 2.38m at a dispersion of 4.5Å per pixel i.e. R1250 for a 1″ slit. On 2002 September 20, we used TNG/NICS with the HK grism and a slit of 1″ width. This yielded the wavelength range 1.37m to 2.49m at a dispersion of 11Å per pixel. Standard calibration frames were taken at the beginning and end of the observing night. The QSOs were observed using typical integration times of 120 sec in an “ABBA” nodding pattern. The distance between “A” and “B” positions was roughly 15″, and was varied slightly on each nod. Total integrations were typically 30–40 min on-source per QSO. At least two telluric ‘standard star’ observations were obtained on each night (Table Sub-millimeter Detected z 2 Radio-quiet QSOs).
All spectra were first “straightened’ using 54 strong night sky lines. Xe and Ar lamp exposures, taken at the beginning and end of the night, were used for initial wavelength calibration, with individual lines identified using the line-lists (in vacuum wavelengths) available from the ESO/ISAAC website222http://www.eso.org/instruments/isaac/tools. The Ar spectrum is richer in lines in the case of the Kb grism: of these we used 11 reliable lines. The Xe spectrum contributed three additional lines to the Kb grism observations. These 14 lines ranged between 19823Å and 23200Å, which nicely covered the full wavelength range of our setup: 19157Å to 23800Å. Two QSOs - [HB89]0933+733 and SBS B1408+567 - have H lines which fell at the red-most end of the CCD: in these cases we checked that using additional weaker Ar and Xe lines in the red-most region gave a similar wavelength calibration solution. The final wavelength solution from the lamps had an r.m.s. about 0.3Å, with almost all points well within 0.5Å of the fit. In the case of the HK grism, we used only the Ar lamp, which yielded 34 usable lines, between 13179Å and 23973Å. The final fit had an r.m.s. of 4Å; at the blue end the points were all within Å while at the red end the points were all within Å. The wavelength calibration was checked both with the calibration star spectra and with night sky lines: in all cases the observed lines were within 1Å (March 2002) or 3Å (September 2002) of their expected values. In the case of data taken in March 2002, the expected wavelength of the night sky lines was shifted by a consistent amount (within 3Å) in observations made towards the end of the night. The latter shift was probably due to a slight change in tilt of the grism with telescope movement, and we corrected the wavelength solution of the target objects with an equivalent zero-point shift. The accuracy of the wavelength calibration was therefore within 2Å or 30 km s-1 at the typical observed wavelengths of the H line.
Finally, QSO spectra were continuum subtracted assuming a linear baseline and the Specfit (Kriss, 1994) package within IRAF was used to obtain Gaussian and Lorentzian fits to the H line profile. The very broad profiles of the lines results in an uncertainty of about 5–10Å in the fitted central wavelengths (10–15Å for the September 2002 data due to its lower spectral resolution). This is the dominant source of measurement error in the redshift determinations.
We note that NICS data was taken soon after instrument commissioning, at a time when telescope and instrument pointing was still being fine tuned. The telescope nodding along the slit was therefore slightly inaccurate, and the counts on the standard stars and QSOs varied, in the worst case, by up to 20% between exposures. Flux calibration was performed by comparing the best spectra of the standard stars to the expected spectra as estimated from black body fits to the V- to K-band magnitudes of the standard stars. The flux calibrated QSO spectra were then used to estimate the J, H, and K-band magnitudes of the QSOs. We found that the spectral fluxes had to be increased by 30% in order to be consistent with the observed 2MASS magnitudes of the QSOs. This correction, likely the result of slit losses, was thus applied to all QSO spectra.
We use the primary QSO samples of Shemmer et al. (2004), Netzer et al. (2007) and Alexander et al. (2008) to compare and contrast the properties of our QSO sample. Shemmer et al. (2004) present the results of new rest-frame optical spectra of a sample of 29 high-redshift (typically z2.3) luminous (L ) QSOs and Netzer et al. (2007) present the results of new rest-frame optical spectroscopy of 15 luminous QSOs at z2.3–3.4. Alexander et al. (2008) present a sample of z2 sub-millimeter detected galaxies (SMGs) which exhibit broad H or broad H emission. All three works use the results of the rest-frame optical spectroscopy to derive estimates of the black hole mass and related quantities which are directly comparable to our results. In all cases we convert listed fluxes into luminosities using the cosmological parameters of this work. We also use the results of Coppin et al. (2008) who present rest-frame optical spectroscopy of a sample of sub-mm detected QSOs, four of which are also in our sample.
3 Results
3.1 H Profile Fits
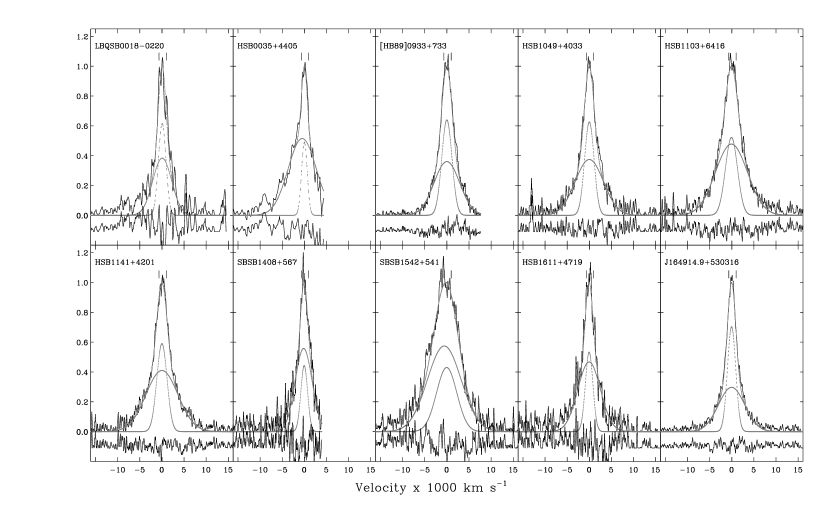
Spectra covering the region near the H line are shown in Fig. 1 for all observed QSOs. None of the sample QSOs have H profiles which can be satisfactorily fit with a single Gaussian. Two components, a very broad (4500–9000 km s-1) Gaussian and an intermediate-width (typically 1500-3200 km s-1) Gaussian, are instead required. Narrow lines (1000 km s-1) are not clearly detected in any of the sample QSOs, though there is a very tentative detection of narrow H + [N II] lines in LBQS B0018-0220 (Fig. 1). Both the very broad and the intermediate-width Gaussian components are centered on more or less the same wavelength (differences of 10 Å or 120 km s-1), for all QSOs except SBS B1542+541, which has exceptionally wide ILR and VBLR H components and an obvious blue shoulder, and HS B0035+4405, for which a reliable double-Gaussian fit was difficult given that the red wing of the H profile extended beyond the observed range. In the two latter cases, the difference between the fitted central wavelengths of the very broad and intermediate-width Gaussian components, 40Å, represents a velocity difference of about 500 km s-1. On the other hand, a single Lorentzian profile provides a satisfactory fit to the bulk of the H line profile in most QSOs, with the main drawback of potentially overestimating the line profile in the outer wings. This single Lorentzian fit to the H profile has a central wavelength similar to, or the same as, that of the intermediate-width Gaussian component in the double-Gaussian fit.
We calculate the systemic redshift of the QSO from the central wavelength of the intermediate-width (ILR) component of the double-Gaussian fit to H. The total flux of the H line is taken as the summed flux of the double-Gaussian fit. Given our non-detection of any narrow (NLR) component, the measured H fluxes and widths are dominated by the BLR (VBLR plus ILR). The estimation of black hole masses for the sample QSOs requires the measurement of the full-width at half maximum (FWHM) of the broad component of the H emission profile, i.e. the FWHM of the H profile after subtraction of any narrow (1000 km s-1) component. Given that a single Gaussian does not provide a good fit to the line profile and that the narrow component is not detected in any QSO, we calculate the FWHM of the H line profile from the summed double-Gaussian fit, and refer to this quantity as FWHMHα. This FWHMHα is within 50–100 km s-1 of the FWHM of the single Lorentzian fit for all QSOs except SBS B1542+541 for which the difference is 620 km s-1 (Table Sub-millimeter Detected z 2 Radio-quiet QSOs).
The double-Gaussian fits to the H lines are shown in Fig. 1 for the sample QSOs, and the corresponding line centers, FWHMs and fluxes of each Gaussian component are listed in Table Sub-millimeter Detected z 2 Radio-quiet QSOs. Values of the FWHM of the single-Lorentzian fit and of FWHMHα are also listed in the same table.
3.2 Systemic Redshifts and Velocity Offsets
In this section we first compare our redshift estimations to previously obtained redshifts based on rest-frame-optical spectroscopy. We then analyze differences between redshifts derived from H and from rest-frame UV spectroscopy for the sample QSOs. We further study in detail the velocity offsets between individual emission lines for the subset of the sample QSOs which have high quality rest-frame UV spectra. Finally, we contrast the sub-mm detected and sub-mm non-detected QSOs in the parent samples of Priddey et al. (2003a) and Omont et al. (2003) with respect to velocity offsets seen in different emission lines.
Four of our sample QSOs are also in the sample of Coppin et al. (2008), who present results of near-IR spectroscopic observations which include the [O III]5007, H and H emission lines, and observations of the J:3-2 or J:2-1 transition of CO. Coppin et al. (2008) derived QSO systemic redshifts via fits to the H and [O III] lines. A comparison between our H determined redshifts and those of Coppin et al. (2008) shows an agreement of within 300 km s-1 in two QSOs, but larger differences in HS B1611+4719 and SBS B1542+541 (Fig. 3). The latter is the QSO in which both ILR and VBLR H components have exceptionally large widths and in which a notable H blue shoulder is seen. Our H derived redshift is therefore probably not as accurate as the [O III] and CO derived redshifts of (Coppin et al., 2008). In the case of HS B1611+4719, our relatively reliable fit to the H line results in a H redshift which is offset by 900 km s-1 from the H and [O III] derived redshift, but offset by only 280 km s-1 from the CO derived redshift (Coppin et al., 2008).
Our H derived redshifts are systematically higher (Fig. 2) than those derived from optical spectroscopy (i.e. based on rest-frame UV lines). The rest-frame UV redshifts originate from very heterogenous observations with diverse resolutions and spectral ranges: these are taken from, in order of preference: SDSS, Hewett et al. (1995), Hewitt & Burbidge (1989), Stepanian et al. (2001), and the Hamburg Bright Quasar Survey (Hagen et al., 1999; Engels et al., 1998). Of these, only the SDSS redshifts have quoted uncertainties; the other sources do not explicitly specify uncertainties. In the latter cases we use indicative uncertainties estimated from the spectral resolution and/or the number of significant digits quoted. The median difference is z = 0.018 and the mean difference is z, corresponding to V km s-1 at wavelengths near H. The largest redshift differences are typically for zrestUV from the Hamburg Bright Quasar Survey which has a low resolution (typically 15Å), limited (and relatively blue) spectral coverage, and few significant figures in the reported redshift (with no errors specified), while the smallest differences are typically for zrestUV from the SDSS. Thus the redshift differences larger than z 0.02 are likely the result of the low spectral resolution, the limited set of lines used, and the low precision, of the redshifts derived from rest-frame UV lines. Limiting ourselves to the QSOs with accurate rest-frame UV redshifts the typical rest-frame optical to rest-frame UV redshift difference is 0.013, or 4000 km s-1.

In order to better determine the velocity offsets of individual rest-frame UV lines we limited ourselves to the sample QSOs for which high quality rest-frame UV spectra exist. To this end, we searched the Sloan Digital Sky Survey (SDSS; Data Release 7; DR7) archive for spectra of all QSOs in the samples of Priddey et al. (2003a) and Omont et al. (2003) and also those of Coppin et al. (2008). We use the DR7 spectra and their associated “SpecLine” tables which tabulate the SDSS automated fits to all detected emission and absorption lines in the spectra. We selected emission lines from the SpecLine tables using the following criteria: (a) line width () between 20Å and 200Å. The lower limit avoids spurious line detections and the upper limit avoids lines which are suspect and/or cannot yield sufficiently accurate line centers; (b) error in less than the line width (); (c) error in less than 0.5% of . Since the SDSS line identification and fitting are automatic, there are some errors in the database of line parameters. We therefore continuum subtracted the SDSS spectra using a polynomial baseline fit and revised all lines selected above, manually re-fitting the line centers and widths if necessary. This led to a change in the central wavelengths and widths of some lines and the elimination of other lines. The re-fitted values of and their 1 errors were used to derive relative velocities between emission lines. When a H or [O III] derived redshift was available, this was used as the systemic redshift; else only relative velocities between rest-frame UV lines were analyzed.


A comparison of the velocity offsets between emission lines for the QSOs in our sample and those of Coppin et al. (2008) are shown in Fig. 3. Almost all rest-frame UV emission lines show large blue-shifted velocities; several factors higher than typically seen in QSOs (Tytler & Fan, 1992; Vanden Berk et al., 2001), with the most extreme blue-shifted velocities seen in HS B1049+4033. We note that HS B1049+4033 is not extreme in its sub-mm properties: it was detected at 1.2 mm (3.2 mJy; Omont et al., 2003) but not detected at 850m (3.93.2 mJy; Priddey et al., 2003a). Vanden Berk et al. (2001) present median velocities for emission lines relative to [O III]5007 for over 2000 QSOs from the SDSS over the redshift range . Relative to the [O III] line, they find median velocity differences of 27 km s-1 for H, 70 km s-1 for N V, 563 km s-1 for C IV, 224 km s-1 for C III], and 161 km s-1 for Mg II. Relative to H (or in the absence of H, relative to [O III]) derived redshifts, the sub-mm detected QSOs in Fig. 3 have C IV velocities of km s-1 to km s-1, and C III] velocities between 900 km s-1 to 2070 km s-1 except for SMMJ 123716.01+620323.3 which has a C III] velocity of 1500 km s-1 relative to the [O III] systemic velocity published by Coppin et al. (2008). Note that the sample QSOs show small blue-shifted velocities for Mg II and Ly instead of the small median redshifted velocities seen in the QSO sample of Vanden Berk et al. (2001); the Ly velocity offsets seen in Fig. 3 are not reliable as the Ly line center is difficult to ascertain given its blue-ward absorption and the contamination from the N V line.
In the case of the parent samples of sub-mm detected QSOs vs. sub-mm non-detected QSOs (Priddey et al., 2003a; Omont et al., 2003), 40 of the 89 QSOs have SDSS spectra and also appear in the compilation of Shen et al. (2010). In this larger sample, we do not have reliable QSO systemic velocities via the H or [O III] line for all QSOs and therefore only tested for relative velocity offsets between rest-frame UV lines. No significant difference between the sub-mm detected and sub-mm non-detected sub-samples was found. We also used the velocity offsets of the C IV and Mg II emission lines listed in the Shen et al. (2010) compilation of QSO properties (these are the only two rest-frame UV emission lines for which velocity offsets from the SDSS-derived systemic QSO velocity are listed in the compilation). Note that Shen et al. (2010) used negative velocities to indicate redshift, while we use positive velocities to indicate redshift. The velocity offsets of the C IV lines are not significantly different for the sub-mm detected and non-detected subsamples (left panel of Fig. 4). Velocity offsets for the C IV and Mg II lines were calculated relative to the SDSS-derived redshift of the QSO. This SDSS-derived redshift – based on a cross correlation of narrow emission and absorption lines – does not necessarily trace the systemic redshift of the QSO as it is likely biased by the large velocity offsets in rest-frame UV emission-lines as discussed previously. The Mg II line typically shows velocity offsets which are smaller than those of the C IV line, e.g., Vanden Berk et al. (2001) and Fig. 3. We thus also compare the velocities of the C IV lines relative to those of the Mg II lines, which potentially better represent the velocity offset of the C IV lines from the true systemic QSO redshifts (middle panel of Fig. 4). While both subsamples show large blue-shifted velocities, there is no clear difference between the two subsamples.
3.3 Black Hole Masses and Related Properties
The relationships between the three primary measurements used in this section - H luminosity, FWHMHα, and continuum luminosity - are shown in Fig. 5. The H and continuum luminosities are proportional (left panel of Fig. 5), with a continuum luminosity a factor of 2 higher than would be expected from the extrapolation of the same relationship applied to a large sample of SDSS galaxies (log L4345; Greene & Ho, 2005). This correlation is unlikely to be due to a distance bias: the QSOs in the sample have similar redshifts, and a similar correlation is seen in the equivalent flux-flux plot. There is no clear relationship between FWHMHα and both the luminosity of the H line and the continuum luminosity (Fig. 5). Compared to the sub-mm detected z2 galaxies with broad H or broad H from Alexander et al. (2008), our sample QSOs all have higher H luminosities, but show a considerable overlap in H line widths. In continuum luminosity and FWHMHα, our sample QSOs are very similar to the QSO sample studied by Shemmer et al. (2004), but typically an order of magnitude more luminous in the continuum than the QSO sample of Netzer et al. (2007).


Estimates for the black hole masses, Eddington fractions (i.e. the fractional Eddington rate), mass accretion rates, and FIR luminosities are listed in Table Sub-millimeter Detected z 2 Radio-quiet QSOs for the 10 sample QSOs. We estimated the black hole masses and Eddington fractions of the sample QSOs from the empirical scalings derived from reverberation mapping results. Specifically, we used eqn. 1 of Greene & Ho (2005) to convert FWHMHα to FWHMHβ and then estimated the black hole mass from FWHMHβ and L5100 following eqn. 5 of Vestergaard & Peterson (2006). Following Kaspi et al. (2000), Marconi et al. (2004), and Netzer & Trakhtenbrot (2007) we use L5100 = Lλ with = 5100Å, and L L5100. Eddington fractions were computed assuming this bolometric luminosity, and the mass accretion rate was computed assuming a 10% accretion efficiency (). We calculated the FIR luminosity from the sub-mm flux (850m or 1.2 mm) following McMahon et al. (1999) and using and dust temperature Td = 40 K. Finally, the star formation rate (SFR) was calculated from the FIR luminosity following McMahon et al. (1999) and using the Kennicutt (1998) relation, i.e. .
The relations we used are therefore:
lEdd = LBol/LEdd = 7 L5100/LEdd
The lower rest-wavelength limit of our near-IR spectra is typically 5500Å to 6000Å. Given that the spectral slope in the 5500Å–6500Å range is relatively flat for the QSOs in our sample we simply approximate that the 5100Å flux is the same as the 5500Å or 6000Å flux. FWHMHα, the FWHM of the H line profile as measured from the sum of the double-Gaussian fit, was used in the black hole mass related calculations. If the FWHM of only the very broad (VBLR) Gaussian component of the H line is used instead, the resulting black hole masses would increase by a factor of 5. We also estimated the black hole masses following the scaling relations in Marconi et al. (2008) with and without radiation pressure effects, and in Greene & Ho (2005); in all cases except one, the black hole mass estimates remain within a factor of 2–3 for almost all QSOs in the sample. The exception is the Marconi et al. (2008) relation which includes radiation pressure effects: here the high continuum luminosities of the sample QSOs result in the radiation term dominating the black hole mass estimate, i.e. the estimate is relatively independent of line width. The use of FWHMHα and LHα to estimate the black hole mass (following eqn. 6 of Greene & Ho, 2005) leads to slightly lower black hole masses in all QSOs (Table Sub-millimeter Detected z 2 Radio-quiet QSOs) due to the slightly higher than usual luminosity of L5100 compared to LHα (Fig. 5).
Errors in the black hole mass were estimated both by Monte Carlo simulations assuming Gaussian errors for the input quantities and by the analytical calculation of the error propagation (Bevington & Robinson, 1992). Both methods resulted in consistent error estimates, with errors around 10%. Note, however, that these errors represent only the measurement errors and the true error in the black hole mass is likely closer to a factor 4 (e.g., Vestergaard & Peterson, 2006). For the other derived quantities (e.g., lEdd) errors were calculated by analytical error propagation.
Two of the sample QSOs have black hole estimates derived from the Mg II and C IV lines in Shen et al. (2010). For HS B1049+4033, our estimated value lies close to the values (9.5 to 9.8 with typical error of 0.07 as estimated from three different scaling relationships) estimated from Mg II and significantly lower than the value (10.210.06) estimated from C IV. For HS B1103+6416, our estimated value is significantly lower than that listed in Shen et al. (2010): 10.40.06 and 10.30.03 for Mg II and C IV, respectively. We remark that that using the FWHM of the very broad (VBLR) Gaussian component to calculate the H based black hole mass leads to a better agreement with the C IV and Mg II based black hole mass estimates.
The left panel of Fig. 6 contrasts the relationship between the fractional Eddington rate and black hole mass of sub-mm detected QSOs in our sample to two other QSO samples at z2; those of Shemmer et al. (2004) and Netzer et al. (2007). All three samples have a similar range of black hole masses, though the QSOs of the Shemmer et al. sample and our sample are accreting at relatively large Eddington fractions. Combining this result with that seen in the right panel of Fig. 5 shows that our sub-mm detected QSO sample is virtually indistinguishable from the QSO sample of Shemmer et al. (2004). This result is not very sensitive to the exact scalings used in the black hole mass estimation (see the arrows in the figure): if the scaling relations are modified, all QSOs in the figure will shift their position in a relatively consistent manner. Note that the scaling relations we use imply that L/L L (FWHM and M L (FWHM. Thus Fig. 6 plots highly related quantities, so that any subtle correlations or anti-correlations seen are to be treated with caution. As mentioned in Sect. 1, it may be more correct to estimate QSO black hole masses from the FWHM of the very broad (VBLR) component instead of FWHMHα. The right panel of Fig. 6 demonstrates the implications of using the VBLR width in the black hole mass estimation: black hole masses increase, and fractional Eddington rates decrease, by a factor of 5. The comparison QSOs (Shemmer et al., 2004; Netzer et al., 2007) will also change positions in this plot, but in an unknown way as their VBLR widths are not listed by the corresponding authors.
The relationship between FIR luminosity (proportional to the star-formation rate) and the mass accretion rate onto the black hole (proportional to LBol) for the QSO sample is shown in Fig. 7. Trakhtenbrot & Netzer (2010) have studied a large sample of Seyferts and QSOs with redshifts , bolometric luminosities in the range , and SFRs in the range M☉ yr-1, and find that these can be well characterized by a single relationship (black line in Fig. 7):
Our sample QSOs are found close to the highest end of this relationship and offset from it in having SFRs almost one magnitude higher. The sample of 12 millimeter-bright z2 QSOs studied by Lutz et al. (2008) with Spitzer are also shown for comparison: four of their targets are also present in our sample. Lutz et al. (2008) estimated SFR and bolometric luminosity from PAH-emission and 60m continuum, respectively, leading to some differences from the values derived by us.


Finally, we compare the black hole mass distributions of the parent sample of sub-mm detected and non-detected QSOs. Of the 89 QSOs in the samples of Priddey et al. (2003a) and Omont et al. (2003), 40 appear in the compilation of Shen et al. (2010). Shen et al. (2010) list, among other quantities, the black hole masses derived from the C IV and Mg II lines and nearby continuum. The black hole mass distributions of the sub-mm detected and sub-mm non-detected QSOs (right panel of Fig. 4) are not significantly different. To realize this figure, we derived the black hole mass of the QSO by using, in order of preference, our H derived black hole mass, or the Mg II or C IV derived black hole mass listed in Shen et al. (2010). This resulted in black hole masses for 14 sub-mm detections and 33 sub-mm non-detections.
4 Discussion and Concluding Remarks
We have observed the H line and neighboring continuum in 10 of the 18 sub-mm detected QSOs from a parent sample of 83 optically-bright QSOs at z2. The properties of these 10 QSOs have been compared with a sample of sub-mm detected galaxies and two other samples of optically-bright z QSOs. We have also attempted to compare the 18 sub-mm detected QSOs with the 65 sub-mm non-detected QSOs in the parent sample. This comparison is limited by two factors; (a) the lack of accurate systemic velocities for the sub-mm non-detected QSOs and. (b) the relatively low sub-mm fluxes of some of the sub-mm detected QSOs coupled with the relatively high detection limits of the sub-mm surveys makes it difficult to clearly separate sub-mm bright QSOs from sub-mm dim QSOs. That is, it would not be surprising if some of the QSOs not detected in the sub-mm have sub-mm fluxes similar to the weakest sub-mm detected QSOs. Nevertheless, the parent sample used here (18 detections in a sample of 83 QSOs) is sufficiently large to obtain meaningful comparisons between sub-mm-bright QSOs and other QSOs.
The H line profiles can be decomposed into contributions from both a very broad line region (VBLR) and an intermediate-width line region (ILR), similar to the cases of H and C IV in QSOs. Both components show similar redshifts in most of the QSOs, and the ratios of the VBLR to ILR widths (1.7–5 with a median of 3.0) are not different from the typical ratios (2.5) found for H profiles in QSOs (Hu et al., 2008). The ILR has been interpreted to be the outer portion of the BLR and may originate from a physically distinct region (Hu et al., 2008). Its inclusion in the black hole mass estimation has been questioned (Zhu et al., 2009). Following previous works, we estimate the QSO black hole masses using the combined VBLR+ILR width, but also discuss the implications of using only the VBLR width.
We have made the reasonable assumption that the intermediate-width (ILR) component of the broad H emission closely traces the true systemic velocity of the QSO. A blind comparison of H-based redshifts derived here with previous redshifts based on high-ionization rest-frame UV-lines shows larger than expected redshift differences (Fig. 2). However, the largest differences are seen in QSOs whose rest-frame UV redshifts are imprecise, inaccurate, and/or for which redshift errors have not been provided. For example, the HBQS and LBQS quote redshifts for these QSOs to the second decimal place (i.e. an accuracy of 1500 km s-1 if the redshift values were rounded or 3000 km s-1 if truncated). Limiting ourselves to the QSOs with accurate rest-frame UV redshifts, the typical rest-frame optical to rest-frame UV redshift difference is 0.013, or 4000 km s-1. Further limiting ourselves to only sample QSOs with reliable rest-frame UV spectroscopy from SDSS, we find larger than average velocity offsets (up to 3400 km s-1) for individual rest-frame UV lines (Fig. 3). Given the large obscuration expected in sub-mm QSOs (nuclear dust would obscure gas on the far side of the AGN), these velocity offsets most likely trace ionized gas outflows. The lack of accurate redshifts for the sub-mm non-detected QSOs makes it impossible to definitively test whether these powerful inflows/outflows are found only in the sub-mm detected QSOs and not in the sub-mm non-detected QSOs from the parent samples.
Black hole mass estimates used in this work are based on the FWHM of the H line (FWHMHα) and the continuum luminosity. Using the H luminosity instead of continuum luminosity lowers the masses by 3. Using the width of the very broad Gaussian component (i.e. the VBLR only instead of both VBLR and ILR) to estimate the black hole mass increases the black hole mass estimates by 5 and changes the interpretation of the black hole growth phase in the QSO sample (Fig. 6). This uncertainty, coupled with the uncertainty of applying reverberation-mapping-based scaling relations at these high continuum luminosities limits the reliability of our results, and those of other similar works.
We find no significant differences in the distributions of black hole masses or emission-line velocity offsets between the subsamples of sub-mm detected and non-detected QSOs from the parent samples of Priddey et al. (2003a) and Omont et al. (2003). Furthermore, Priddey et al. (2003a) and Omont et al. (2003) did not find any other predictor of sub-mm loudness. The lack of rest-frame optical spectroscopy of the sub-mm non-detected QSOs limits any comparison, though it is reasonable to assume that their properties are similar to other z2 QSOs (e.g. the samples of Shemmer et al. (2004) and Netzer et al. (2007)).
The sub-mm detected QSOs studied here have the highest rest-frame optical continuum luminosities among sub-mm detected galaxies thus far studied in rest-frame optical spectroscopy (e.g. Fig. 5). These sub-mm detected QSOs host black holes in the typical range of luminous QSOs at redshift z2, and are accreting at close to their Eddington limit (Fig. 6). In black hole mass and Eddington fraction they are indistinguishable from the optically-luminous QSO sample of Shemmer et al. (2004). The latter sample has not been studied in the sub-mm though it is reasonable to assume that it is dominated by sub-mm dim QSOs. If black hole masses in the sub-mm detected QSOs are estimated from the VBLR width only, then black hole masses increase, and Eddington fractions decrease, by a factor of 5. In this case the sub-mm detected QSOs host relatively massive black holes which are accreting at a fraction of the Eddington rate. In this case we are unable to make a meaningful comparison to the QSO samples of Shemmer et al. (2004) and Netzer et al. (2007) as VBLR widths are not quoted in their studies. In brief, the sub-mm detected QSOs are, thus far, indistinguishable from the typical z2 QSO population apart from their relatively high sub-mm fluxes.
Netzer et al. (2007) and Trakhtenbrot & Netzer (2010) have demonstrated a correlation between SFR and mass accretion rate in active galaxies, valid over six orders of magnitude. The extreme SFRs and mass accretion rates of the sub-mm detected QSOs places them in the vicinity of the extreme end of this trend (Fig. 7). However, they are offset from the relationship in having a factor 10 higher SFR. Within the sub-mm detected QSO sample, there is a weak indication that the strongest star forming QSOs have the lowest black hole masses and mass accretion rates (Fig. 7), but this weak trend is within the scatter seen when other QSOs are included in the plot. Maiolino et al. (2007) and Lutz et al. (2008) have studied the SFR accretion-rate correlation in a sample of optically-luminous QSOs observed with Spitzer and noted that the SFR potentially flattens at the highest bolometric luminosities. Adding the data from our sample of QSOs (which changes some of the previous large upper-limits on the SFR into known lower values) appears to support their findings.
Acknowledgements.
We note with great sadness that Robert Priddey passed away on 20th February 2010. The authors acknowledge the contribution of the full TNG/NICS engineering team, and thank B. Trakhtenbrot, H. Netzer, and the anonymous referee, for useful suggestions. KGI acknowledges the support of a PPARC fellowship during the time at which this project was initiated. NN acknowledges funding from Conicyt-ALMA 31070013 and 3108022, the Fondap Center for Astrophysics, BASAL PFB-06/2007, and Fondecyt 1080324. Part of this work was carried out while NN was a postdoctoral fellow at Arcetri Observatory and Kapteyn Institute.References
- Alexander et al. (2005) Alexander, D. M., Bauer, F. E., Chapman, S. C., Smail, I., Blain, A. W., Brandt, W. N., & Ivison, R. J. 2005, ApJ, 632, 736
- Alexander et al. (2008) Alexander, D. M., et al . 2008, ApJ, 135, 1968
- Bahcall et al. (1997) Bahcall, J. N., Kirhakos, S., Saxe, D. H., & Schneider, D. P. 1997, ApJ, 479, 642
- Baffa et al. (2001) Baffa, C., et al. 2001, A&A, 378, 722
- Bentz et al. (2009) Bentz, M. C., Peterson, B. M., Netzer, H., Pogge, R. W., & Vestergaard, M. 2009, ApJ, 697, 160
- Bevington & Robinson (2003) Bevington, P. R., & Robinson, D. K. 2003, Boston, MA: McGraw-Hill, ISBN 0-07-247227-8, 3rd ed.
- Bevington & Robinson (1992) Bevington, P. R., & Robinson, D. K. 1992, New York: McGraw-Hill, 1992, 2nd ed.,
- Blandford & McKee (1982) Blandford, R. D., & McKee, C. F. 1982, ApJ, 255, 419
- Brotherton et al. (1994) Brotherton, M. S., Wills, B. J., Francis, P. J., & Steidel, C. C. 1994, ApJ, 430, 495
- Botti et al. (2010) Botti, I., Lira, P., Netzer, H., & Kaspi, S. 2010, IAU Symposium, 267, 198
- Coppin et al. (2008) Coppin, K. E. K., et al. 2008, MNRAS, 389, 45
- Denney et al. (2009) Denney, K. D., et al. 2009, ApJ, 704, L80
- Denney et al. (2010) Denney, K. D., et al. 2010, ApJ, 721, 715
- Engels et al. (1998) Engels, D., Hagen, H.-J., Cordis, L., Koehler, S., Wisotzki, L., & Reimers, D. 1998, A&AS, 128, 507
- Ferrarese & Merritt (2000) Ferrarese, L., & Merritt, D. 2000, ApJ, 539, L9
- Gebhardt et al. (2000) Gebhardt, K., et al. 2000, ApJ, 543, L5
- Greene & Ho (2005) Greene, J. E., & Ho, L. C. 2005, ApJ, 630, 122
- Gültekin et al. (2009) Gültekin, K., et al. 2009, ApJ, 695, 1577
- Hagen et al. (1999) Hagen, H.-J., Engels, D., & Reimers, D. 1999, A&AS, 134, 483
- Hainline et al. (2004) Hainline, L. J., Scoville, N. Z., Yun, M. S., Hawkins, D. W., Frayer, D. T., & Isaak, K. G. 2004, ApJ, 609, 61
- Häring & Rix (2004) Häring, N., & Rix, H.-W. 2004, ApJ, 604, L89
- Hewett et al. (1995) Hewett, P. C., Foltz, C. B., & Chaffee, F. H. 1995, AJ, 109, 1498
- Hewitt & Burbidge (1989) Hewitt, A., & Burbidge, G. 1989, ApJS, 69, 1
- Hopkins et al. (2007) Hopkins, P. F., Lidz, A., Hernquist, L., Coil, A. L., Myers, A. D., Cox, T. J., & Spergel, D. N. 2007, ApJ, 662, 110
- Hu et al. (2008) Hu, C., Wang, J.-M., Ho, L. C., Chen, Y.-M., Bian, W.-H., & Xue, S.-J. 2008, ApJ, 683, L115
- Isaak et al. (2002) Isaak, K. G., Priddey, R. S., McMahon, R. G., Omont, A., Peroux, C., Sharp, R. G., & Withington, S. 2002, MNRAS, 329, 149
- Isaak et al. (1994) Isaak, K. G., McMahon, R. G., Hills, R. E., & Withington, S. 1994, MNRAS, 269, L28
- Kaspi et al. (2007) Kaspi, S., Brandt, W. N., Maoz, D., Netzer, H., Schneider, D. P., & Shemmer, O. 2007, ApJ, 659, 997
- Kaspi et al. (2005) Kaspi, S., Maoz, D., Netzer, H., Peterson, B. M., Vestergaard, M., & Jannuzi, B. T. 2005, ApJ, 629, 61
- Kaspi et al. (2000) Kaspi, S., Smith, P. S.,Netzer, H., Maoz, D., Jannuzi, B. T., & Giveon, U. 2000, ApJ, 533, 631
- Kauffmann & Haehnelt (2000) Kauffmann, G., & Haehnelt, M. 2000, MNRAS, 311, 576
- Kennicutt (1998) Kennicutt, R. C., Jr. 1998, ARA&A, 36, 189
- Kormendy & Richstone (1995) Kormendy, J., & Richstone, D. 1995, ARA&A, 33, 581
- Kriss (1994) Kriss, G. 1994, Astronomical Data Analysis Software and Systems, 3, 437
- Lutz et al. (2007) Lutz, D., et al. 2007, ApJ, 661, L25
- Lutz et al. (2008) Lutz, D., et al. 2008, ApJ, 684, 853
- Magorrian et al. (1998) Magorrian, J., et al. 1998, AJ, 115, 2285
- Maiolino et al. (2007) Maiolino, R., et al. 2007, A&A, 472, L33
- Marconi & Hunt (2003) Marconi, A., & Hunt, L. K. 2003, ApJ, 589, L21
- Marconi et al. (2004) Marconi, A., Risaliti, G., Gilli, R., Hunt, L. K., Maiolino, R., & Salvati, M. 2004, MNRAS, 351, 169
- Marconi et al. (2008) Marconi, A., Axon, D. J., Maiolino, R., Nagao, T., Pastorini, G., Pietrini, P., Robinson, A., & Torricelli, G. 2008, ApJ, 678, 693
- McLure et al. (1999) McLure, R. J., Kukula, M. J., Dunlop, J. S., Baum, S. A., O’Dea, C. P., & Hughes, D. H. 1999, MNRAS, 308, 377
- McMahon et al. (1999) McMahon, R. G., Priddey, R. S., Omont, A., Snellen, I., & Withington, S. 1999, MNRAS, 309, L1
- McMahon et al. (1994) McMahon, R. G., Omont, A., Bergeron, J., Kreysa, E., & Haslam, C. G. T. 1994, MNRAS, 267, L9
- Merloni & Heinz (2008) Merloni, A., & Heinz, S. 2008, MNRAS, 388, 1011
- Nagao et al. (2006) Nagao, T., Marconi, A., & Maiolino, R. 2006, A&A, 447, 157
- Netzer et al. (2007) Netzer, H., Lira, P.,Trakhtenbrot, B., Shemmer, O., & Cury, I. 2007, ApJ, 671, 1256
- Netzer & Trakhtenbrot (2007) Netzer, H., & Trakhtenbrot, B. 2007, ApJ, 654, 754
- Tytler & Fan (1992) Tytler, D., & Fan, X.-M. 1992, ApJS, 79, 1
- Omont et al. (2003) Omont, A., Beelen, A., Bertoldi, F., Cox, P., Carilli, C. L., Priddey, R. S., McMahon, R. G., & Isaak, K. G. 2003, A&A, 398, 857
- Omont et al. (2001) Omont, A., Cox, P., Bertoldi, F., McMahon, R. G., Carilli, C., & Isaak, K. G. 2001, A&A, 374, 371
- Omont et al. (1996a) Omont, A., McMahon, R. G., Cox, P., Kreysa, E., Bergeron, J., Pajot, F., & Storrie-Lombardi, L. J. 1996, A&A, 315, 1
- Omont et al. (1996b) Omont, A., Petitjean, P., Guilloteau, S., McMahon, R. G., Solomon, P. M., & Pécontal, E. 1996, Nature, 382, 428
- Penston (1977) Penston, M. V. 1977, MNRAS, 180, 27P
- Priddey et al. (2003a) Priddey, R. S., Isaak, K. G., McMahon, R. G., & Omont, A. 2003, MNRAS, 339, 1183
- Priddey et al. (2003b) Priddey, R. S., Isaak, K. G., McMahon, R. G., Robson, E. I., & Pearson, C. P. 2003, MNRAS, 344, L74
- Priddey et al. (2007) Priddey, R. S., Gallagher, S. C., Isaak, K. G., Sharp, R. G., McMahon, R. G., & Butner, H. M. 2007, MNRAS, 374, 867
- Reimers et al. (1995) Reimers, D., Rodriguez-Pascual, P., Hagen, H.-J., & Wisotzki, L. 1995, A&A, 293, L21
- Robson et al. (2004) Robson, I., Priddey, R. S., Isaak, K. G., & McMahon, R. G. 2004, MNRAS, 351, L29
- Schmidt et al. (1991) Schmidt, M., Schneider, D. P., & Gunn, J. E. 1991, The Space Distribution of Quasars, 21, 109
- Shankar (2009) Shankar, F. 2009, New A Rev., 53, 57
- Shemmer et al. (2004) Shemmer, O.,Netzer, H.,Maiolino, R., Oliva, E., Croom, S., Corbett, E., & di Fabrizio, L. 2004, ApJ, 614, 547
- Shen et al. (2010) Shen, Y., et al. 2010, arXiv:1006.5178
- Solomon & Vanden Bout (2005) Solomon, P. M., & Vanden Bout, P. A. 2005, ARA&A, 43, 677
- Soltan (1982) Soltan, A. 1982, MNRAS, 200, 115
- Stepanian et al. (2001) Stepanian, J. A., Green, R. F., Foltz, C. B., Chaffee, F., Chavushyan, V. H., Lipovetsky, V. A., & Erastova, L. K. 2001, AJ, 122, 3361
- Trakhtenbrot & Netzer (2010) Trakhtenbrot, B., & Netzer, H. 2010, MNRAS, 406, L35
- Tremaine et al. (2002) Tremaine, S., et al. 2002, ApJ, 574, 740
- Vanden Berk et al. (2001) Vanden Berk, D. E., et al. 2001, AJ, 122, 549
- Veron-Cetty & Veron (2000) Veron-Cetty, M. P., & Veron, P. 2000, VizieR Online Data Catalog, 7215, 0
- Vestergaard & Peterson (2006) Vestergaard, M., & Peterson, B. M. 2006, ApJ, 641, 689
- Wall et al. (2005) Wall, J. V., Jackson, C. A., Shaver, P. A., Hook, I. M., & Kellermann, K. I. 2005, A&A, 434, 133
- Yu & Tremaine (2002) Yu, Q., & Tremaine, S. 2002, MNRAS, 335, 965
- Zhu & Zhang (2010) Zhu, L., & Zhang, S. 2010, Science in China G: Physics and Astronomy, 53, 196
- Zhu et al. (2009) Zhu, L., Zhang, S. N., & Tang, S. 2009, ApJ, 700, 1173
![[Uncaptioned image]](/html/1105.1149/assets/x14.png)
![[Uncaptioned image]](/html/1105.1149/assets/x15.png)