Mutual information rate and bounds for it
Abstract
The amount of information exchanged per unit of time between two nodes in a dynamical network or between two data sets is a powerful concept for analysing complex systems. This quantity, known as the mutual information rate (MIR), is calculated from the mutual information, which is rigorously defined only for random systems. Moreover, the definition of mutual information is based on probabilities of significant events. This work offers a simple alternative way to calculate the MIR in dynamical (deterministic) networks or between two data sets (not fully deterministic), and to calculate its upper and lower bounds without having to calculate probabilities, but rather in terms of well known and well defined quantities in dynamical systems. As possible applications of our bounds, we study the relationship between synchronisation and the exchange of information in a system of two coupled maps and in experimental networks of coupled oscillators.
I Introduction
Shannon’s entropy quantifies information shannon . It measures how much uncertainty an observer has about an event being produced by a random system. Another important concept in the theory of information is the mutual information shannon . It measures how much uncertainty an observer has about an event in a random system X after observing an event in a random system Y (or vice-versa).
Mutual information is an important quantity because it quantifies not only linear and non-linear interdependencies between two systems or data sets, but also is a measure of how much information two systems exchange or two data sets share. Due to these characteristics, it became a fundamental quantity to understand the development and function of the brain sporns_TCS2004 ; roland , to characterise juergen_EPJ2009 ; palus and model complex systems fraser_PRA1986 ; ulrich_kluwer1998 ; kantz_book or chaotic systems, and to quantify the information capacity of a communication system haykin_book . When constructing a model of a complex system, the first step is to understand which are the most relevant variables to describe its behaviour. Mutual information provides a way to identify those variables rossi .
However, the calculation of mutual information in dynamical networks or data sets faces three main difficultiespaninski ; palus ; steuer ; papana . Mutual information is rigorously defined for random memoryless processes, only. In addition, its calculation involves probabilities of significant events and a suitable space where probability is calculated. The events need to be significant in the sense that they contain as much information about the system as possible. But, defining significant events, for example the fact that a variable has a value within some particular interval, is a difficult task because the interval that provides significant events is not always known. Finally, data sets have finite size. This prevents one from calculating probabilities correctly. As a consequence, mutual information can often be calculated with a bias, only paninski ; palus ; steuer ; papana .
In this work, we show how to calculate the amount of information exchanged per unit of time [Eq. (3)], the so called mutual information rate (MIR), between two arbitrary nodes (or group of nodes) in a dynamical network or between two data sets. Each node representing a d-dimensional dynamical system with state variables. The trajectory of the network considering all the nodes in the full phase space is called “attractor” and represented by . Then, we propose an alternative method, similar to the ones proposed in Refs. baptista_PRE2008 ; baptista_PLOSONE2008 , to calculate significant upper and lower bounds for the MIR in dynamical networks or between two data sets, in terms of Lyapunov exponents, expansion rates, and capacity dimension. These quantities can be calculated without the use of probabilistic measures. As possible applications of our bounds calculation, we describe the relationship between synchronisation and the exchange of information in small experimental networks of coupled Double-Scroll circuits.
In previous works of Refs. baptista_PRE2008 ; baptista_PLOSONE2008 , we have proposed an upper bound for the MIR in terms of the positive conditional Lyapunov exponents of the synchronisation manifold. As a consequence, this upper bound could only be calculated in special complex networks that allow the existence of complete synchronisation. In the present work, the proposed upper bound can be calculated to any system (complex networks and data sets) that admits the calculation of Lyapunov exponents.
We assume that an observer can measure only one scalar time series for each one of two chosen nodes. These two time series are denoted by and and they form a bidimensional set , a projection of the “attractor” into a bidimensional space denoted by . To calculate the MIR in higher-dimensional projections , see Supplementary Information. Assume that the space is coarse-grained in a square grid of boxes with equal sides , so .
Mutual information is defined in the following way shannon . Given two random variables, X and Y, each one produces events and with probabilities and , respectively, the joint probability between these events is represented by . Then, mutual information is defined as
| (1) |
= , = , and . For simplification in our notation for the probabilities, we drop the subindexes X, Y, and XY, by making , , and . When using Eq. (1) to calculate the mutual information between the dynamical variables and , the probabilities appearing in Eq. (1) are defined such that is the probability of finding points in a column of the grid, of finding points in the row of the grid, and the probability of finding points where the column meets the line of the grid.
The MIR was firstly introduced by Shannon shannon as a “rate of actual transmission” blanc and later more rigorously redefined in Refs. dobrushin1959 ; gray1980 . It represents the mutual information exchanged between two dynamical variables (correlated) per unit of time. To simplify the calculation of the MIR, the two continuous dynamical variables are transformed into two discrete symbolic sequences and . Then, the MIR is defined by
| (2) |
where represents the usual mutual information between the two sequences and , calculated by considering words of length .
The MIR is a fundamental quantity in science. Its maximal value gives the information capacity between any two sources of information (no need for stationarity, statistical stability, memoryless) verdu . Therefore, alternative approaches for its calculation or for the calculation of bounds of it are of vital relevance. Due to the limit to infinity in Eq. (2) and because it is defined from probabilities, the MIR is not easy to be calculated especially if one wants to calculate it from (chaotic) trajectories of a large complex network or data sets. The difficulties faced to estimate the MIR from dynamical systems and networks are similar to the ones faced in the calculation of the Kolmogorov-Sinai entropy, kolmogorov , (Shannon’s entropy per unit of time). Because of these difficulties, the upper bound for proposed by Ruelle ruelle in terms of the Lyapunov exponents and valid for smooth dynamical systems (, where represent all the positive Lyapunov exponents) or the Pesin’s equality pesin () proved in Ref. ledrapier to be valid for the large class of systems that possess a SRB measure, became so important in the theory of dynamical systems. Our upper bound [Eq. (13)] is a result equivalent to the work of Ruelle.
II Main results
One of the main results of this work (whose derivation can be seen in Sec. III.2) is to show that, in dynamical networks or data sets with fast decay of correlation, in Eq. (1) represents the amount of mutual information between and produced within a special time interval , where represents the time for the dynamical network (or data sets) to lose its memory from the initial state or the correlation to decay to zero. Correlation in this work is not the usual linear correlation, but a non-linear correlation defined in terms of the evolution of spatial probabilities, the quantity in Sec. III.1. Therefore, the mutual information rate (MIR), between the dynamical variables and (or two data sets) can be estimated by
| (3) |
In systems that present sensitivity to initial conditions, e.g. chaotic systems, predictions are only possible for times smaller than this time . This time has other meanings. It is the expected time necessary for a set of points belonging to an -square box in to spread over and it is of the order of the shortest Poincaré return time for a point to leave a box and return to it gao ; baptista_PLA2010 . It can be estimated by
| (4) |
where is the largest positive Lyapunov exponent measured in . Chaotic systems present the mixing property (see Sec. III.1), and as a consequence the correlation always decays to zero, surely after an infinitely long time. The correlation of chaotic systems can also decay to zero for sufficiently large but finite (see Supplementary Information). can be interpreted to be the minimum time required for a system to satisfy the conditions to be considered mixing. Some examples of physical systems that are proved to be mixing and have exponentially fast decay of correlation are nonequilibrium steady-state nonequilibrium , Lorenz gases (models of diffusive transport of light particles in a network of heavier particles) sinai_1970 , and billiards young_2001 . An example of a “real world” physical complex system that presents exponentially fast decay of correlation is plasma turbulence baptista_PHYSICAA2001 . We do not expect that data coming from a “real world” complex system is rigorously mixing and has an exponentially fast decay of correlation. But, we expect that the data has a sufficiently fast decay of correlation (e.g. stretched exponential decay or polynomially fast decays), implying that the system has sufficiently high sensitivity to initial conditions and as a consequence , for a reasonably small and finite time .
The other two main results of our work are presented in Eqs. (5) and (7), whose derivations are presented in Sec. III.3. The upper bound for the MIR is given by
| (5) |
where and (positive defined) represent the largest and the second largest Lyapunov exponent measured in , if both exponents are positive. If the -largest exponent is negative, then we set . If the set represents a periodic orbit, , and therefore there is no information being exchanged. The quantity is defined as
| (6) |
where is the number of boxes that would be covered by fictitious points at time . At time , these fictitious points are confined in an -square box. They expand not only exponentially fast in both directions according to the two positive Lyapunov exponents, but expand forming a compact set, a set with no “holes”. At , they spread over .
The lower bound for the MIR is given by
| (7) |
where represents the capacity dimension of the set
| (8) |
where represents the number of boxes in that are occupied by points of .
is defined in a way similar to the capacity dimension, thought it is not the capacity dimension. In fact, , because measures the change in the number of occupied boxes in as the space resolution varies, whereas measures the relative number of boxes with a certain fixed resolution that would be occupied by the fictitious points (in ) after being iterated for a time . As a consequence, the empty space in that is not occupied by does not contribute to the calculation of , whereas it contributes to the calculation of the quantity . In addition, (for any ), because while the fictitious points form a compact set expanding with the same ratio as the one for which the real points expand (ratio provided by the Lyapunov exponents), the real set of points might not occupy many boxes.
III Methods
III.1 Mixing, correlation decay and invariant measures
Denote by a mixing transformation that represents how a point is mapped after a time into , and let to represent the probability of finding a point of in (natural invariant density). Let represent a region in . Then, , for represents the probability measure of the region . Given two square boxes and , if is a mixing transformation, then for a sufficiently large , we have that the correlation , decays to zero, the probability of having a point in that is mapped to is equal to the probability of being in times the probability of being in . That is typically what happens in random processes.
If the measure is invariant, then . Mixing and ergodic systems produce measures that are invariant.
III.2 Derivation of the mutual information rate (MIR) in dynamical networks and data sets
We consider that the dynamical networks or data sets to be analysed present either the mixing property or have fast decay of correlations, and their probability measure is time invariant. If a system that is mixing for a time interval is observed (sampled) once every time interval , then the probabilities generated by these snapshot observations behave as if they were independent, and the system behaves as if it were a random process. This is so because if a system is mixing for a time interval , then the correlation decays to zero for this time interval. For systems that have some decay of correlation, surely the correlation decays to zero after an infinite time interval. But, this time interval can also be finite, as shown in Supplementary Information.
Consider now that we have experimental points and they are sampled once every time interval . The probability of the sampled trajectory to follow a given itinerary, for example to fall in the box with coordinates and then be iterated to the box depends exclusively on the probabilities of being at the box , represented by , and being at the box , represented by . Therefore, for the sampled trajectory, . Analogously, the probability of the sampled trajectory to fall in the column (or line) of the grid and then be iterated to the column (or line) is given by .
The MIR of the experimental non-sampled trajectory points can be calculated from the mutual information of the sampled trajectory points that follow itineraries of length :
| (9) |
Due to the absence of correlations of the sampled trajectory points, the mutual information for these points following itineraries of length can be written as
| (10) |
where = , = , and , and , , and represent the probability of the sampled trajectory points to fall in the line of the grid, in the column of the grid, and in the box of the grid, respectively.
Due to the time invariance of the set assumed to exist, the probability measure of the non-sampled trajectory is equal to the probability measure of the sampled trajectory. If a system that has a time invariant measure is observed (sampled) once every time interval , the observed set has the same natural invariant density and probability measure of the original set. As a consequence, if has a time invariant measure, the probabilities , , and (used to calculate ) are equal to , , and .
Consequently, , , and , and therefore . Substituting into Eq. (9), we finally arrive to
| (11) |
where between two nodes is calculated from Eq. (1).
Therefore, in order to calculate the MIR, we need to estimate the time for which the correlation of the system approaches zero and the probabilities , , of the experimental non-sampled experimental points to fall in the line of the grid, in the column of the grid, and in the box of the grid, respectively.
III.3 Derivation of an upper () and lower () bounds for the MIR
Consider that our attractor is generated by a 2d expanding system that possess 2 positive Lyapunov exponents and , with . . Imagine a box whose sides are oriented along the orthogonal basis used to calculate the Lyapunov exponents. Then, points inside the box spread out after a time interval to along the direction from which is calculated. At , , which provides in Eq. (4), since . These points spread after a time interval to along the direction from which is calculated. After an interval of time , these points spread out over the set . We require that for , the distance between these points only increases: the system is expanding.
Imagine that at , fictitious points initially in a square box occupy an area of . Then, the number of boxes of sides that contain fictitious points can be calculated by . From Eq. (4), , since .
We denote with a lower-case format, the probabilities , , and with which fictitious points occupy the grid in . If these fictitious points spread uniformly forming a compact set whose probabilities of finding points in each fictitious box is equal, then (), , and . Let us denote the Shannon’s entropy of the probabilities , and as , , and . The mutual information of the fictitious trajectories after evolving a time interval can be calculated by . Since, and , then . At , we have that and , leading us to . Therefore, defining, , we arrive at .
We defining as
| (12) |
where being the number of boxes that would be covered by fictitious points at time . At time , these fictitious points are confined in an -square box. They expand not only exponentially fast in both directions according to the two positive Lyapunov exponents, but expand forming a compact set, a set with no “holes”. At , they spread over .
Using and in Eq. (12), we arrive at , and therefore, we can write that
| (13) |
To calculate the maximal possible MIR, of a random independent process, we assume that the expansion of points is uniform only along the columns and lines of the grid defined in the space , i.e., , (which maximises and ), and we allow to be not uniform (minimising ) for all and , then
| (14) |
Since , dividing by , taking the limit of , and reminding that the information dimension of the set in the space is defined as =, we obtain that the MIR is given by
| (15) |
Since (for any value of ), then , which means that a lower bound for the maximal MIR [provided by Eq. (15)] is given by
| (16) |
But (for any value of ), and therefore is an upper bound for .
To show why is an upper bound for the maximal possible MIR, assume that the real points occupy the space uniformly. If , there are many boxes being occupied. It is to be expected that the probability of finding a point in a line or column of the grid is , and . In such a case, , which implies that . If , there are only few boxes being sparsely occupied. The probability of finding a point in a line or column of the grid is , and . There are lines and columns being occupied by points in the grid. In such a case, . Comparing with , and since and , then we conclude that , which implies that .
Notice that if and , then .
III.4 Expansion rates
In order to extend our approach for the treatment of data sets coming from networks whose equations of motion are unknown, or for higher-dimensional networks and complex systems which might be neither rigorously chaotic nor fully deterministic, or for experimental data that contains noise and few sampling points, we write our bounds in terms of expansion rates defined in this work by
| (17) |
where we consider . measures the largest growth rate of nearby points. In practice, it is calculated by , with representing the largest distance between pair of points in an -square box and representing the largest distance between pair of the points that were initially in the -square box but have spread out for an interval of time . measures how an area enclosing points grows. In practice, it is calculated by , with representing the area occupied by points in an -square box, and the area occupied by these points after spreading out for a time interval . There are boxes occupied by points which are taken into consideration in the calculation of . An order- expansion rate, , measures on average how a hypercube of dimension exponentially grows after an interval of time . So, measures the largest growth rate of nearby points, a quantity closely related to the largest finite-time Lyapunov exponent celso1994 . And measures how an area enclosing points grows, a quantity closely related to the sum of the two largest positive Lyapunov exponents. In terms of expansion rates, Eqs. (4) and (13) read and , respectively, and Eqs. (12) and (16) read and , respectively.
From the way we have defined expansion rates, we expect that . Because of the finite time interval and the finite size of the regions of points considered, regions of points that present large derivatives, contributing largely to the Lyapunov exponents, contribute less to the expansion rates. If a system has constant derivative (hyperbolic) and has constant natural measure, then .
There are many reasons for using expansion rates in the way we have defined them in order to calculate bounds for the MIR. Firstly, because they can be easily experimentally estimated whereas Lyapunov exponents demand huge computational efforts. Secondly, because of the macroscopic nature of the expansion rates, they might be more appropriate to treat data coming from complex systems that contains large amounts of noise, data that have points that are not (arbitrarily) close as formally required for a proper calculation of the Lyapunov exponents. Thirdly, expansion rates can be well defined for data sets containing very few data points: the fewer points a data set contains, the larger the regions of size need to be and the shorter the time is. Finally, expansion rates are defined in a similar way to finite-time Lyapunov exponents and thus some algorithms used to calculate Lyapunov exponents can be used to calculate our defined expansion rates.
IV Applications
IV.1 MIR and its bounds in two coupled chaotic maps
To illustrate the use of our bounds, we consider the following two bidirectionally coupled maps
| (18) |
where . If , the map is piecewise-linear and quadratic, otherwise. We are interested in measuring the exchange of information between and . The space is a square of sides 1. The Lyapunov exponents measured in the space are the Lyapunov exponents of the set that is the chaotic attractor generated by Eqs. (18).
The quantities , , and are shown in Fig. 1 as we vary for (A) and (B). We calculate using in Eq. (1) the probabilities in which points from a trajectory composed of samples fall in boxes of sides =1/500 and the probabilities and that the points visit the intervals of the variable or of the variable , respectively, for . When computing , the quantity was estimated by Eq. (4). Indeed for most values of , and .
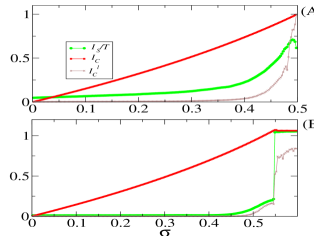
For there is no coupling, and therefore the two maps are independent from each other. There is no information being exchanged. In fact, and in both figures, since , meaning that the attractor fully occupies the space . This is a remarkable property of our bounds: to identify that there is no information being exchanged when the two maps are independent. Complete synchronisation is achieved and is maximal, for (A) and for (B). A consequence of the fact that , and therefore, . The reason is because for this situation this coupled system is simply the shift map, a map with constant natural measure; therefore and are constant for all and . As usually happens when one estimates the mutual information by partitioning the phase space with a grid having a finite resolution and data sets possessing a finite number of points, is typically larger than zero, even when there is no information being exchanged (). Even when there is complete synchronisation, we find non-zero off-diagonal terms in the matrix for the joint probabilities causing to be smaller than it should be. Due to numerical errors, , and points that should be occupying boxes with two corners exactly along a diagonal line in the subspace end up occupying boxes located off-diagonal and that have at least three corners off-diagonal. The estimation of the lower bound suffers from the same problems.
Our upper bound is calculated assuming that there is a fictitious dynamics expanding points (and producing probabilities) not only exponentially fast but also uniformly. The “experimental” numerical points from Eqs. (18) expand exponentially fast, but not uniformly. Most of the time the trajectory remains in 4 points: (0,0), (1,1), (1,0), (0,1). That is the main reason of why is much larger than the estimated real value of the , for some coupling strengths. If a two nodes in a dynamical network, such as two neurons in a brain, behave in the same way the fictitious dynamics does, these nodes would be able to exchange the largest possible amount of information.
We would like to point out that one of the main advantages of calculating upper bounds for the MIR () using Eq. (13) instead of actually calculating is that we can reproduce the curves for using much less number of points (1000 points) than the ones () used to calculate the curve for . If , can be calculated since and .
IV.2 MIR and its bounds in experimental networks of Double-Scroll circuits
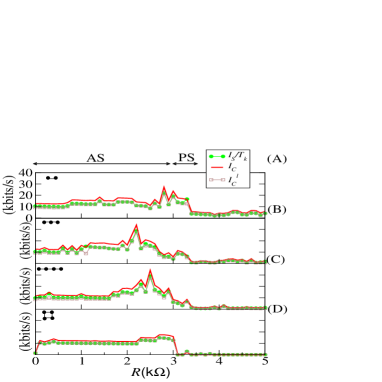
We illustrate our approach for the treatment of data sets using a network formed by an inductorless version of the Double-Scroll circuit inductorless_chua . We consider four networks of bidirectionally diffusively coupled circuits. Topology I represents two bidirectionally coupled circuits, Topology II, three circuits coupled in an open-ended array, Topology III, four circuits coupled in an open-ended array, and Topology IV, coupled in an closed array. We choose two circuits in the different networks (one connection apart) and collect from each circuit a time-series of 79980 points, with a sampling rate of samples/s. The measured variable is the voltage across one of the circuit capacitors, which is normalised in order to make the space to be a square of sides 1. Such normalisation does not alter the quantities that we calculate. The following results provide the exchange of information between these two chosen circuits. The values of and used to course-grain the space and to calculate in Eq. (17) are the ones that minimises and at the same time satisfy , where represents the number of fictitious boxes covering the set in a compact fashion, when . This optimisation excludes some non-significant points that make the expansion rate of fictitious points to be much larger than it should be. In other words, we require that describes well the way most of the points spread. We consider that used to calculate in Eq. (17) is the time for points initially in an -side box to spread to 0.8. That guarantee that nearby points in are expanding in both directions within the time interval . Using produces already similar results. If , the set might not be only expanding. might be overestimated.
has been estimated by the method in Ref. kraskov . Since we assume that the space where mutual information is being measured is 2D, we will compare our results by considering in the method of Ref. kraskov a 2D space formed by the two collected scalar signals. In the method of Ref. kraskov the phase space is partitioned in regions that contain 30 points of the continuous trajectory. Since that these regions do not have equal areas (as it is done to calculate and ), in order to estimate we need to imagine a box of sides , such that its area contains in average 30 points. The area occupied by the set is approximately given by , where is the number of occupied boxes. Assuming that the 79980 experimental data points occupy the space uniformly, then on average 30 points would occupy an area of . The square root of this area is the side of the imaginary box that would occupy 30 points. So, . Then, in the following, the “exact” value of the MIR will be considered to be given by , where is estimated by .
The three main characteristics of the curves for the quantities , , and (appearing in Fig. 2) with respect to the coupling strength are that (i) as the coupling resistance becomes smaller, the coupling strength connecting the circuits becomes larger, and the level of synchronisation increases followed by an increase in , , and , (ii) all curves are close, (iii) and as expected, for most of the resistance values, and . The two main synchronous phenomena appearing in these networks are almost synchronisation (AS) femat_PLA1999 , when the circuits are almost completely synchronous, and phase synchronisation (PS) juergen_book . For the circuits considered in Fig. 2, AS appears for the interval and PS appears for the interval . Within this region of resistance values the exchange of information between the circuits becomes large. PS was detected by using the technique from Refs. baptista_PHYSICAD2006 ; pereira_PRE2007 .
IV.3 MIR and its upper bound in stochastic systems
To analytically demonstrate that the quantities and can be well calculated in stochastic systems, we consider the following stochastic dynamical toy model illustrated in Fig. 3. In it points within a small box of sides (represented by the filled square in Fig. 3(A)) located in the centre of the subspace are mapped after one iteration of the dynamics to 12 other neighbouring boxes. Some points remain in the initial box. The points that leave the initial box go to 4 boxes along the diagonal line and 8 boxes off-diagonal along the transverse direction. Boxes along the diagonal are represented by the filled squares in Fig. 3(B) and off-diagonal boxes by filled circles. At the second iteration, the points occupy other neighbouring boxes, as illustrated in Fig. 3(C), and at the time the points do not spread any longer, but are somehow reinjected inside the region of the attractor. We consider that this system is completely stochastic, in the sense that no one can precisely determine the location of where an initial condition will be mapped. The only information is that points inside a smaller region are mapped to a larger region.
At the iteration , there will be boxes occupied along the diagonal (filled squares in Fig. 3) and (filled circles in Fig. 3) boxes occupied off-diagonal (along the transverse direction), where for =0, and for and . is a small number of iterations representing the time difference between the time for the points in the diagonal to reach the boundary of the space and the time for the points in the off-diagonal to reach this boundary. The border effect can be ignored when the expansion along the diagonal direction is much faster than along the transverse direction.
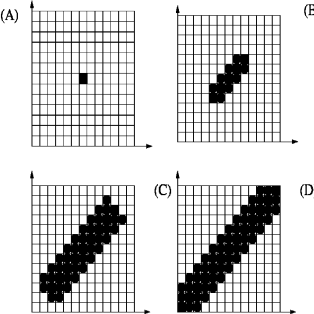
At the iteration , there will be boxes occupied by points. In the following calculations we consider that . We assume that the subspace is a square whose sides have length 1, and that , so . For , the attractor does not grow any longer along the off-diagonal direction. The time , for the points to spread over the attractor , can be calculated by the time it takes for points to visit all the boxes along the diagonal. Thus, we need to satisfy . Ignoring the 1 appearing in the expression for due to the initial box in the estimation for the value of , we arrive that . This stochastic system is discrete. In order to take into consideration the initial box in the calculation of , we pick the first integer that is larger than , leading to be the largest integer that satisfies
| (19) |
The largest Lyapunov exponent or the order-1 expansion rate of this stochastic toy model can be calculated by , which take us to
| (20) |
Therefore, Eq. (19) can be rewritten as .
The quantity can be calculated by , with . Neglecting and the 1 appearing in due to the initial box, we have that . Substituting in the definition of , we obtain . Using from Eq. (19), we arrive at
| (21) |
where
| (22) |
Placing and in , give us
| (23) |
Let us now calculate . Ignoring the border effect, and assuming that the expansion of points is uniform, then and . At the iteration , we have that . Since , we can write that . Placing from Eq. (19) into takes us to . Finally, dividing by , we arrive that
| (24) | |||||
As expected from the way we have constructed this model, Eq. (24) and (23) are equal and .
Had we included the border effect in the calculation of , denote the value by , we would have typically obtained that , since calculated considering a finite space would be either smaller or equal than the value obtained by neglecting the border effect. Had we included the border effect in the calculation of , denote the value by , typically we would expect that the probabilities would not be constant. That is because the points that leave the subspace would be randomly reinjected back to . We would conclude that . Therefore, had we included the border effect, we would have obtained that .
The way we have constructed this stochastic toy model results in . This is because the spreading of points along the diagonal direction is much faster than the spreading of points along the off-diagonal transverse direction. In other words, the second largest Lyapunov exponent, , is close to zero. Stochastic toy models which produce larger , one could consider that the spreading along the transverse direction is given by , with .
IV.4 Expansion rates for noisy data with few sampling points
In terms of the order-1 expansion rate, , our quantities read , , and . In order to show that our expansion rate can be used to calculate these quantities, we consider that the experimental system is uni-dimensional and has a constant probability measure. Additive noise is assumed to be bounded with maximal amplitude , and having constant density.
Our order-1 expansion rate is defined as
| (25) |
where measures the largest growth rate of nearby points. Since all it matters is the largest distance between points, it can be estimated even when the experimental data set has very few data points. Since, in this example, we consider that the experimental noisy points have constant uniform probability distribution, can be calculated by
| (26) |
where represents the largest distance between pair of experimental noisy points in an -square box and represents the largest distance between pair of the points that were initially in the -square box but have spread out for an interval of time . The experimental system (without noise) is responsible to make points that are at most apart from each other to spread to at most to apart from each other. This points spread out exponentially fast according to the largest positive Lyapunov exponent by
| (27) |
V Supplementary Information
V.1 Decay of correlation and First Poincaré Returns
As rigorously shown in young , the decay with time of the correlation, , is proportional to the decay with time of the density of the first Poincaré recurrences, , which measures the probability with which a trajectory returns to an -interval after iterations. Therefore, if decays with , for example exponentially fast, will decay with exponentially fast, as well. The relationship between and can be simply understood in chaotic systems with one expanding direction (one positive Lyapunov exponent). As shown in baptista_CHAOS2009 , the “local” decay of correlation (measured in the -interval) is given by , where is the probability measure of a chaotic trajectory to visit the -interval. Consider the shift map . For this map, and there are an infinite number of possible intervals that makes , for a finite . These intervals are the cells of a Markov partition. As recently demonstrated by [P. Pinto, I. Labouriau, M. S. Baptista], in piecewise-linear systems as the shift map, if is a cell in an order- Markov partition and , then and by the way a Markov partition is constructed we have that . Since that , we arrive at that , for a special finite time . Notice that can be rewritten as . Since for this map, the largest Lyapunov exponent is equal to , then , which is exactly equal to the quantity , the time interval responsible to make the system to lose its memory from the initial condition and that can be calculated by the time that makes points inside an initial -interval to spread over the whole phase space, in this case .
V.2 , and in larger networks and higher-dimensional subspaces
Imagine a network formed by coupled oscillators. Uncoupled, each oscillator possesses a certain amount of positive Lyapunov exponents, one zero, and the others are negative. Each oscillator has dimension . Assume that the only information available from the network are two dimensional measurements, or a scalar signal that is reconstructed to a -dimensional embedding space. So, the subspace has dimension , and each subspace of a node (or group of nodes) has dimension . To be consistent with our previous equations, we assume that we measure positive Lyapunov exponents on the projection . If , then in the following equations should be replaced by , naturally assuming that .
In analogy with the derivation of and in a bidimensional projection, we assume that if the spreading of initial conditions is uniform in the subspace . Then, represents the probability of finding trajectory points in -dimensional space of one node (or a group of nodes) and represents the probabilities of finding trajectory points in the -dimensional composed subspace constructed by two nodes (or two groups of nodes) in the subspace . Additionally, we consider that the hypothetical number of occupied boxes will be given by . Then, we have that , which lead us to
| (28) |
Similarly to the way we have derived in a bidimensional projection, if has more than 2 positive Lyapunov exponents, then
| (29) |
To write Eq. (28) in terms of the positive Lyapunov exponents, we first extend the calculation of the quantity to higher-dimensional subspaces that have dimensionality 2Q,
| (30) |
where are the Lyapunov exponents measured on the subspace . To derive this equation we only consider that the hypothetical number of occupied boxes is given by .
V.3 as a function of the positive Lyapunov exponents of the network
Consider a network whose attractor possesses positive Lyapunov exponents, denoted by , . For a typical subspace , measured on is equal to the largest Lyapunov exponent of the network. Just for the sake of simplicity, assume that the nodes in the network are sufficiently well connected so that in a typical measurement with a finite number of observations this property holds, i.e., . But, if measurements provide that , the next arguments apply as well, if one replaces appearing in the further calculations by the smallest Lyapunov exponent, say, , of the network that is still larger than , and then, substitute by , and so on. As before, consider that .
Then, for an arbitrary subspace , , since a projection cannot make the Lyapunov exponents larger, but only smaller or equal.
Defining
| (32) |
Since , it is easy to see that
| (33) |
So, , measured on the subspace and a function of the largest positive Lyapunov exponents measured in , is an upper bound for , a quantity defined by the largest positive Lyapunov exponents of the attractor of the network. Therefore, if the Lyapunov exponents of a network are know, the quantity can be used as a way to estimate how much is the MIR between two measurements of this network, measurements that form the subspace .
Notice that depends on the projection chosen (the subspace ) and on its dimension, whereas depends on the dimension of the subspace (the number 2Q of positive Lyapunov exponents). The same happens for the mutual information between random variables that depend on the projection considered.
Equation (32) is important because it allows us to obtain an estimation for the value of analytically. As an example, imagine the following network of coupled maps with a constant Jacobian
| (34) |
where and represents the connecting adjacent matrix. If node connects to node , then , and 0 otherwise.
Assume that the nodes are connected all-to-all. Then, the positive Lyapunov exponents of this network are: and , with . Assume also that the subspace has dimension and that positive Lyapunov exponents are observed in this space and that . Substituting these Lyapunov exponents in Eq. (32), we arrive at
| (35) |
We conclude that there are two ways for to increase. Either one considers larger measurable subspaces or one increases the coupling between the nodes. This suggests that the larger the coupling strength is the more information is exchanged between groups of nodes.
For arbitrary topologies, one can also derive analytical formulas for in this network, since for can be calculated from baptista_PLA2010c . One arrives at
| (36) |
where is the th largest eigenvalue (in absolute value) of the Laplacian matrix .
VI Conclusions
Concluding, we have shown a procedure to calculate mutual information rate (MIR) between two nodes (or groups of nodes) in dynamical networks and data sets that are either mixing, or present fast decay of correlations, or have sensitivity to initial conditions, and have proposed significant upper () and lower () bounds for it, in terms of the Lyapunov exponents, the expansion rates, and the capacity dimension. Since our upper bound is calculated from Lyapunov exponents or expansion rates, it can be used to estimate the MIR between data sets that have different sampling rates or experimental resolution (e.g. the rise of the ocean level and the average temperature of the Earth), or between systems possessing a different number of events. Additionally, Lyapunov exponents can be accurately calculated even when data sets are corrupted by noise of large amplitude (observational additive noise) mera ; gao2006 or when the system generating the data suffers from parameter alterations (“experimental drift”) stefanski . Our bounds link information (the MIR) and the dynamical behaviour of the system being observed with synchronisation, since the more synchronous two nodes are, the smaller and will be. This link can be of great help in establishing whether two nodes in a dynamical network or in a complex system not only exchange information but also have linear or non-linear interdependences, since the approaches to measure the level of synchronisation between two systems are reasonably well known and are been widely used. If variables are synchronous in a time-lag fashion juergen_book , it was shown in Ref. blanc that the MIR is independent of the delay between the two processes. The upper bound for the MIR could be calculated by measuring the Lyapunov exponents of the network (see Supplementary Information), which are also invariant to time-delays between the variables.
Acknowledgments M. S. Baptista was partially supported by the Northern Research Partnership (NRP) and Alexander von Humboldt foundation. M. S. Baptista would like to thank A. Politi for discussions concerning Lyapunov exponents. R.M. Rubinger, E.R. V. Junior and J.C. Sartorelli thanks the Brazilian agencies CAPES, CNPq, FAPEMIG, and FAPESP.
References
- (1) Shannon CE (1948) Bell System Technical Journal 27: 379-423.
- (2) Strong SP, Koberle R, de Ruyter van Steveninck RR, Bialek W (1998) Phys. Rev. Lett. 80: 197-200.
- (3) Sporns O, Chialvo DR, Kaiser M, Hilgetag CC (2004) Trends in Cognitive Sciences 8: 418-425.
- (4) Palus M, Komárek V, Procházka T, et al. (2001) IEEE Engineering in Medicice and Biology Sep/Oct: 65-71.
- (5) Donges JF, Zou Y, Marwan N, and Kurths J (2009) Eur. Phys. J. 174: 157-179.
- (6) Fraser AM and Swinney HL (1986) Phys. Rev. A 33: 1134-1140.
- (7) Kantz H and Schreiber T (2004) Nonlinear Time Series Analysis, Cambridge University Press.
- (8) Parlitz U (1998) Nonlinear Time-Series Analysis, in Nonlinear Modelling - Advanced Black-Box techniques, Kluwer Academic Publishers.
- (9) Haykin S (2001) Communication Systems, John Wiley Sons.
- (10) Rossi F, Lendasse A, François D, Wertz V, and Verleysen M (2006) Chemometrics and Intellingent Laboratory Systems, 80: 215-226.
- (11) Paninski L (2003) Neural Computation 15: 1191-1253.
- (12) Steuer R, Kurths J, Daub CO, et al. (2002) Bioinformatics 18: S231-S240.
- (13) Papana A, Kugiumtzis D, and Larsson PG (2009) Int. J. Bifurcation and Chaos 19: 4197-4215.
- (14) Baptista MS and Kurths J (2008) Phys. Rev. E 77: 026205-1-026205-13.
- (15) Baptista MS, de Carvalho JX, Hussein MS (2008) PloS ONE 3: e3479.
- (16) Blanc JL, Pezard L, and Lesne A (2011) Phys. Rev. E 84: 036214-1-036214-9.
- (17) Dobrushin RL (1959) Usp. Mat. Nauk. 14: 3-104; transl: Amer. Math. Soc. Translations, series 2 33: 323-438.
- (18) Gray RM and Kieffer JC (1980) IEEE Transations on Information theory IT-26: 412-421.
- (19) Verdú S (1994) IEEE Trans. Information Theory, 40, 1147-1157.
- (20) Kolmogorov AN (1959) Dokl. Akad. Nauk SSSR 119: 861-864; 124: 754-755.
- (21) Ruelle D (1978) Bol. Soc. Bras. Mat. 9: 83-87.
- (22) Pesin YaB (1977) Russ. Math. Surveys 32: 55-114.
- (23) Ledrappier F and Strelcyn JM (1982) Ergod. Theory Dyn. Syst. 2: 203-219.
- (24) Gao JB (1999) Phys. Rev. Lett. 83: 3178-3181.
- (25) Baptista MS, Eulalie N, Pinto PRF, et al. (2010) Phys. Lett. A 374: 1135-1140.
- (26) Eckmann JP (2003) arXiv:304043.
- (27) Sinai YaG (1970) Russ. Math. Surv. 25: 137-189.
- (28) Chernov N and Young LS (2001) Encycl. of Math. Sc., Math. Phys. II, 101: 89-120.
- (29) Baptista MS, Caldas IL, Heller MVAP, Ferreira AA 301: 150-162.
- (30) Dawson S, Grebogi C, Sauer T, and Yorke JA (1994) Phys. Rev. Lett. 73: 1927-1930.
- (31) Albuquerque HA, Rubinger RM, Rech PC, (2007) Physics D 233: 66-72.
- (32) Kraskov A, Stogbauer H, and Grassberger P (2004) Phys. Rev. E 69: 066138-1-066138-16.
- (33) Femat R and Solís-Perales G (1999) Phys. Lett. A 262: 50-60.
- (34) Pikovsky A, Rosenblum M, and Kurths J (2001) Synchronization: A Universal Concept in Nonlinear Sciences, Cambridge University Press.
- (35) Baptista MS, Pereira T, and Kurths J (2006) Physica D 216: 260-268.
- (36) Pereira T, Baptista MS, and Kurths J, Phys. Rev. E (2007) 75: 026216-1-026216-12.
- (37) Mera ME and Morán M (2009) Phys. Rev E 80: 016207-1-016207-8.
- (38) Gao JB, Hu J, Tung WW, and Cao YH, Phys. Rev. E 74: 066204-1-066204-9.
- (39) Stefański A (2008) Journal of Theoretical and Applied Mechanics 46: 665-678.
- (40) Young LS (1999) Israel Journal of Mathematics 110: 153-188.
- (41) Baptista MS, Maranhão DM, Sartorelli JC (2009) Chaos 19: 043115-1-043115-10.
- (42) Baptista MS, Kakmeni FM, Magno GL, Hussein MS (2011) Phys. Lett. A 375: 1309-1318.