1 \spacing2 \spacing1
Gravity modes as a way to distinguish between hydrogen- and helium-burning red giant stars
Abstract
Red giants are evolved stars that have exhausted the supply of hydrogen in their cores and instead burn hydrogen in a surrounding shell[1, 2]. Once a red giant is sufficiently evolved, the helium in the core also undergoes fusion[3]. Outstanding issues in our understanding of red giants include uncertainties in the amount of mass lost at the surface before helium ignition and the amount of internal mixing from rotation and other processes[4]. Progress is hampered by our inability to distinguish between red giants burning helium in the core and those still only burning hydrogen in a shell. Asteroseismology offers a way forward, being a powerful tool for probing the internal structures of stars using their natural oscillation frequencies[5]. Here we report observations of gravity-mode period spacings in red giants[6] that permit a distinction between evolutionary stages to be made. We use high-precision photometry obtained with the Kepler spacecraft over more than a year to measure oscillations in several hundred red giants. We find many stars whose dipole modes show sequences with approximately regular period spacings. These stars fall into two clear groups, allowing us to distinguish unambiguously between hydrogen-shell-burning stars (period spacing mostly 50 seconds) and those that are also burning helium (period spacing 100 to 300 seconds).
Sydney Institute for Astronomy (SIfA), School of Physics, University of Sydney, NSW 2006, Australia
LESIA, CNRS, Université Pierre et Marie Curie, Université Denis Diderot, Observatoire de Paris, 92195 Meudon cedex, France
Institut d’Astrophysique et de Géophysique de l’Université de Liège, Allée du 6 Août 17 - B 4000 Liège, Belgium
Instituut voor Sterrenkunde, K.U.Leuven, Celestijnenlaan 200D, 3001 Leuven, Belgium
Danish AsteroSeismology Centre (DASC), Department of Physics and Astronomy, Aarhus University, DK-8000 Aarhus C, Denmark
School of Physics and Astronomy, University of Birmingham, Birmingham B15 2TT, UK
Laboratoire AIM, CEA/DSM-CNRS, Université Paris 7 Diderot, IRFU/SAp, Centre de Saclay, 91191, Gif-sur-Yvette, France
Astronomical Institute ‘Anton Pannekoek’, University of Amsterdam, Science Park 904, 1098 XH Amsterdam, The Netherlands
IMAPP, Department of Astrophysics, Radboud University Nijmegen, PO Box 9010, 6500 GL Nijmegen, The Netherlands
Institut d’Astrophysique Spatiale, UMR 8617, Université Paris XI, Bâtiment 121, 91405 Orsay Cedex, France
Las Cumbres Observatory Global Telescope, Goleta, CA 93117, USA
Eureka Scientific, 2452 Delmer Street Suite 100, Oakland, CA 94602-3017, USA
INAF - IASF, Istituto di Astrofisica Spaziale e Fisica Cosmica, Via del Fosso del Cavaliere 100, 00133 Roma, Italy
Space Telescope Science Institute, 3700 San Martin Drive, Baltimore, Maryland 21218, USA
SETI Institute/NASA Ames Research Center, MS 244-30, Moffett Field, CA 94035, USA
Department of Physics and Astronomy, University of British Columbia, 6224 Agricultural Road, Vancouver, BC V6T 1Z1, Canada
Department of Physics and Astronomy, Iowa State University, Ames, IA 50011, USA
High Altitude Observatory, NCAR, P.O. Box 3000, Boulder, CO 80307, USA
Max-Planck-Institut für Astrophysik, Karl-Schwarzschild-Str. 1, 85748 Garching, Germany
INAF - Osservatorio Astronomico di Roma, Via Frascati 33, 00040 Monte Porzio Catone (RM), Italy
Oscillations in red giants, like those in the Sun, are thought to be excited by near-surface convection. The observed oscillation spectra are indeed remarkably Sun-like, with a broad range of radial and non-radial modes in a characteristic comb pattern[7, 8, 9, 10, 11]. However, theoretical models of red giants[12, 13, 14, 15, 16] reveal a more complicated story for the non-radial modes (those with angular degree ), and it has been suggested that this offers a means to determine the evolutionary states of these stars[15]. Owing to the large density gradient outside the helium core, a red giant is effectively divided into two cavities. In the envelope, the oscillations have properties of acoustic pressure modes (p modes), but in the core, they behave like gravity modes (g modes), with buoyancy as the restoring force. The models predict a very dense spectrum of these so-called mixed modes for each value of (except , as radial g modes do not exist). Most mixed modes have a much larger amplitude in the core than in the envelope and we refer to them as g-dominated mixed modes. Like pure g modes, they are approximately equally spaced in period[17, 18] and measuring their average period spacing () would give a valuable new asteroseismic probe of the cores of red giants. Unfortunately, they have very high inertias (the total interior mass that is affected by the oscillation), which leads to a very low amplitude at the stellar surface and makes them essentially impossible to observe. However, because of resonant coupling between the two cavities, some of the mixed modes have an enhanced amplitude in the envelope, making them more like p modes. These p-dominated mixed modes have a lower inertia than the g-dominated mixed modes, and so their amplitudes can be high enough to render them observable. We expect their frequencies to be shifted from the regular asymptotic spacing, a feature known as ‘mode bumping’[19].
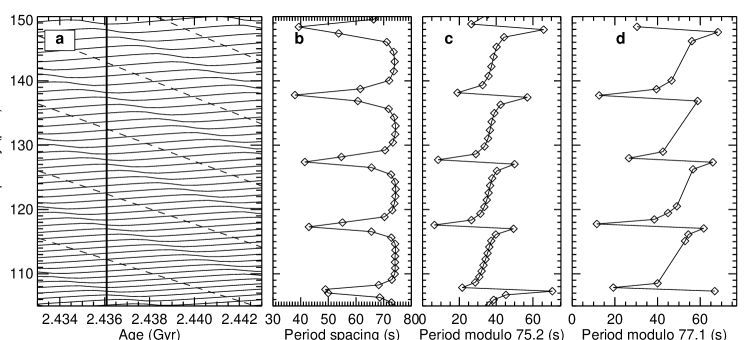
Figure 1a shows theoretical oscillation frequencies in a red giant with a mass of 1.5 (where is the solar mass). The dashed lines show the radial modes (), whose frequencies decrease with time as the envelope of the star expands. These are pure p modes and are approximately equally spaced in frequency, with a separation of . The solid lines show the much denser spectrum of dipole modes (). The g-dominated mixed modes appear as supward-sloping lines whose frequencies increase with time as the stellar core contracts. These modes are approximately equally spaced in period. The downward-sloping features that run parallel to the modes are produced by mode bumping: the p-dominated mixed modes, with frequencies decreasing with age, undergo avoided crossings[19] with the g-dominated mixed modes. (This results in deviation from their mostly parallel appearance.) A similar pattern of mode bumping and avoided crossings is seen in models of subgiant stars[13, 20].
In Fig. 1b we show the period spacings between adjacent modes in one of the models, indicated in Fig. 1a with the vertical line. The dips in panel b correspond to bumped modes that are squeezed together. The period spacing of the g-dominated modes () can be measured from the upper envelope but cannot be observed directly because only the bumped modes have enough p-mode character to be detected, by virtue of their reduced mode inertias[12, 13, 14, 6]. Observations will detect only a few modes in each p-mode order, and the average spacings of those observable sequences () will be less than the true g-mode spacing by up to a factor of two (the actual value depends on the number of modes detected, which is a function of the signal-to-noise in the data, and on the strength of the coupling between the g- and p-mode cavities[20]). Figure 1c shows the mode frequencies of the model in Fig. 1b displayed in échelle format, where the spectrum has been divided into segments that are stacked one above the other. Note that the abscissa shows the period modulo , whereas a conventional échelle diagram plots frequencies modulo the p-mode frequency spacing, .
Sequences of modes with approximately constant period spacings were first observed in the red giant KIC 6928997 (ref. 6) and we have found similar patterns in several hundred more stars. The observations were obtained with the Kepler satellite over the first 13 months of its mission and were sampled every 29.4 min in the long-cadence mode[21]. Figure 1d shows the period échelle diagram for KIC 6928997 and allows us to estimate the spacing of the g-dominated modes to be s, which is the value required to produce a vertical alignment. Remarkably, we have been able to estimate despite the fact that g-dominated modes are not observed (the average spacing of the observed modes[6] is s).
Figure 2 compares observed power spectra of two red giants that have similar p-mode spacings ( Hz) but very different period spacings. We note that the outermost peaks in each cluster (values of are given above the peaks), which we expect to be the closest in character to the g-dominated modes, appear to be the narrowest. This observation is consistent with theoretical calculations of mode inertias and lifetimes[13, 14, 15, 16]. Once again we have detected enough modes to determine unambiguously using échelle diagrams (right panels). We find for the two stars to differ by about a factor of two, implying they have very different core properties.
Inferring in this way using the period échelle diagram is not possible for most of the stars in our sample, because it requires at least 3–4 modes to be detected in several of the clusters, which is only possible for the stars with the best signal-to-noise. Therefore, we have instead measured the average period spacing of the observed modes () by using the power spectrum of the power spectrum. In this method, the power spectrum was first expressed in period rather than frequency and then set to zero in regions not containing power from the modes, as determined using the methods of ref. 10. The power spectrum of this power spectrum was then calculated in order to determine the most prominent period spacing. For the reasons mentioned above, we expect to be less than and we have measured the ratio between them to be in the range 1.3–1.6 in the few cases where can be estimated unambiguously. Two other methods to measure gave comparable results. The first was simply to measure pairwise separations of the strongest peaks in the power spectrum. The other was to calculate the autocorrelation of the time series[22] with narrow filters centred on the clusters.
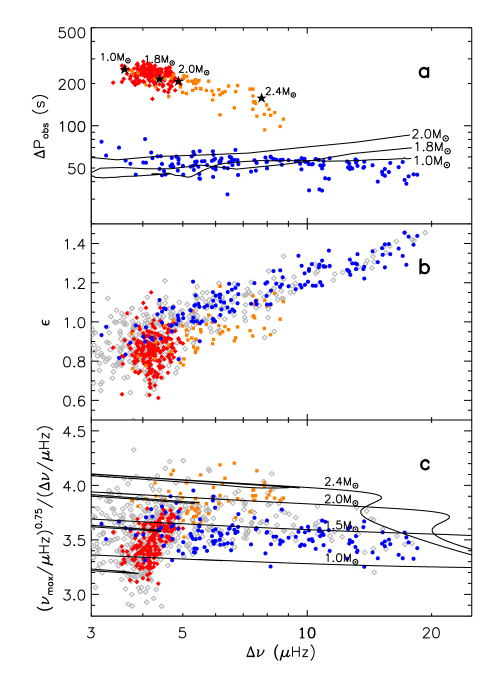
Observed period spacings for about 400 stars are shown in Fig. 3a, which clearly demonstrates the existence of two distinct populations with different core properties. A comparison with model calculations confirms that the two groups coincide with hydrogen-shell-burning stars on the red giant branch (blue circles) and those that are also burning helium in the core (red diamonds and orange squares). We conclude that is an extremely reliable parameter for distinguishing between stars in these two evolutionary stages, which are known to have very different core densities[15] but are otherwise very similar in their fundamental properties (mass, luminosity and radius). Note that other asteroseismic observables, such as the small p-mode separations, are not able to do this[10, 15].
Our ability to distinguish between hydrogen- and helium-burning stars makes it possible to investigate their properties as separate populations. One example is the parameter , which specifies the absolute position of the p-mode comb pattern[10, 11]. As shown in Fig. 3b, there is a systematic offset between the two populations. This may indicate a difference in the surface layers, given that is sensitive to the upper turning point of the modes[23]. However, the difference may also arise because the envelope of oscillation power is centred at different frequencies in the two types of stars (see below). This result is clearly worthy of further study.
A very important application for the helium-burning stars is to distinguish between the so-called red clump and secondary clump[24, 25]. The red clump comprises low-mass stars that suffered from electron degeneracy in their hydrogen-shell-burning phase and ignited helium in a flash once the core attained a critical mass. This common core mass explains why the red clump (known as the horizontal branch when seen in metal-poor clusters) spans a very narrow range of luminosities. The secondary-clump stars, meanwhile, are too massive to have undergone a helium flash and so have a range of core masses, and hence of luminosities. The mass threshold that divides these two populations depends on metallicity, and also on core overshoot[24].
Among the helium-burning stars in Fig. 3a we can indeed see this division into a compact group (the clump; red diamonds) and a dispersed group (the secondary clump; orange squares). It is even more apparent when we examine the quantity , which is approximately independent of luminosity[10] ( is the frequency at which the oscillation envelope has its maximum[26]). This quantity is shown in Fig. 3c and the comparison with evolutionary models having solar metallicity implies a helium-flash threshold of around . Refinement of this result, using data from more detailed studies of individual stars near the boundary between the clump and secondary clump, should test predictions of convective-core overshoot.
References
- [1] Schwarzschild, M. & Härm, R. Red Giants of Population II. II. ApJ 136, 158–165 (1962).
- [2] Iben, I., Jr. Low-Mass Red Giants. ApJ 154, 581–595 (1968).
- [3] Sweigart, A. V. & Gross, P. G. Evolutionary sequences for red giant stars. ApJS 36, 405–437 (1978).
- [4] Charbonnel, C. Mixing Along the Red Giant Branch: Where Do We Stand? In T. G. Barnes III & F. N. Bash (ed.) Cosmic Abundances as Records of Stellar Evolution and Nucleosynthesis, vol. 336 of Astronomical Society of the Pacific Conference Series, 119–130 (2005).
- [5] Aerts, C., Christensen-Dalsgaard, J. & Kurtz, D. W. Asteroseismology (Springer: Heidelberg, 2010).
- [6] Beck, P. G., Bedding, T. R., Mosser, B. et al. Detection of gravity-mode period spacings in red giant stars by the Kepler Mission. Science (2011). In press.
- [7] De Ridder, J. et al. Non-radial oscillation modes with long lifetimes in giant stars. Nature 459, 398–400 (2009).
- [8] Kallinger, T. et al. Oscillating Red Giants in the CoRoT Exo-field: Asteroseismic Radius and Mass Determination. A&A 509, A77 (2010).
- [9] Bedding, T. R. et al. Solar-like Oscillations in Low-luminosity Red Giants: First Results from Kepler. ApJ 713, L176–L181 (2010).
- [10] Huber, D. et al. Asteroseismology of Red Giants from the First Four Months of Kepler Data: Global Oscillation Parameters for 800 Stars. ApJ 723, 1607–1617 (2010).
- [11] Mosser, B. et al. The universal red-giant oscillation pattern. An automated determination with CoRoT data. A&A 525, L9 (2011).
- [12] Dziembowski, W. A., Gough, D. O., Houdek, G. & Sienkiewicz, R. Oscillations of UMa and other red giants. MNRAS 328, 601–610 (2001).
- [13] Christensen-Dalsgaard, J. Physics of solar-like oscillations. Solar Phys. 220, 137–168 (2004).
- [14] Dupret, M. et al. Theoretical amplitudes and lifetimes of non-radial solar-like oscillations in red giants. A&A 506, 57–67 (2009).
- [15] Montalbán, J., Miglio, A., Noels, A., Scuflaire, R. & Ventura, P. Seismic Diagnostics of Red Giants: First Comparison with Stellar Models. ApJ 721, L182–L188 (2010).
- [16] Di Mauro, M. P. et al. Solar-like oscillations from the depths of the red-giant star KIC 4351319 observed with Kepler. MNRAS (2011). Submitted.
- [17] Tassoul, M. Asymptotic approximations for stellar nonradial pulsations. ApJS 43, 469–490 (1980).
- [18] Miglio, A., Montalbán, J., Eggenberger, P. & Noels, A. Gravity modes and mixed modes as probes of stellar cores in main-sequence stars: From solar-like to Cep stars. Astronomische Nachrichten 329, 529–534 (2008).
- [19] Aizenman, M., Smeyers, P. & Weigert, A. Avoided Crossing of Modes of Non-radial Stellar Oscillations. A&A 58, 41–46 (1977).
- [20] Deheuvels, S. & Michel, E. New insights on the interior of solar-like pulsators thanks to CoRoT: the case of HD 49385. Ap&SS 328, 259–263 (2010).
- [21] Jenkins, J. M. et al. Initial Characteristics of Kepler Long Cadence Data for Detecting Transiting Planets. ApJ 713, L120–L125 (2010).
- [22] Mosser, B. & Appourchaux, T. On detecting the large separation in the autocorrelation of stellar oscillation times series. A&A 508, 877–887 (2009).
- [23] Gough, D. O. EBK Quantization of Stellar Waves. In Osaki, Y. (ed.) Hydrodynamic and Magnetodynamic Problems in the Sun and Stars, 117–143 (Tokyo: Uni. of Tokyo Press, 1986).
- [24] Girardi, L. A secondary clump of red giant stars: why and where. MNRAS 308, 818–832 (1999).
- [25] Miglio, A. et al. Probing populations of red giants in the galactic disk with CoRoT. A&A 503, L21–L24 (2009).
- [26] Kjeldsen, H. & Bedding, T. R. Amplitudes of stellar oscillations: the implications for asteroseismology. A&A 293, 87–106 (1995).
- [27] Christensen-Dalsgaard, J. ASTEC – the Aarhus STellar Evolution Code. Ap&SS 316, 13–24 (2008).
- [28] Kjeldsen, H., Bedding, T. R. & Christensen-Dalsgaard, J. Correcting stellar oscillation frequencies for near-surface effects. ApJ 683, L175–L178 (2008).
- [29] Ventura, P., D’Antona, F. & Mazzitelli, I. The ATON 3.1 stellar evolutionary code. A version for asteroseismology. Ap&SS 316, 93–98 (2008).
- [30] Pietrinferni, A., Cassisi, S., Salaris, M. & Castelli, F. A Large Stellar Evolution Database for Population Synthesis Studies. I. Scaled Solar Models and Isochrones. ApJ 612, 168–190 (2004).
is linked to the online version of the paper at www.nature.com/nature.
We acknowledge the entire Kepler team, whose efforts made these results possible. We thank M. Biercuk for comments. Funding for this Discovery mission is provided by NASA’s Science Mission Directorate. T.R.B and D.S. were supported by the Australian Research Council; P.B. and C.A. were supported by the European Community’s 7th Framework Programme (PROSPERITY); S.H. was supported by the Netherlands Organisation for Scientific Research (NWO). The National Center for Atmospheric Research is sponsored by the National Science Foundation.
T.R.B, B.M., P.B., Y.P.E, R.A.G., S.H., C.A., A.-M.B. and F.C. measured and interpreted period spacings; B.M., D.H., R.A.G., S.H., T.K., W.J.C., C.B., D.L.B. and S.M. calculated power spectra and measured large frequency separations; J.M., J.C.-D., A.M., D.S., T.R.W., K.B., M.P.D.M., M.-A.D., M.J.G., S.K., A.N., V.S.A. and P.V. calculated and interpreted theoretical models; J.D.R., S.H., S.F., Y.P.E., D.S., T.M.B., H.K., J.C.-D. and R.L.G contributed to the coordination of the project, including the acquisition and distribution of the data; J.M.J. constructed the photometric time series from the original Kepler pixel data. All authors discussed the results and commented on the manuscript.
Reprints and permissions information is available at www.nature.com/reprints. The authors declare that they have no competing financial interests. Correspondence and requests for materials should be addressed to T.R.B. (e-mail: t.bedding@physics.usyd.edu.au).