CO observations of high- radio galaxies MRC 2104-242 and MRC 0943-242: spectral-line performance of the Compact Array Broadband Backend
Abstract
We present the first 7-millimetre observations of two high-redshift, Ly-bright radio galaxies (MRC 2104-242 and MRC 0943-242) performed with the GHz instantaneous bandwidth of the Compact Array Broadband Backend (CABB) at the Australia Telescope Compact Array (ATCA). The aim was to search for 12CO(1-0) emission in these systems and test the millimetre capabilities of CABB for performing spectral line observations at high redshifts. We show that the stable band and enhanced velocity coverage of CABB, combined with hybrid array configurations, provide the ATCA with excellent 7-mm capabilities that allow reliable searches for the ground transition of CO at high redshifts. In this paper we explicitly discuss the calibration procedures used to reach our results. We set a firm upper limit to the mass of molecular gas in MRC 2104-242 () of M M⊙. For MRC 0943-242 () we derive an upper limit of M M⊙. We also find a tentative 3 CO detection in the outer part of the giant Ly halo that surrounds MRC 0943-242. The 30-33 GHz radio continuum of MRC 2104-242 and MRC 0943-242 is reliably detected. Both radio sources show a spectral index of between 1.4 and 30 GHz, with no evidence for spectral curvature within this range of frequencies.
keywords:
galaxies: high-redshift – galaxies: active – galaxies: ISM – galaxies: individual: MRC 2104-242 – galaxies: individual: MRC 0943-242 – techniques: interferometric1 Introduction
Cold gas is a primary component in galaxy formation processes such as star formation and disk growth. However, despite detailed studies of cold gas in the nearby Universe, it is still difficult to trace similar quantities of cold gas beyond our Galactic backyard. Recently, Tacconi et al. (2010) and Daddi et al. (2010) observed that star-forming galaxies at high redshifts are likely to contain a much larger fraction of their total mass in the form of molecular gas compared with nearby massive spiral galaxies. Recent simulations support this idea that the molecular gas content of galaxies increases when going to higher redshifts (Obreschkow & Rawlings, 2009a, b; Obreschkow et al., 2009a, b). These results demonstrate that extensive studies of cold molecular gas in the early Universe are becoming feasible with existing radio telescopes.
Powerful radio galaxies enable comprehensive studies of the cold ISM throughout the Universe. Their strong radio sources provide a background continuum against which we can search for foreground neutral and molecular gas in absorption (e.g. Uson et al., 1991; Vermeulen et al., 2003; Kanekar et al., 2007; Carilli et al., 2007), while their host galaxies are generally in a very specific stage of galaxy evolution. Detailed studies at low and intermediate redshifts reveal that powerful radio galaxies are frequently associated with gas-rich galaxy mergers (e.g. Heckman et al., 1986; Baum et al., 1992), often contain young stellar populations (Tadhunter et al., 2005; Holt et al., 2007; Labiano et al., 2008), and many display strong jet-ISM interactions (Tadhunter, 1991; Villar-Martín et al., 1999; Clark et al., 1998; Emonts et al., 2005; Morganti et al., 2005a, b; Holt et al., 2008). At high redshifts (), luminous radio galaxies ( W Hz-1) are among the most massive galaxies in the early Universe (see Miley & De Breuck, 2008, for a review). They are typically surrounded by proto-clusters, which are thought to be the ancestors of rich local clusters (e.g. Pentericci et al., 2000a; Venemans et al., 2007). The high- radio galaxies and surrounding proto-cluster gas and galaxies often interact with one another (e.g. Nesvadba et al., 2008; Ivison et al., 2008) and are therefore laboratories for studying the formation and evolution of galaxies and clusters as well as investigating the relationship between early star formation and AGN activity.
Since Brown & Vanden Bout (1991) first observed CO gas (the strongest tracer for molecular hydrogen) at a redshift beyond , intensive searches for CO in high- radio galaxies during the early 1990s were unsuccessful (Evans et al., 1996; van Ojik et al., 1997). Since then, studies of individual radio galaxies at with synthesis radio telescopes have found CO emission (tracing molecular gas masses of a few ) in a number of these systems (e.g. Scoville et al., 1997; Papadopoulos et al., 2000; De Breuck et al., 2003a, b, 2005; Klamer et al., 2005; Nesvadba et al., 2009, see also Solomon & Vanden Bout (2005); Omont (2007); Miley & De Breuck (2008) for reviews). In some cases CO is observed to be resolved on scales of several tens of kpc (e.g. Papadopoulos et al., 2000). This indicates that large amounts of cold molecular gas may be relatively common in high- radio galaxies. However, the major observational limitations for starting comprehensive studies of CO in high- radio galaxies have been the very limited velocity coverage of existing mm-spectrometers (often not much wider than the velocity range of the CO gas and/or the accuracy of the redshift) plus the fact that most observatories can only target the higher order rotational transitions of 12CO.
Although the higher order CO lines are likely to have a higher flux density than the lower ones in the nuclear starburst/AGN regions, where gas is dense and thermally excited, Papadopoulos et al. (2000, 2001) suggest that the opposite may be true for large reservoirs of less dense and sub-thermally excited gas that is more widely distributed. In fact, various studies of the low-order CO transitions in different types of high- galaxies reveal molecular gas that is sub-thermally excited111Harris et al. (2010) and Danielson et al. (2010) point out that a multi-component inter-stellar medium, rather than sub-thermal excitation, may better reflect the physical properties of the molecular gas in high- systems. (Greve et al., 2003; Hainline et al., 2006; Dannerbauer et al., 2009; Riechers et al., 2010) or distributed in extended reservoirs (Daddi et al., 2010; Carilli et al., 2010; Ivison et al., 2010, 2011). Cold CO gas distributed across the host galaxy may thus be much easier to detect in the lower CO transitions than generally assumed from studies of the higher transitions. Moreover, with uncertainties in excitation properties of the gas, observations of the rotational ground-transition of the CO molecule [12CO(1-0) – referred to as CO in the remainder of this paper] provide the most accurate mass estimate of the overall molecular gas content in these systems.
Since April 2009, the Australia Telescope Compact Array (ATCA) has a new broad-band backend system (the Compact Array Broadband Backend or CABB). CABB offers an instantaneous bandwidth of 4 GHz, split over GHz observing bands, both with all Stokes polarisation parameters and 2048 channels (i.e. spectral resolution of 1 MHz); see Ferris & Wilson (2002); Wilson et al. (2011). ATCA/CABB has millimetre observing capabilities at 3mm ( GHz), 7mm ( GHz) and 15mm ( GHz). This, in combination with hybrid array configurations with baselines as short as 31m, makes the upgraded ATCA an excellent facility to detect and spatially resolve molecular gas in high- radio galaxies by targeting the lower rotational CO transitions (see Sect. 2 for more details). A remarkable example of this is the recent detection of CO(2-1) in the distant () sub-millimetre galaxy LESS J033229.4-275619 by Coppin et al. (2010).
To test the spectral-line performance of CABB over the GHz bandwidth, we used the 7mm band to search for CO(1-0) in two high- radio galaxies from the Molonglo Reference Catalogue (McCarthy et al., 1990), namely MRC 2104-242 () and MRC 0943-242 (). These two sources are part of a larger sample of high- radio galaxies that we aim to target with CABB in order to perform a systematic search for CO(1-0) in these systems.
MRC 2104-242 and MRC 0943-242 both have a redshift that corresponds to a critical epoch in galaxy formation (), at which there is a dramatic increase in sub-mm flux (Archibald et al., 2001; Smail et al., 2002; Chapman et al., 2005) and the space-density of (radio-loud) quasars reaches a maximum (e.g. Pei, 1995; Shaver et al., 1996; Richards et al., 2006). HST observations by Pentericci et al. (2001) show that MRC 2104-242 and MRC 0943-242 both have an optical continuum that is clumpy and elongated in the direction of the radio source (Pentericci et al., 2000b; Carilli et al., 1997). Villar-Martín et al. (2003) show that they both contain a giant Ly-halo ( 100 kpc in diameter). For MRC 2104-242 the Ly gas is distributed roughly along the radio axis in what appears to be a rotating structure with a diameter kpc (Villar-Martín et al., 2006). MRC 0943-242 shows a quiescent Ly-halo that extends well beyond the radio structure (Villar-Martín et al., 2003). MRC 0943-242 also shows a deep Ly absorption (Rottgering et al., 1995; Jarvis et al., 2003), indicating that large amounts of neutral gas are present in this system. From fitting the spectral energy distributions of the host galaxies with Spitzer, Seymour et al. (2007) derive a total stellar mass of a few for both systems.
In Sect. 2 we present our CO observations and explain in more detail the enhanced capabilities of the ATCA for studying molecular gas at high redshifts. Section 3 shows the result regarding both the performance of CABB for doing these high- CO studies as well as the scientific outcome of our observations of MRC 2104-242 and MRC 0943-242. In Sect. 4 and 5 we discuss the scientific results and conclude that the upgraded ATCA is a world-class facility for spectral line observations of the cold molecular gas at high-.
2 Observations
During the period May - September 2009, MRC 2104-242 and MRC 0943-242 were observed with ATCA/CABB. Details of the observations are given in Table 1.
Figure 1 shows the observing windows for the various transitions of extra-galactic CO currently available with CABB in the 3, 7 and 15 millimetre bands.
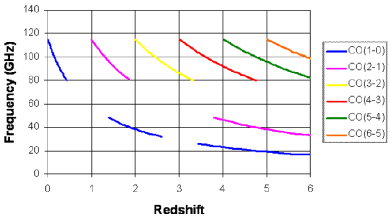
For MRC 2104-242 and MRC 0943-242 we targeted the ground-transition CO(1-0) with the CABB 7mm system. The redshift of MRC 2104-242 () corresponds to an observing frequency of 33.0 GHz, which is also one of the optimum CABB frequencies for centring the 7mm band.222See the online ATCA Users Guide for details: http://www. narrabri.atnf.csiro.au/observing/usersguide/html/atug.html The redshift of MRC 0943-242 ()333This redshift corresponds to the velocity of the most prominent H I absorption in the Ly profile of MRC 0943-242 (Jarvis et al., 2003); see Sect. 2.1.3 for more details. corresponds to an observing frequency of 29.4 GHz, which is outside the nominal 7mm CABB band ( GHz). Nevertheless, when centring the band at 30.001 GHz, data is obtained down to 29 GHz. Observations of MRC 0943-242 therefore served as a good test of how well the CABB system behaves at the very edge of the 7mm band.
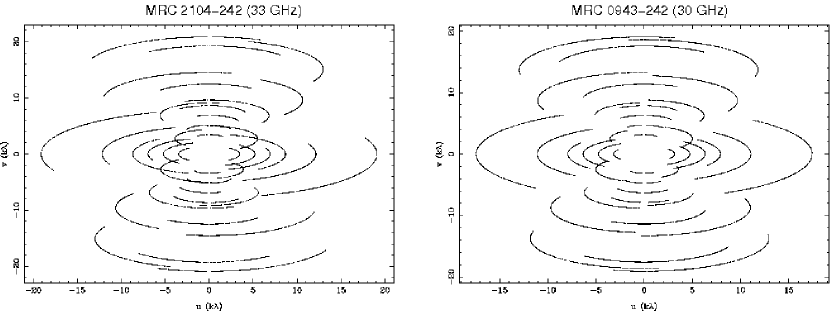
The total observing time for each source – including overhead and calibration – was roughly 40 hours (see Table 1 and Sect. 2.1). The observations were spread over the two most compact hybrid array configurations (H75 and H168) in order to minimise the effect of atmospheric phase fluctuations (which worsen with increase in baseline length; Klamer, 2006). Both array configurations include five antennas that are spread across both an east-west as well as a north-south spur. This ensures a reasonably good uv-coverage (see Fig.2) even from observing runs as short as 6-8h, during which a source is targeted only above an elevation of 30∘ (in order to avoid high airmasses, which dramatically increase the system temperature; see Klamer, 2006). The system temperatures ranged from K for the observations of MRC 2104-242 and from K for MRC 0943-242.444More details on theoretical estimates of Tsys values at 7mm can be found in the online ATCA Users Guide.
| Source | Array | Obs. date | tint (h) | (GHz) |
|---|---|---|---|---|
| MRC 2104-242 | H75 | 09JUL21 | 6.99 | 33.000 |
| 09JUL23 | 4.15 | 33.020 | ||
| H168 | 09SEP18 | 3.00 | 33.000 | |
| 09SEP19 | 3.14 | 33.000 | ||
| 09SEP20 | 2.19 | 33.000 | ||
| MRC 0943-242 | H75 | 09JUL11 | 3.10 | 30.001 |
| 09JUL12 | 3.20 | 30.010 | ||
| 09JUL14 | 2.88 | 30.001 | ||
| H168 | 09MAY10 | 3.29 | 30.001 | |
| 09MAY11 | 2.68 | 30.015 | ||
| 09MAY12 | 3.18 | 30.001 |
At the high central frequencies of our observations (30-33 GHz), the coarsest spectral-line mode of CABB ( GHz bands with 1 MHz spectral resolution) provides a velocity resolution of 9.5-11 km s-1 across an effective velocity coverage of at least 17,000 km s-1 per 2 GHz band. Both 2 GHz bands were centred around the same observing frequency, but because they are not mutually independent, only one 2 GHz band was used in the final data analysis.
Observations were done as much as possible during the night and in good weather conditions (to avoid decorrelation due to atmospheric phase instabilities) and only above 30∘ elevation (to avoid high system temperatures due to large airmasses). Because our observations also served as a test for the performance of CABB for spectral-line observations, in the following Section we will explain the details of several crucial calibration steps. For the data reduction and analysis we used MIRIAD and KARMA.
2.1 Calibration, overheads and data reduction
Our general observing strategy was as follows: a strong calibrator was observed at least three times during each run in order to check the reliability of the bandpass calibration. A secondary (phase/gain) calibrator was observed roughly every 10 minutes. Flux calibration was done at least once during each run. Pointing solutions of the antennas were checked and updated every hour, or every time the telescope slewed more than 20∘ on the sky. Taking into consideration the conservative nature of this calibration strategy, the overheads due to calibration and slewing were about 50.555We estimate that in order to reach the potential maximum efficiency with less conservative calibration, overheads should be considered to be at least 30.
2.1.1 Phase/gain calibration
For phase calibration we performed a 2 minute scan on a calibrator close to our target source roughly every 10 minutes, although target scans were decreased to 5 minutes in poor weather conditions and increased to 15 minutes when atmospheric phase stability was excellent. For MRC 2104-242 we used PKS B2008-159, PKS B2128-123 or PKS 2149-306 as phase calibrator. For MRC 0943-242 we used PKS 0919-260. Phase calibration was done in a standard way.
2.1.2 Bandpass calibration
In order to test the quality of the bandpass calibration at 7mm across the full 2 GHz band, we observed a strong calibrator (PKS B0537-441, PKS B1253-055, PKS B1334-127, PKS B1921-293 or PKS B2223-052) at least three times during each run (unless the run was cut short due to weather). We noticed that weather and atmospheric conditions at the ATCA site can introduce frequency dependent temporal gain fluctuations across the wide CABB band, which can have a significant effect on the quality of the bandpass calibration at 7mm. It is therefore essential to obtain at least one good scan on the bandpass calibrator during good atmospheric conditions. For MRC 0943-242 we chose the best quality bandpass calibrator scan for calibrating our data. In case more than one bandpass calibrator scan was deemed suitable, we applied the bandpass solutions to that part of the data observed closest in time to the respective calibrator.
For MRC 2104-242 the strong phase calibrators PKS B2008-159 and PKS B2128-123 (with observed fluxes of F and 1.8 Jy respectively) were suitable for bandpass calibration. This allowed us to obtain a bandpass solution roughly every 10-15 minutes. We used a new feature in the MIRIAD task mfcal to interpolate between consecutive bandpass solutions in order to compensate for possible frequency dependent gain variations that slowly fluctuate in time.
2.1.3 Flux calibration
For MRC 2104-242, flux calibration was done by observing Uranus at the time that it was at roughly the same elevation as the phase calibrator and target source during each run. The presence of a weak radio continuum from the lobe-dominated high- radio galaxies in our 7mm data (which are not expected to significantly change their flux densities over time-scales of a few months) allowed us to compare the relative flux calibration between the various runs, which remained constant within 15. Our absolute flux calibration used the available MIRIAD-model for Uranus. This model did not take into account changes in the planet’s orientation, which introduce time-variations of up to 10 in its brightness temperature (see Kramer et al., 2008; Weiland et al., 2010), potentially leading to a significant error in absolute flux calibration. During one of the runs we also observed PKS B1934-638, which confirmed our Uranus-based absolute flux calibration to an accuracy of 18. We therefore estimate the overall (relative + absolute) uncertainty in the flux calibration of MRC 2104-242 to be within 30.
For MRC 0943-242, Uranus was not visible during our observing runs. For flux calibration we therefore observed the ultra-compact H II region G309 [G309.9206+00.4790; Urquhart et al. (2007), with our pointing centred at RA(J2000)=13:50:42.35, dec(J2000)=-61:35:09.78] when it was at roughly the same elevation as the phase calibrator. We calibrated the flux of G309 against Uranus, which we observed roughly half a day later for each run. The flux of G309 was stable over our six observing epochs and the relative flux calibration between the six different runs was within 13. From our data we derive a value of Jy for the shortest baselines at which the source is unresolved. Recently, Murphy et al. (2010) derived a flux density of Jy for G309, also using Uranus as flux calibrator. In order to verify the accuracy of our absolute flux calibration, we observed PKS B1934-638 during three of our observing epochs. When using PKS B1934-638 as flux calibrator instead of Uranus, the absolute fluxes derived from our data are on average 15 lower. This uncertainty in absolute flux calibration is consistent with the difference between our flux estimate for G309 (which we used to calibrate our data) and that made by Murphy et al. (2010). This may again reflects variations in the brightness of Uranus that were not accounted for by the existing models (see previous paragraph). The spectral index of G309 changes at most a few percent across the 2 GHz band at 30 GHz, in agreement with Murphy et al. (2010). In all, we therefore estimate that for MRC 0943-242 the overall (relative + absolute) uncertainty in our flux calibration is within 30.
After flagging and bandpass, gain and flux calibration, we subtracted the continuum from the line data in the uv-domain by applying a linear fit to the channels across the full 2 GHz band (for MRC 0943-242 we excluded from this fit the channels in which we found a tentative CO signal, see Sect. 3.3, although this has no significant effect when fitting the full 2 GHz band). Subsequently, a robust +1 weighted (Briggs, 1995) continuum map and line data set were created by Fourier transforming the uv-data and, in case of the continuum map, cleaning the signal. We then translated the velocity axis to match the optical, barycentric rest-frame velocity at the redshift of MRC 2104-242 and MRC 0943-242. The redshift of MRC 2104-242 () has been confirmed by Overzier et al. (2001) and Villar-Martín et al. (2003) through observations of the Ly and various metal emission-lines. For MRC 0943-242, we chose to centre our observations at the redshift of the prominent H I absorption in the Ly profile (; Jarvis et al., 2003), which likely represents the bulk of the cold neutral gas in this system (see also De Breuck et al., 2003b). Table 2 shows details of the final data products that we obtained from our observations (some of these are described further in Sect. 3).
| MRC 2104-242 | MRC 0943-242 | |
| Effective int. time (h) | 19.5 | 18.3 |
| Target frequency (GHz) | 33.02 | 29.417 |
| Redshift | 2.491 | 2.9185 |
| Beam size (arcsecarcsec) | 11.7 7.6 | 11.5 9.0 |
| Beam PA [PA (∘)] | 97.2 | 87.5 |
| v (km s-1) | 9.6 | 11.0 |
| cont (Jy bm-1) | 29 | 33 |
| (mJy) | 4.0 | 3.3 |
| line (mJy bm-1ch-1) | 0.45 | 0.90 |
| (K km s-1pc2) |
3 Results
3.1 CABB performance
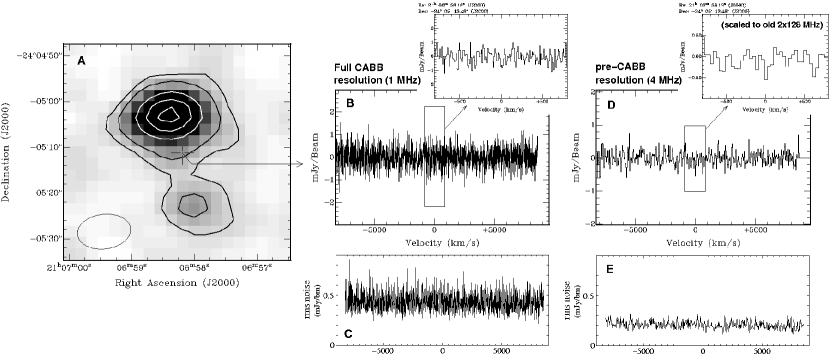
Figure 3 shows the 33 GHz radio continuum map of MRC 2104-242 and a spectrum at the location of the centre of the host galaxy. The continuum image has an rms noise level of Jy beam-1 (after tint = 19.5h; see Table 2), demonstrating the effectiveness of ATCA/CABB for deep millimetre continuum studies. The 2 GHz spectrum has a large velocity coverage of km s-1 with an rms noise in each 1 MHz channel (v = 9.6 km s-1) of mJy bm-1, with no significant systematic bandpass effects.
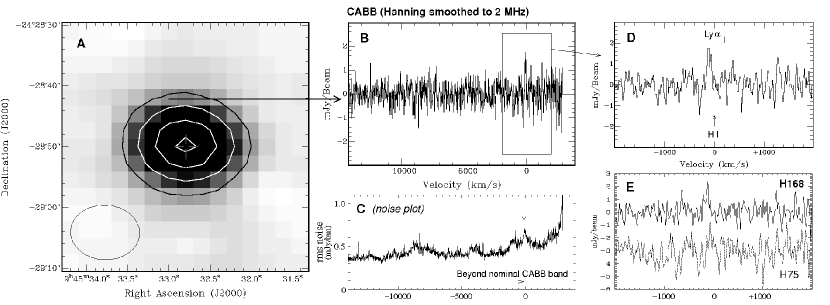
Figure 4 shows the 30 GHz radio continuum map of MRC 0943-242 (with an rms noise of 33 Jy beam-1) and an off-nuclear spectral line profile. In this case, at the edge of the 7mm band, half the observing band lies outside the nominal CABB range (Sect. 2), where there are instrumental low-level structures in the noise or in the bandpass at about the 1 level of the full (1 MHz) resolution data (Fig. 4b). In addition, the noise starts to vary beyond the nominal CABB range (Fig. 4c). After an effective on-source integration time of 18.3h, we derive a noise level at 29.4 GHz of mJy bm-1 per 1 MHz channel (v = 11 km s-1), i.e. twice the noise level at the optimum observing frequency of 33 GHz (see above). However, as can be seen in the Hanning-smoothed data of Fig. 4c, the noise level peaks at our target frequency of 29.4 GHz and is significantly lower throughout most part of the band, even below the nominal edge of 30 GHz. We therefore conclude that up to GHz below the nominal 7mm band, CABB is still suitable for spectral-line work.
Coppin et al. (2010) detected CO(2-1) in a sub-millimetre galaxy, which was observed with CABB at 40.0 GHz (i.e. towards the other end of the 7mm band compared to our 33/30 GHz observations). They find noise levels of mJy bm-1 per 1 MHz channel and a bandpass stable enough to detect their CO signal at about the 5 level when binning across 10 channels. The data quality at 40 GHz thus appears comparable to that at 33 GHz as presented in this paper, giving a good indication for the excellent performance of CABB across the entire ATCA 7mm band.
3.2 MRC 2104-242
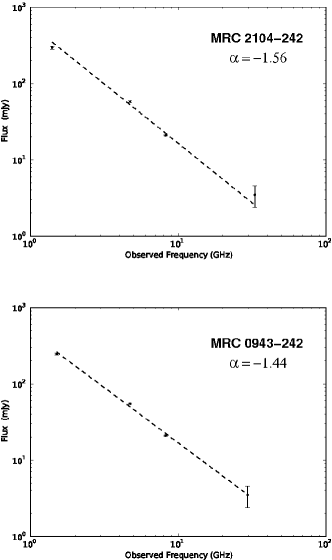
MRC 2104-242 (Fig. 3a) is resolved at 33 GHz with a total flux of 3.5 mJy. The continuum structure consists of two components on either side of the optical host galaxy, in agreement with 4.7 and 8.2 GHz VLA continuum observations that identified it as a double lobed radio source (Pentericci et al., 2000b). The bright northern lobe has a peak flux density of mJy bm-1, while the fainter southern lobe has mJy bm-1. Even at 33 GHz the radio continuum structure is dominated by the radio lobes and no core component (at the location of the optical nucleus) is seen in our data. We set a conservative upper limit to the 33 GHz core flux density of 0.4 mJy bm-1. Figure 5 shows that the integrated flux of MRC 2104-242 has a steep spectral index between 1.4 GHz and 33.0 GHz, with (where ). There is no evidence for spectral curvature within this range of frequencies. This is in agreement with spectral index observations of high- ultra-steep spectrum radio sources by Klamer et al. (2006).
No CO is detected in MRC 2104-242, either at the location of the host galaxy or at the position of the radio source. We derive a firm upper limit on the CO emission-line luminosity in MRC 2104-242 by assuming a potential 3 signal smoothed across 500 km s-1, using
| (1) |
with the noise level per 1 MHz channel in one beam (in Jy) and v the width of one 1 MHz channel (in km s-1). The CO luminosity (upper limit) can then be calculated following Solomon & Vanden Bout (2005, and references therein):
| (2) |
with expressed in and with Mpc the luminosity distance of MRC 2104-242 (following Wright, 2006)666See http://www.astro.ucla.edu/wright/CosmoCalc.html for Ned Wright’s online cosmology calculator that we used to deriving luminosity and angular-size distances. Throughout this paper we use H, and .. For MRC 2104-242, Jy km s-1, hence .
3.3 MRC 0943-242
The radio source MRC 0943-242 (Fig. 4a) has a flux density of 3.3 mJy bm-1 and is unresolved in our data. Higher resolution continuum observations at 4.7 and 8.2 GHz by Carilli et al. (1997) show that the radio source consists of two lobes that are separated by 4 arcsec. When comparing the flux of our 30 GHz data with the integrated flux at 1.5, 4.7 and 8.2 GHz (Carilli et al., 1997), Figure 5 shows that MRC 0943-242 has a steep spectral index between 1.5 GHz and 30 GHz with . Similar to the case of MRC 2104-242, there is no evidence for spectral curvature within this range of frequencies.
No CO is detected at the central (nuclear) location of MRC 0943-242. When estimating an upper limit on in MRC 0943-242 (potential 3 detection smoothed across 500 km s-1), we derive (for Mpc, which corresponds to a angular-size scale of 7.65 kpc/arsec for MRC 0943-242; Wright, 2006).
3.3.1 Tentative off-nuclear CO detection
As can be seen in Fig. 4b,d,e, we find a tentative, off-nuclear 3 CO(1-0) detection in the Hanning smoothed data of MRC 0943-242 (with the noise level at the frequency that corresponds to the tentative detection, see the arrow in Fig. 4c). The tentative CO signal spreads over an area about the size of one synthesised beam roughly 60 kpc NE of the centre of the host galaxy. It peaks at km s-1 with a flux density of 1.8 mJy bm-1(with a tentative second peak present at the 1 mJy bm-1 level around km s-1). The estimated luminosity of the tentative double-peaked CO signal is (Equation 2). Both the H75 and H168 array data show indications for this tentative CO signal (Fig. 4e). However, because of the low-level (1) structure in the noise/bandpass beyond the nominal 7mm observing band (see Sect. 3.1), our results did not improve by further smoothing/binning the data in velocity. Our tentative 3 detection thus needs to be verified with additional observations before conclusions can be drawn.
3.4 The environments of high- radio galaxies
The large instantaneous velocity coverage of CABB (see Sect. 2) also makes it possible to search for CO emitters in the field of our high- radio galaxies. The full width half maximum (FWHM) of the primary beam is 87 / 95 arcsec at 33 / 30 GHz, corresponding to about 0.69 / 0.73 Mpc at the redshift of MRC 2104-242 / MRC 0943-242.
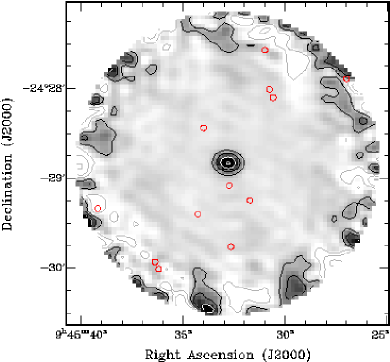
High- radio galaxies are generally located in proto-cluster environments (e.g. Pentericci et al., 2000a; Venemans et al., 2007). MRC 0943-242 is known to be located in a proto-cluster with many nearby companions detected in Ly and with known redshifts (Venemans et al., 2007). There are 12 known Ly companions within the primary beam and observing band of our observations (van Breukelen et al., 2005; Venemans et al., 2007, see also Fig. 6). None of these galaxies shows a clear CO detection above a 3 limit, after correcting for primary beam attenuation.
Ly observations of the environment of MRC 2104-242 are lacking and hence the cluster properties are unknown. No CO was detected within the primary beam above 3 after correcting for primary beam attennuation.
4 Discussion
4.1 H2 masses
CO is an excellent tracer of molecular hydrogen, because the rotational transitions of CO are excited primarily by collisions with H2. A standard conversion factor [M⊙ (K km s-1 pc2)-1] is generally used to calculate the mass of the cold molecular gas (where MH2 includes a fraction of the molecular gas that is in the form of helium – see for example Solomon & Vanden Bout, 2005, for a review). For ultra-luminous infra-red galaxies (ULIRGs), Downes & Solomon (1998) derived a conversion factor of M⊙ (K km s-1 pc2)-1. This is in agreement with other observations of ULIRGs (Solomon et al., 1997; Evans et al., 2002) as well as high- sub-mm and star-forming galaxies (Tacconi et al., 2008; Stark et al., 2008), which imply that M⊙ (K km s-1 pc2)-1. We adopt a value of M⊙ (K km s-1 pc2)-1 also for the two high- radio galaxies that we study in this paper. We note, however, that there is a significant uncertainty in this conversion factor, since values as high as have been derived for molecular clouds in the Milky Way (Scoville et al., 1987; Strong et al., 1988, see also Dickman (1978), Bloemen et al. (1986), Solomon et al. (1987)) as well as other nearby spiral galaxies (Dickman et al., 1986; Solomon & Barrett, 1991).
Based on our 3 upper limits on and assuming , we estimate that M M⊙ for MRC 2104-242 and M M⊙ for MRC 0943-242. The tentative off-nuclear CO detection in MRC 0943-242 has an estimated molecular gas mass of M M⊙.
4.2 Molecular gas properties of high- radio galaxies
The upper H2 mass limits that we derive for MRC 2104-242 and MRC 0943-242 are comparable to H2 masses derived from CO detections in high- radio galaxies (e.g. Scoville et al., 1997; Papadopoulos et al., 2000; De Breuck et al., 2003a, b, 2005; Klamer et al., 2005; Nesvadba et al., 2009, see also Solomon & Vanden Bout (2005); Miley & De Breuck (2008) for reviews). However, as discussed in Sect. 1, most of these observations have targeted the higher rotational CO transitions, which could underestimate the total molecular gas content in these systems. CO(1-0) detections have been claimed for two high- radio galaxies, namely 4C 60.07 ( Greve et al., 2004) and TNJ 0924-2201 ( Klamer et al., 2005), both with M M⊙. Our derived upper limit on molecular gas mass in MRC 2104-242 () is a factor 5 lower than this.
Sub millimetre galaxies (SMGs) are likely merging systems with a short-lived burst of extreme star formation and are believed to be the progenitors of local massive ellipticals (e.g. Greve et al., 2005; Tacconi et al., 2008). In this sense, high- radio galaxies and SMGs could be the same type of objects that differ only in their level of AGN activity (e.g. Reuland et al., 2007), although Ivison et al. (2008) argue that the violent AGN activity may occur predominantly during the early evolutionary stages of these systems. Greve et al. (2005) derived a median cold gas mass of among 12 SMGs detected in CO (see also Neri et al., 2003). This is of the same order as the upper limits that we derive for the mass of cold gas in MRC 2104-242 and MRC 0943-242.
Our derived upper limits on the molecular gas mass of MRC 2104-242 and MRC 0943-242 are lower than the H2 mass estimates for a non-negligible fraction of normal massive star forming galaxies at , derived from CO(3-2) observations by Tacconi et al. (2010, even when accounting for the much larger CO-to-H2 conversion factor that they used). A similar result is seen by comparing the upper limits on CO in samples of high- radio galaxies (Evans et al., 1996; van Ojik et al., 1997) with the results of Tacconi et al. (2010). Confirmation by observations of larger samples in the same CO transitions might indicate important differences in molecular gas fraction, excitation properties or chemical enrichment processes between high- radio galaxies and distant massive star forming galaxies.
The H2 mass limit of MRC 2104-242 is only a factor 3 higher than the H2 content of the most CO-bright radio galaxies in the low redshift Universe, as studied from CO(1-0) observatons of a large sample of IR-bright radio galaxies by Evans et al. (2005, corrected for the difference in the used -value and cosmological parameters). The vast majority of the low- radio galaxies in the sample of Evans et al. (2005), however, contain significantly less molecular gas. This was recently confirmed by Ocaña Flaquer et al. (2010) with a large sample of low- radio galaxies not selected on IR-properties, for which they derive a median H2 mass of only M M⊙.
We note that many high- CO detections to date are case-studies of galaxies that were pre-selected based on their properties at other wavelengths, such as a large sub-mm dust content or high infra-red (IR) luminosity. Both at low- and high- there appears to be a relation between the far-IR (FIR) and CO luminosity in different types of galaxies (see Evans et al., 2005; Greve et al., 2005, and references therein). Such a relation would indicate that (radio) galaxies with a FIR luminosity in the range of ULIRGs () contain a CO luminosity similar to the upper limit that we derive for MRC 2104-242 ( K km s-1 pc2). From Spitzer observations of MRC 0943-242 at 24, 70 and 160m (Seymour et al., 2007), we estimate an upper limit on the total IR luminosity of when using the approximation by Dale & Helou (2002). Following the IR-CO relation found by Evans et al. (2005) and Greve et al. (2005), this IR limit corresponds to an average CO luminosity roughly a factor 2 lower than the upper limit that we derive for MRC 0943-242. The lack of detectable amounts of CO gas in MRC 0943-242 is therefore not unusual based on its IR properties, but it shows that unbiased CO(1-0) observations of high- radio galaxies are becoming feasible.
Systematic searches for various CO transitions in unbiased samples of high- (radio) galaxies are necessary to objectively investigate the overall content of cold molecular gas in the Early Universe. Our results show that systematic and reliable searches for the ground-transition of CO in high- (radio) galaxies are becoming feasible with existing broadband facilities that can target the 20-50 GHz regime, such as the ATCA and EVLA.
4.2.1 CO in the vicinity of MRC 0943-242?
In this Section we briefly discuss the possible nature of the tentative CO detection in the vicinity of MRC 0943-242, which needs to be confirmed before a more detailed analysis is deemed suitable.
The tentative CO detection ( kpc NE of the host galaxy) may be associated with a nearby companion galaxy, although no companion has been detected in Ly at that location (van Breukelen et al., 2005; Venemans et al., 2007), so any such galaxy would have to be Ly-faint. Alternatively, the tentative CO detection may represent cold gas in the outer part of the quiescent Ly halo (Villar-Martín et al., 2003). Binette et al. (2000) show that C IV absorption is associated with the deep Ly absorption in MRC 0943-242 and derive that this reservoir of absorbing gas is also located in the outer halo (i.e. ouside the radio cocoon). If confirmed, the cold gas properties of MRC 0943-242 resemble those found in the high- radio galaxies TXS 0828+193 ( Nesvadba et al., 2009) and B3 J2330+3927 ( De Breuck et al., 2003a).
The only two known high- radio galaxies in which CO(1-0) has been detected (4C 60.07 and TNJ 0924-2201; see Sect. 4.2) also show indications that the CO gas may not be aligned with the central location of the host galaxy (Klamer et al., 2004; Ivison et al., 2008). In particular 4C 60.07 shows an apparent deficit of molecular gas in the radio host galaxy, while CO appears to be present in a merging companion and associated tidal debris (Ivison et al., 2008). If confirmed, a more detailed comparison between the CO(1-0) properties of these systems deserves further attention.
The position angle of the radio source in MRC 0943-242 (which has a total linear size of about 4′′ and is therefore unresolved in our observations) is PA = -74∘ (Carilli et al., 1997). This is roughly within 45∘ of the location of the tentative CO detection from the central region of the radio host galaxy. If confirmed, this may resemble alignments that Klamer et al. (2004) argue exist among other high- radio galaxies.
4.3 Radio continuum
Both radio sources are clearly detected in our sensitive ( Jy) 7mm continuum observations. Their spectral indices are relatively steep from 30 GHz down to 1.4 GHz, with no evidence for spectral curvature within this large range of frequencies. This indicates that there is no turn-over due to synchrotron losses or inverse Compton cooling up to 115 GHz in the restframe of these radio sources. This is consistent with continuum observations of a large sample of high- ultra-steep spectrum radio galaxies by Klamer et al. (2006), who also find relatively steep power law spectral energy distributions (SEDs) with no evidence for spectral steepening up to several tens of GHz in the rest frame. A detailed analysis of this phenomenon is crucial for understanding the electron acceleration mechanism or environmental properties of high- radio sources, but is beyond the scope of this paper.
5 Conclusions
We presented the first 7mm observations of two high- radio galaxies (MRC 2104-242 and MRC 0943-242) with the GHz Compact Array Broadband Backend. Our results demonstrate the feasibility of using ATCA/CABB for spectral-line work at high redshift. We also presented 7mm continuum images of the two high- radio galaxies, with a typical rms noise level of 30 Jy beam-1. The enhanced spectral-line and continuum capabilities of ATCA/CABB in the millimetre regime complement those of other large existing and upcoming observatories, such as PdbI, EVLA and ALMA.
From our CO(1-0) data we derive upper limits on the H2 mass of M for MRC 2104-242 and M for MRC 0943-242 (). These upper limits are of the same order as H2 mass estimates derived from CO detections of other high- radio galaxies and SMGs, but lower than the mass of molecular gas detected in a non-negligible fraction of normal star forming galaxies at . For MRC 0943-242 we also find a tentative CO(1-0) detection at about 60 kpc distance from the central region of the host galaxy, but this needs to be confirmed with additional observations.
The spectral index of both MRC 2104-242 and MRC 0943-242 is relatively steep with between 1.4 and 30 GHz. There is no evidence for spectral curvature up to GHz in the rest frame of these radio sources.
Acknowledgments
We are tremendously grateful to Warwick Wilson, Dick Ferris and their team and to the engineers and system scientists in Narrabri for making CABB such a great success. We also thank the anonymous referee for good suggestions that significantly improved this paper. The Australia Telescope is funded by the Commonwealth of Australia for operation as a National Facility managed by CSIRO.
References
- Archibald et al. (2001) Archibald E. N., Dunlop J. S., Hughes D. H., Rawlings S., Eales S. A., Ivison R. J., 2001, MNRAS, 323, 417
- Baum et al. (1992) Baum S. A., Heckman T. M., van Breugel W., 1992, ApJ, 389, 208
- Binette et al. (2000) Binette L., Kurk J. D., Villar-Martín M., Röttgering H. J. A., 2000, AA, 356, 23
- Bloemen et al. (1986) Bloemen J. B. G. M., Strong A. W., Mayer-Hasselwander H. A., Blitz L., Cohen R. S., Dame T. M., Grabelsky D. A., Thaddeus P., Hermsen W., Lebrun F., 1986, AA, 154, 25
- Briggs (1995) Briggs D. S., 1995, PhD thesis, New Mexico Institute of Mining and Technology
- Brown & Vanden Bout (1991) Brown R. L., Vanden Bout P. A., 1991, AJ, 102, 1956
- Carilli et al. (1997) Carilli C. L., Roettgering H. J. A., van Ojik R., Miley G. K., van Breugel W. J. M., 1997, ApJS, 109, 1
- Carilli et al. (2007) Carilli C. L., Wang R., van Hoven M. B., Dwarakanath K., Chengalur J. N., Wyithe S., 2007, AJ, 133, 2841
- Carilli et al. (2010) Carilli C. L., Daddi E., Riechers D., Walter F., Weiss A., Dannerbauer H., Morrison G. E., Wagg J., et al., 2010, ApJ, 714, 1407
- Chapman et al. (2005) Chapman S. C., Blain A. W., Smail I., Ivison R. J., 2005, ApJ, 622, 772
- Clark et al. (1998) Clark N. E., Axon D. J., Tadhunter C. N., Robinson A., O’Brien P., 1998, ApJ, 494, 546
- Coppin et al. (2010) Coppin K., Chapman S., Smail I., Swinbank M., Walter F., Wardlow J., Weiss A., Alexander D. M., et al., 2010, MNRAS, 407, 103
- Daddi et al. (2010) Daddi E., Bournaud F., Walter F., Dannerbauer H., Carilli C. L., Dickinson M., Elbaz D., Morrison G. E., et al., 2010, ApJ, 713, 686
- Dale & Helou (2002) Dale D. A., Helou G., 2002, ApJ, 576, 159
- Danielson et al. (2010) Danielson A. L. R., Swinbank A. M., Smail I., Cox P., Edge A. C., Weiss A., Harris A. I., Baker A. J., et al., 2010, MNRAS, 1565
- Dannerbauer et al. (2009) Dannerbauer H., Daddi E., Riechers D. A., Walter F., Carilli C. L., Dickinson M., Elbaz D., Morrison G. E., 2009, ApJL, 698, L178
- De Breuck et al. (2003a) De Breuck C., Neri R., Morganti R., Omont A., Rocca-Volmerange B., Stern D., Reuland M., van Breugel W., et al., 2003a, AA, 401, 911
- De Breuck et al. (2003b) De Breuck C., Neri R., Omont A., 2003b, New Astronomy Review, 47, 285
- De Breuck et al. (2005) De Breuck C., Downes D., Neri R., van Breugel W., Reuland M., Omont A., Ivison R., 2005, AA, 430, L1
- Dickman (1978) Dickman R. L., 1978, ApJS, 37, 407
- Dickman et al. (1986) Dickman R. L., Snell R. L., Schloerb F. P., 1986, ApJ, 309, 326
- Downes & Solomon (1998) Downes D., Solomon P. M., 1998, ApJ, 507, 615
- Emonts et al. (2005) Emonts B. H. C., Morganti R., Tadhunter C. N., Oosterloo T. A., Holt J., van der Hulst J. M., 2005, MNRAS, 362, 931
- Evans et al. (1996) Evans A. S., Sanders D. B., Mazzarella J. M., Solomon P. M., Downes D., Kramer C., Radford S. J. E., 1996, ApJ, 457, 658
- Evans et al. (2002) Evans A. S., Mazzarella J. M., Surace J. A., Sanders D. B., 2002, ApJ, 580, 749
- Evans et al. (2005) Evans A. S., Mazzarella J. M., Surace J. A., Frayer D. T., Iwasawa K., Sanders D. B., 2005, ApJS, 159, 197
- Ferris & Wilson (2002) Ferris R. H., Wilson W. E., 2002, URSI XXVIIth General Assembly, Poster 1629
- Greve et al. (2003) Greve T. R., Ivison R. J., Papadopoulos P. P., 2003, ApJ, 599, 839
- Greve et al. (2004) —, 2004, AA, 419, 99
- Greve et al. (2005) Greve T. R., Bertoldi F., Smail I., Neri R., Chapman S. C., Blain A. W., Ivison R. J., Genzel R., et al., 2005, MNRAS, 359, 1165
- Hainline et al. (2006) Hainline L. J., Blain A. W., Greve T. R., Chapman S. C., Smail I., Ivison R. J., 2006, ApJ, 650, 614
- Harris et al. (2010) Harris A. I., Baker A. J., Zonak S. G., Sharon C. E., Genzel R., Rauch K., Watts G., Creager R., 2010, ApJ, 723, 1139
- Heckman et al. (1986) Heckman T. M., Smith E. P., Baum S. A., van Breugel W. J. M., Miley G. K., Illingworth G. D., Bothun G. D., Balick B., 1986, ApJ, 311, 526
- Holt et al. (2007) Holt J., Tadhunter C. N., González Delgado R. M., Inskip K. J., Rodriguez Zaurin J., Emonts B. H. C., Morganti R., Wills K. A., 2007, MNRAS, 381, 611
- Holt et al. (2008) Holt J., Tadhunter C. N., Morganti R., 2008, MNRAS, 387, 639
- Ivison et al. (2008) Ivison R. J., Morrison G. E., Biggs A. D., Smail I., Willner S. P., Gurwell M. A., Greve T. R., Stevens J. A., Ashby M. L. N., 2008, MNRAS, 390, 1117
- Ivison et al. (2010) Ivison R. J., Smail I., Papadopoulos P. P., Wold I., Richard J., Swinbank A. M., Kneib J., Owen F. N., 2010, MNRAS, 404, 198
- Ivison et al. (2011) Ivison R. J., Papadopoulos P. P., Smail I., Greve T. R., Thomson A. P., Xilouris E. M., Chapman S. C., 2011, MNRAS in press. (arXiv:1009.0749), 46
- Jarvis et al. (2003) Jarvis M. J., Wilman R. J., Röttgering H. J. A., Binette L., 2003, MNRAS, 338, 263
- Kanekar et al. (2007) Kanekar N., Chengalur J. N., Lane W. M., 2007, MNRAS, 375, 1528
- Klamer (2006) Klamer I. J., 2006, PhD thesis, University of Sydney
- Klamer et al. (2004) Klamer I. J., Ekers R. D., Sadler E. M., Hunstead R. W., 2004, ApJL, 612, L97
- Klamer et al. (2005) Klamer I. J., Ekers R. D., Sadler E. M., Weiss A., Hunstead R. W., De Breuck C., 2005, ApJL, 621, L1
- Klamer et al. (2006) Klamer I. J., Ekers R. D., Bryant J. J., Hunstead R. W., Sadler E. M., De Breuck C., 2006, MNRAS, 371, 852
- Kramer et al. (2008) Kramer C., Moreno R., Greve A., 2008, AA, 482, 359
- Labiano et al. (2008) Labiano A., O’Dea C. P., Barthel P. D., de Vries W. H., Baum S. A., 2008, AA, 477, 491
- McCarthy et al. (1990) McCarthy P. J., Kapahi V. K., van Breugel W., Subrahmanya C. R., 1990, AJ, 100, 1014
- Miley & De Breuck (2008) Miley G., De Breuck C., 2008, AARv, 15, 67
- Morganti et al. (2005a) Morganti R., Oosterloo T. A., Tadhunter C. N., van Moorsel G., Emonts B., 2005a, AA, 439, 521
- Morganti et al. (2005b) Morganti R., Tadhunter C. N., Oosterloo T. A., 2005b, AA, 444, L9
- Murphy et al. (2010) Murphy T., Cohen M., Ekers R. D., Green A. J., Wark R. M., Moss V., 2010, MNRAS, 405, 1560
- Neri et al. (2003) Neri R., Genzel R., Ivison R. J., Bertoldi F., Blain A. W., Chapman S. C., Cox P., Greve T. R., et al., 2003, ApJL, 597, L113
- Nesvadba et al. (2008) Nesvadba N. P. H., Lehnert M. D., De Breuck C., Gilbert A. M., van Breugel W., 2008, AA, 491, 407
- Nesvadba et al. (2009) Nesvadba N. P. H., Neri R., De Breuck C., Lehnert M. D., Downes D., Walter F., Omont A., Boulanger F., Seymour N., 2009, MNRAS, 395, L16
- Obreschkow & Rawlings (2009a) Obreschkow D., Rawlings S., 2009a, MNRAS, 400, 665
- Obreschkow & Rawlings (2009b) —, 2009b, ApJL, 696, L129
- Obreschkow et al. (2009a) Obreschkow D., Heywood I., Klöckner H., Rawlings S., 2009a, ApJ, 702, 1321
- Obreschkow et al. (2009b) Obreschkow D., Klöckner H., Heywood I., Levrier F., Rawlings S., 2009b, ApJ, 703, 1890
- Ocaña Flaquer et al. (2010) Ocaña Flaquer B., Leon S., Combes F., Lim J., 2010, AA, 518, A9+
- Omont (2007) Omont A., 2007, Reports on Progress in Physics (arXiv/0709.3814), 70, 1099
- Overzier et al. (2001) Overzier R. A., Röttgering H. J. A., Kurk J. D., De Breuck C., 2001, AA, 367, L5
- Papadopoulos et al. (2000) Papadopoulos P. P., Röttgering H. J. A., van der Werf P. P., Guilloteau S., Omont A., van Breugel W. J. M., Tilanus R. P. J., 2000, ApJ, 528, 626
- Papadopoulos et al. (2001) Papadopoulos P., Ivison R., Carilli C., Lewis G., 2001, Nature, 409, 58
- Pei (1995) Pei Y. C., 1995, ApJ, 438, 623
- Pentericci et al. (2000a) Pentericci L., Kurk J. D., Röttgering H. J. A., Miley G. K., van Breugel W., Carilli C. L., Ford H., et al., 2000a, AA, 361, L25
- Pentericci et al. (2000b) Pentericci L., Van Reeven W., Carilli C. L., Röttgering H. J. A., Miley G. K., 2000b, AAS, 145, 121
- Pentericci et al. (2001) Pentericci L., McCarthy P. J., Röttgering H. J. A., Miley G. K., van Breugel W. J. M., Fosbury R., 2001, ApJS, 135, 63
- Reuland et al. (2007) Reuland M., van Breugel W., de Vries W., Dopita M. A., Dey A., Miley G., Röttgering H., Venemans B., et al., 2007, AJ, 133, 2607
- Richards et al. (2006) Richards G. T., Strauss M. A., Fan X., Hall P. B., Jester S., Schneider D. P., Vanden Berk D. E., Stoughton C., et al., 2006, AJ, 131, 2766
- Riechers et al. (2010) Riechers D. A., Carilli C. L., Walter F., Momjian E., 2010, ApJ, 724, L153
- Rottgering et al. (1995) Rottgering H. J. A., Hunstead R. W., Miley G. K., van Ojik R., Wieringa M. H., 1995, MNRAS, 277, 389
- Scoville et al. (1987) Scoville N. Z., Yun M. S., Sanders D. B., Clemens D. P., Waller W. H., 1987, ApJS, 63, 821
- Scoville et al. (1997) Scoville N. Z., Yun M. S., Windhorst R. A., Keel W. C., Armus L., 1997, ApJL, 485, L21+
- Seymour et al. (2007) Seymour N., Stern D., De Breuck C., Vernet J., Rettura A., Dickinson M., Dey A., Eisenhardt P., et al., 2007, ApJS, 171, 353
- Shaver et al. (1996) Shaver P. A., Wall J. V., Kellermann K. I., Jackson C. A., Hawkins M. R. S., 1996, Nature, 384, 439
- Smail et al. (2002) Smail I., Ivison R. J., Blain A. W., Kneib J., 2002, MNRAS, 331, 495
- Solomon et al. (1987) Solomon P. M., Rivolo A. R., Barrett J., Yahil A., 1987, ApJ, 319, 730
- Solomon & Barrett (1991) Solomon P. M., Barrett J. W., 1991, in IAU Symposium, Vol. 146, Dynamics of Galaxies and Their Molecular Cloud Distributions, F. Combes & F. Casoli, ed., pp. 235–+
- Solomon et al. (1997) Solomon P. M., Downes D., Radford S. J. E., Barrett J. W., 1997, ApJ, 478, 144
- Solomon & Vanden Bout (2005) Solomon P. M., Vanden Bout P. A., 2005, ARAA, 43, 677
- Stark et al. (2008) Stark D. P., Swinbank A. M., Ellis R. S., Dye S., Smail I. R., Richard J., 2008, Nature, 455, 775
- Strong et al. (1988) Strong A. W., Bloemen J. B. G. M., Dame T. M., Grenier I. A., Hermsen W., Lebrun F., Nyman L., Pollock A. M. T., Thaddeus P., 1988, AA, 207, 1
- Tacconi et al. (2008) Tacconi L. J., Genzel R., Smail I., Neri R., Chapman S. C., Ivison R. J., Blain A., Cox P., et al., 2008, ApJ, 680, 246
- Tacconi et al. (2010) Tacconi L. J., Genzel R., Neri R., Cox P., Cooper M. C., Shapiro K., Bolatto A., Bouché N., et al., 2010, Nature, 463, 781
- Tadhunter (1991) Tadhunter C. N., 1991, MNRAS, 251, 46P
- Tadhunter et al. (2005) Tadhunter C., Robinson T. G., González Delgado R. M., Wills K., Morganti R., 2005, MNRAS, 356, 480
- Urquhart et al. (2007) Urquhart J. S., Busfield A. L., Hoare M. G., Lumsden S. L., Clarke A. J., Moore T. J. T., Mottram J. C., Oudmaijer R. D., 2007, AA, 461, 11
- Uson et al. (1991) Uson J. M., Bagri D. S., Cornwell T. J., 1991, Physical Review Letters, 67, 3328
- van Breukelen et al. (2005) van Breukelen C., Jarvis M. J., Venemans B. P., 2005, MNRAS, 359, 895
- van Ojik et al. (1997) van Ojik R., Roettgering H. J. A., van der Werf P. P., Miley G. K., Carilli C. L., Visser A., Isaak K. G., Lacy M., et al., 1997, AA, 321, 389
- Venemans et al. (2007) Venemans B. P., Röttgering H. J. A., Miley G. K., van Breugel W. J. M., de Breuck C., Kurk J. D., Pentericci L., Stanford S. A., Overzier R. A., Croft S., Ford H., 2007, AA, 461, 823
- Vermeulen et al. (2003) Vermeulen R. C., Pihlström Y. M., Tschager W., de Vries W. H., Conway J. E., Barthel P. D., Baum S. A., Braun R., et al., 2003, AA, 404, 861
- Villar-Martín et al. (1999) Villar-Martín M., Tadhunter C., Morganti R., Axon D., Koekemoer A., 1999, MNRAS, 307, 24
- Villar-Martín et al. (2003) Villar-Martín M., Vernet J., di Serego Alighieri S., Fosbury R., Humphrey A., Pentericci L., 2003, MNRAS, 346, 273
- Villar-Martín et al. (2006) Villar-Martín M., Sánchez S. F., De Breuck C., Peletier R., Vernet J., Rettura A., Seymour N., Humphrey A., et al., 2006, MNRAS, 366, L1
- Weiland et al. (2010) Weiland J. L., Odegard N., Hill R. S., Wollack E., Hinshaw G., Greason M. R., Jarosik N., Page L., et al., 2011, ApJS, 192, 19
- Wilson et al. (2011) Wilson W. E., Ferris R. H., Axtens P., Brown A., Davis E., Hampson G., Leach M., Roberts P., et al., 2011, MNRAS (submitted)
- Wright (2006) Wright E. L., 2006, PASP, 118, 1711