11email: imisgeld@mpe.mpg.de 22institutetext: European Southern Observatory, Alonso de Cordova 3107, Vitacura, Santiago, Chile
22email: smieske@eso.org 33institutetext: European Southern Observatory, Karl-Schwarzschild-Strasse 2, 85748 Garching bei München, Germany
33email: mhilker@eso.org 44institutetext: Universidad de Concepción, Departamento de Astronomía, Casilla 160-C, Concepción, Chile 55institutetext: Argelander-Institut für Astronomie, Universität Bonn, Auf dem Hügel 71, 53121 Bonn
A large population of ultra-compact dwarf galaxies
in the Hydra I cluster††thanks: Based on observations obtained at the European Southern Observatory, Chile (Observing Programmes 082.B-0680 and 076.B-0154).
Abstract
Aims. We performed a large spectroscopic survey of compact, unresolved objects in the core of the Hydra I galaxy cluster (Abell 1060), with the aim of identifying ultra-compact dwarf galaxies (UCDs), and investigating the properties of the globular cluster (GC) system around the central cD galaxy NGC 3311.
Methods. We obtained VIMOS medium resolution spectra of about 1200 candidate objects with apparent magnitudes mag, covering both the bright end of the GC luminosity function and the luminosity range of all known UCDs.
Results. By means of spectroscopic redshift measurements, we identified 118 cluster members, from which 52 are brighter than mag, and can therefore be termed UCDs. The brightest UCD in our sample has an absolute magnitude of mag (corresponding to a mass of M☉) and a half-light radius of 25 pc. This places it among the brightest and most massive UCDs ever discovered. Most of the GCs/UCDs are both spatially and dynamically associated to the central cD galaxy. The overall velocity dispersion of the GCs/UCDs is comparable to what is found for the cluster galaxies. However, when splitting the sample into a bright and a faint part, we observe a lower velocity dispersion for the bright UCDs/GCs than for the fainter objects. At a dividing magnitude of mag, the dispersions differ by more than 200 km s-1, and up to 300 km s-1 for objects within around NGC 3311.
Conclusions. We interpret these results in the context of different UCD formation channels, and conclude that interaction driven formation seems to play an important role in the centre of Hydra I.
Key Words.:
galaxies: clusters: individual: Hydra I – galaxies: dwarf – galaxies: fundamental parameters – galaxies: star clusters: general – galaxies: kinematics and dynamics – globular clusters: general1 Introduction
Within the last decade, a new class of stellar systems, called ”ultra-compact dwarf galaxies” (UCDs), has been discovered in the nearby galaxy clusters Fornax, Virgo, Centaurus and Coma (e.g. Hilker et al. 1999; Drinkwater et al. 2000, 2003; Phillipps et al. 2001; Mieske et al. 2004, 2007, 2009; Haşegan et al. 2005; Jones et al. 2006; Firth et al. 2007; Gregg et al. 2009; Price et al. 2009; Chiboucas et al. 2010; Madrid et al. 2010). Recently, UCDs have also been identified in several group environments (e.g. Evstigneeva et al. 2007a; Rejkuba et al. 2007; Blakeslee & Barber DeGraaff 2008; Hau et al. 2009; Da Rocha et al. 2011; Norris & Kannappan 2011). They are characterised by evolved stellar populations (e.g. Mieske et al. 2006; Evstigneeva et al. 2007b), typical luminosities of mag, masses of M☉ (e.g. Mieske et al. 2008), and half-light radii of pc. Unlike globular clusters (GCs), UCDs follow a luminosity-size relation, in the sense that more luminous UCDs have larger half-light radii (e.g. Haşegan et al. 2005; Evstigneeva et al. 2008). Moreover, UCDs show enhanced dynamical mass-to-light () ratios in comparison to Galactic globular clusters of similar metallicity (e.g. Haşegan et al. 2005; Hilker et al. 2007; Rejkuba et al. 2007; Dabringhausen et al. 2008, 2009; Mieske et al. 2008; Taylor et al. 2010).
UCDs are hence of intermediate nature between dwarf elliptical galaxies and GCs, however, they are not a homogeneous class of objects. For example, Virgo UCDs are on average more metal-poor, have larger abundances, and extend to higher ratios than UCDs in Fornax (Haşegan et al. 2005; Mieske et al. 2006, 2007; Evstigneeva et al. 2007b; Hilker et al. 2007), although this might not be true if one could examine complete samples in either cluster. The colours of UCDs cover the full range of colours observed for regular GCs (e.g. Evstigneeva et al. 2008; Hilker 2009), but the brightest UCDs tend to have red colours. Apparently, they represent the extension of the red (metal-rich) GC population to higher luminosities. Blue (metal-poor) UCDs, on the other hand, share the location of nuclei of early-type dwarf galaxies in a colour–magnitude diagram and follow a mass-colour relation (the ”blue tilt”, e.g. Mieske et al. 2010; Norris & Kannappan 2011, and references therein). These properties may indicate that more than one formation channel for UCDs exists.
As one possible formation scenario, it was proposed that UCDs formed from the amalgamation of many young, massive star clusters during the interaction of gas-rich galaxies (e.g. Kroupa 1998; Fellhauer & Kroupa 2002). Indeed, hundreds of young, massive star clusters have been discovered in the merging Antennae galaxies NGC 4038/4039 (e.g. Whitmore et al. 1999). They are themselves clustered into groups, and will likely merge on time scales of a few tens to a hundred Myr. An example of such a merged star cluster complex could be the massive cluster W3 in NGC 7252, which has, apart from its young age of 500 Myr, properties very similar to those of UCDs (Maraston et al. 2004; Fellhauer & Kroupa 2005). Thus, UCDs might be regarded as the brightest and most massive (metal-rich) globular clusters, representing the bright tail of the globular cluster luminosity function (GCLF) (e.g. Mieske et al. 2002, 2004). This scenario is supported by the smooth appearance of the GCLF of several giant elliptical galaxies, which extends continuously to very bright objects which fall into the luminosity range of UCDs (e.g. Mieske et al. 2005; Wehner et al. 2008; Harris 2009). In this context, the high ratios of the most massive UCDs can be interpreted as either the consequence of a non-canonical IMF, top-heavy (Dabringhausen et al. 2009) or bottom-heavy (Mieske & Kroupa 2008), or as the consequence of GC/UCD formation in dark matter haloes (e.g. Baumgardt & Mieske 2008). In a recent study by Gieles et al. (2010), it was shown that also the size-luminosity relation of UCDs can be explained by assuming that low-mass GCs have formed with the same relation as the more massive UCDs, and have moved away from this relation due to dynamical evolution.
An alternative suggestion is that UCDs are genuine compact dwarf galaxies, originating from primordial small scale dark matter peaks and having survived the galaxy cluster formation and evolution until the present time (Phillipps et al. 2001; Drinkwater et al. 2004).
Another possible formation scenario is that UCDs are the remnant nuclei of dwarf galaxies which lost their outer envelopes during the interaction with the tidal field of the parent galaxy or galaxy cluster (e.g. Bassino et al. 1994; Bekki et al. 2001, 2003; Goerdt et al. 2008). Observations show that the structural parameters of the brightest, metal-poor UCDs resemble present-day nuclei of dwarf galaxies. However, the high metallicities of many Fornax UCDs seem to be contradictory to this formation scenario (Mieske et al. 2006, 2007).
| Pointing/ | (2000.0) | (2000.0) | Date | |
|---|---|---|---|---|
| Mask | [h:m:s] | [∘::] | [sec] | |
| P1M1 | 10:36:15.7 | -27:37:12.0 | 2007/11/11 | |
| P1M2 | 10:36:15.7 | -27:37:12.0 | 2008/12/26 | |
| P2M1 | 10:36:58.6 | -27:27:40.4 | 2008/12/27 | |
| P2M2 | 10:36:58.6 | -27:27:40.4 | 2009/01/31 | |
| P3M1 | 10:36:07.1 | -27:24:29.9 | 2009/02/18 | |
| P3M2 | 10:36:07.1 | -27:24:29.9 | 2009/02/01 | |
| P4M1 | 10:37:09.8 | -27:41:11.3 | 2009/02/28 | |
| P4M2 | 10:37:09.8 | -27:41:11.3 | 2009/02/24 | |
| P5M1 | 10:36:18.0 | -27:28:39.6 | 2006/02/28 | |
| P5M2 | 10:36:18.0 | -27:28:39.6 | 2007/01/27 | |
| P5M3 | 10:36:18.0 | -27:28:39.6 | 2007/02/22 | |
| P6M1 | 10:36:28.9 | -27:30:58.7 | 2007/01/21 | |
| P6M2 | 10:36:28.9 | -27:30:58.7 | 2007/01/24 |
Because of the apparent heterogeneity of UCDs, it is essential to broaden the environmental baseline of UCD studies beyond the well studied clusters Fornax and Virgo. In this paper, we present a spectroscopic census of compact objects in the core region of the Hydra I galaxy cluster (Abell 1060). Hydra I is well suited for a search for UCDs, since the cluster centre is dominated by the prominent cD galaxy NGC 3311, which exhibits a very pronounced diffuse light component and an extremely rich globular cluster system (van den Bergh 1977; McLaughlin et al. 1995; Mieske et al. 2005; Wehner et al. 2008). Our aim is to investigate the bright end of the GCLF, where UCDs are expected to be found, and the globular cluster system of the two central cluster galaxies NGC 3311 and NGC 3309. For this, we analyse two spectroscopic surveys, which were carried out with the VIsible MultiObject Spectrograph (VIMOS, LeFevre et al. 2003) mounted on UT3 at the VLT. One survey explicitly targets at UCD candidates (ESO observing programme 082.B-0680, PI: I. Misgeld), the other one targets at fainter sources, mainly GC candidates (ESO observing programme 076.B-0154, PI: T. Richtler). The significance of the data presented here for the dynamics of NGC 3311 is discussed in a parallel contribution (Richtler et al. 2011).
Throughout this paper we adopt a Hydra I distance modulus of mag, which is the mean value from different studies (see Mieske et al. 2005, and references therein). This corresponds to a physical scale of 229 pc/arcsec at Mpc.
2 Observations and candidate selection
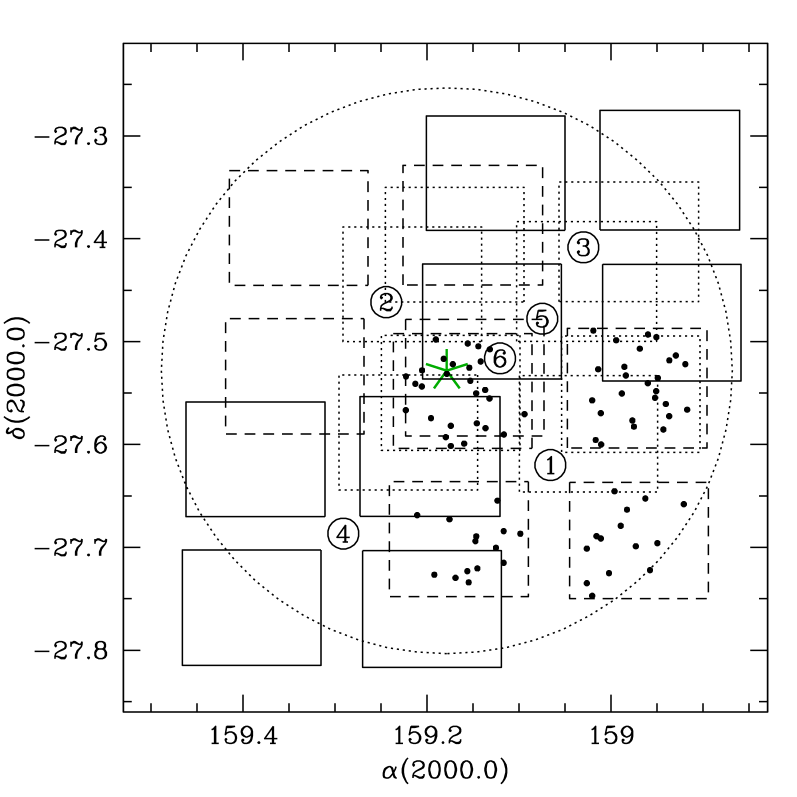
VIMOS allows the simultaneous observation of 4 quadrants in one telescope pointing. Each quadrant is of dimension , with a gap of about between the quadrants. For the UCD survey, we placed four multi-object spectroscopy (MOS) pointings around NGC 3311, the central cD galaxy of the Hydra I cluster (pointings Nr. 1–4 in Fig. 1). Each MOS pointing was observed with two different slit masks which were created with the VIMOS mask creation software VMMPS. Pointing Nr. 1 was already observed with one slit mask in 2007 as part of our previous observing programme 076.B-0293 (see Misgeld et al. (2008) for details). For reasons of consistency, we include the results from this run into the following analyses. For the new UCD survey, this pointing was re-observed with one additional slit mask. Table 1 lists all observations analysed in this paper.
2.1 The UCD survey
The candidates for pointings Nr. 1 and Nr. 2 were selected as described in Misgeld et al. (2008), i.e. being unresolved in the VIMOS - and -band pre-images, and restricted in apparent magnitude and colour to mag and mag.
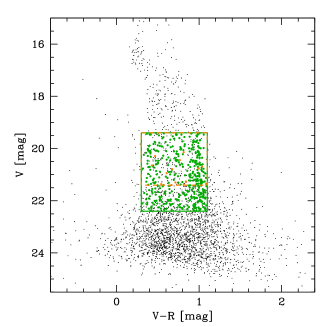
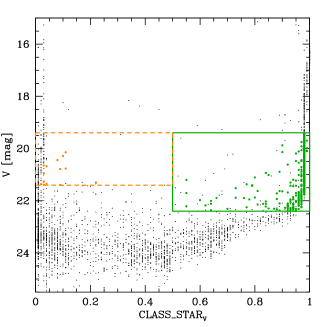
The UCD candidates for the new MOS pointings Nr. 3 and Nr. 4 were again selected from VIMOS pre-imaging in and , however in a slightly different manner. Figure 2 shows exemplarily for pointing Nr. 4 all SExtractor (Bertin & Arnouts 1996) detections in the four quadrants, and the UCD candidates that were selected by the following requirements:
-
1.
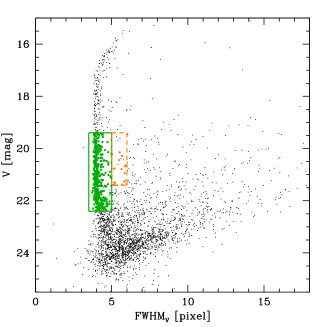
Being unresolved, as judged by the SExtractor star-galaxy separator (CLASS_STAR , with 1 for an unresolved source (“star”) and 0 for a resolved source (“galaxy”)). In order to minimize false detections, we additionally set limits on the FWHM, so that the selected candidates were clearly located on the stellar sequence in the magnitude vs. FWHM plot (see right panel of Fig. 2).
-
2.
Having apparent magnitudes of mag, corresponding to absolute magnitudes of mag, adopting an interstellar absorption coefficient of mag (Schlegel et al. 1998). This encompasses the luminosity range of all known UCDs, although the distinction between UCDs and GCs at the faint magnitude limit is arbitrary to some extent.
- 3.
As shown in Mieske et al. (2009) for UCD candidates in the Centaurus cluster, the SExtractor star-classifier value flips from to at a certain physical size (i.e. ) of the object. At the Centaurus cluster distance of Mpc (Mieske et al. 2005) and a seeing of this happens at pc (cf. Fig. 1 in Mieske et al. 2009). Since the Hydra I cluster lies at about the same distance (Mieske et al. 2005), and the pre-imaging was done under similar seeing conditions, the limitation to objects with CLASS_STAR would not select the largest known UCDs with effective radii pc (e.g. Evstigneeva et al. 2008).
We therefore defined an additional sub-sample of slightly resolved UCD candidates, having brighter magnitudes ( mag), lower star-classifier values (CLASS_STAR ), and a slightly larger FWHM than the primary UCD candidates (see Fig. 2).
Wehner & Harris (2007) and Wehner et al. (2008), W7W8 hereafter, performed a photometric study of the globular cluster system around NGC 3311 and NGC 3309 and identified several UCD candidates. We included 48 objects with magnitudes mag from their list of candidates to our spectroscopic survey (see also Fig. 6).
All spectra were obtained with VIMOS, using the medium resolution MR grism and the order sorting filter GG475. The grism gives a wavelength coverage of [4800:10 000] Å at a dispersion of 2.5 Å/pixel. The pixel scale is /pixel, so that with a slit width of the instrumental resolution corresponds to a pixel, or 12 Å. This equates to a velocity resolution of 600 km s-1 at 6000 Å. The average seeing for this set of spectroscopic observations was . The total on-source integration time was 1.4 hours, subdivided into two exposures.
2.2 The GC survey
Two MOS pointings were observed for the GC survey. Pointing Nr. 5 was observed with three different slit masks, pointing Nr. 6 with two (cf. Table 1 and Fig. 1). From the pre-images in - and -band, all unresolved sources (CLASS_STAR ) with colours mag and magnitudes mag were selected as GC candidates.
The spectra of the GC candidates were obtained with the same instrument setup as for the UCD candidates, but given the fainter magnitudes of most of the targets, the total on-source integration time was 2.4 hours. The seeing ranged between and .
3 Data reduction and radial velocity measurements
For the data reduction from a 2D raw spectrum to a wavelength calibrated 1D spectrum we used the VIPGI (VIMOS Interactive Pipeline and Graphical Interface) data reduction pipeline (Scodeggio et al. 2005). This pipeline is based on the core reduction routines which are also used by the ESO VIMOS pipeline111http://www.eso.org/sci/data-processing/software/pipelines/. VIPGI is particularly suited for reducing and combining sequences of exposures, and allows amongst others the interactive control of the wavelength calibration of each spectrum.
Since the individual science exposures were taken in at least two different nights, the bias subtraction, flat field division, sky subtraction and wavelength calibration were performed separately for each exposure. Afterwards, the pipeline combined these exposures into a single sky subtracted and wavelength calibrated 2D science frame, and extracted the 1D spectra using the Horne extraction algorithm (Horne 1986).
Radial velocities were measured by performing a Fourier cross-correlation between the calibrated 1D object spectra and a template spectrum (IRAF-task fxcor in the rv package). We used a synthetic template spectrum which resembles a typical early-type galaxy (Quintana et al. 1996). This template has proven to give the best and most reliable cross-correlation results for this type of survey (e.g. Mieske et al. 2004; Misgeld et al. 2008; Mieske et al. 2009).
For a radial velocity measurement to be regarded as reliable, we required a cross-correlation confidence value of (Tonry & Davis 1979). All spectra for which a lower -value was achieved, were re-measured independently by the authors IM, SM and MH, and the measurement was only accepted if the three independent measurements were in agreement. Redshifts for objects showing emission lines were determined with the IRAF-task rvidlines. In most of these cases the [OII], H, H, [OIII] and H emission lines were used for measuring the redshift. Heliocentric velocity corrections were applied to all measurements. The individual measurement uncertainties are of the order of 25–160 km s-1, with a median of 54 km s-1.

3.1 Systematic radial velocity shifts
The VIPGI pipeline allows to compute for each slit the offset of a particular sky line in the spectrum from its expected position. With this data it is possible to correct for systematic wavelength shifts which correspond to radial velocity shifts.
Since the wavelength range [5000:7000] Å was used for the radial velocity measurements, we chose the Å [OI] and the Å [OI] sky lines to estimate the systematic wavelength shifts. Given that the shifts were found to be largely independent of the position of the slit on the mask, we recorded the median offset and the according rms of each of the two sky lines for each quadrant and mask. The final radial velocity shift was then computed by
| (1) |
with the median wavelength offset , the mean wavelength Å, and the speed of light. The error for was calculated from the rms of . The obtained radial velocity shifts were of the order of 40–170 km s-1 (or 0.8–3.4 Å).
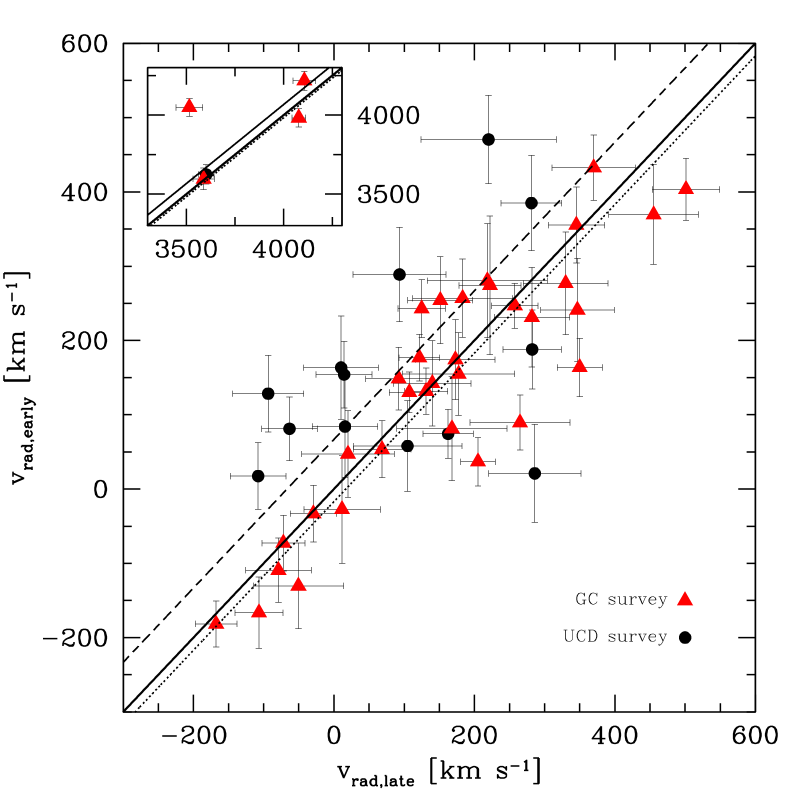
Since the observations span a period of several months up to more than one year (see Table 1), we have to check for systematic radial velocity offsets which are potentially caused by VIMOS instrument instabilities. For this, we compare in Fig. 3 the measured radial velocities of objects which were observed twice in one individual observing programme, i.e. within the UCD survey (pointing Nr. 1–4), or within the GC survey (pointing Nr. 5–6). For both surveys, a linear fit to the data points gives a relation with a slope consistent with one. Thus, we fix the slope to , in order to determine the offset of the fitted relation from the one-to-one relation. For the GC sample, we determine an offset of km s-1, with a rms of km s-1. Within the measurement uncertainties, this is consistent with the one-to-one relation. The clear outlier at km s-1 was excluded from the fit, since the later measurement was with at the border of what we regarded as a reliable measurement (cf. Sect. 3), in contrast to for the earlier measurement.
The UCD data points show a larger scatter, and the linear fit results in an offset of km s-1, with a rms of km s-1. However, there is no clear systematic velocity shift in one direction. For example, data points that compare the earliest with the latest observations lie above as well as below the one-to-one relation. For this reason and due to the rather large measurement uncertainties and the small sample size, we do not apply any constant velocity shift to the UCD data. The larger velocity scatter in the case of the UCD data set may be linked to the commonly known flexure problems of VIMOS, which can lead to misalignment of targets in their respective slits. In fact, many of our UCD targets were located at the very edge of their respective slits, making it in some cases impossible to extract a spectrum.
In Fig. 4, the radial velocities measured in the UCD survey are compared to the ones measured in the GC survey. To determine a possible systematic offset, we fit a linear relation with slope to the data. This results in a offset km s-1 with a rms of km s-1 (dotted line in Fig. 4), which is consistent with the one-to-one relation. Again, the relatively large scatter can be attributed to the instrument instabilities of VIMOS.
4 Results
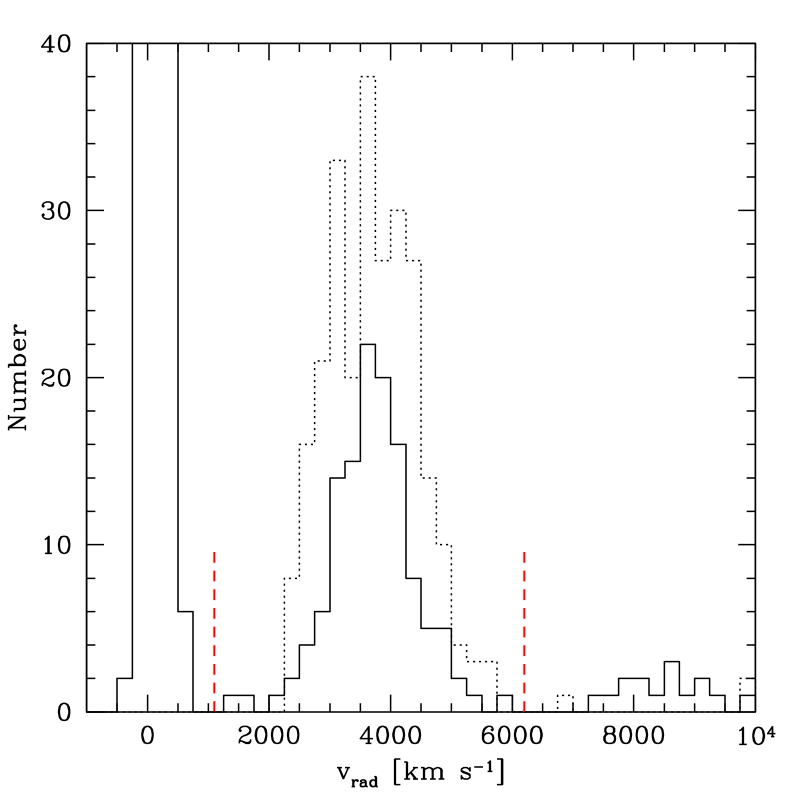
In total, we observed 1236 individual compact objects (including the objects from the previous programme 076.B-0293), compared to 1948 photometrically selected sources (cf. Sect. 2). Within the surveyed area, the completeness in terms of slit allocation is thus about 63%. A radial velocity could be measured for 1018 objects (% of the observed objects). We identified 776 foreground stars, 124 background objects and 118 cluster GCs/UCDs. As the cluster membership criterion we required km s-1 (see Fig. 5). We consider two objects with relatively low radial velocities ( km s-1) as cluster members, since also planetary nebulae with similar radial velocities have been identified in the Hydra I cluster (Ventimiglia et al. 2008, 2011). Towards higher radial velocities, there is a clear gap between cluster and background objects, the latter having radial velocities larger than km s-1. A catalogue with the coordinates, magnitudes and colours (obtained from the VIMOS pre-images) and the radial velocities of the 118 cluster objects is given in Table LABEL:tab:hydraucdsgcs in the appendix (only available on-line).
For the sub-sample of slightly resolved UCD candidates (see Sect. 2.1), we selected 35 objects, of which 27 were observed, yielding 20 background objects and 4 foreground stars. No radial velocity could be measured for the remaining 3 objects.
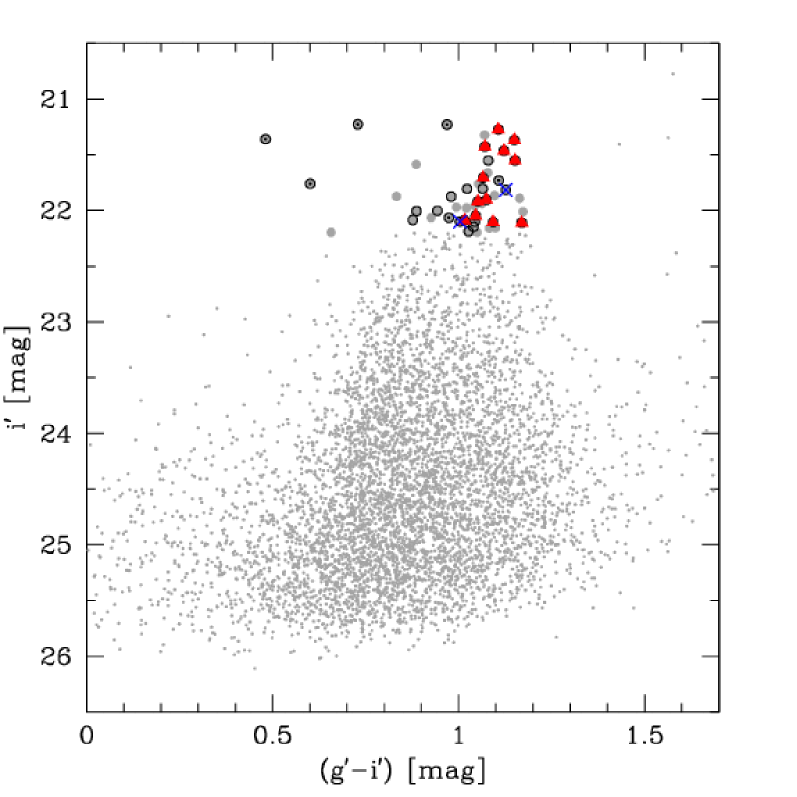
30 of the 48 selected UCD candidates from W7W8 could be observed. Figure 6 shows a colour-magnitude diagram (CMD) of the globular clusters around NGC 3311, as obtained from their Gemini South GMOS imaging in and . The spectroscopically observed objects are highlighted. For 20 of them we were able to measure a radial velocity, resulting in 12 cluster members, 6 foreground stars and 2 background objects.
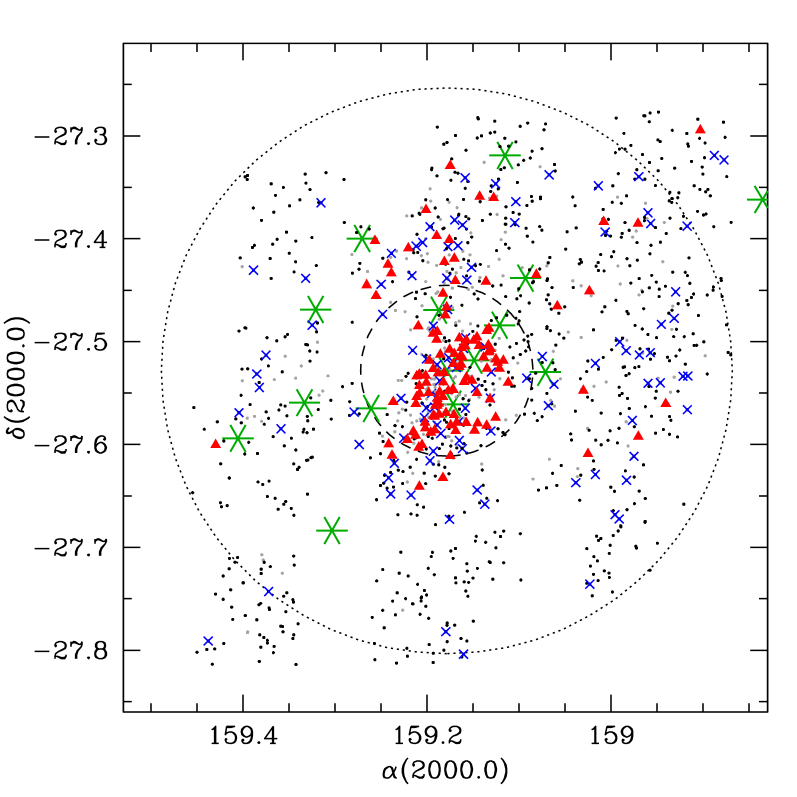
In Fig. 7 we present a map of the entire sample of objects observed in our survey.
4.1 Photometric and structural properties
4.1.1 VLT/VIMOS imaging
The objects’ instrumental magnitudes, as measured in the pre-images, were calibrated using the photometric zeropoints given by the ESO Quality Control and Data Processing Group222QCG, http://www.eso.org/observing/dfo/quality/. Colours and magnitudes were then corrected for interstellar absorption and reddening, mag and mag (Schlegel et al. 1998).
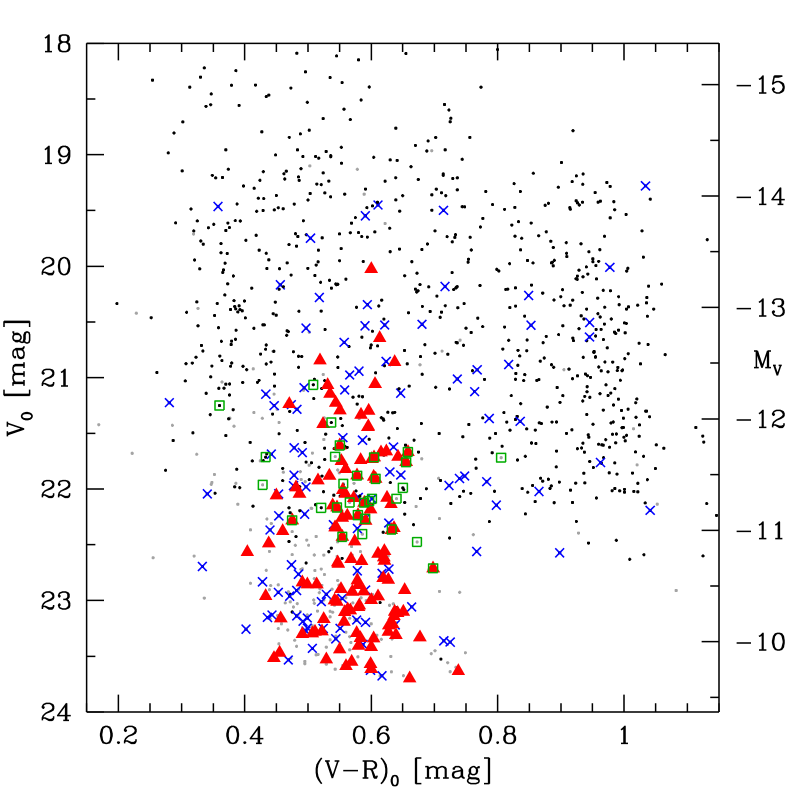
A CMD of all observed objects is plotted in Fig. 8. Adopting a Hydra I distance modulus of mag (Mieske et al. 2005), 52 of the identified cluster objects are brighter than mag (see also Table LABEL:tab:hydraucdsgcs). This luminosity corresponds to a mass of solar masses, applying a mean UCD ratio of 3 (e.g. Mieske et al. 2008). Such objects are generally called UCDs, although the distinction between UCDs and GCs is not clear at low luminosities. Even if assuming , these objects are still more luminous and more massive than Centauri, which is with mag and a mass of M☉ the most luminous and most massive globular cluster in our Galaxy (Harris 1996; van de Ven et al. 2006). Adopting this mass limit for the separation of GCs and UCDs, as suggested by Haşegan et al. (2005) and Mieske et al. (2008), we even have more than 80 UCDs in our sample. In comparison to the photometric studies of W7W8, we find 15 UCDs brighter than mag, which is the magnitude of the brightest confirmed cluster object from their list of UCD candidates (see Fig. 8). The three brighter candidate objects turned out to be foreground stars.
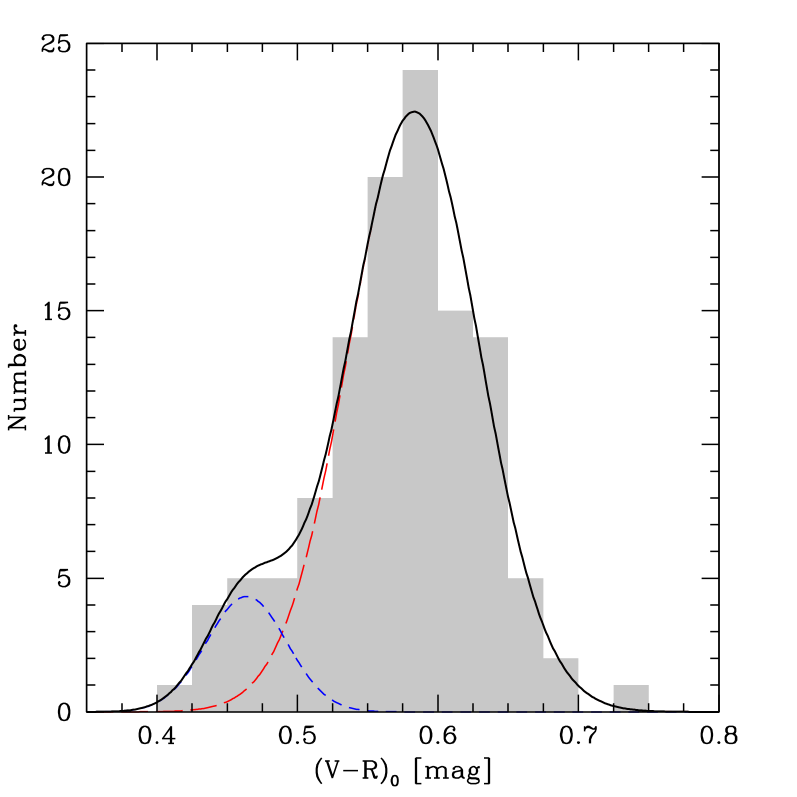
The identified cluster GCs/UCDs have de-reddened colours of mag, but they are not uniformly distributed in colour-space, as Fig. 9 shows. A bimodal GC colour distribution is expected for NGC 3311 (Wehner et al. 2008), and for our data, a double Gaussian distribution is preferred to a single Gaussian distribution ( and , respectively). Fitting a double Gaussian function to the data results in a blue peak at mag and a red peak at mag. For a 13-Gyr population, these peaks correspond to metallicities of dex and dex, respectively (Bruzual & Charlot 2003). These estimates are consistent with the values derived for metal-poor and metal-rich GCs in a number of giant elliptical galaxies (Brodie & Strader 2006, and references therein). Given this, we define for the following analyses (Sect. 4.2) a blue (metal-poor) and a red (metal-rich) sub-population with mag and mag, respectively. The separating colour corresponds to a metallicity of dex.
With mag, the brightest UCD in our sample (HUCD1) clearly belongs to the metal-rich sub-population and is located at the tip of the red GC sequence in the CMD. This confirms results of photometric studies, where the red GC sequence is found to extend to higher luminosities than the blue sequence (e.g. Wehner et al. 2008; Mieske et al. 2010).
4.1.2 HST/WFPC2 imaging
For 26 of the identified cluster GCs/UCDs, imaging is available in the HST archive. Two WFPC2 fields were observed in Cycle 6 with the PC1 chip centred on NGC 3311 and NGC 3309, respectively. The exposure times were s in and s in for the field centred on NGC 3311, and s in both filters for the NGC 3309 field (HST programme GO.06554.01-95A, PI: J.P. Brodie, see also Brodie et al. 2000).
The F555W and F814W images were bias, flat-field and bad pixel corrected. The sub-pixel dithered imaging allowed us to eliminate cosmic-rays, hot pixels and improve the spatial resolution. To perform a PSF photometry on each individual WFPC2 detector, we created a grid of PSFs with the TinyTim333TinyTim accounts for significant variation of the PSF as a function of wavelength (filter) due to diffraction, large angle scattering, field-dependence, aberrations, focus offsets between cameras and wavelength dependent charge diffusion (see http://www.stsci.edu/software/tinytim/) software package (Krist 1995). This library was used to create a spatially variable PSF model and perform PSF-fitting photometry with the allstar task in IRAF. Isolated stars were used to determine an aperture correction to aperture diameter, which is the aperture used by Dolphin (2009) to derive the most up to date CTE corrections and photometric zero points for each of the WFPC2 chips. Finally, the VEGAMAG WFPC2 photometry was corrected for foreground extinction using Schlegel et al. (1998) dust maps towards the direction of both galaxies, and Cardelli et al. (1989) relations for to calculate the absorption at the effective wavelengths for the WFPC2 filters. The following dereddening values were applied: mag and mag. To transform the VEGAMAG WFPC2 magnitudes to the standard Johnson/Cousins magnitudes, we used the Dolphin (2009) transformations with the coefficients in their table 4 for the colour.
| ID | ||||||||
|---|---|---|---|---|---|---|---|---|
| [mag] | [mag] | [mag] | [mag] | [pix] | [pc] | |||
| HUCD1 | 5 | 134.4 | ||||||
| HUCD8 | 15 | 62.6 | ||||||
| HUCD14 | 5 | 64.0 | ||||||
| HUCD18 | 30 | 55.1 | ||||||
| HUCD21 | 5 | 50.1 | ||||||
| HUCD30 | 15 | 47.8 | ||||||
| HUCD35 | 5 | 43.9 | ||||||
| HUCD39 | 30 | 29.4 | ||||||
| HUCD42 | 5 | 37.2 | ||||||
| HUCD44 | 30 | 37.3 | ||||||
| HUCD46 | 15 | 28.2 | ||||||
| HUCD47 | 30 | 34.0 | ||||||
| 54 | 30 | 27.9 | ||||||
| 59 | 5 | 27.0 | ||||||
| 61 | 30 | 22.6 | ||||||
| 66 | 5 | 27.4 | ||||||
| 68 | 5 | 21.4 | ||||||
| 69 | 5 | 20.8 | ||||||
| 90 | 5 | 14.8 | ||||||
| 94 | 15 | 17.2 | ||||||
| 99 | 5 | 17.4 | ||||||
| 101 | 5 | 13.1 | ||||||
| 110 | 5 | 12.1 | ||||||
| 112 | 15 | 10.6 | ||||||
| 114 | 5 | 11.7 | ||||||
| 115 | 5 | 10.5 |
At a the adopted distance of Mpc ( mag), one PC1 and WF2,3,4 pixel corresponds to 11 and 22 pc, respectively. For high signal-to-noise objects (typically ), one can reliably measure down to 0.1 pix, i.e. pc. Therefore, it is feasible to measure sizes for extended objects (such as UCDs and bright GCs) from the WFPC2 frames.
To measure the half-light radii of the 26 spectroscopically confirmed objects, we generated ten times sub-sampled PSFs with TinyTim for . Each PSF was tailored to the position of the object on the chip. Utilizing the ishape task of the baolab software package444http://www.astro.uu.nl/~larsen/baolab/ (Larsen 1999), this PSF was used to model the object profile as an analytical function convolved with the (model) PSF. When sub-sampling is enabled, TinyTim does not include a convolution with the charge diffusion kernel (CDK), which additionally smears the stellar PSF. Thus, during fitting with ishape, the TinyTim PSF was convolved with a CDK, that simulates blurring caused by charge diffusion which is well understood for the filter.
All objects were modelled with King (1962) profiles with concentrations of the tidal-to-core radius of and 100. We adopted the structural parameter measurements from the best fit model. The output is the along the semi-major axis which needs to be corrected for ellipticity and brought to the geometrical mean value (”effective” ) by multiplying the square root of the major/minor axis ratio (for details see e.g. Eq. 1 in Georgiev et al. 2008).
Table 2 lists the photometric and structural properties of the 26 cluster GCs/UCDs. The magnitudes derived from the HST images are, on average, 0.2–0.4 mag fainter than those measured in the VIMOS pre-images. Reasons for this discrepancy likely include the uncertainty in the VIMOS photometric zeropoints (no photometric standard was taken at the night of the pre-imaging), the different magnitude measurement techniques, and the uncertainty in the magnitude transformation of the HST data.
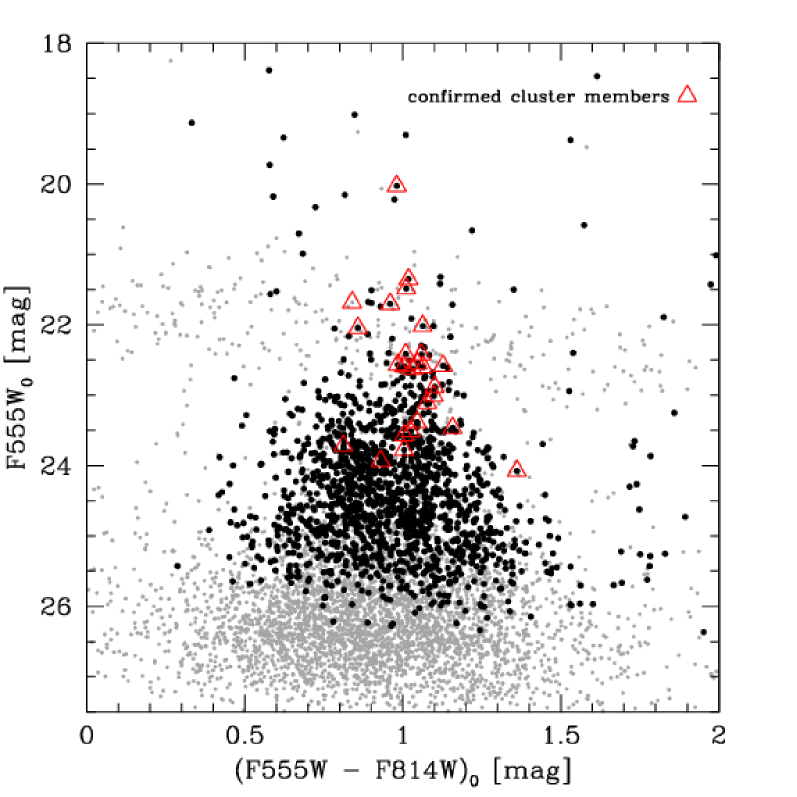
Figure 10 shows a colour-magnitude diagram of all WFPC2 sources around NGC 3309/3311, with the confirmed cluster GCs/UCDs highlighted. In Fig. 11, we compare the half-light radii and luminosities of the Hydra I GCs/UCDs to globular clusters from the ACS Virgo Cluster Survey (ACSVCS, Jordán et al. 2009), Milky Way, LMC/SMC and Fornax star clusters from McLaughlin & van der Marel (2005), UCDs from Mieske et al. (2008), and the compact object M59cO (Chilingarian & Mamon 2008).
The apparent -band magnitudes of the ACSVCS GCs were transformed into absolute -band magnitudes using the relation given in Peng et al. (2006), and a Virgo distance modulus of mag (Mei et al. 2007). is the average of the half-light radii measured in the - and in the -band. and of the star clusters from McLaughlin & van der Marel (2005) are the King models values. The tabulated masses of the UCDs from Mieske et al. (2008) were converted into with the given ratios and a solar absolute magnitude of mag (Binney & Merrifield 1998). For M59cO, was calculated from using mag (Fukugita et al. 1995).
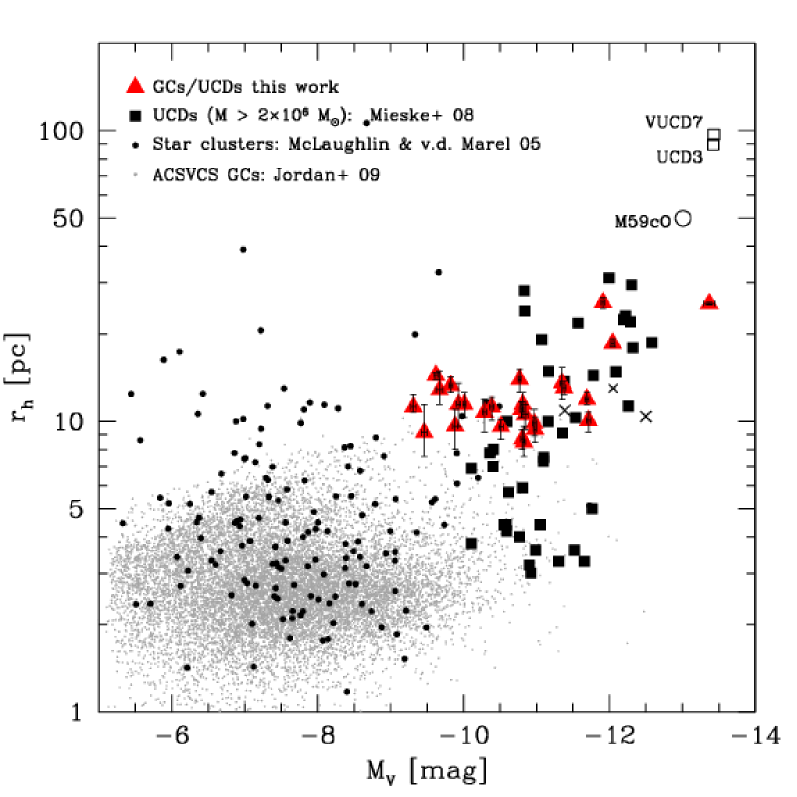
The sizes, luminosities and colours of the Hydra I GC/UCDs are fully consistent with the ones of Virgo and Fornax UCDs (e.g. Evstigneeva et al. 2008; Mieske et al. 2008). A size-luminosity relation is visible for objects brighter than mag, following the trend observed in other galaxy clusters. Below this magnitude, we do not regard the size measurements with ishape reliable, since the is smaller than 20 for those objects (cf. Table 2).
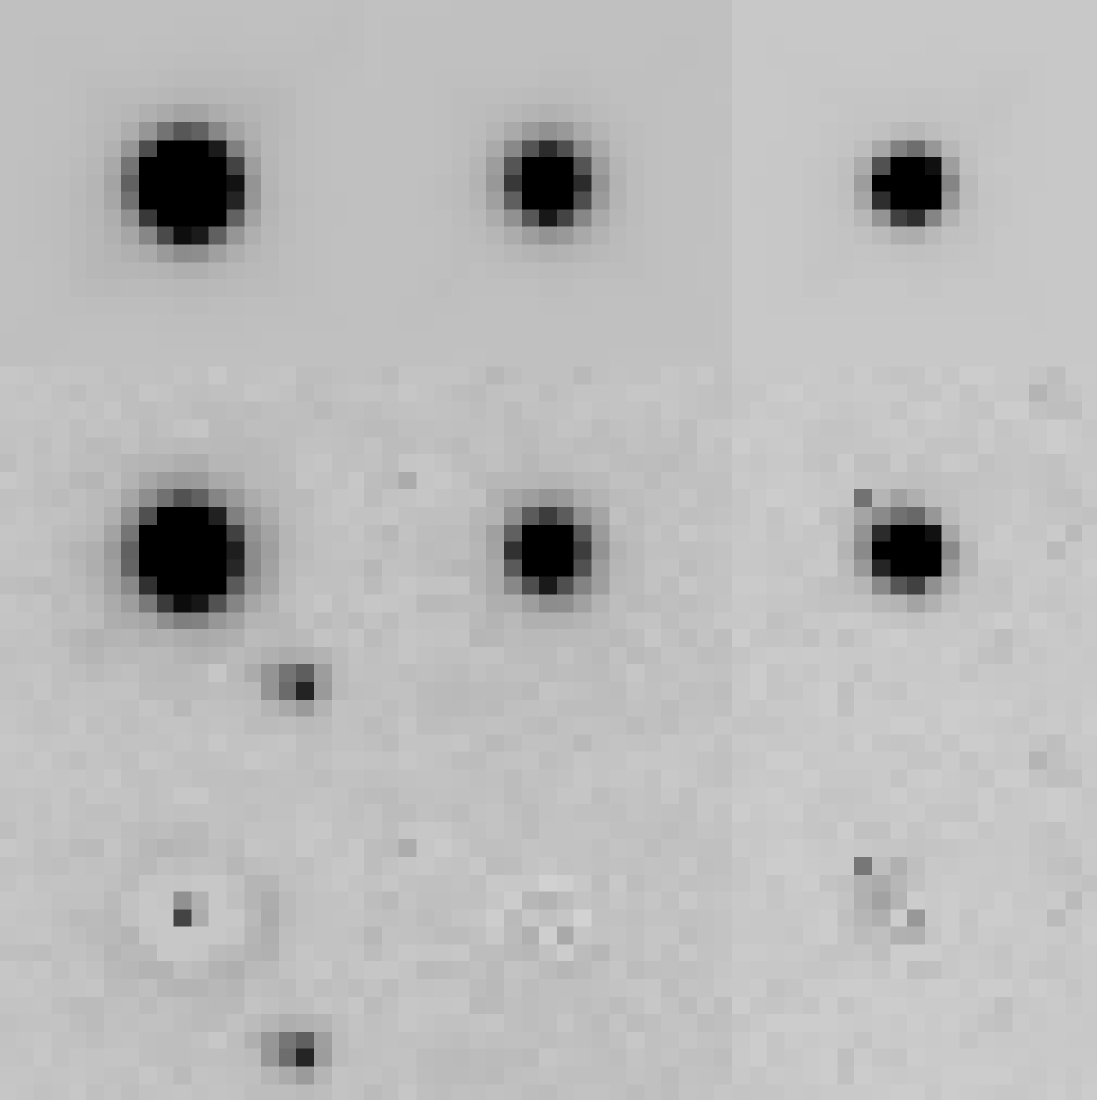
With mag, HUCD1 is the brightest object in our sample. Its luminosity corresponds to a mass of about M☉ (assuming ), or even M☉, if assuming a mass-to-light ratio larger than 5, which has been measured for several of the brightest UCDs in Virgo and Fornax (Mieske et al. 2008). Hence, HUCD1 has a luminosity/mass comparable to the most massive UCDs in Virgo and Fornax (VUCD7 and UCD3), but with its half-light radius of pc, it is the most compact object among the highest luminosity UCDs. VUCD7 and UCD3 are known to feature a two-component light profile with an extended faint envelope and a smaller core component (Evstigneeva et al. 2007b), which is also indicated in Fig. 11. A weak indication for a faint halo is observed for HUCD1, but not for the other two luminous UCDs. This can be seen in Fig. 12, where from from left to right are shown the three brightest UCDs in our sample, and from top to bottom the according PSF model, the object and the residual (object minus PSF model) image. The residuals for HUCD1 are of the order of a few percent of the value of the corresponding science image pixel. However, King profiles are known not to represent well the outer regions of GCs (e.g. McLaughlin & van der Marel 2005), therefore we cannot affirmatively conclude that the observed residual halo of HUCD1 is due to a presence of a second component as for VUCD7 and UCD3.

4.2 Kinematics
The majority of the confirmed cluster GCs/UCDs is located in the immediate vicinity of NGC 3311, i.e. within a projected distance of , or kpc (see Fig. 7). In Fig. 13 we plot the objects apparent magnitudes and radial velocities versus the projected distance from NGC 3311. There appears to be a trend that brighter objects are in projection located further away from the central galaxy. This is, however, caused by selection effects, in the sense that the fields in which brighter objects have been selected reach further out in radius (cf. Fig. 1 and Sect. 2.1).
In order to clean the sample, we applied an outlier rejection method as described in Schuberth et al. (2010) to our data. This method is based on the tracer mass estimator by Evans et al. (2003). In a first step, the quantity
| (2) |
is calculated, where are the velocities of the considered objects, relative to the mean velocity km s-1 of the entire sample. are the projected distances from NGC 3311, and is the number of objects. Then, in an iterative process, the object with the largest contribution to , i.e. , is removed and is again calculated for the remaining objects. In this way, 5 outliers were identified (open symbols in Fig. 13).
The mean radial velocity and the dispersion of the full and the cleaned sample were determined with the maximum likelihood estimator function fitdistr, which is implemented in the R-statistics software555Venables & Ripley (2002), http://www.r-project.org.. The values for and before and after applying the outlier rejection method are listed in Table 3. The table also gives the dispersion , as returned by the Pryor & Meylan (1993) estimator. This estimator additionally takes into account the individual measurement errors, i.e. the velocities are weighted by their respective uncertainties.
4.2.1 Mean radial velocities
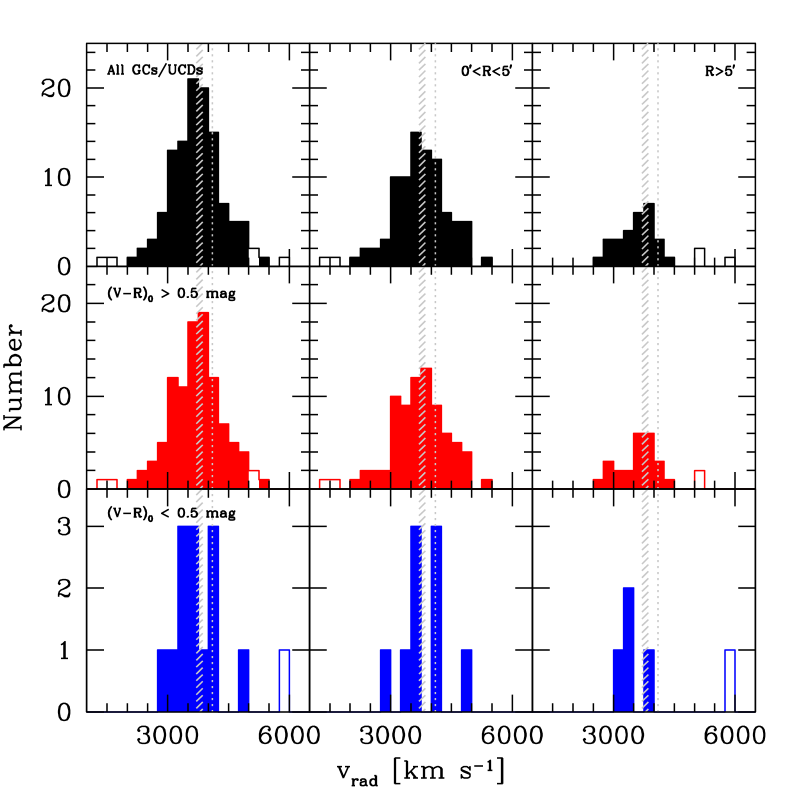
The radial velocity distributions of the entire GC/UCD population, the red and the blue sub-population (see Sect. 4.1.1 and Fig. 9) are shown in Fig. 14. Each population is also sub-divided into a central population () and an outer population (). The mean radial velocities of the different GC/UCD samples are consistent with the range of radial velocities reported for NGC 3311 in the literature, i.e. km s-1 (e.g. Postman & Lauer 1995; Christlein & Zabludoff 2003; Wegner et al. 2003; Misgeld et al. 2008). This suggests that the GC/UCD system is dynamically rather associated to the cD galaxy NGC 3311, instead of belonging to the close-by giant elliptical galaxy NGC 3309, which has a significantly higher radial velocity of 4100 km s-1 (e.g. Christlein & Zabludoff 2003; Wegner et al. 2003; Misgeld et al. 2008). This result is supported by a detailed photometric study of the globular cluster system around NGC 3311 and NGC 3309 (Wehner et al. 2008). The authors show that the GC system of NGC 3311 is completely dominant in terms of specific frequency .
Figures 7 and 13 show that the outer GCs/UCDs are spaciously distributed between 70 and 200 kpc away from the cluster centre. Only three of these objects are in projection located close to a major cluster galaxy. The full sample of 31 objects has a mean radial velocity which is consistent with the systemic velocity of NGC 3311, while the outlier-cleaned sample (28 objects) has a km s-1 lower mean radial velocity. However, both values agree within their uncertainties. These results suggest that most of the outer objects also belong to the NGC 3311 GC system. This is consistent with studies of the GC system of NGC 1399, the central galaxy of the Fornax cluster, where its GC system could be traced out to a distance of kpc (Bassino et al. 2006; Schuberth et al. 2008).

| Population | ||||
|---|---|---|---|---|
| [km s-1] | [km s-1] | [km s-1] | ||
| All | 118 | |||
| All∗ | 113 | |||
| All, | 87 | |||
| All∗, | 85 | |||
| All, | 31 | |||
| All∗, | 28 | |||
| Red | 104 | |||
| Red∗ | 100 | |||
| Red, | 78 | |||
| Red∗, | 76 | |||
| Red, | 26 | |||
| Red∗, | 24 | |||
| Blue | 14 | |||
| Blue∗ | 13 | |||
| Blue, | 9 | |||
| Blue, | 5 | |||
| Blue∗, | 4 | |||
| Faint | 58 | … | ||
| Bright | 60 | … | ||
| Faint∗ | 55 | … | ||
| Bright∗ | 58 | … | ||
| Faint, | 49 | … | ||
| Bright, | 38 | … | ||
| Faint∗, | 47 | … | ||
| Bright∗, | 38 | … |
4.2.2 Velocity dispersions
In most of the cases, the two velocity dispersions ( and ) given in Table 3 do not differ from each other by more than 6 km s-1. The velocity dispersions of both the inner and the outer populations (without outlier rejection) are with km s-1 comparable to what Christlein & Zabludoff (2003) found for the Hydra I cluster velocity dispersion, i.e. km s-1. Naturally, the velocity dispersions of the outlier-cleaned samples are always lower than those of the full samples. However, removing the three objects above km s-1 and with distances kpc (see Fig. 13) would lead to a considerable drop in the velocity dispersion from km s-1 to km s-1 (cf. Table 3).
Assuming that most of the GCs/UCDs at distances larger than kpc dynamically belong to NGC 3311 (see Sect. 4.2.1), a lower velocity dispersion compared to the overall cluster galaxy velocity dispersion might be expected. This has for example been observed for a sample of UCDs in the Coma cluster core (Chiboucas et al. 2010). However, if including the three questionable objects, the velocity dispersions of the outer population is comparable to the one of the inner population. Those objects might also belong to a different cluster galaxy with a high radial velocity ( km s-1), hence causing the high velocity dispersion in the outer sample, but none of the three questionable objects is located close to a major cluster galaxy with a similar high radial velocity. On the other hand, if the majority of the outer GCs/UCDs belongs to an intra-cluster population, one would expect the velocity dispersion to be of similar order to the velocity dispersion of the cluster galaxies, which is about km s-1 at kpc (Łokas et al. 2006). However, the GC/UCD velocity dispersion at distances larger than kpc is statistically less well defined than for smaller distances, thus we cannot favour one of these scenarios. This holds for the full sample as well as for the red sub-sample. Due to the low number of objects, the values for the blue sub-populations are highly uncertain and do not allow a deeper analysis. The radial velocity dispersion profile of the GC/UCD system and its significance for the dynamics of NGC 3311 is discussed in a parallel contribution (Richtler et al. 2011).
In Fig. 15 we compare the velocity dispersion of bright and faint objects by splitting the GC/UCD sample at six different magnitudes around mag. This is done for both the full sample and the outlier-cleaned sample. Additionally, we do the same analysis only for objects within around NGC 3311 (see the lower two panels of Fig. 15).
In both the full and the outlier-cleaned sample, bright GCs/UCDs have a lower velocity dispersion than fainter objects. This is true for dividing magnitudes mag, and it is most pronounced at mag, at which also the sample sizes are almost identical. At this magnitude, the -values differ by more than 200 km s-1 ( significance), and up to 300 km s-1 ( significance) for objects with (see also Table 3). The differences for the outlier-cleaned samples (full and inner sample) are smaller, but still more than km s-1. At fainter dividing magnitudes the differences are not any longer significant.
At first view, the lower velocity dispersion of the bright sample might be explained by the selection effects described above (Sect. 4.2): due to the configuration of the VIMOS pointings (Fig. 1), bright objects are preferentially probed at larger projected distances to NGC 3311. At the same time, these objects exhibit a lower velocity dispersion, as can be seen in Fig. 13 and Table 3. However, when only regarding objects within around NGC 3311, the difference in is even larger and cannot only be explained by selection effects. We discuss the implications of this finding in more detail in Sect. 5.
4.2.3 Rotation
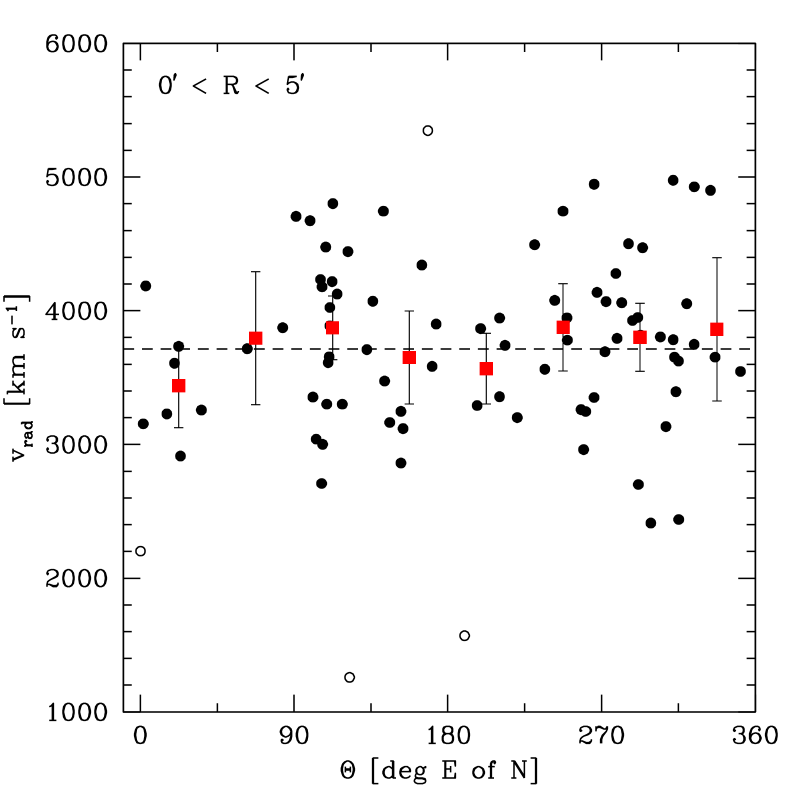
In order to further investigate the dynamical properties of the GC system around NGC 3311, we restrict our sample to objects within a projected distance of and with radial velocities around the mean of this sample. We then plot their radial velocity as a function of their azimuthal position in the projected sky (Fig. 16). If the GC system was rotating as a whole, we expect in such a diagram a sine pattern of the form
| (3) |
with being the mean radial velocity of the sample, the rotation amplitude and the projected rotation axis. It turns out that a meaningful fit to the data is not possible, neither to the individual data points nor to the binned data. The small sample size (only 83 objects) and a significant incompleteness of the sample at and prevents a deeper analysis.
5 Discussion and conclusions
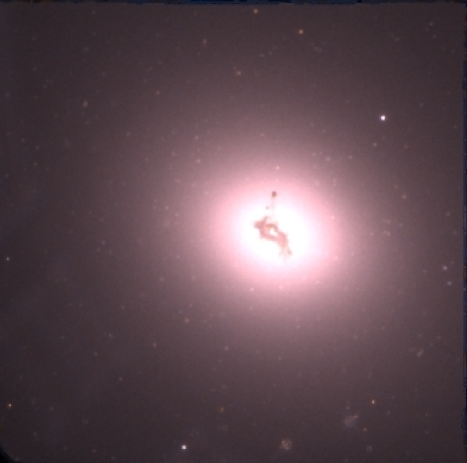
With two extensive spectroscopic surveys we confirmed that the core of the Hydra I galaxy cluster contains a large population of at least 50 UCDs, as it has been presumed on the basis of earlier photometric studies (Wehner & Harris 2007; Wehner et al. 2008). The presence of the very pronounced diffuse light component of NGC 3311 implies that environmental effects have been very important in shaping the central region of the Hydra I cluster, probably more than in the case of the Fornax, Virgo and Centaurus clusters. The dust structure in the center of NGC 3311 is a clear evidence for a recent interaction with a gas-rich galaxy (see e.g. Fig. 17 in the appendix and Grillmair et al. 1994). Together with the large number of UCDs, this strengthens the idea of an interaction driven UCD formation process in Hydra I, in which several UCDs are the remnant nuclei of dwarf galaxies whose stellar envelopes were stripped off during interaction with their host galaxy or galaxy cluster (Bekki et al. 2003).
This hypothesis is supported by the similar luminosities, colours and sizes of UCDs and nuclei of dwarf galaxies (e.g. Côté et al. 2006). Many of the confirmed Hydra I UCDs have much brighter magnitudes than UCD candidates previously identified in photometric studies (see Sect. 4.1.1). While the latter might rather represent the bright end of the globular cluster luminosity function (cf. Fig. 6), some of the brighter objects might be nuclei of stripped dwarf galaxies. At magnitudes brighter than mag (see Figs. 8 and 10), we find objects extending the red GC population towards higher luminosities, as well as objects with rather blue colours, which coincide with nuclei of dwarf galaxies in the colour-magnitude diagram.
Norris & Kannappan (2011) suggested a general scheme of GC/UCD formation and the connection to galaxy nuclei (see also Da Rocha et al. 2011; Chilingarian et al. 2011). In this picture, objects below mag are ”normal” GCs (red and blue) with a common mean size, plus a fraction of low-mass nuclei, indistinguishable from GCs. For magnitudes mag , a mass-size and a mass-metallicity relation (the ”blue tilt”) is observed (e.g. Haşegan et al. 2005; Mieske et al. 2010). UCDs (or giant globular clusters), extending the globular cluster luminosity function, as well as giant and dwarf nuclei populate this luminosity regime, the latter having on average bluer colours. In Hydra I, HUCD9, HUCD18 and HUCD35, all having rather blue colours, might be examples of such stripped dwarf galaxy nuclei. Even brighter (more massive) objects are expected to be exclusively stripped nuclei. HUCD1 is the only object in our sample that meets this criterion. For the case of Hydra I, wide-field photometry, deeper and more accurate than the VIMOS photometry, would be required to perform a robust investigation of the practicability of this classification scheme.
The above assumption of the brightest UCDs as descendants of nucleated dwarf galaxies is supported by the finding that the velocity dispersion of bright objects is smaller than that of fainter objects (see Sect. 4.2.2, Table 3 and Fig. 15). Assuming that several passages through the cluster center are necessary for nucleated dwarf galaxies to loose their stellar envelopes, they might end up on more circular orbits, leading to a lower velocity dispersion. This might explain the difference in velocity dispersion between bright UCDs, potentially being the remnant nuclei of dwarf galaxies, and fainter objects, belonging to the globular cluster system of the central galaxy.
An alternative explanation for the difference in velocity dispersion may be that the population of bright GCs/UCDs exhibits a steeper number density profile than the fainter population. This would be plausible in a scenario, where the brightest clusters formed in violent starbursts, which naturally occurred with higher probability near the center of the galaxy cluster than at large radii. The different velocity dispersions would then be a simple consequence of the Jeans-equation, like the different dispersions of blue and red GCs in NGC 1399 (Richtler et al. 2004; Schuberth et al. 2010). A change in the number density profile would not be visible in the distribution of our slits, which do not represent the true spatial distribution of the objects. A complete photometric sample over a larger radial range would be required for this kind of analysis. The study of Wehner et al. (2008) reaches out to only , and the authors do not comment on possible differences in the number density profiles of bright and faint objects.
Another, related view is that the dispersion of the fainter population is boosted by objects on highly elongated orbits with large clustercentric distances. In the NGC 1399 system, one finds objects with very high individual velocities, suggesting apogalactic distances as high as 400 kpc, which may dynamically be assigned to the entire cluster rather than to the central galaxy (Richtler et al. 2004; Schuberth et al. 2010). Also the Hydra I data show that the objects with the highest individual velocities ( km s-1) tend to be faint. However, more radial velocities would be necessary for a more detailed interpretation.
Acknowledgements.
The data published in this paper have been reduced using VIPGI, designed by the VIMOS Consortium and developed by INAF Milano. We thank Elizabeth Wehner for providing the list of photometrically identified candidate GCs/UCDs around NGC 3311. IM acknowledges support through DFG grant BE1091/13-1. TR acknowledges financial support from the Chilean Center for Astrophysics, FONDAP Nr. 15010003, from FONDECYT project Nr. 1100620, and from the BASAL Centro de Astrofisica y Tecnologias Afines (CATA) PFB-06/2007.References
- Bassino et al. (2006) Bassino, L. P., Faifer, F. R., Forte, J. C., et al. 2006, A&A, 451, 789
- Bassino et al. (1994) Bassino, L. P., Muzzio, J. C., & Rabolli, M. 1994, ApJ, 431, 634
- Baumgardt & Mieske (2008) Baumgardt, H. & Mieske, S. 2008, MNRAS, 391, 942
- Bekki et al. (2001) Bekki, K., Couch, W. J., & Drinkwater, M. J. 2001, ApJ, 552, L105
- Bekki et al. (2003) Bekki, K., Couch, W. J., Drinkwater, M. J., & Shioya, Y. 2003, MNRAS, 344, 399
- Bertin & Arnouts (1996) Bertin, E. & Arnouts, S. 1996, A&AS, 117, 393
- Binney & Merrifield (1998) Binney, J. & Merrifield, M. 1998, Galactic astronomy, ed. Binney, J. & Merrifield, M.
- Blakeslee & Barber DeGraaff (2008) Blakeslee, J. P. & Barber DeGraaff, R. 2008, AJ, 136, 2295
- Brodie et al. (2000) Brodie, J. P., Larsen, S. S., & Kissler-Patig, M. 2000, ApJ, 543, L19
- Brodie & Strader (2006) Brodie, J. P. & Strader, J. 2006, ARA&A, 44, 193
- Bruzual & Charlot (2003) Bruzual, G. & Charlot, S. 2003, MNRAS, 344, 1000
- Cardelli et al. (1989) Cardelli, J. A., Clayton, G. C., & Mathis, J. S. 1989, ApJ, 345, 245
- Chiboucas et al. (2010) Chiboucas, K., Tully, R. B., Marzke, R. O., et al. 2010, ArXiv e-prints
- Chilingarian & Mamon (2008) Chilingarian, I. V. & Mamon, G. A. 2008, MNRAS, 385, L83
- Chilingarian et al. (2011) Chilingarian, I. V., Mieske, S., Hilker, M., & Infante, L. 2011, MNRAS, 66
- Christlein & Zabludoff (2003) Christlein, D. & Zabludoff, A. I. 2003, ApJ, 591, 764
- Côté et al. (2006) Côté, P., Piatek, S., Ferrarese, L., et al. 2006, ApJS, 165, 57
- Da Rocha et al. (2011) Da Rocha, C., Mieske, S., Georgiev, I. Y., et al. 2011, A&A, 525, A86+
- Dabringhausen et al. (2008) Dabringhausen, J., Hilker, M., & Kroupa, P. 2008, MNRAS, 386, 864
- Dabringhausen et al. (2009) Dabringhausen, J., Kroupa, P., & Baumgardt, H. 2009, MNRAS, 394, 1529
- Dolphin (2009) Dolphin, A. E. 2009, PASP, 121, 655
- Drinkwater et al. (2004) Drinkwater, M. J., Gregg, M. D., Couch, W. J., et al. 2004, Publications of the Astronomical Society of Australia, 21, 375
- Drinkwater et al. (2003) Drinkwater, M. J., Gregg, M. D., Hilker, M., et al. 2003, Nature, 423, 519
- Drinkwater et al. (2000) Drinkwater, M. J., Jones, J. B., Gregg, M. D., & Phillipps, S. 2000, Publications of the Astronomical Society of Australia, 17, 227
- Evans et al. (2003) Evans, N. W., Wilkinson, M. I., Perrett, K. M., & Bridges, T. J. 2003, ApJ, 583, 752
- Evstigneeva et al. (2007a) Evstigneeva, E. A., Drinkwater, M. J., Jurek, R., et al. 2007a, MNRAS, 378, 1036
- Evstigneeva et al. (2008) Evstigneeva, E. A., Drinkwater, M. J., Peng, C. Y., et al. 2008, AJ, 136, 461
- Evstigneeva et al. (2007b) Evstigneeva, E. A., Gregg, M. D., Drinkwater, M. J., & Hilker, M. 2007b, AJ, 133, 1722
- Fellhauer & Kroupa (2002) Fellhauer, M. & Kroupa, P. 2002, MNRAS, 330, 642
- Fellhauer & Kroupa (2005) Fellhauer, M. & Kroupa, P. 2005, MNRAS, 359, 223
- Firth et al. (2007) Firth, P., Drinkwater, M. J., Evstigneeva, E. A., et al. 2007, MNRAS, 382, 1342
- Fukugita et al. (1995) Fukugita, M., Shimasaku, K., & Ichikawa, T. 1995, PASP, 107, 945
- Georgiev et al. (2008) Georgiev, I. Y., Goudfrooij, P., Puzia, T. H., & Hilker, M. 2008, AJ, 135, 1858
- Gieles et al. (2010) Gieles, M., Baumgardt, H., Heggie, D. C., & Lamers, H. J. G. L. M. 2010, MNRAS, 408, L16
- Girardi et al. (1995) Girardi, M., Biviano, A., Giuricin, G., Mardirossian, F., & Mezzetti, M. 1995, ApJ, 438, 527
- Goerdt et al. (2008) Goerdt, T., Moore, B., Kazantzidis, S., et al. 2008, MNRAS, 385, 2136
- Gregg et al. (2009) Gregg, M. D., Drinkwater, M. J., Evstigneeva, E., et al. 2009, AJ, 137, 498
- Grillmair et al. (1994) Grillmair, C. J., Faber, S. M., Lauer, T. R., et al. 1994, AJ, 108, 102
- Haşegan et al. (2005) Haşegan, M., Jordán, A., Côté, P., et al. 2005, ApJ, 627, 203
- Harris (1996) Harris, W. E. 1996, AJ, 112, 1487
- Harris (2009) Harris, W. E. 2009, ApJ, 699, 254
- Hau et al. (2009) Hau, G. K. T., Spitler, L. R., Forbes, D. A., et al. 2009, MNRAS, 394, L97
- Hilker (2009) Hilker, M. 2009, UCDs - A Mixed Bag of Objects, ed. Richtler, T. & Larsen, S., 51–+
- Hilker et al. (2007) Hilker, M., Baumgardt, H., Infante, L., et al. 2007, A&A, 463, 119
- Hilker et al. (1999) Hilker, M., Infante, L., Vieira, G., Kissler-Patig, M., & Richtler, T. 1999, A&AS, 134, 75
- Horne (1986) Horne, K. 1986, PASP, 98, 609
- Jones et al. (2006) Jones, J. B., Drinkwater, M. J., Jurek, R., et al. 2006, AJ, 131, 312
- Jordán et al. (2009) Jordán, A., Peng, E. W., Blakeslee, J. P., et al. 2009, ApJS, 180, 54
- King (1962) King, I. 1962, AJ, 67, 471
- Krist (1995) Krist, J. 1995, in Astronomical Society of the Pacific Conference Series, Vol. 77, Astronomical Data Analysis Software and Systems IV, ed. R. A. Shaw, H. E. Payne, & J. J. E. Hayes, 349–+
- Kroupa (1998) Kroupa, P. 1998, MNRAS, 300, 200
- Larsen (1999) Larsen, S. S. 1999, A&AS, 139, 393
- LeFevre et al. (2003) LeFevre, O., Saisse, M., Mancini, D., et al. 2003, in Society of Photo-Optical Instrumentation Engineers (SPIE) Conference Series, Vol. 4841, Society of Photo-Optical Instrumentation Engineers (SPIE) Conference Series, ed. M. Iye & A. F. M. Moorwood, 1670–1681
- Łokas et al. (2006) Łokas, E. L., Wojtak, R., Gottlöber, S., Mamon, G. A., & Prada, F. 2006, MNRAS, 367, 1463
- Madrid et al. (2010) Madrid, J. P., Graham, A. W., Harris, W. E., et al. 2010, ApJ, 722, 1707
- Maraston et al. (2004) Maraston, C., Bastian, N., Saglia, R. P., et al. 2004, A&A, 416, 467
- McLaughlin et al. (1995) McLaughlin, D. E., Secker, J., Harris, W. E., & Geisler, D. 1995, AJ, 109, 1033
- McLaughlin & van der Marel (2005) McLaughlin, D. E. & van der Marel, R. P. 2005, ApJS, 161, 304
- Mei et al. (2007) Mei, S., Blakeslee, J. P., Côté, P., et al. 2007, ApJ, 655, 144
- Mieske et al. (2002) Mieske, S., Hilker, M., & Infante, L. 2002, A&A, 383, 823
- Mieske et al. (2004) Mieske, S., Hilker, M., & Infante, L. 2004, A&A, 418, 445
- Mieske et al. (2005) Mieske, S., Hilker, M., & Infante, L. 2005, A&A, 438, 103
- Mieske et al. (2006) Mieske, S., Hilker, M., Infante, L., & Jordán, A. 2006, AJ, 131, 2442
- Mieske et al. (2007) Mieske, S., Hilker, M., Jordán, A., Infante, L., & Kissler-Patig, M. 2007, A&A, 472, 111
- Mieske et al. (2008) Mieske, S., Hilker, M., Jordán, A., et al. 2008, A&A, 487, 921
- Mieske et al. (2009) Mieske, S., Hilker, M., Misgeld, I., et al. 2009, A&A, 498, 705
- Mieske et al. (2010) Mieske, S., Jordán, A., Côté, P., et al. 2010, ApJ, 710, 1672
- Mieske & Kroupa (2008) Mieske, S. & Kroupa, P. 2008, ApJ, 677, 276
- Misgeld et al. (2008) Misgeld, I., Mieske, S., & Hilker, M. 2008, A&A, 486, 697
- Norris & Kannappan (2011) Norris, M. A. & Kannappan, S. J. 2011, ArXiv e-prints
- Peng et al. (2006) Peng, E. W., Côté, P., Jordán, A., et al. 2006, ApJ, 639, 838
- Phillipps et al. (2001) Phillipps, S., Drinkwater, M. J., Gregg, M. D., & Jones, J. B. 2001, ApJ, 560, 201
- Postman & Lauer (1995) Postman, M. & Lauer, T. R. 1995, ApJ, 440, 28
- Price et al. (2009) Price, J., Phillipps, S., Huxor, A., et al. 2009, MNRAS, 397, 1816
- Pryor & Meylan (1993) Pryor, C. & Meylan, G. 1993, in Astronomical Society of the Pacific Conference Series, Vol. 50, Structure and Dynamics of Globular Clusters, ed. S. G. Djorgovski & G. Meylan, 357–+
- Quintana et al. (1996) Quintana, H., Ramirez, A., & Way, M. J. 1996, AJ, 111, 603
- Rejkuba et al. (2007) Rejkuba, M., Dubath, P., Minniti, D., & Meylan, G. 2007, A&A, 469, 147
- Richtler et al. (2004) Richtler, T., Dirsch, B., Gebhardt, K., et al. 2004, AJ, 127, 2094
- Richtler et al. (2011) Richtler, T., Salinas, R., Misgeld, I., et al. 2011, ArXiv e-prints
- Schlegel et al. (1998) Schlegel, D. J., Finkbeiner, D. P., & Davis, M. 1998, ApJ, 500, 525
- Schuberth et al. (2008) Schuberth, Y., Richtler, T., Bassino, L., & Hilker, M. 2008, A&A, 477, L9
- Schuberth et al. (2010) Schuberth, Y., Richtler, T., Hilker, M., et al. 2010, A&A, 513, A52+
- Scodeggio et al. (2005) Scodeggio, M., Franzetti, P., Garilli, B., et al. 2005, PASP, 117, 1284
- Taylor et al. (2010) Taylor, M. A., Puzia, T. H., Harris, G. L., et al. 2010, ApJ, 712, 1191
- Tonry & Davis (1979) Tonry, J. & Davis, M. 1979, AJ, 84, 1511
- van de Ven et al. (2006) van de Ven, G., van den Bosch, R. C. E., Verolme, E. K., & de Zeeuw, P. T. 2006, A&A, 445, 513
- van den Bergh (1977) van den Bergh, S. 1977, ApJ, 212, 317
- Venables & Ripley (2002) Venables, W. N. & Ripley, B. D. 2002, Modern Applied Statistics with S, 4th edn. (New York: Springer)
- Ventimiglia et al. (2008) Ventimiglia, G., Arnaboldi, M., & Gerhard, O. 2008, Astronomische Nachrichten, 329, 1057
- Ventimiglia et al. (2011) Ventimiglia, G., Arnaboldi, M., & Gerhard, O. 2011, A&A, 528, A24+
- Wegner et al. (2003) Wegner, G., Bernardi, M., Willmer, C. N. A., et al. 2003, AJ, 126, 2268
- Wehner & Harris (2007) Wehner, E. M. H. & Harris, W. E. 2007, ApJ, 668, L35
- Wehner et al. (2008) Wehner, E. M. H., Harris, W. E., Whitmore, B. C., Rothberg, B., & Woodley, K. A. 2008, ApJ, 681, 1233
- Whitmore et al. (1999) Whitmore, B. C., Zhang, Q., Leitherer, C., et al. 1999, AJ, 118, 1551
Appendix A
| ID | (2000.0) | (2000.0) | ||||
|---|---|---|---|---|---|---|
| [h:m:s] | [∘::] | [arcmin] | [mag] | [mag] | [km s-1] | |
| HUCD1 | 10:36:42.5 | -27:32:52.9 | ||||
| HUCD2 | 10:36:19.4 | -27:26:05.9 | ||||
| HUCD3 | 10:36:41.9 | -27:19:44.8 | ||||
| HUCD4 | 10:36:34.8 | -27:34:45.8 | ||||
| HUCD5 | 10:36:34.4 | -27:30:15.3 | ||||
| HUCD6 | 10:36:43.9 | -27:37:57.3 | ||||
| HUCD7 | 10:36:42.1 | -27:24:03.5 | ||||
| HUCD8 | 10:36:43.8 | -27:32:22.2 | ||||
| HUCD9 | 10:35:36.7 | -27:17:40.2 | ||||
| HUCD10 | 10:36:31.8 | -27:29:13.8 | ||||
| HUCD11 | 10:36:32.4 | -27:29:22.1 | ||||
| HUCD12 | 10:36:45.5 | -27:29:52.2 | ||||
| HUCD13 | 10:36:01.9 | -27:23:01.3 | ||||
| HUCD14 | 10:36:31.4 | -27:30:25.7 | ||||
| HUCD15 | 10:36:49.3 | -27:36:01.9 | ||||
| HUCD16 | 10:36:41.1 | -27:31:18.0 | ||||
| HUCD17 | 10:36:06.0 | -27:36:33.3 | ||||
| HUCD18 | 10:36:43.5 | -27:31:49.4 | ||||
| HUCD19 | 10:36:32.0 | -27:30:12.7 | ||||
| HUCD20 | 10:36:14.0 | -27:27:56.4 | ||||
| HUCD21 | 10:36:47.4 | -27:31:06.6 | ||||
| HUCD22 | 10:36:58.0 | -27:35:58.9 | ||||
| HUCD23 | 10:37:43.1 | -27:36:00.9 | ||||
| HUCD24 | 10:36:56.8 | -27:33:30.7 | ||||
| HUCD25 | 10:36:44.8 | -27:34:15.6 | ||||
| HUCD26 | 10:36:35.0 | -27:32:59.9 | ||||
| HUCD27 | 10:36:35.0 | -27:29:44.4 | ||||
| HUCD28 | 10:36:52.9 | -27:24:33.1 | ||||
| HUCD29 | 10:36:48.2 | -27:22:18.5 | ||||
| HUCD30 | 10:36:50.0 | -27:31:54.9 | ||||
| HUCD31 | 10:36:05.6 | -27:27:04.0 | ||||
| HUCD32 | 10:36:57.3 | -27:26:01.1 | ||||
| HUCD33 | 10:36:43.4 | -27:25:20.9 | ||||
| HUCD34 | 10:36:48.5 | -27:34:43.4 | ||||
| HUCD35 | 10:36:31.7 | -27:30:32.0 | ||||
| HUCD36 | 10:37:01.2 | -27:27:19.5 | ||||
| HUCD37 | 10:36:35.6 | -27:35:11.0 | ||||
| HUCD38 | 10:36:07.2 | -27:32:51.4 | ||||
| HUCD39 | 10:36:45.1 | -27:31:51.1 | ||||
| HUCD40 | 10:36:39.4 | -27:30:53.6 | ||||
| HUCD41 | 10:36:37.8 | -27:34:44.2 | ||||
| HUCD42 | 10:36:36.3 | -27:32:16.3 | ||||
| HUCD43 | 10:36:48.4 | -27:35:03.1 | ||||
| HUCD44 | 10:36:48.1 | -27:32:23.3 | ||||
| HUCD45 | 10:36:50.2 | -27:36:10.3 | ||||
| HUCD46 | 10:36:33.2 | -27:30:54.8 | ||||
| HUCD47 | 10:36:50.7 | -27:32:01.0 | ||||
| HUCD48 | 10:36:40.6 | -27:26:27.3 | ||||
| HUCD49 | 10:36:46.3 | -27:34:18.6 | ||||
| HUCD50 | 10:36:28.1 | -27:31:06.7 | ||||
| HUCD51 | 10:35:45.7 | -27:33:38.4 | ||||
| HUCD52 | 10:35:52.9 | -27:35:32.3 | ||||
| 53 | 10:36:39.5 | -27:29:48.3 | ||||
| 54 | 10:36:44.5 | -27:30:44.7 | ||||
| 55 | 10:36:45.3 | -27:29:26.5 | ||||
| 56 | 10:36:40.9 | -27:25:09.0 | ||||
| 57 | 10:36:30.1 | -27:34:26.3 | ||||
| 58 | 10:36:46.4 | -27:29:32.1 | ||||
| 59 | 10:36:38.3 | -27:32:21.4 | ||||
| 60 | 10:36:50.0 | -27:38:27.5 | ||||
| 61 | 10:36:50.0 | -27:32:35.0 | ||||
| 62 | 10:36:43.8 | -27:33:13.0 | ||||
| 63 | 10:36:43.8 | -27:27:12.3 | ||||
| 64 | 10:36:38.0 | -27:30:16.6 | ||||
| 65 | 10:36:53.1 | -27:35:43.6 | ||||
| 66 | 10:36:39.1 | -27:31:20.1 | ||||
| 67 | 10:36:45.3 | -27:33:43.9 | ||||
| 68 | 10:36:39.5 | -27:31:28.1 | ||||
| 69 | 10:36:41.2 | -27:32:46.7 | ||||
| 70 | 10:36:44.9 | -27:33:36.4 | ||||
| 71 | 10:37:01.5 | -27:24:07.4 | ||||
| 72 | 10:36:47.0 | -27:35:18.1 | ||||
| 73 | 10:36:38.8 | -27:30:55.0 | ||||
| 74 | 10:36:26.8 | -27:32:23.5 | ||||
| 75 | 10:36:34.2 | -27:21:32.3 | ||||
| 76 | 10:36:45.8 | -27:33:43.9 | ||||
| 77 | 10:36:43.2 | -27:28:27.6 | ||||
| 78 | 10:35:53.0 | -27:23:06.7 | ||||
| 79 | 10:36:30.6 | -27:21:37.1 | ||||
| 80 | 10:36:43.0 | -27:34:09.3 | ||||
| 81 | 10:37:03.7 | -27:26:42.0 | ||||
| 82 | 10:36:42.9 | -27:27:59.1 | ||||
| 83 | 10:36:49.9 | -27:33:02.0 | ||||
| 84 | 10:36:40.5 | -27:35:12.2 | ||||
| 85 | 10:36:50.7 | -27:33:13.2 | ||||
| 86 | 10:36:31.5 | -27:33:21.0 | ||||
| 87 | 10:36:50.9 | -27:35:28.4 | ||||
| 88 | 10:36:46.0 | -27:35:10.0 | ||||
| 89 | 10:36:37.7 | -27:29:55.2 | ||||
| 90 | 10:36:32.3 | -27:31:34.7 | ||||
| 91 | 10:36:42.1 | -27:30:28.1 | ||||
| 92 | 10:36:40.9 | -27:30:42.7 | ||||
| 93 | 10:36:41.9 | -27:36:40.4 | ||||
| 94 | 10:36:30.0 | -27:31:01.9 | ||||
| 95 | 10:36:39.0 | -27:30:22.1 | ||||
| 96 | 10:36:45.5 | -27:23:49.7 | ||||
| 97 | 10:36:46.4 | -27:31:35.8 | ||||
| 98 | 10:36:58.2 | -27:25:30.2 | ||||
| 99 | 10:36:48.3 | -27:31:59.1 | ||||
| 100 | 10:36:50.9 | -27:33:38.4 | ||||
| 101 | 10:36:37.7 | -27:32:05.8 | ||||
| 102 | 10:36:50.3 | -27:29:06.7 | ||||
| 103 | 10:36:32.4 | -27:34:53.6 | ||||
| 104 | 10:36:32.6 | -27:26:30.0 | ||||
| 105 | 10:36:57.1 | -27:36:38.4 | ||||
| 106 | 10:36:41.9 | -27:34:52.6 | ||||
| 107 | 10:36:40.3 | -27:34:43.3 | ||||
| 108 | 10:36:51.5 | -27:35:14.6 | ||||
| 109 | 10:36:29.1 | -27:31:34.8 | ||||
| 110 | 10:36:44.7 | -27:32:55.5 | ||||
| 111 | 10:36:40.9 | -27:34:15.9 | ||||
| 112 | 10:36:41.2 | -27:32:49.4 | ||||
| 113 | 10:36:46.0 | -27:34:22.2 | ||||
| 114 | 10:36:31.9 | -27:30:37.1 | ||||
| 115 | 10:36:29.6 | -27:31:12.8 | ||||
| 116 | 10:36:47.5 | -27:32:58.9 | ||||
| 117 | 10:36:35.8 | -27:29:56.6 | ||||
| 118 | 10:36:45.3 | -27:33:19.8 |