Constraining the role of star cluster mergers in nuclear cluster formation: Simulations confront integral-field data
Abstract
We present observations and dynamical models of the stellar nuclear clusters (NCs) at the centres of NGC 4244 and M33. We then compare these to an extensive set of simulations testing the importance of purely stellar dynamical mergers on the formation and growth of NCs. Mergers of star clusters are able to produce a wide variety of observed properties, including densities, structural scaling relations, shapes (including the presence of young discs) and even rapid rotation. Nonetheless, difficulties remain, most notably that the second order kinematic moment of the models is too centrally peaked to match observations. This can be remedied by the merger of star clusters onto a pre-existing nuclear disc, but the line-of-sight velocity is still more slowly rising than in NGC 4244. Our results therefore suggest that purely stellar dynamical mergers cannot form NCs, and that gas dissipation is a necessary ingredient for at least of a NC’s mass. The negative vertical anisotropy found in NGC 4244 however requires at least of the mass to be accreted as stars, since gas dissipation and in situ star formation leads to positive vertical anisotropy.
keywords:
stellar dynamics — galaxies: evolution — galaxies: kinematics and dynamics — galaxies: structure1 Introduction
Studies of the centres of galaxies across the Hubble sequence have shown that they frequently host central massive objects (CMOs) such as supermassive black holes (SMBHs) and massive stellar nuclear clusters (NCs). NCs are very common: the ACS Virgo Cluster Survey found a NC in of low and intermediate luminosity early-type galaxies (Grant et al., 2005; Côté et al., 2006). A similar fraction, , of late-type spiral galaxies contain a NC (Böker et al., 2002). However NCs do not appear to populate the most massive early-type galaxies brighter than (Grant et al., 2005; Côté et al., 2006). Both Rossa et al. (2006) and Côté et al. (2006) found that the luminosity of the NC correlates with that of the host galaxy in elliptical and early-type spiral galaxies. Remarkably, both NCs and SMBHs follow the same correlation between their mass, , and that of their host galaxy, with NCs on the lower end and SMBHs on the upper end of the relation (Ferrarese et al., 2006b; Wehner & Harris, 2006). Likewise, both NC and SMBH masses follow an relation with the velocity dispersion of their host spheroid (Ferrarese et al., 2006b; Wehner & Harris, 2006), with the relation for NCs parallel to, but more massive at a given , that for SMBHs. These observational facts suggest that SMBHs and NCs share a similar growth history (McLaughlin et al., 2006). This motivates us to understand SMBH growth by using the formation of NCs as their visible proxies. An important advantage of NCs is that there are additional observables which can be measured for them, in addition to their mass. In particular one can characterise their kinematics and stellar population. This provides further constraints to their formation, which we try to exploit in this paper.
Two main scenarios have been proposed to explain the formation of NCs. One scenario relies on NCs forming in situ out of gas falling into the centre. A number of mechanisms have been proposed for driving gas to galactic centres, including the magneto-rotational instability (Milosavljević, 2004), gas cloud mergers (Bekki, 2007) or the action of instabilities (Shlosman & Begelman, 1989; Maciejewski et al., 2002; Schinnerer et al., 2003, 2008). Alternatively, NCs may form from the merging of star clusters (SCs) after sinking to the centre under the action of dynamical friction (Tremaine et al., 1975; Miocchi et al., 2006). Indeed Lotz et al. (2001) found a depletion of bright globular clusters within the inner region of dEs and similar colours for the globular cluster and NC population which, however, are bluer than the underlying stellar population of the host. Analysis of NC colours in dE galaxies by Lotz et al. (2004) and Côté et al. (2006) suggest that many, but not all dE nuclei could be explained by a cluster merger scenario. Self-consistent simulations have found that mergers can occur and the resulting NC masses and sizes are consistent with those observed (Bekki et al., 2004; Capuzzo-Dolcetta & Miocchi, 2008a, b).
NC formation in late-type galaxies is an ongoing process, with star formation histories that are extended, possibly constant (Rossa et al., 2006; Walcher et al., 2006; Seth et al., 2010), and stars younger than Myrs present. Mergers and accretion of old SCs is thus not a viable formation scenario, regardless of whether enough such SCs are available.
However, mergers and accretion of young SCs formed near the centres of galaxies, such as those observed in the Milky Way (Figer et al., 1999, 2002), NGC 2139 (Andersen et al., 2008), and NGC 253 (Kornei & McCrady, 2009), could still provide a viable formation mechanism. Agarwal & Milosavljević (2011) used analytic modelling to show that infalling SCs from an empirical SC population produce NCs of the right mass in isolated spheroidal and late-type galaxies. Such SCs must form quite close to the galaxy centres (1 kpc), otherwise the timescales for infall due to dynamical friction are prohibitively long (Milosavljević, 2004). In a sample of observed bulgeless spiral galaxies Neumayer et al. (2011) find that the dynamical friction timescales are Gyrs for SCs with masses within pc. The supply of young SCs to the inner regions may be enhanced because tidal forces are compressive within 10% of the effective radius when the density profile has a Sérsic index (Emsellem & van de Ven, 2008). However, a galaxy with a constant density dark matter core would inhibit infall altogether (Read et al., 2006; Goerdt et al., 2008, 2010).
The morphology and kinematics of NCs in disc galaxies provide additional constraints on their formation. From observations of edge-on galaxies, Seth et al. (2006) find that their NCs are typically elongated along the plane of the galaxy disc. These NCs are often compound structures, with a younger, bluer thin disc (NCD) embedded within an older spheroidal component (NCS). In the case of the NC in NGC 4244, spectra reveal young ( Myr) stars in the NCD amounting to of the total NC mass. Furthermore, integral-field spectroscopy of this NC shows rotation in the same sense as the galaxy (Seth et al., 2008b). As we show below, it is not yet possible to determine whether this rotation is restricted to the NCD.
Accretion without gas dissipation need not result in slowly rotating systems: Read et al. (2008) showed that satellite galaxies that accrete onto disc galaxies can get dragged down on to the plane of the disc and settle directly into a rapidly rotating thick disc with as large as 4. Likewise, Eliche-Moral et al. (2006) find that low density satellites can accrete onto bulges and end up rapidly rotating. Can NCDs form through an analogous process? Since SCs falling into the nucleus are likely to have formed in the mid-plane of the galaxy, they will generally share in its rotation.
In this Paper we explore in detail whether the SC merger/accretion scenario is able to produce the density and kinematic properties observed in NCs. In Section 2 we present the observations of the NCs in NGC 4244 and M33. In Section 3 we model integral field data of NGC 4244 and M33 using the Jeans Anisotropic MGE method of Cappellari (2008). In Section 4 we describe our simulations and methods. We present the results of NCs formed by mergers/accretions of SCs in Section 5. In Section 6 we introduce an initial NCD and follow its evolution as it accretes SCs. In Section 7 we apply the Jeans Anisotropic MGE modelling also to the simulations. We discuss the implications of our simulations and show that a purely collisionless merger origin of NCs is not consistent with the observations in Section 8.
2 Observational constraints
We compare our simulations with observations of the NCs in two nearby galaxies, M33 and NGC 4244. These two galaxies provide us with well-resolved nuclei for which integral field kinematic data are available. While M33 is inclined by (Corbelli & Schneider, 1997), NGC 4244 is an edge-on galaxy. These two objects thus give us two different perspectives for studying the morphology and kinematics of NCs in disc galaxies. In this paper we assume a distance of Mpc for NGC 4244 (Seth et al., 2005) and Mpc for M33 (Lauer et al., 1998).
2.1 Spectroscopy of NGC 4244 and M33
Seth et al. (2006) presented Hubble Space Telescope F814W photometry of the NC in NGC 4244, which is resolved into a nuclear cluster spheroid (NCS) and a bluer nuclear cluster disc (NCD). The half mass radius, , of the NC obtained by fitting a King profile to the ACS/F814W images (Seth et al., 2006) is about pc.
Here we use -band spectra of NGC 4244 (Seth et al., 2008b) and M33 (Seth et al, in prep) obtained at Gemini North with the Near-Infrared Integral Field spectrograph (NIFS), an image slicing field unit spectrograph. The PSF core in both observations is ″FWHM, with final data cubes sampled with 005 pixels. In NGC 4244, this corresponds to pc pixel-1, while in M33 the pixel scale is pc pixel-1. The imperfect adaptive optics corrections result in nearly half of the light being scattered PSF halo ( FWHM). This leads to problems separating the rotation in the NCS and NCD in NGC 4244 (see Section 3.2). In both clusters, the rotation amplitude increases with radius out to the effective radius, and decreases at larger radii. However, whether or not a NCD is present in the NC of M33 cannot be determined because of the galaxy’s inclination. In Figure 1 we show the line-of-sight velocity profiles of M33 and NGC 4244.

2.2 Isophotal shape of the NC in NGC 4244
The shape of an isophote can be quantified by the Fourier coefficients of the expansion
| (1) |
where is the mean intensity along the ellipse, is the azimuthal angle and , are harmonic amplitudes. The ellipse which best fits the isophote has the coefficients , equal to zero. The deviations from the best-fit isophote are then given by the higher order coefficients , . The leading residual term generally will be the term, which determines whether the isophote is discy or boxy . We use the task ellipse in IRAF to measure . The parameter has been shown to correlate with kinematic properties of the host galaxy in observations (Bender, 1988; Kormendy & Djorgovski, 1989; Kormendy & Bender, 1996) and in simulations of galaxy mergers (Naab et al., 1999; Naab & Burkert, 2003; Naab et al., 2006). This result was strongly confirmed with the large ATLAS3D sample of early-type galaxies (Cappellari et al., 2011) which demonstrated that a significant disciness is an unambiguous indication of a fast rotator galaxy (Emsellem et al., 2011). Figure 2 shows for the NC in NGC 4244, which is clearly discy.

2.3 Axisymmetry of the M33 nucleus
The face-on axial symmetry is an important constraint on the formation of any stellar system. In general the merger of stellar systems leads to triaxial systems, e.g. elliptical galaxies are found to be triaxial (Wagner et al., 1988; Naab et al., 1999; Naab & Burkert, 2003; Naab et al., 2006). Very little data are available for the face-on axial symmetry of NCs. For the NC in M33 we find evidence for axisymmtry. The inner ( pc) of the NC in M33 has an apparent , with an average PA (Lauer et al., 1998), which is close to the PA of the inner disc PA within kpc (Zaritsky et al., 1989). Thus we can assume that the NC is in the same plane as the inner disk and therefore it is possible to determine the NC’s apparent axis ratio . The galaxy is inclined by (Corbelli & Schneider, 1997), so that an oblate spheroid of apparent axis ratio at an inclination would have an intrinsic vertical-to-horizontal axis-ratio given by
| (2) |
(Hubble, 1926). The that Eqn. 2 implies for M33’s NC is fully consistent with the range of values of found in edge-on galaxies by Seth et al. (2006) (NGC 4244 having ). Moreover we measured the kinematical PA (1 error) from the NIFS integral-field kinematics, with the routine fit_kinematic_pa described in Appendix C of Krajnović et al. (2006). Thus the kinematical misalignment is consistent with zero, consistent with the NC of M33 being axisymmetric.
3 Modelling the Observations
We want to compare the kinematics of the observed NCs to those of the simulations. Given that integral-field kinematics are available for the observed NCs, we use two methods which make full use of the two-dimensional data. One method is based on the Jeans equations and the other is based on the diagram. In the following we show that consistent results are obtained with both approaches.
3.1 The Jeans Anisotropic MGE dynamical models
The integral-field stellar kinematics for the NCs in NGC 404 (Seth et al., 2010), NGC 4244 (Seth et al., 2006) and M33 (Seth et al, in prep), the few NCs for which this type of data are available, suggest that NCs are likely not far from oblate axisymmetric systems (as we also argued in Section 2.3). A classic reference model to quantify the rotation of axisymmetric galaxies is the isotropic rotator (Binney, 1978), to which real galaxies have often been compared (e.g. Satoh, 1980; Binney et al., 1990; van der Marel, 1991; van der Marel & van Dokkum, 2007; van der Wel & van der Marel, 2008).
Recent dynamical modelling studies have found that real axisymmetric galaxies are generally best matched by models which have a nearly oblate velocity ellipsoid, flattened along the direction of the symmetry axis (Cappellari et al., 2007; Cappellari, 2008; Thomas et al., 2009). A useful generalisation of the isotropic rotator to quantify the rotation of these anisotropic systems is then a rotator with oblate velocity ellipsoid (), which provides a good approximation for the observed integral-field kinematics of real galaxies (Cappellari, 2008; Scott et al., 2009).
To perform the measurement of the degree of rotation we used the Jeans Anisotropic MGE (JAM) software111Available from http://purl.org/cappellari/idl/ which implements an efficient solution of the Jeans equations with oblate velocity ellipsoid (Cappellari, 2008). Under that assumption the model gives a unique prediction for the observed first two velocity moments and , where is the observed mean stellar velocity and is the mean stellar velocity dispersion.
The luminous matter likely dominates in the high-density nuclei of the studied galaxies. The same is true by construction for the simulations. For this reason the dynamical models assume that light traces mass. To parametrise the surface brightness distribution of either the galaxies or the -body simulations we adopted a Multi-Gaussian Expansion (MGE; Emsellem et al., 1994), which we fit to the images with the method and software11footnotemark: 1 of Cappellari (2002). For a given inclination the models then have one free nonlinear parameter, the anisotropy , and two linear scaling factors: (i) the dynamical and (ii) the amount of rotation , which is the ratio between the observed projected angular momentum and the one for a model with oblate velocity ellipsoid (see Cappellari, 2008, for details). To find the best fitting model parameters we constructed a grid in the non-linear parameter and for each value we linearly scaled the to match the data in a sense. At the best-fitting we then computed the model velocity V, further assuming , and measure the amount of rotation from the observed velocity.
3.2 JAM models of observed NCs
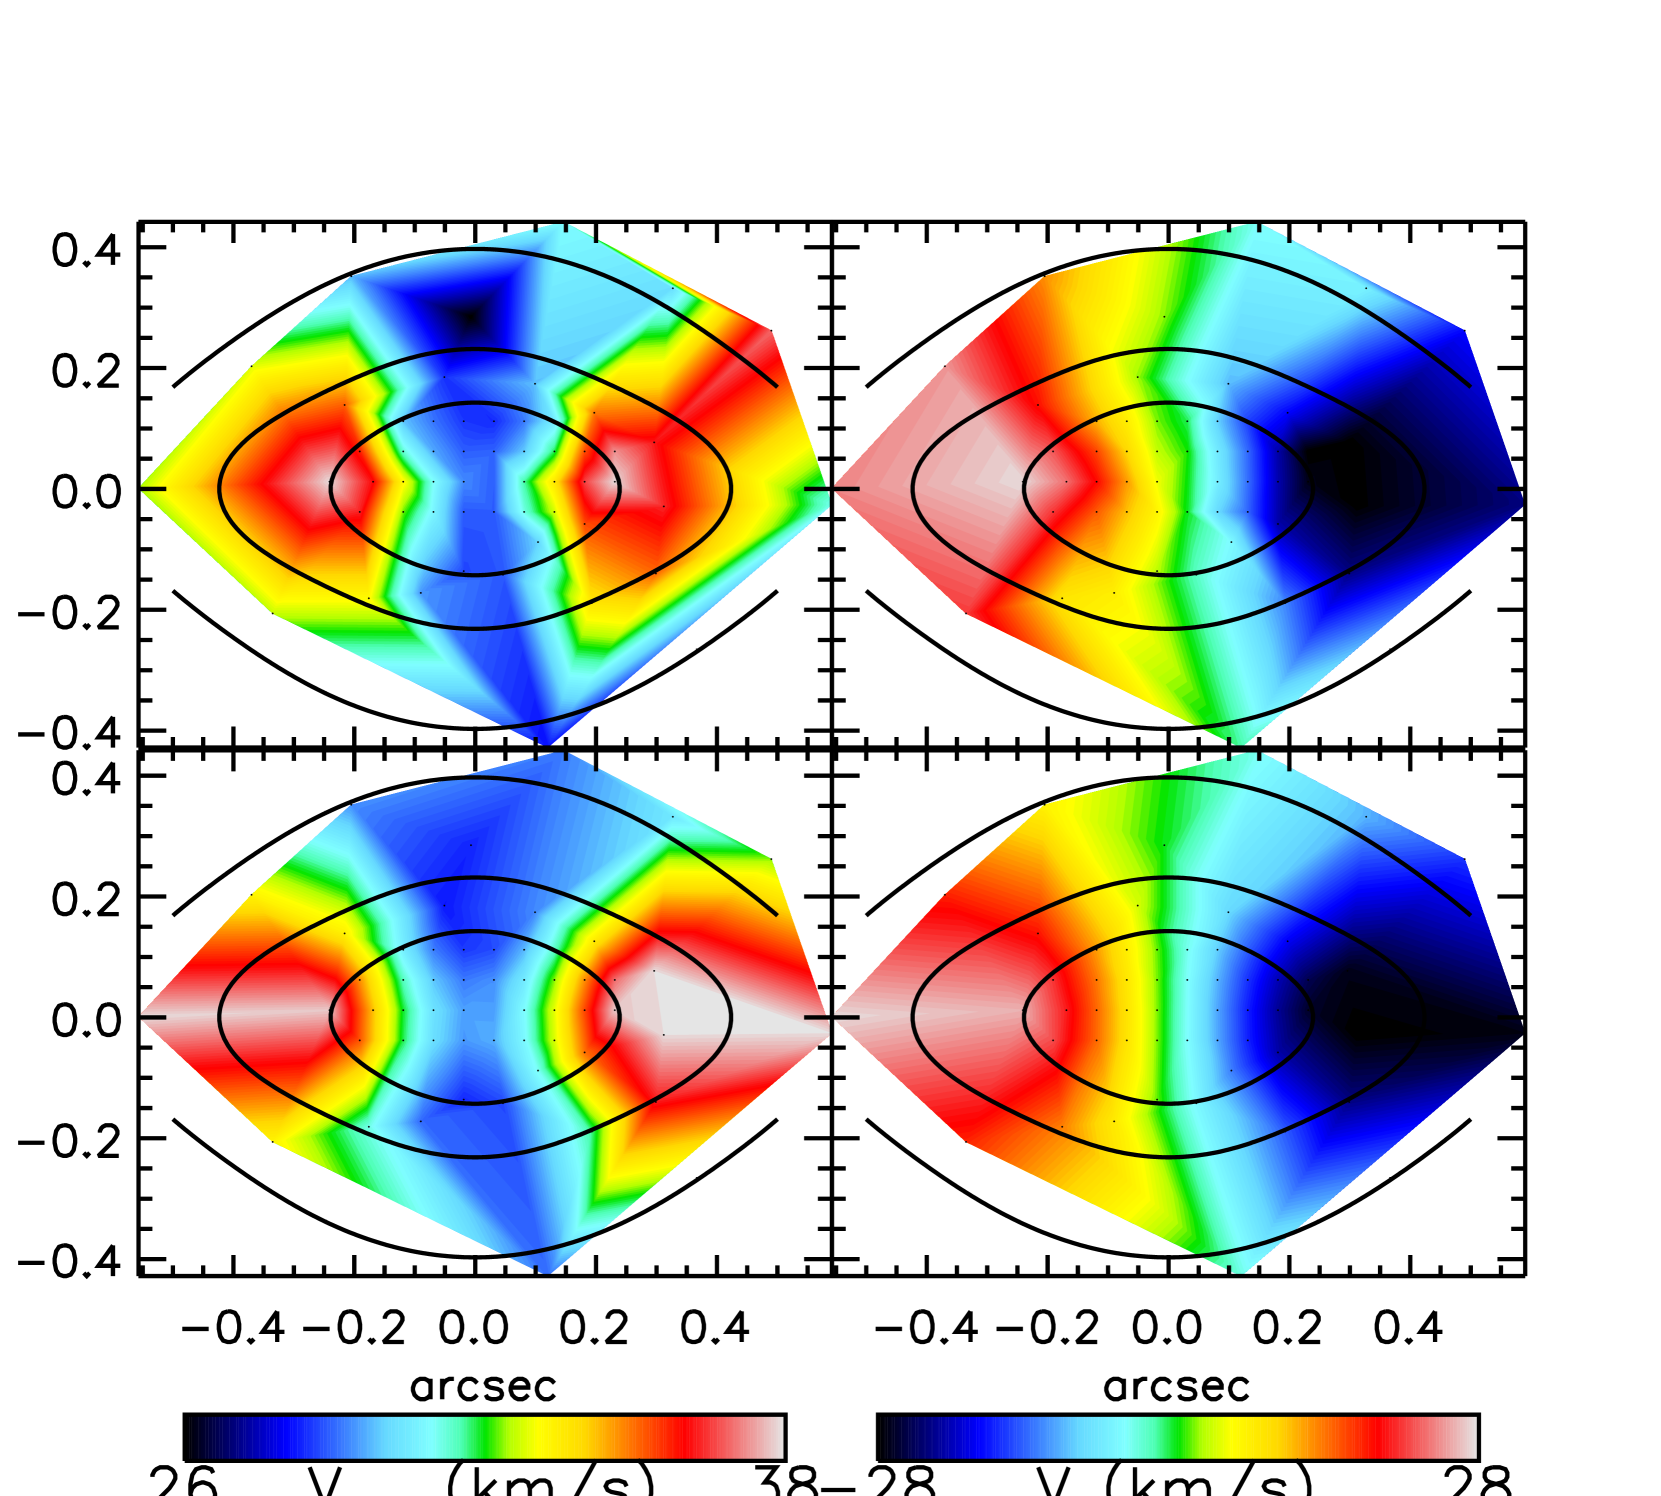
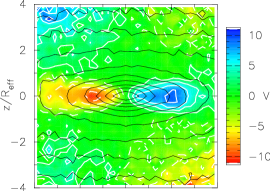
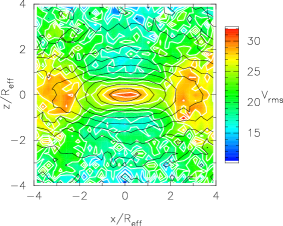
We applied the procedure to model the Gemini NIFS stellar kinematics of the NC in NGC 4244 (Seth et al., 2008b). The MGE fit to the nuclear part of the ACS/F814W image is shown in Figure 3. We used the ACS/F814W image for the MGE fit, because of the better known point spread function compared to the -band NIFS data. The NC was assumed to be a dynamically distinct component, in equilibrium in the combined potential due to the galaxy and the NC itself. We used all MGE Gaussians, of both the NC and the main galaxy disc, in the calculation of the gravitational potential, but only the nuclear Gaussians were used to parametrise the surface brightness of the NC. Thus our JAM models of NCs are not self-consistent. Although this assumption is physically motivated and can sometimes produce significant differences in the kinematics of the model, in this case the results are indistinguishable from a self-consistent model. The best-fitting JAM model for NGC 4244, which has an edge-on inclination (), is shown in Figure 4. It has a best-fitting anisotropy parameter and a rotation parameter . This implies that the NC rotates almost perfectly as the reference rotator with oblate velocity ellipsoid (for which ). The best-fitting JAM model has no central intermediate mass black hole (IMBH). However from our NIFS data we can place an upper limit of on the mass of a possible IMBH inside the NC. This is of the mass of the cluster, . For larger the model shows a clear central peak in which is strongly excluded by the data.
The NC of NGC 4244 is composed of a NCD and a NCS (Seth et al., 2006), which have distinct stellar populations (Seth et al., 2008b). While Seth et al. (2008b) argued that both the disc and spheroid are rotating due to the change of line strengths and optical colour, the models suggest that the rotation signal may come only from the disc. For this we fitted two MGE models separately for the spheroidal and disc component defined by Seth et al. (2006). We computed the best-fitting JAM model for the like before, but then we fit by setting the rotation to zero () for the MGE Gaussians describing the NCS. This model with an unrotating NCS reproduces the NIFS data as well as the model with constant anisotropy and rotation for both the NCS and the NCD. This is because the flat disc component of the NC dominates the light and the rotation of the model in the region where NIFS data are available. More spatially resolved/extended kinematics would be required to measure the rotation of the spheroidal component of the NC.

We constructed a similar MGE model for the NC of M33 using the WFPC2/F814W photometry. For the JAM model we adopted the inclination of the main galaxy disc (; Corbelli & Schneider 1997). In this case the observed distribution of stellar from the NIFS data is quite irregular and presents significant asymmetries, which cannot be reproduced by an axisymmetric model. The irregularity in the velocity field is possibly due to granularity in the velocity field, with individual bright AGB stars having significant influence on the velocity and dispersion measurements. The velocity field of M33 and other nearby NCs will be discussed in more detail in an upcoming paper (Seth et al. in prep). As the anisotropy cannot be reliably inferred from the data, we assumed isotropy and derived the dynamical from a fit to the observed . The rotation parameter derived from the observed V is then , which, as for NGC 4244, is consistent with the rotation of the reference rotator with oblate velocity ellipsoid. The total mass of the NC is .
3.3 Rotation from the diagram
‘
An alternative classic way of quantifying rotation is given by the diagram (Illingworth, 1977; Binney, 1978). Traditionally the observed quantity was computed from the central velocity dispersion and the maximum rotational velocity. Binney (2005) updated and improved the formalism to compute the quantity in a more robust way when integral-field data are available. Here the availability of integral-field kinematics for both the observations and the simulations allow us to apply this improved method. We use the updated formulae and define
| (3) |
which we applied within 2 as a luminosity-weighted quantity, which we estimate from the integral-field kinematics. Here is the flux contained inside the -th Voronoi bin and and the corresponding measured mean line-of-sight velocity and velocity dispersion. The ellipticity is defined following Cappellari et al. (2007) by a similar expression as
| (4) |
where the coordinates are centred on the galaxy nucleus and the axis is aligned with the NC photometric major axis. We estimate from the individual pixels, inside a given galaxy isophote, within the same region used for the computation of . The main disadvantage of the diagram, with respect to the JAM models, is that it does not rigorously take into account of multiple photometric systems, like a disc and a spheroid. Moreover, while the diagram can quantify the anisotropy, it does not provide any information on whether it is mostly radial or tangential. Still the diagram provides an important independent test of more detailed models and provides an easy way of comparing simulations and observations.
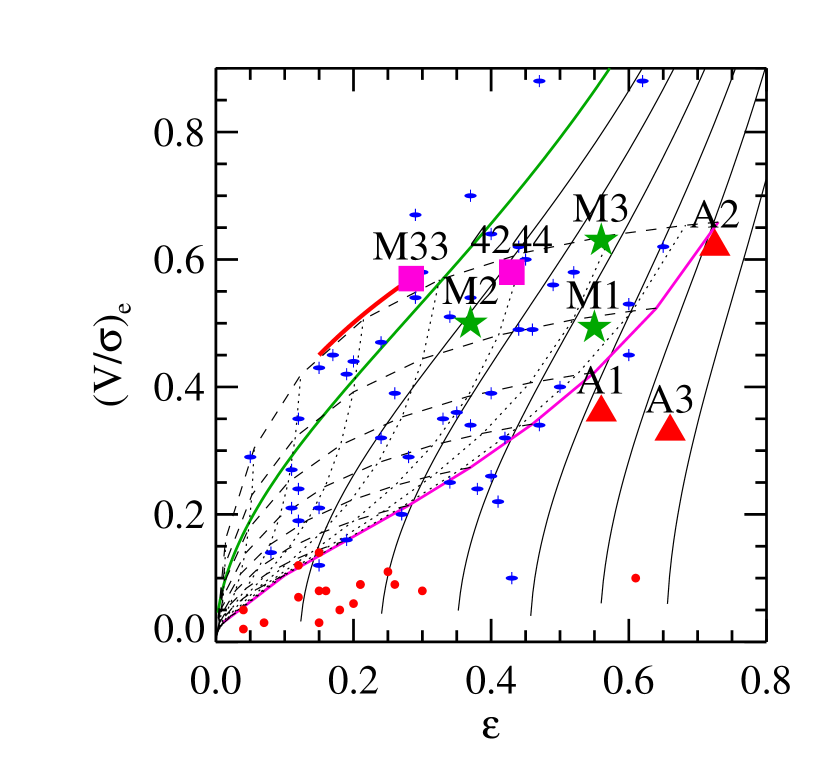
We used Eqns. 3 and 4 to place the NC of M33 and NGC 4244 on the diagram, using our NIFS data. Given that the diagram is defined for edge-on orientations, while M33 has an inclination of , we projected the values for the NC to an edge-on view following Binney & Tremaine (2008). The NC in NGC 4244 is seen at a nearly edge-on orientation and is weakly anisotropic. The location of M33 is slightly more uncertain, given the non edge-on view, but the NC is consistent with isotropy.
4 Numerical Methods
The half mass relaxation time for the NC in NGC 4244, with pc and total mass is Gyrs. NCs in the Virgo Cluster Survey have relaxation times ranging from Gyrs (Merritt, 2009). Therefore it is reasonable to approximate NCs as collisionless systems on timescales of Gyr, allowing us to use standard collisionless codes to simulate their evolution.
In this section we describe the -body initial conditions for the simulations. Because we are interested in evolution at the inner pc region of such galaxies, we neglect the dark matter halo.
4.1 Galactic disc model
NGC 4244 and M33 are late-type, bulgeless galaxies. We consider only the main galactic disc and adopt an exponential profile:
| (5) |
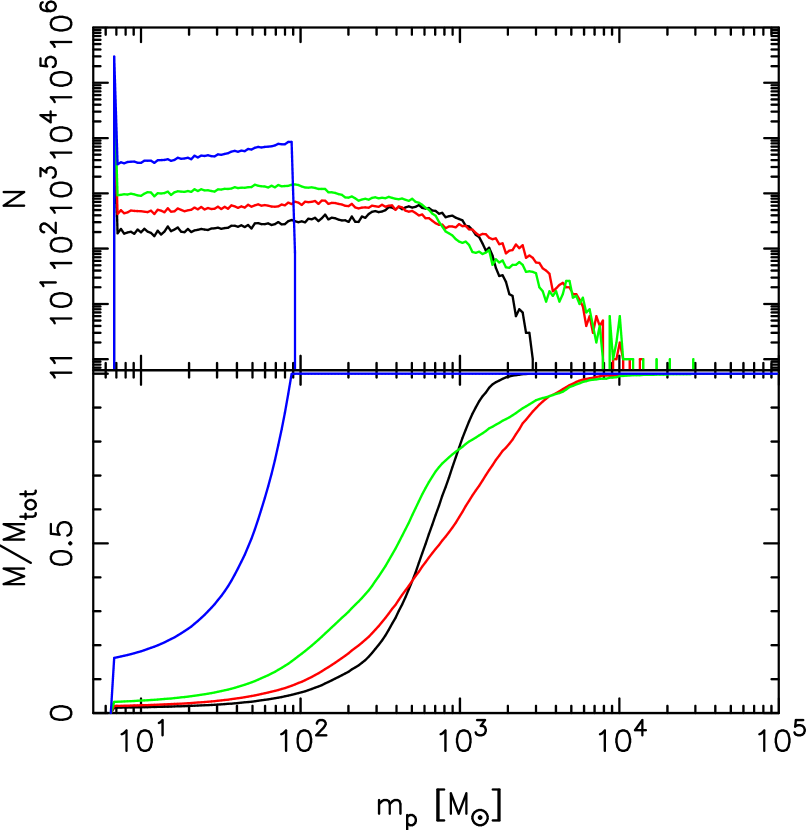
where is the disc mass, is the scale-length of the disc and the scale-height. We use , kpc, pc and truncate the disc at 5 . The disc is represented by particles. If we had used equal mass particles for the galactic disc, this would correspond to particle masses of 2500 . Such high masses would inhibit dynamical friction on objects of mass , and lead to excessive heating of any in-falling clusters. In order to reduce such effects, we use multi-mass disc particles, with masses ranging from 7 within the inner 20 pc increasing to in the disc’s outskirts. Figure 6 shows the distributions of masses and softenings of disc particles; the latter is related to particle mass via . We use the epicyclic approximation to set Toomre-. This setup is imperfect and needs to be relaxed; moreover simulations using such initial conditions can only be run for a few crossing times of the main disc, since the radial migration of stars induced by disc instabilities, including bars and spirals, would introduce massive particles to the central regions (Sellwood & Binney, 2002; Debattista et al., 2006; Roškar et al., 2008). In order to check that the system does not rapidly homogenise, we relaxed the system for 10 Myrs, after which main disc particles in the central pc have masses ranging from 7 to . In Figure 7 we plot the mass distribution for the disc particles within the inner 100 pc at three different times for the longest merger simulation (M2, described below). The cumulative distribution (bottom panel) shows that the mass at the centre is dominated by particles with masses smaller than 2500 , with more than half the mass in this region coming from particles with masses less than 1000 .


4.2 Bulge model
On timescales comparable to the crossing time of the galaxy, dynamical instabilities, such as bars and spirals, move particles to the central regions. Multi-mass particle simulations within discs therefore are no longer possible in these cases. We therefore set up a bulge, again neglecting the dark matter halo, and evolve the systems in this environment. The bulge model has a Hernquist (1990) profile:
| (6) |
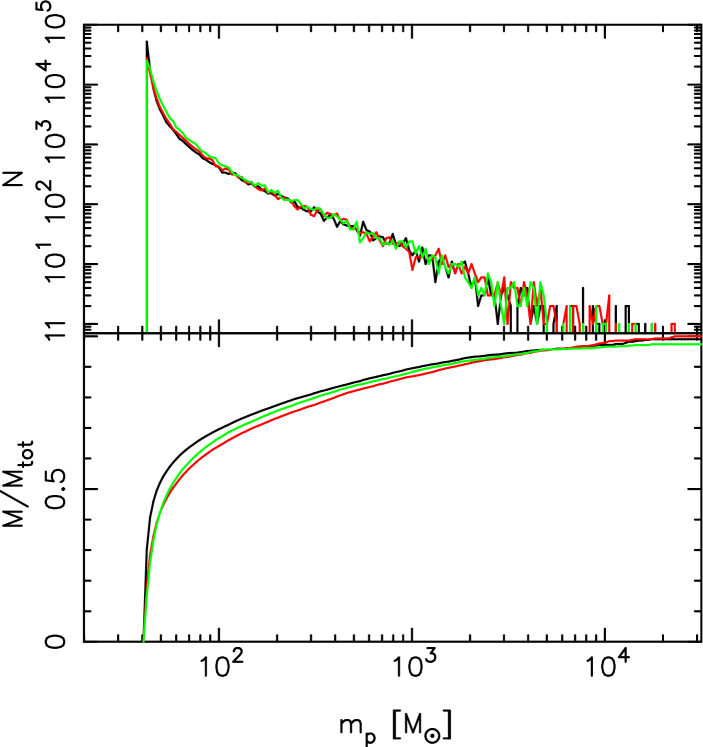
where is the bulge mass and is the scale radius. We use and kpc. The bulge is truncated by eliminating all particles with enough energy to reach , therefore the density drops gently to zero at this radius (Sellwood & Debattista, 2009). The bulge is populated by particles with masses ranging from to ; particle masses are selected by the weighting function , with the specific angular momentum, ensuring a high resolution within the inner 160 pc (Sellwood, 2008). The softening is related to the particle mass via . Unlike the disc, the bulge has no strong instabilities, therefore the distribution of particles remains unchanged even on timescales of a few Gyrs. We need these timescales to model multiple accretions of SCs. Figure 8 shows the particles distribution for simulation A1, described below, within 32 pc for three different times. This simulation shows the largest changes in the mass distribution. Although accretion delivers higher mass particles into the central region, the distribution of particles does not change substantially.
4.3 Star cluster models
We set up model SCs, ranging in mass from to , using an isotropic distribution function (DF): . The specific form we choose is a lowered polytrope DF
| (7) |
with polytrope index in all cases. We produce equilibrium models through the iterative procedure described in Debattista & Sellwood (2000). We set up five such models, C1-C5. All SC models have particles of equal mass ( for C1-C2, for C3-C4 and for C5) and equal softening ( pc for C1 and C2 and pc for C3-C5). IMBHs may be present in some SCs (Gebhardt et al. 2000, 2005; Gerssen et al. 2002, 2003; Noyola et al. 2008, 2010, but see also van der Marel & Anderson 2010). In model C2 we include an IMBH at the centre of the cluster C1 by adiabatically growing the mass of a single particle with softening pc over Myrs. Table LABEL:tab:scs lists the properties of the SC models. The concentration is defined as where is the half mass radius (effective radius) and is the core radius, where the surface density drops to half of the central. Figure 9 plots the volume density profiles of the SCs. The central density ranges from to pc-3; the masses and (see Tab. LABEL:tab:scs) are comparable to young massive star clusters in the Milky Way (Figer et al., 1999, 2002), in the LMC (Mackey & Gilmore, 2003), in the Fornax Cluster (McLaughlin & van der Marel, 2005), in irregular galaxies (Larsen et al., 2004) and in interacting galaxies (Bastian et al., 2006).
| Model | c | |||
|---|---|---|---|---|
| [] | [pc] | [] | ||
| C1 | 1.72 | 0.07 | - | |
| C2 | 1.60 | 0.07 | ||
| C3 | 2.18 | 0.12 | - | |
| C4 | 1.11 | 0.12 | - | |
| C5 | 1.11 | 0.16 | - |

4.4 Bare NCD model
If direct formation of a NCD via gas inflows precedes the full formation of a NC, how does the accretion of SCs alter the properties of a NCD? In order to explore this, we generated a bare NCD model by adiabatically growing, over a period of Gyr, a disc at the centre of the bulge model. The NCD is exponential of the type in Eqn. 5, with a scale-length pc and scale-height . The disc, truncated at a radius of , consists of particles each with softening pc . The final total mass of the NCD is . We set the kinematics of the grown disc to give constant and Toomre-, as described in Debattista & Sellwood (2000). For this we calculated the potential using a hybrid polar-grid code (Sellwood, 2003).
4.5 Numerical parameters
All the simulations in this paper were evolved with pkdgrav (Stadel, 2001), an efficient, parallel tree-code. We used an opening angle in all simulations. pkdgrav is a multi-stepping code, with timesteps refined such that , where is the softening and is the acceleration at a particle’s current position. We set in all cases. Simulations A1-A3 used base timestep years, whereas all other simulations used half this value years.
5 Results of the Merger Simulations
We ran three simulations in which eight massive star clusters were allowed to merge at the centre of the disc to form a NC. We use SC models C1 and C2 in these simulations because these SCs are sufficiently massive and concentrated to not evaporate too rapidly (McLaughlin & Fall, 2008) and to have orbit decay times due to dynamical friction less than 3 Gyr from a radius of 1 kpc (Milosavljević, 2004). The SCs were placed at radii ranging from to pc with velocities between and , which are of the local circular velocity. In run M1 the SCs are all initially in the mid-plane; in run M2 instead the SCs are vertically offset from the mid-plane by up to pc, with tangential velocities similar to M1 and vertical velocities up to . Finally, run M3 is identical to run M1, but uses SC C2 instead of C1. Details of these simulations are listed in Table LABEL:tab:mergsims.
SCs merge after Myr, with the longest time needed in M2. One SC failed to merge in run M1 and was excluded from all analysis.
| Run | N(SC) | SC | host | Comments |
|---|---|---|---|---|
| M1 | 8 | C1 | disc | SCs at mid-plane of main disc |
| M2 | 8 | C1 | disc | 6 SCs offset from main disc mid-plane |
| M3 | 8 | C2 | disc | SCs at mid-plane of main disc |
| A1 | 10 | C5 | bulge | multiple accretion of SCs onto NCS |
| A2 | 20 | C4 | bulge | accretion of SCs onto a NCD |
| A3 | 20 | C4 | bulge | like A2 with retrograde orbits |
5.1 Structural properties
We measured mass surface density profiles of the remnant NCs viewed face-on and obtained by fitting Sérsic or King profiles. The King profile clearly fits the profiles better and we present results only of this fit throughout. The King profile is given by (King, 1962)
| (8) |
with normalisation constant , and , where is the core radius and is the tidal radius at which the projected density drops to zero. Integration yields the cumulative form of the King profile for :
| (9) |
which is the mass in projection within a cylinder of radius R. can be approximated by
| (10) |
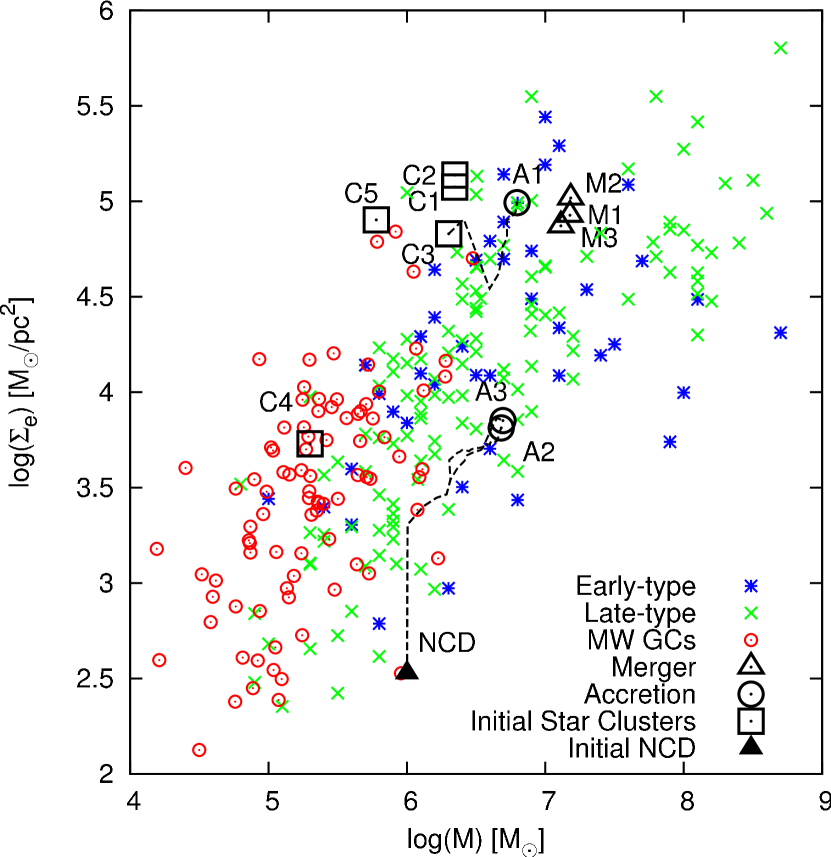
The merger remnants have in the range pc with mass fractions from of the total merged SC mass. These masses are consistent with those of observed NCs (Côté et al., 2006; Geha et al., 2002; Böker et al., 2004; Walcher et al., 2006; Seth et al., 2006). Figure 10 plots the mean surface density within versus the total mass of the merger remnants and compares them to NCs in early-type galaxies (Côté et al., 2006), late-type spiral galaxies (Carollo et al., 1997, 1998, 2002; Böker et al., 2002; Seth et al., 2006) and Milky Way GCs (Walcher et al., 2005). As shown by Capuzzo-Dolcetta & Miocchi (2008b), we find that SC mergers produce remnants which have structural properties in good agreement with observed NCs.
As was shown already by Bekki et al. (2004), the merger remnants can be triaxial. We measured the ellipticities viewed face-on and edge-on of the simulated NCs using Eqn. 4, obtaining the isophote at using the task ellipse in IRAF. The NC in M1 is significantly non-axisymmetric, with face-on mean ellipticity . We also measured the 3-D shape using the moment-of-inertia tensor as described in Debattista et al. (2008). Figure 11 plots the density axes ratios and triaxiality, (Franx et al., 1991), of the remnant NCs. In run M1 the NC is triaxial within 2 . Models M2 and M3 explore two ways of producing more axisymmetric NCs. In M2 we start the SCs off the mid-plane. This makes the NC oblate, with . In run M3 instead we add IMBHs to the SCs which again results in an oblate NC, also with .
We find remnant edge-on ellipticities at 3 in the range of . These values are consistent with the range of observed ellipticities (Seth et al., 2006).

Figure 12 shows for the edge-on view. In the triaxial NC of M1, varies with viewing angle but is always negative, i.e. the NC is boxy. The NCs in M2 and M3 are also boxy. The merger of SCs cannot produce isophotes as discy as observed in the NC of NGC 4244.

5.2 Remnant kinematics
Bekki et al. (2004) found that his merger remnants were rotating, while Capuzzo-Dolcetta & Miocchi (2008a) found that merger remnants are kinematically distinct from the main disc/bulge.
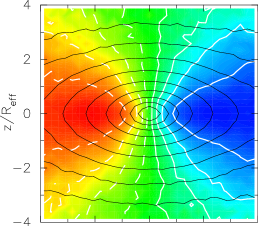
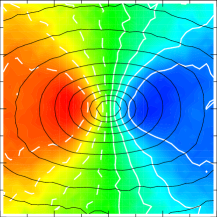
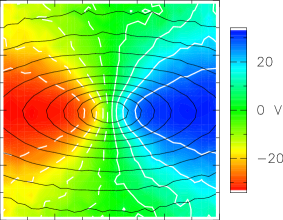
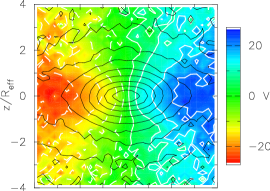
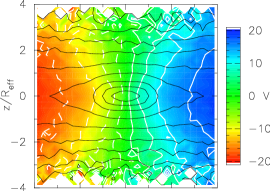
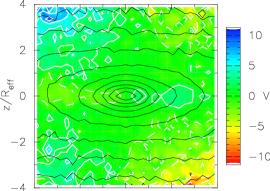
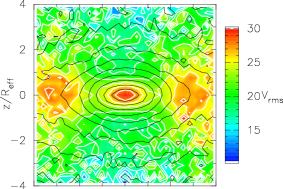
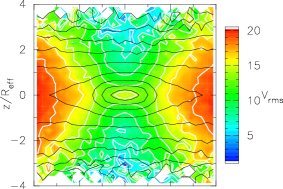
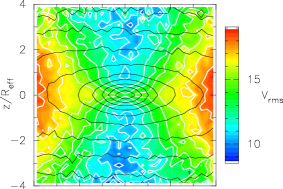
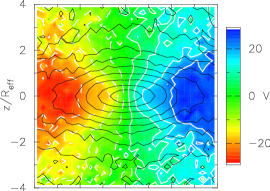
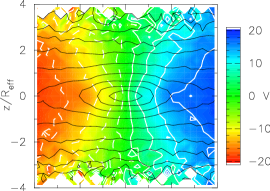
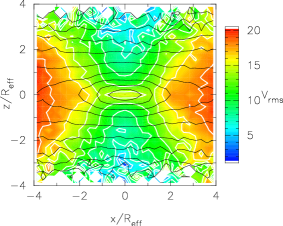
Figure 13 shows the edge-on line-of-sight kinematics of the remnant NCs. They are all clearly strongly rotating. However the second moment of the velocity, , shows that the merger remnants are so dominated by dispersion at the centre that is centrally peaked, contrary to what is seen in the NC of NGC 4244 (Figure 4). In the bottom row we show the rotation curve , the line-of-sight velocity , the line-of-sight velocity dispersion and the root-mean-square velocity of the merger remnants. Velocities in M1-M3 peak at larger radii than those observed in NGC 4244 and M33 (see Figure 1).
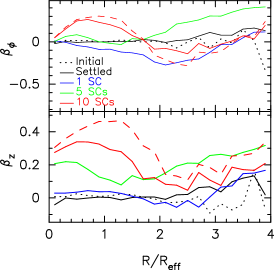
In Figure 14 the anisotropies (top panel) and (bottom panel) show that the remnant NCs are all radially biased within . M2 is less radially biased than M3, which may seem surprising at first, but the radius of the sphere of influence of the IMBH in M3 is less than 1 pc, explaining the absence of a tangential bias at . The vertical pressure support is generally smallest. The initial vertical energy of the SCs in run M2 imparts larger vertical random motions, leading to the smallest and smallest edge-on ellipticity . Radial anisotropy has been noted in the past as a signature of the merging process (e.g. Burkert & Naab, 2005; Bournaud et al., 2007; Debattista et al., 2008; Thomas et al., 2009). The presence of plausible IMBHs does not alter this result.
 |
 |
 |
 |
 |
 |
 |
 |
 |

5.3 Accretion onto Super Star Clusters
The super star cluster (SSC) found by Kornei & McCrady (2009) in the nuclear region of NGC 253 seems destined to fall into the centre of the galaxy and form the basis of a NC. How would the accretion of further SCs alter the structure and kinematics of such a seed NC? Observed Milky Way globular clusters are found to be nearly isotropic (Gebhardt, 1994; Gebhardt et al., 1995). How much mass needs to be accreted to appreciably alter the isotropic distribution? In run A1 we study the accretion of SCs onto a NCS by introducing a spherical isotropic SC inside the bulge model. We form the NCS by letting a massive star cluster fall to the centre. We used SC C3 and started it at pc on a circular orbit allowing it to settle at the centre over 65 Myrs, before we start the accretion of 10 SCs. We use model C5 for the accreted SCs, starting them on circular orbits at a distance of pc from the centre. In total the mass accreted corresponds to the NCS’s initial mass. Each accretion is allowed to finish before a new SC is inserted. A single accretion on average requires Myrs. Table LABEL:tab:mergsims gives further details of this simulation.
After each accreted SC we measure by fitting a King profile (Eqn. 8) to the mass surface density profile of the NC. The final remnant has pc and structural properties consistent with observed NCs, as shown in Figure 10, which tracks the evolving NC. The NC becomes triaxial after it has doubled in mass. The final and ; the latter is in the observed range (Seth et al., 2006). The final triaxiality . Figure 15 shows that the remnant NC in A1 is discy ().

Multiple accretion of young SCs allows us to also explore the effect of a different ratio for a young accreted SC. For the NC in NGC 4244 the structural properties are obtained from -band observations (Seth et al., 2006) and the kinematics from -band data (Seth et al., 2008b). Therefore we obtain both the in the -band and -band for the NCD assuming a single stellar population with an age about 70 Myrs and a metallicity of and for the NCS assuming two stellar populations, the first with an age of 1 Gyr with the same metallicity and the second of 10 Gyrs and a metallicity of in NGC 4244. Using the stellar evolution code of Maraston (1998, 2005) this gives for the NCD and for the NCS in the -band and for the NCD and for the NCS in the -band. Throughout the rest of this paper, we adopt the values in the -band for the analysis of structural properties and values in the -band for the kinematics, assuming that stars from the last accreted SC are young while the rest of the stars are old, to obtain a luminosity-weighting.
Adopting these values, the final edge-on ellipticity becomes .
We produce a luminosity-weighted density map of the final NC and fit two components, an elliptical King and an exponential disc profile, as in Seth et al. (2006), to measure the structural properties of the NCS and NCD component. The NCS has pc and a flattening while the NCD has pc and scale length pc. The NCD constitutes of the NC luminosity which is a factor of smaller than in NGC 4244. The NCD is thicker than in NGC 4244.
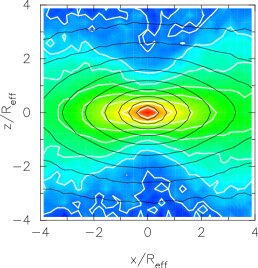
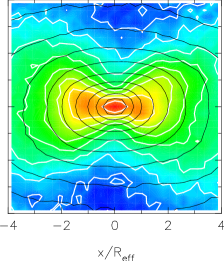
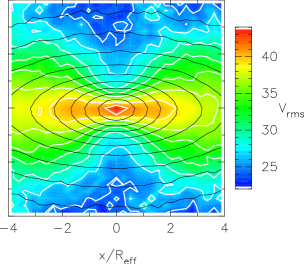
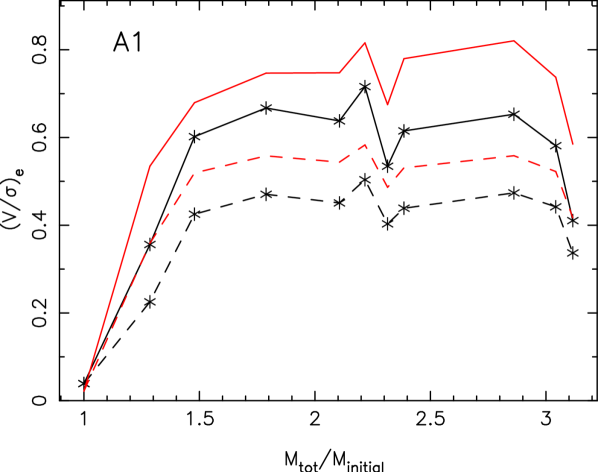
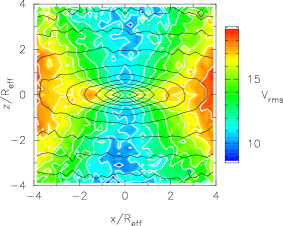
The initial SSC is isotropic and has no rotation and remains unrotating after falling to the centre. Figure 16 shows the evolution of ; after the first accretion the merger remnant’s rotation has already increased to . By the end of the simulation the mass-weighted ( luminosity-weighted). The velocity field of the remnant; seen in Figure 17, shows that the NC is rotating. However is still dominated by the velocity dispersion at the centre even when luminosity weighting. The line-of-sight velocity peaks at larger radii than observed in NGC 4244 and M33.
 |
 |
 |
 |
 |
 |
 |
 |
 |
 |
 |
 |
 |
 |
 |
The settling of the SC to the centre does not change its dispersion within , since the bulge mass within changes only about . The evolution of and is shown in Figure 18. The first accretion drives to negative values which slowly increases as more mass is accreted. The final peaks within and declines further out.
 |
 |
 |
6 Accretion onto bare NCDs
Here we consider the case of a bare NCD, without an initial NCS, accreting multiple young SCs. The initial NCD component has a mass of . We use model C4 to represent the infalling SCs, placing them at 63pc from the centre of the NC, since the NCD is barely affected by the SC until it is well within this radius. In run A2 all SCs are on prograde circular orbits, whereas in A3 half of the SCs have retrograde orbits. In total the NCD accretes SCs, corresponding to its own mass. All SCs orbit in the plane of the NCD without any vertical motions. Each accretion event requires Myrs to complete; we allow each accretion to finish before introducing the next SC. In total these simulations require Gyrs. Table LABEL:tab:mergsims gives further details of these simulations.
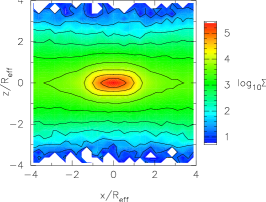
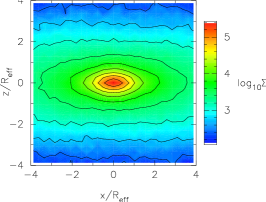
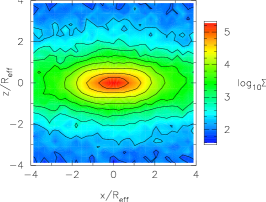
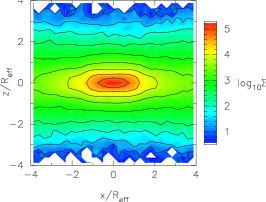
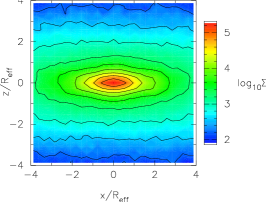
The remnants both have pc and structural properties consistent with observed NCs as shown in Figure 10, which tracks the evolving NC. The surface density increases after each accretion event, evolving along the track of observed NCs. When we continue to grow the NC in A2 by accreting a further 10 SCs, the NC becomes denser than the infalling SC. Figure 19 shows the surface density profiles seen edge-on. The top panels show mass-weighted maps of the surface density. In the middle row of Figure 19 we present luminosity-weighted surface density maps, which are more discy than the mass-weighted ones. In the bottom panel of Figure 19 we show the surface density profiles.
 |
 |
 |
 |
 |
 |
 |
 |
 |
Like the merger remnants, the accretion remnants can be triaxial. The NC in run A2 is triaxial with a final and a , whereas run A3 is rounder with and . The final edge-on ellipticity at 3 is for run A2 and for run A3 and a luminosity-weighted ellipticity in A2 and in A3, which is in agreement with observed NCs. Accretion leads to the formation of NCs with discy isophotes at large radii as can be seen in Figure 15. As in NGC 4244, they show an increase in towards the centre and a decline further out.
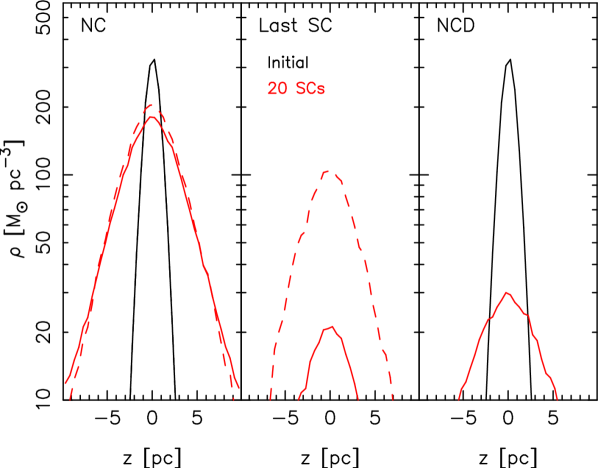
The vertical density profile of the NC in run A2 at is shown in Figure 20. The NCD is vertically heated by the accretion of SCs. The last accreted SC is distributed in a thinner component than the initial NCD. We again fit the luminosity-weighted density map with an elliptical King and an exponential disc profile as in Seth et al. (2006). This gives a NCS with pc and a flattening of and a NCD with pc and a scale-length pc. The NCD accounts for of the NC mass, which is smaller than in NGC 4244. The scale-height and scale-length of the NCD in run A2 is about the same of that observed in NGC 4244. Thus, structurally, the NC is comparable to that in NGC 4244, provided that the accreted SC is young.
The initial NCD is strongly rotating. Accretion reduces the rotation of the remaining NC. Figure 21 shows the evolution of . The first accretion leads to a large decrease in . In run A2 the subsequent accretions induce smaller changes, quickly asymptoting to ( luminosity-weighted). increases with radius regardless of which weighting is used. Run A3 instead drops to although a luminosity-weighting gives the appearance of more rotation, , comparable to that in run A2.
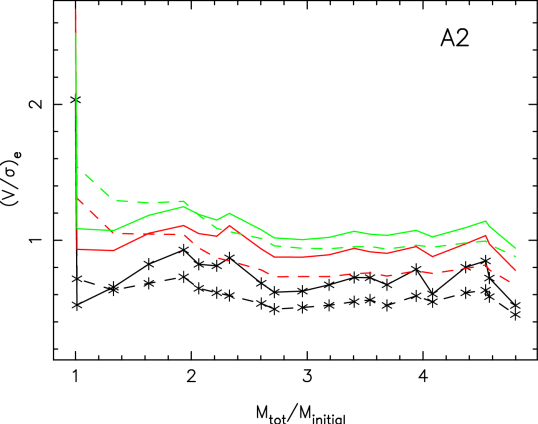
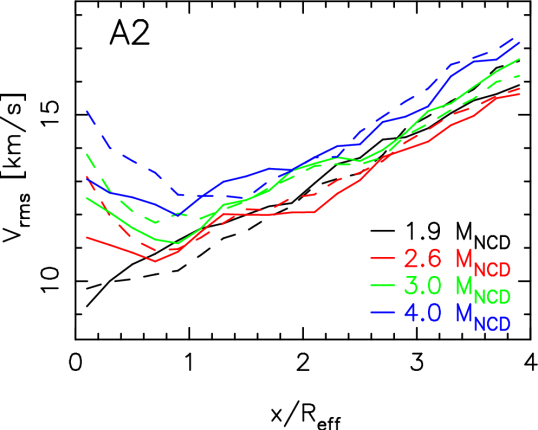
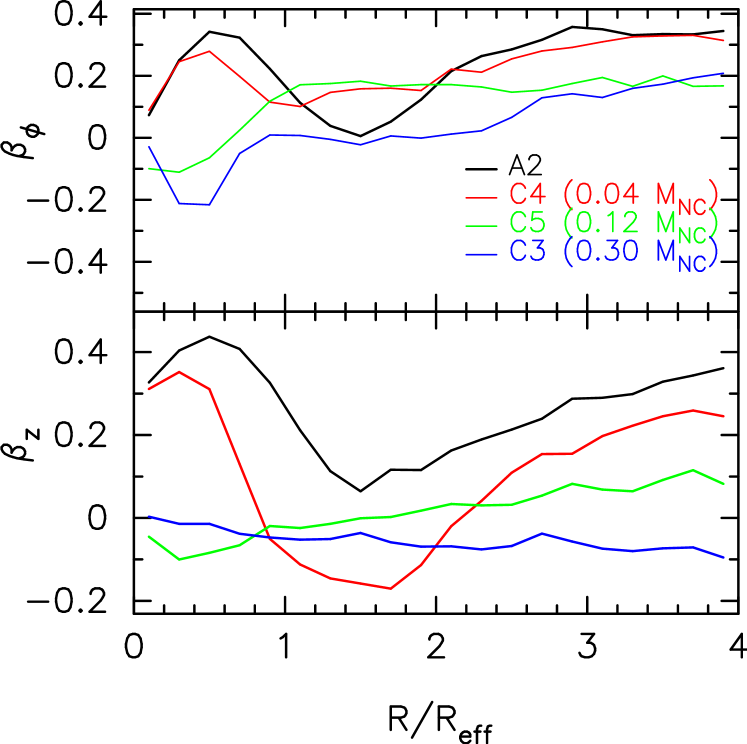
Figure 17 plots the first two moments of the line-of-sight kinematics. The remnant NC in A2 is significantly rotating while that in A3 shows rotation only when luminosity-weighted. The shown in the bottom panel of Figure 17 peaks at larger radii compared to those in NGC 4244 and M33. Unlike in runs M1-M3 and A1, the NC remnant in run A2 and A3 has that increases with radius, like the NC of NGC 4244. However the profiles in Fig. 17 shows that in run A2 increases within . In Fig. 22 we show that develops a central peak within after the initial NCD has doubled its mass. Thus NGC 4244 cannot have accreted more than half of its mass as stars.
6.1 The vertical anisotropy
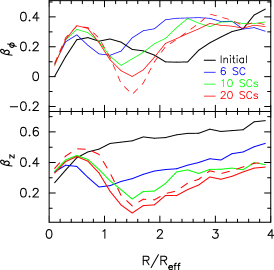
As usual for rapidly rotating discs, the initial NCD is radially biased, with initially large but this decreases with accretion, although it remains positive. Unlike with the kinematic measurements, no important differences in and occur if we weight by luminosity as shown in Figure 21. Regardless of whether mass or luminosity weighting is applied, peaks within and declines beyond.
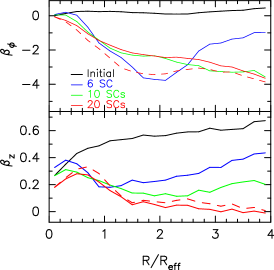
The JAM model of the NC in NGC 4244 has a . We have shown in model M2 that accretion of SCs with vertical motions decreases . In run A2 the accreted SCs are in the plane of the initial NCD. In further tests we let the NC in A2 accrete the 20th SC on a polar orbit using SC models C4, C5 and C3 (). In Figure 23 we show the anisotropy and of the remaining NC after these accretions. Modest accretion off the plane of the disc drives to negative values within . The accretion of SC C3 drives within 4 and it also leads to within . The accretion of SC C5 causes within and only within . Thus the observed negative requires that the NC accretes at least of its mass directly as stars.
7 JAM models of simulated NCs
To compare the rotation of the real NCs and the simulated ones in a fully consistent way, we applied the same JAM approach to measure the rotation of the simulated NCs. The MGE models were fitted to reconstructed images of all models listed in Table LABEL:tab:mergsims at an edge-on orientation, for different viewing directions in the disc plane. For each projection we fitted the anisotropy and of the simulated NCs, and we then measured the rotation parameter at the best-fitting . The inferred parameters are given in Table LABEL:tab:anisotropy and compared with the values measured from the particles. The comparison shows that the simple JAM models capture the global anisotropy of the simulated NCs of the merger simulations and gives confidence in the values we extracted from the real data. In summary for all simulations, as with the observations, we measure a degree of rotation within for models M1 and M2, and within for model M3. Given the complex accretion process of the NC it is remarkable for the rotation to be so closely linked to the NC shape. This result is similar to what was found for real galaxies in Cappellari (2008) and suggests that a general process may be responsible for both observations. For the models of the merger simulations we recover a weak anisotropy, with models for M1 and M3 anisotropic with and respectively, while model M2 is closer to fully isotropic with within 3 . Contrary to models M1-M3, the JAM models do not represent acceptable models for the accretion simulations A1-A3. In fact the kinematics predicted from the simulated photometry under the assumption of constant and an oblate velocity ellipsoid, is qualitatively quite different from the simulated one. The main reason for this discrepancy is due to the strong variation in the in the simulated NC, which is not included in the JAM models. Although it would be easy to construct JAM models using the gravitational potential directly measured from the simulations, this cannot be easily done from the observations. However in all accretion simulations the global rotation can robustly be determined by JAM.
We perform an independent measure of the degree of rotation of the simulated NCs using Eqns. 3 and 4 to place the simulations M1-M3 and A1-A3 on the diagram. For the NCs M1-M3 the diagram provides results consistent with the JAM models, for both simulated and observed NCs. In particular both models M1 and M3 are in a location of the diagram which indicates significant anisotropy, while model M2 and the observed NC of M33 and NGC 4244 are close to the isotropic line (with a typical uncertainty of ). The measured values are shown in Figure 5. To first order the diagram shows that both the simulated clusters and the real ones are rapidly rotating. The simulated NCs in runs M1 and M3 are flatter than M2, but they have a similar . The NCs in the accretion simulations A1-3 are similar flat than the merger simulations M1 and M3. They have comparable , although in A3 only the last accreted SC causes the rotation. All these results are consistent with the finding of the JAM models.
| JAM MGE | Simulation | ||||
|---|---|---|---|---|---|
| Run | |||||
| M1 | 0.25 | 0.94 | 0.55 | 0.15 | 0.38 |
| M2 | 0.04 | 0.99 | 0.37 | 0.08 | 0.10 |
| M3 | 0.17 | 0.90 | 0.56 | 0.17 | 0.26 |
| A1 | n.a. | n.a. | 0.56 | 0.05 | 0.35 |
| A2 | n.a. | n.a. | 0.73 | 0.10 | 0.31 |
| A3 | n.a. | n.a. | 0.66 | -1.92 | 0.20 |
| NGC 4244 | -0.2 | 1.06 | 0.43 | ||
| M33 | 0.0 | 0.84 | 0.28 | ||
8 Discussion & Conclusions
8.1 In situ formation versus accretion
We have examined in detail the formation of nuclear clusters (NCs) via the mergers of star clusters (SCs). This has been proposed as an important avenue for NC formation (Tremaine et al., 1975; Miocchi et al., 2006; Capuzzo-Dolcetta & Miocchi, 2008a; Agarwal & Milosavljević, 2011). The main support for this mechanism comes from the similarity of scaling relations between SCs and NCs (Lotz et al., 2001; Walcher et al., 2005). In agreement with previous studies (Bekki et al., 2004; Capuzzo-Dolcetta & Miocchi, 2008a, b) we find that such scaling relations are preserved after mergers.
As with previous studies (Bekki et al., 2004), the merger of SCs was found to produce triaxial NCs, but we showed that axisymmetry can result from the presence of intermediate mass black holes (IMBH) or sufficient vertical motions. In the only observed galaxy where the face-on shape can be determined, M33, we showed that the NC is most likely axisymmetric. When the simulated NCs are viewed edge-on, mergers produce boxy NCs, unless the merger of SCs occurs onto a pre-existing super star cluster or a pre-existing nuclear cluster disc at the centre. The flattening is in the range of observed NCs in edge-on galaxies (Seth et al., 2006).
Our simulations indicate that a NC formed via merging of cored SCs leads to a cored NC (Dehnen, 2005). During the merger, the NC density and mass increases and the NC evolves along the track defined by the observed density-mass relation for NCs. However the increase in density saturates, when the (Eqn. 8.92, Binney & Tremaine, 2008), where is the core radius, because the infalling SCs will be disrupted in the outer NC, leading to growth in mass and size but not in the mean density of the NC, similar to the evolution in mass and size of elliptical galaxies due to minor mergers (Ferreras et al., 2009). As seen in Figure 10, observed NCs and Milky Way globular clusters (GCs) overlap in the range . Some observed NCs are denser than the present-day GC population found in the Milky Way. Thus if the main formation mechanism of NCs is the accretion of SCs, NCs have to form by the merger of denser and more massive SCs than those in the Galaxy. Studies of young massive SCs in interacting galaxies (Whitmore & Schweizer, 1995; McCrady & Graham, 2007) show that they have similar masses ( ) and similar sizes as the Milky Way GCs (Bastian et al., 2006, and references therein). Due to the smaller infall times of massive SCs (Milosavljević, 2004; Neumayer et al., 2011), the mergers of these massive SCs is more likely and would explain why NCs are denser than the present day GC population.
Observed NCs contain thin, blue discs of young stars ( 100 Myrs). In NGC 4244, the mass of this disc is about of the total NC mass - if this is typical for the lifetime of a galaxy then over a Hubble time dissipation and star formation is sufficient to build the NC (Seth et al., 2006). On the other hand we have shown that even if the accreted SCs confer no net angular momentum to the NC, because the last accreted young SC dominates the luminosity, the apparent rotation can be quite large. We found that mergers can produce rapidly rotating NCs, having values as large as those observed (Seth et al., 2008b). However, the second moment of the line-of-sight velocity distribution , is centrally peaked, unlike in the observations. It is only if we introduce a rapidly rotating () nuclear disc at the centre of the initial system that the subsequent evolution produced by infalling SCs is able to qualitatively reproduce the observed field as well as the observed isophotal shape, degree of rotation and mass-density relation, provided no more than half of the NC’s mass is accreted. Thus a pure merger origin of NCs can be excluded.
Our JAM model of the NC in NGC 4244 has a negative . Because Cappellari (2008) found that a decrease in inclination leads to an increase in , we tested the effect of inclination on for the JAM model of NGC 4244. For inclinations , we found continues to be negative at a level. Thus the in NGC 4244 cannot be a projection effect and must be intrinsic. However, a NC disc formed out of gas cooling would have . For example, the JAM model of the NC in NGC 404 has (Seth et al., 2010); in this case the observed burst of star formation Gyr ago could easily have fed its NC and given rise to its positive . By scattering box orbits, central black holes can lower (e.g. Merritt & Quinlan, 1998). Whereas Seth et al. (2008a) find indirect evidence of supermassive black holes (SMBHs), with masses ranging from in of NCs, in NGC 4244 the radius of influence for the largest possible intermediate mass black hole is pc, while the NC has pc. Therefore the presence of a intermediate mass black holes in the centre of NGC 4244 cannot explain its . The only way we were able to produce was through the accretion of SCs on highly inclined orbits. Thus, at least of the mass of the NC of NGC 4244 needs to be accreted as SCs in order to obtain , which constitutes a lower limit on the amount of mass accreted in the form of star clusters.
8.2 Nuclear Cluster Formation in Dwarf Elliptical Galaxies
Our simulations can also make testable predictions relating to the formation of nuclei in dE galaxies. Lotz et al. (2001) suggested that NCs in dE galaxies could have formed by the merger of GCs. They found a depletion of the most massive GCs relative to the less massive ones in the inner region of galaxies. They interpreted this as being due to shorter dynamical friction infall timescales for massive GCs than for the lower mass ones. In the ACS Virgo Cluster Survey, Côté et al. (2006) found that, on average, NCs in dE galaxies are mag brighter than the mean GC. So if NCs form via the merger of GCs, on average about 25 GCs need to merge. Similar to what we found for NCs in late-type spiral galaxies (Figure 10), Côté et al. (2006, see their Figure 18) found that the NCs are denser than the mean density of the GC population in dE galaxies. They also found that the fraction of red GCs and the colour of NCs increases with the host galaxy luminosity (Peng et al., 2006; Côté et al., 2006). Using Monte Carlo simulations, and assuming that these NCs formed via mergers, Côté et al. (2006) found that the resulting scaling relation of the NC’s colours is less steep than those observed. From spectroscopic data Paudel et al. (2010) found that the metallicity of NCs in a sample of dE galaxies correlates with the luminosity of the host galaxy. They also found that the median difference in age between the NC and the galactic main body is about Gyrs and that the difference is more prominent in dEs with discy isophotal shapes. This implies that the formation of NCs in dEs might be enhanced by the accretion of gas. In contrast, Paudel et al. (2010) found fairly old and metal-poor NCs in very faint dEs, resembling the properties of the GC population. This suggests that NCs in faint dEs might have formed by different processes than the NCs in brighter dEs.
In summary both the accretion of gas with in situ star formation and the merger of GCs could be at work to form NCs in dE galaxies. If NCs in dEs form via merger of GCs, our simulations indicate that they will have boxy shapes, have centrally peaked and be radially biased. On the other hand, if the main formation mechanism is dissipation, NCs will have discy isophotes and no centrally peaked . At present, no available observational data exists which is able to test these predictions.
8.3 The - relation
The star formation histories in NCs of late-type spiral galaxies are extended, with the youngest population of stars less than 100 Myrs old (Walcher et al., 2006; Rossa et al., 2006; Seth et al., 2010). NCs appear to be offset from the relation of SMBHs (Ferrarese et al., 2006a; Wehner & Harris, 2006). NCs have the same slope, but, for a given velocity dispersion , are more massive than SMBHs. McLaughlin et al. (2006) found that this offset can be explained by feedback from stars and supernovae. Our simulations indicate that at least of the mass of NCs needs to be accreted by SCs and that at least of its mass needs to be accreted as gas. Therefore a fraction of the star formation could occur outside the NC. However, the accreted SCs have to be young and therefore still formed within the central region. SCs with masses in a range of have to be formed within pc, otherwise their infall times are longer than 100 Myrs. Therefore, even if the NC has accreted half of its mass in young SCs, stellar feedback occurs within the central region of the galaxy and therefore remains a plausible explanation for the .
8.4 Summary
We have studied the formation and evolution of stellar nuclear clusters using -body simulations. Our main conclusions can be summarised as follows:
-
•
We find no evidence of non-axisymmetry in the nuclear cluster of M33. Its PA is consistent with that of its main disc and its apparent ellipticity is consistent with a vertical flattening , which is the average observed in the NCs of edge-on late-type galaxies (Seth et al., 2006). There is also only a small misalignment between the photometric and kinematic PAs. While this is the only galaxy where this measurement can be done at present, it suggests that NCs are generally axisymmetric.
-
•
The NC in NGC 4244 is nearly isotropic, with , and is rapidly rotating. It has a mass of ; if an IMBH is present its mass is less than that of the NC. It is not possible from these models to distinguish whether the rotation is present throughout the NC or is restricted to the NCD.
-
•
The mergers of SCs produce NCs with density and sizes consistent with observations, evolving along the track of observed NCs. Remnant NCs can be axisymmetric. Multiple accretions of young SCs onto a pre-existing nuclear cluster spheroid can also produce discy isophotal shapes. Mergers can lead to rapidly rotating NCs, as observed. They have , where initial vertical motions induce the smallest value. However these NCs have centrally peaked unlike observed NCs in late-type discs.
-
•
Accretion of young SCs onto a bare NCD produces NCs with densities, sizes and ellipticities comparable to those observed. They show discy isophotes and have rotations comparable to those in the NCs of NGC 4244 and M33. is dominated by dispersion if the accreted mass is greater than the initial mass of the NCD. The formation of the NC in NGC 4244 therefore requires at least of the mass to be accreted as gas to match the observations.
-
•
The negative in the NC of NGC 4244 requires at least it’s total mass to have been accreted from SCs.
-
•
We caution that even if the accreted SCs do not impart any net angular momentum, the last accreted SC can dominate the apparent rotation when luminosity-weighting and could be similar to the and fields of observed NCs.
-
•
With the results presented in this paper, the simulations are now ahead of the observations with predictions of detailed observables that can be used to constrain the formation scenarios better. Integral-field observations of the kinematics of more NC are essential for further progress and we hope these will be obtained in the near future.
Acknowledgements
Part of the simulations in this paper were performed on the COSMOS Consortium supercomputer within the DIRAC Facility jointly funded by STFC, the Large Facilities Capital Fund of BIS. Simulations have also been run at the Arctic Region Supercomputing Center (ARSC) and the High Performance Computer Facility at the University of Central Lancashire. We thank Jerry Sellwood for providing us with the multi-mass bulge model and Jakob Walcher for providing us with his observational data. Markus Hartmann thanks Chris Brook and Rok Roškar for their support and help. Michele Cappellari acknowledges support from a Royal Society University Research Fellowship.
References
- Agarwal & Milosavljević (2011) Agarwal M., Milosavljević M., 2011, ApJ, 729, 35
- Andersen et al. (2008) Andersen D. R., Walcher C. J., Böker T., Ho L. C., van der Marel R. P., Rix H.-W., Shields J. C., 2008, ApJ, 688, 990
- Bastian et al. (2006) Bastian N., Saglia R. P., Goudfrooij P., Kissler-Patig M., Maraston C., Schweizer F., Zoccali M., 2006, A&A, 448, 881
- Bekki (2007) Bekki K., 2007, Publications of the Astronomical Society of Australia, 24, 77
- Bekki et al. (2004) Bekki K., Couch W. J., Drinkwater M. J., Shioya Y., 2004, ApJL, 610, L13
- Bender (1988) Bender R., 1988, A&A, 193, L7
- Binney (1978) Binney J., 1978, MNRAS, 183, 501
- Binney (2005) —, 2005, MNRAS, 363, 937
- Binney & Tremaine (2008) Binney J., Tremaine S., 2008, Galactic Dynamics: Second Edition. Galactic Dynamics: Second Edition, by James Binney and Scott Tremaine. ISBN 978-0-691-13026-2 (HB). Published by Princeton University Press, Princeton, NJ USA, 2008.
- Binney et al. (1990) Binney J. J., Davies R. L., Illingworth G. D., 1990, ApJ, 361, 78
- Böker et al. (2002) Böker T., Laine S., van der Marel R. P., Sarzi M., Rix H.-W., Ho L. C., Shields J. C., 2002, AJ, 123, 1389
- Böker et al. (2004) Böker T., Walcher C. J., Rix H. W., Häring N., Schinnerer E., Sarzi M., van der Marel R. P., Ho L. C., Shields J. C., Lisenfeld U., Laine S., 2004, in Astronomical Society of the Pacific Conference Series, Vol. 322, The Formation and Evolution of Massive Young Star Clusters, Lamers H. J. G. L. M., Smith L. J., Nota A., eds., pp. 39–+
- Bournaud et al. (2007) Bournaud F., Jog C. J., Combes F., 2007, A&A, 476, 1179
- Burkert & Naab (2005) Burkert A., Naab T., 2005, MNRAS, 363, 597
- Cappellari (2002) Cappellari M., 2002, MNRAS, 333, 400
- Cappellari (2008) —, 2008, MNRAS, 390, 71
- Cappellari et al. (2007) Cappellari M., Emsellem E., Bacon R., Bureau M., Davies R. L., de Zeeuw P. T., Falcón-Barroso J., Krajnović D., Kuntschner H., McDermid R. M., Peletier R. F., Sarzi M., van den Bosch R. C. E., van de Ven G., 2007, MNRAS, 379, 418
- Cappellari et al. (2011) Cappellari M., Emsellem E., Krajnović D., McDermid R. M., Scott N., Verdoes Kleijn G. A., Young L. M., Alatalo K., Bacon R., Blitz L., Bois M., Bournaud F., Bureau M., Davies R. L., Davis T. A., de Zeeuw P. T., Duc P., Khochfar S., Kuntschner H., Lablanche P., Morganti R., Naab T., Oosterloo T., Sarzi M., Serra P., Weijmans A., 2011, MNRAS, 269
- Capuzzo-Dolcetta & Miocchi (2008a) Capuzzo-Dolcetta R., Miocchi P., 2008a, ApJ, 681, 1136
- Capuzzo-Dolcetta & Miocchi (2008b) —, 2008b, MNRAS, 388, L69
- Carollo et al. (1997) Carollo C. M., Stiavelli M., de Zeeuw P. T., Mack J., 1997, AJ, 114, 2366
- Carollo et al. (1998) Carollo C. M., Stiavelli M., Mack J., 1998, AJ, 116, 68
- Carollo et al. (2002) Carollo C. M., Stiavelli M., Seigar M., de Zeeuw P. T., Dejonghe H., 2002, AJ, 123, 159
- Corbelli & Schneider (1997) Corbelli E., Schneider S. E., 1997, ApJ, 479, 244
- Côté et al. (2006) Côté P., Piatek S., Ferrarese L., Jordán A., Merritt D., Peng E. W., Haşegan M., Blakeslee J. P., Mei S., West M. J., Milosavljević M., Tonry J. L., 2006, ApJS, 165, 57
- Debattista et al. (2006) Debattista V. P., Mayer L., Carollo C. M., Moore B., Wadsley J., Quinn T., 2006, ApJ, 645, 209
- Debattista et al. (2008) Debattista V. P., Moore B., Quinn T., Kazantzidis S., Maas R., Mayer L., Read J., Stadel J., 2008, ApJ, 681, 1076
- Debattista & Sellwood (2000) Debattista V. P., Sellwood J. A., 2000, ApJ, 543, 704
- Dehnen (2005) Dehnen W., 2005, MNRAS, 360, 892
- Eliche-Moral et al. (2006) Eliche-Moral M. C., Balcells M., Aguerri J. A. L., González-García A. C., 2006, A&A, 457, 91
- Emsellem et al. (2011) Emsellem E., Cappellari M., Krajnović D., Alatalo K., Blitz L., Bois M., Bournaud F., Bureau M., Davies R. L., Davis T. A., de Zeeuw P. T., Khochfar S., Kuntschner H., Lablanche P., McDermid R. M., Morganti R., Naab T., Oosterloo T., Sarzi M., Scott N., Serra P., van de Ven G., Weijmans A., Young L. M., 2011, ArXiv e-prints
- Emsellem et al. (1994) Emsellem E., Monnet G., Bacon R., 1994, A&A, 285, 723
- Emsellem & van de Ven (2008) Emsellem E., van de Ven G., 2008, ApJ, 674, 653
- Ferrarese et al. (2006a) Ferrarese L., Côté P., Dalla Bontà E., Peng E. W., Merritt D., Jordán A., Blakeslee J. P., Haşegan M., Mei S., Piatek S., Tonry J. L., West M. J., 2006a, ApJL, 644, L21
- Ferrarese et al. (2006b) Ferrarese L., Côté P., Jordán A., Peng E. W., Blakeslee J. P., Piatek S., Mei S., Merritt D., Milosavljević M., Tonry J. L., West M. J., 2006b, ApJS, 164, 334
- Ferreras et al. (2009) Ferreras I., Lisker T., Pasquali A., Khochfar S., Kaviraj S., 2009, MNRAS, 396, 1573
- Figer et al. (1999) Figer D. F., McLean I. S., Morris M., 1999, ApJ, 514, 202
- Figer et al. (2002) Figer D. F., Najarro F., Gilmore D., Morris M., Kim S. S., Serabyn E., McLean I. S., Gilbert A. M., Graham J. R., Larkin J. E., Levenson N. A., Teplitz H. I., 2002, ApJ, 581, 258
- Franx et al. (1991) Franx M., Illingworth G., de Zeeuw T., 1991, ApJ, 383, 112
- Gebhardt (1994) Gebhardt K., 1994, PhD thesis, Rutgers - The State Univ.
- Gebhardt et al. (2000) Gebhardt K., Pryor C., O’Connell R. D., Williams T. B., Hesser J. E., 2000, AJ, 119, 1268
- Gebhardt et al. (1995) Gebhardt K., Pryor C., Williams T. B., Hesser J. E., 1995, AJ, 110, 1699
- Gebhardt et al. (2005) Gebhardt K., Rich R. M., Ho L. C., 2005, ApJ, 634, 1093
- Geha et al. (2002) Geha M., Guhathakurta P., van der Marel R. P., 2002, AJ, 124, 3073
- Gerssen et al. (2002) Gerssen J., van der Marel R. P., Gebhardt K., Guhathakurta P., Peterson R. C., Pryor C., 2002, AJ, 124, 3270
- Gerssen et al. (2003) —, 2003, AJ, 125, 376
- Goerdt et al. (2008) Goerdt T., Moore B., Kazantzidis S., Kaufmann T., Macciò A. V., Stadel J., 2008, MNRAS, 385, 2136
- Goerdt et al. (2010) Goerdt T., Moore B., Read J. I., Stadel J., 2010, ApJ, 725, 1707
- Grant et al. (2005) Grant N. I., Kuipers J. A., Phillipps S., 2005, MNRAS, 363, 1019
- Hernquist (1990) Hernquist L., 1990, ApJ, 356, 359
- Hubble (1926) Hubble E. P., 1926, ApJ, 64, 321
- Illingworth (1977) Illingworth G., 1977, ApJL, 218, L43
- King (1962) King I., 1962, AJ, 67, 471
- Kormendy & Bender (1996) Kormendy J., Bender R., 1996, ApJL, 464, L119+
- Kormendy & Djorgovski (1989) Kormendy J., Djorgovski S., 1989, ARA&A, 27, 235
- Kornei & McCrady (2009) Kornei K. A., McCrady N., 2009, ApJ, 697, 1180
- Krajnović et al. (2006) Krajnović D., Cappellari M., de Zeeuw P. T., Copin Y., 2006, MNRAS, 366, 787
- Larsen et al. (2004) Larsen S. S., Brodie J. P., Hunter D. A., 2004, AJ, 128, 2295
- Lauer et al. (1998) Lauer T. R., Faber S. M., Ajhar E. A., Grillmair C. J., Scowen P. A., 1998, AJ, 116, 2263
- Lotz et al. (2004) Lotz J. M., Miller B. W., Ferguson H. C., 2004, ApJ, 613, 262
- Lotz et al. (2001) Lotz J. M., Telford R., Ferguson H. C., Miller B. W., Stiavelli M., Mack J., 2001, ApJ, 552, 572
- Maciejewski et al. (2002) Maciejewski W., Teuben P. J., Sparke L. S., Stone J. M., 2002, MNRAS, 329, 502
- Mackey & Gilmore (2003) Mackey A. D., Gilmore G. F., 2003, MNRAS, 340, 175
- Maraston (1998) Maraston C., 1998, MNRAS, 300, 872
- Maraston (2005) —, 2005, MNRAS, 362, 799
- McCrady & Graham (2007) McCrady N., Graham J. R., 2007, ApJ, 663, 844
- McLaughlin & Fall (2008) McLaughlin D. E., Fall S. M., 2008, ApJ, 679, 1272
- McLaughlin et al. (2006) McLaughlin D. E., King A. R., Nayakshin S., 2006, ApJL, 650, L37
- McLaughlin & van der Marel (2005) McLaughlin D. E., van der Marel R. P., 2005, ApJS, 161, 304
- Merritt (2009) Merritt D., 2009, ApJ, 694, 959
- Merritt & Quinlan (1998) Merritt D., Quinlan G. D., 1998, ApJ, 498, 625
- Milosavljević (2004) Milosavljević M., 2004, ApJL, 605, L13
- Miocchi et al. (2006) Miocchi P., Capuzzo Dolcetta R., Di Matteo P., Vicari A., 2006, ApJ, 644, 940
- Naab & Burkert (2003) Naab T., Burkert A., 2003, ApJ, 597, 893
- Naab et al. (1999) Naab T., Burkert A., Hernquist L., 1999, ApJL, 523, L133
- Naab et al. (2006) Naab T., Khochfar S., Burkert A., 2006, ApJL, 636, L81
- Neumayer et al. (2011) Neumayer N., Walcher C. J., Andersen D., Sanchez S. F., Boeker T., Rix H., 2011, ArXiv e-prints
- Noyola et al. (2008) Noyola E., Gebhardt K., Bergmann M., 2008, ApJ, 676, 1008
- Noyola et al. (2010) Noyola E., Gebhardt K., Kissler-Patig M., Lützgendorf N., Jalali B., de Zeeuw P. T., Baumgardt H., 2010, ApJL, 719, L60
- Paudel et al. (2010) Paudel S., Lisker T., Kuntschner H., 2010, ArXiv e-prints
- Peng et al. (2006) Peng E. W., Jordán A., Côté P., Blakeslee J. P., Ferrarese L., Mei S., West M. J., Merritt D., Milosavljević M., Tonry J. L., 2006, ApJ, 639, 95
- Read et al. (2006) Read J. I., Goerdt T., Moore B., Pontzen A. P., Stadel J., Lake G., 2006, MNRAS, 373, 1451
- Read et al. (2008) Read J. I., Lake G., Agertz O., Debattista V. P., 2008, MNRAS, 389, 1041
- Rossa et al. (2006) Rossa J., van der Marel R. P., Böker T., Gerssen J., Ho L. C., Rix H.-W., Shields J. C., Walcher C.-J., 2006, AJ, 132, 1074
- Roškar et al. (2008) Roškar R., Debattista V. P., Quinn T. R., Stinson G. S., Wadsley J., 2008, ApJL, 684, L79
- Satoh (1980) Satoh C., 1980, PASJ, 32, 41
- Schinnerer et al. (2003) Schinnerer E., Böker T., Meier D. S., 2003, ApJL, 591, L115
- Schinnerer et al. (2008) Schinnerer E., Böker T., Meier D. S., Calzetti D., 2008, ApJL, 684, L21
- Scott et al. (2009) Scott N., Cappellari M., Davies R. L., Bacon R., de Zeeuw P. T., Emsellem E., Falcón-Barroso J., Krajnović D., Kuntschner H., McDermid R. M., Peletier R. F., Pipino A., Sarzi M., van den Bosch R. C. E., van de Ven G., van Scherpenzeel E., 2009, MNRAS, 398, 1835
- Sellwood (2003) Sellwood J. A., 2003, ApJ, 587, 638
- Sellwood (2008) —, 2008, ApJ, 679, 379
- Sellwood & Binney (2002) Sellwood J. A., Binney J. J., 2002, MNRAS, 336, 785
- Sellwood & Debattista (2009) Sellwood J. A., Debattista V. P., 2009, MNRAS, 398, 1279
- Seth et al. (2008a) Seth A., Agüeros M., Lee D., Basu-Zych A., 2008a, ApJ, 678, 116
- Seth et al. (2008b) Seth A. C., Blum R. D., Bastian N., Caldwell N., Debattista V. P., 2008b, ApJ, 687, 997
- Seth et al. (2010) Seth A. C., Cappellari M., Neumayer N., Caldwell N., Bastian N., Olsen K., Blum R. D., Debattista V. P., McDermid R., Puzia T., Stephens A., 2010, ApJ, 714, 713
- Seth et al. (2005) Seth A. C., Dalcanton J. J., de Jong R. S., 2005, AJ, 129, 1331
- Seth et al. (2006) Seth A. C., Dalcanton J. J., Hodge P. W., Debattista V. P., 2006, AJ, 132, 2539
- Shlosman & Begelman (1989) Shlosman I., Begelman M. C., 1989, ApJ, 341, 685
- Stadel (2001) Stadel J. G., 2001, PhD thesis, AA(UNIVERSITY OF WASHINGTON)
- Thomas et al. (2009) Thomas J., Jesseit R., Saglia R. P., Bender R., Burkert A., Corsini E. M., Gebhardt K., Magorrian J., Naab T., Thomas D., Wegner G., 2009, MNRAS, 393, 641
- Tremaine et al. (1975) Tremaine S. D., Ostriker J. P., Spitzer Jr. L., 1975, ApJ, 196, 407
- van der Marel (1991) van der Marel R. P., 1991, MNRAS, 253, 710
- van der Marel & Anderson (2010) van der Marel R. P., Anderson J., 2010, ApJ, 710, 1063
- van der Marel & van Dokkum (2007) van der Marel R. P., van Dokkum P. G., 2007, ApJ, 668, 738
- van der Wel & van der Marel (2008) van der Wel A., van der Marel R. P., 2008, ApJ, 684, 260
- Wagner et al. (1988) Wagner S. J., Bender R., Moellenhoff C., 1988, A&A, 195, L5
- Walcher et al. (2006) Walcher C. J., Böker T., Charlot S., Ho L. C., Rix H.-W., Rossa J., Shields J. C., van der Marel R. P., 2006, ApJ, 649, 692
- Walcher et al. (2005) Walcher C. J., van der Marel R. P., McLaughlin D., Rix H.-W., Böker T., Häring N., Ho L. C., Sarzi M., Shields J. C., 2005, ApJ, 618, 237
- Wehner & Harris (2006) Wehner E. H., Harris W. E., 2006, ApJL, 644, L17
- Whitmore & Schweizer (1995) Whitmore B. C., Schweizer F., 1995, AJ, 109, 960
- Zaritsky et al. (1989) Zaritsky D., Elston R., Hill J. M., 1989, AJ, 97, 97