Evidence for a circum-nuclear and ionised absorber in the X-ray obscured Broad Line Radio Galaxy 3C 445
Abstract
Here we present the results of a Suzaku observation of the Broad Line Radio Galaxy 3C 445.
We confirm the results obtained with the previous X-ray observations which unveiled the
presence of several soft X-ray emission lines and an overall X-ray emission which strongly
resembles a typical Seyfert 2 despite of the optical classification as an unobscured AGN.
The broad band spectrum allowed us to measure for the first time the amount of reflection
() which together with the relatively strong neutral Fe K emission line
( eV) strongly supports a scenario where a Compton-thick mirror is present. The
primary X-ray continuum is strongly obscured by an absorber with a column density of
cm-2. Two possible scenarios are proposed for the absorber:
a neutral partial covering or a mildly ionised absorber with an ionisation parameter erg cm s-1. A comparison with the past and more recent X-ray observations of 3C 445 performed with XMM-Newton and Chandra is presented, which provided tentative evidence that the
ionised and outflowing absorber varied. We argue that the absorber is probably associated with
an equatorial disk-wind located within the parsec scale molecular torus.
keywords:
galaxies: active – galaxies: individual (3C 445) – X-rays: galaxies1 Introduction
X-ray observations of AGN are a powerful tool to understand the physical conditions of the
matter in the proximity of the central SMBH and to understand the possible connection between
the accretion and outflow mechanisms. In the last decade X-ray observations have confirmed
the widely accepted Unified Model (Antonucci, 1993) of AGN, which accounts for the difference
between type 1 and type 2 AGNs through orientation effects. However there are still several
open questions related to the geometry, and physical state of the matter in the proximity of
the central supermassive black hole (SMBH). In particular a key question still to be
answered is the origin of powerful relativistic jets and outflowing winds. Understanding the
nature of AGN with powerful jets or disk winds is not only important in order to understand the
accretion itself, but more importantly the mechanism with which the AGN can expel the gas
supply of the host galaxy quenching the growth of the SMBH and of the galaxy itself. Indeed,
jets and outflows can transport a significant fraction of the mass-energy into the AGN
environment and they could represent a key to understand the AGN feedback mechanism
(Fabian, 2010; Elvis, 2006; Cattaneo et al., 2009; King & Pounds, 2003).
In the last decade X-ray observations have successfully revealed the presence of both warm and
cold gas in the central region of AGN, and have shown that % of the X-ray spectra of
radio quiet AGN (RQ-AGN) present absorption and emission features due to the presence of
photoionised gas, which is outflowing with typical velocities of km
s-1 (Crenshaw et al., 2003). On the other end, previous observations of Radio-Loud AGN
(RL-AGN) suggested that their X-ray emission is similar to the case of RQ AGN but with some
differences. In particular the X-ray emission appears to be harder (or flatter) and with weaker
features due to reprocessing (reflection/absorption) from warm or cold gas with respect to the
RQ population (Sambruna et al., 2002; Grandi et al., 2006; Ballantyne, 2007). Several possible scenarios were proposed to
account for these differences, among them a smaller subtending angle of the reprocessing
medium as in an advection dominated accretion-flow (ADAF) models (Narayan & Yi, 1995) or a higher
ionisation state of the accretion disk (Ballantyne et al., 2002).
Recent sensitive and broadband observations performed with Chandra, XMM-Newton and Suzaku are
subverting this view, indeed observations of samples of RQ and RL AGN have shown a large
variety in the X-ray properties, with a wider range of X-ray continuum shapes where the RL
sources simply populate one end of the distribution. Emission and absorption lines have been
now detected also in the soft X-ray spectra of Radio Galaxies
(Torresi et al. 2010; Reeves et al. 2010, 2009; Torresi et al. 2009; Sambruna et al. 2007; hereafter S07), indicating the
presence of photoionised gas in the central regions of RL-AGN analogous to RQ-AGN. Furthermore
a recent analysis of the Suzaku observations of broad line radio galaxies (BLRGs) has also
unveiled the presence of fast outflowing gas with velocities and carrying
substantial masses and kinetic powers similar to the radio jets (Tombesi et al., 2010).
We are currently carrying out a program of Suzaku observations of a sample of all the nearby () broad line radio galaxies (BLRGs), for which we also have XMM-Newton and or Chandra data (3C 390.3; Sambruna et al. 2009, 3C 111; Ballo et al. in prep; 3C 382; Sambruna et al. in prep and 3C 445; Reeves et al. 2010). One of the goals of this project is to investigate the structure of the accretion flow and the presence of warm and cold gas in the central regions of BLRGs to better understand the jet formation. Here we focus on one of these sources 3C 445, while the X-ray properties of the sample will be presented in a forthcoming paper (Sambruna et al. in prep).
1.1 The Broad Line Radio Galaxy 3C 445.
3C 445 is a nearby (z=0.057) BLRG with a FRII morphology (Kronberg et al., 1986). The
optical spectrum of 3C 445 shows the presence, in total flux, of broad emission
lines (H FWHM 6400 km s-1; Eracleous & Halpern, 1994) typical of a
type 1 or unobscured AGN leading to the classification as a BLRG. The optical
continuum is also highly reddened; from the large Balmer decrement
(H/H 8) Crenshaw et al., 1988 derived E(B-V)=1 mag,
consistent with the large Pa/H ratio (5.6; Rudy & Tokunaga, 1982).
Assuming a standard dust-to-gas ratio this corresponds to a column density of N cm-2, which is one order of magnitude larger than the
Galactic column density in the direction to 3C 445 (N
cm-2, Murphy et al., 1996). From radio observations (Eracleous & Halpern, 1998) an
inclination for the jet of is inferred, suggesting that the
contribution of the jet is negligible (Doppler factor of ) and
also that 3C 445 is seen almost edge-on. A large viewing inclination angle for
3C 445 () was also inferred by Grandi et al. (2007) with the
analysis of the flux ratio of the jet components and the VLA maps presented by
Leahy et al. (1997).
3C 445 is a bright X-ray source (F erg cm-2 s-1 ), and
was previously observed with all the major X-ray observatories. The analysis of
an archival 15 ks XMM-Newton observation of 3C 445 showed a remarkable spectrum (S07;
Grandi et al. 2007). The intriguing result was that, despite its optical
classification as a type 1 AGN, its X-ray emission was typical of an obscured AGN
in several aspects. The 2–10 keV continuum could be described by a heavily
absorbed (N cm-2) power-law with photon index ; a
narrow and unresolved Fe K emission line was also detected with EW
120 eV. Due to the limited EPIC bandpass (0.4–10 keV) it was impossible to
distinguish between a scenario with a strong reflection component (with )
or a multi-layer neutral partial covering absorber. However, in both the scenarios
the measured exceeded the column density predicted from the
optical reddening. Furthermore, the soft X-ray spectrum was also reminiscent
of a Compton-thin Seyfert 2, with several emission lines in 0.6–3 keV, due to
ionised elements from O to Si.
At high energies 3C 445 was detected with the BeppoSAX-PDS instrument
(Grandi et al., 2006). However, due to the large field of view of the high energy
detector onboard BeppoSAX and the possible contamination from a nearby cluster
(A2440) this observation could provide only a weakly constrained measurement of
the reflected continuum. 3C 445 is also detected with the BAT detector on
board Swift and is part of the 58 months
catalogue111heasarc.gsfc.nasa.gov/docs/swift/results/bs58mon/
(Baumgartner et al. 2010).
In the soft X-ray band the high resolution spectra, accumulated with the
XMM-Newton-RGS, provided the first tentative detection of the O vii and
O viii emission lines (Grandi et al., 2007). This detection suggested
that the soft X-ray emission is produced in a warm gas photoionised by the AGN as
observed in Compton-thin Seyfert 2 galaxies (Bianchi et al., 2006; Guainazzi & Bianchi, 2007).
Recently we obtained a deep Chandra observation of 3C 445, which provided the
evidence for both emission and absorption from photoionised gas in this obscured
AGN and provided the first detailed quantitative measurement. In particular, in
the Chandra spectrum several soft X-ray emission lines (from the He and
H-like transitions of O, Ne, Mg and Si) were detected and resolved. From the ratio
of forbidden to intercombination emission lines in the He-like triplets and the
velocity broadening ( km s-1) it was inferred
that the photoionised emitter has properties very similar to the Broad Line
Region. The Chandra spectrum confirmed that 3C 445 is highly obscured but it was
suggestive that X-ray absorber could be associated with a disk wind with an
observed outflow velocity of 10000 km s-1, which is launched from a
sub-parsec scale location.
Here we present the analysis and results from our 140 ks Suzaku observation of
3C 445, while the results on the high resolution soft X-ray spectra obtained with
our deep (200 ksec) Chandra LETG observation are discussed in a companion paper
(Reeves et al., 2010). The Swift-BAT spectrum (; ) is used in this paper and fitted jointly with the Suzaku data. We took advantage of the Chandra results, while modelling the
Suzaku data (§3.2 and §3.4), and we present a comparison between the two
datasets, which provided tentative evidence that the X-ray absorbers varied
(§3.4 & §4).
The paper is structured as follows. The observation and data reduction are summarised in § 2. In § 3 we present the modelling of the broad-band spectrum, aimed to assess the nature of the X-ray absorber, the amount of reflection and the iron K emission line properties. Discussion and conclusions follow in §§ 4 and 5. Throughout this paper, a concordance cosmology with H km s-1 Mpc-1, =0.73, and =0.27 (Spergel et al., 2003) is adopted.
2 Observations and data reduction
On 25 May 2007 Suzaku (Mitsuda et al., 2007) observed 3C 445 for a total exposure time of about 140 ksec (over a total duration of ksec); a summary of observations is shown in Table 1. Suzaku carries on board four sets of X-ray mirrors, with an X-ray CCD (XIS; three front illuminated, FI222At the time of this observation only XIS0 and XIS3 were still operating, and one back illuminated, BI) at their focal plane, and a non imaging hard X-ray detector (HXD). All together the XIS and the HXD-PIN cover the 0.5–10 keV and 12–70 keV bands respectively. Data from the XIS (Koyama et al., 2007) and HXD-PIN (Takahashi et al., 2007) were processed using v2.1.6.14 of the Suzaku pipeline applying the standard screening333The screening filters all events within the South Atlantic Anomaly (SAA) as well as with an Earth elevation angle (ELV) and Earth day-time elevation angles (DYE_ELV) less than . Furthermore also data within 256s of the SAA were excluded from the XIS and within 500s of the SAA for the HXD. Cut-off rigidity (COR) criteria of for the HXD data and for the XIS were used..
2.1 The Suzaku-XIS analysis
The XIS data were selected in and editmodes using only good events with grades 0,2,3,4,6 and filtering the hot and flickering pixels with the script sisclean. The net exposure times are ksec for each of the XIS. The XIS source spectra were extracted from a circular region of 2.4′ radius centered on the source, while background spectra were extracted from two circular regions of 2.4′ radius offset from the source and the calibration sources. The XIS response (rmfs) and ancillary response (arfs) files were produced, using the latest calibration files available, with the ftools tasks xisrmfgen and xissimarfgen respectively. The spectra from the two FI CDDs (XIS 0 and XIS 3) were combined to create a single source spectrum (hereafter XIS–FI), while the BI (the XIS1) spectrum was kept separate and fitted simultaneously. The net 0.5–10 keV count rates are: cts/s, cts/s, cts/s for the XIS0, XIS3 and XIS1 respectively with a net exposure of 108 ks for each XIS. Data were included from 0.4–10 keV for the XIS–FI and 0.4–8 keV for the XIS1 chip; the difference on the upper boundary for the XIS1 spectra is because this CCD is optimised for the soft X-ray band. The background rates in these energy ranges correspond to only 4.5% and 8.1% of the net source counts for the XIS-FI and XIS1 respectively. The net XIS source spectra were then binned to a minimum of 100 counts per bin and statistics have been used.
2.2 The Suzaku HXD-PIN analysis
For the HXD-PIN data reduction and analysis we followed the latest Suzaku data
reduction guide (the ABC guide Version
2444http://heasarc.gsfc.nasa.gov/docs/suzaku/analysis/abc/), and used the
rev2 data, which include all 4 cluster units. The HXD-PIN instrument team
provides the background (known as the “tuned” background) event file, which
accounts for the instrumental Non X-ray Background (NXB; Kokubun et al., 2007). The
systematic uncertainty of this “tuned” background model is believed to be
1.3% (at the 1 level for a net 20 ks exposure).
We extracted the
source and background spectra using the same common good time interval, and
corrected the source spectrum for the detector dead time. The net exposure time
after the screening was 109.5 ks. We then simulated a spectrum for the cosmic
X-ray background counts (Boldt, 1987; Gruber et al., 1999) and added it to the instrumental
one.
3C 445 is detected up to 70 keV at a level of 12.9% above the background corresponding to a signal-to noise ratio . The net count rate in the 15–70 keV band is cts/s ( net counts). For the spectral analysis the source spectrum of 3C 445 was rebinned in order to have a signal-to-noise ratio of five in each energy bin. The HXD-PIN spectrum can be fitted with a single power-law (); this provides a first estimate of the 15-70 keV flux of about erg cm-2 s-1 . The extrapolated flux in the Swift band (14-195 keV) is erg cm-2 s-1 and it is comparable to the flux reported in the BAT 58 months catalog (Baumgartner et al. 2010).
2.3 The Swift-BAT observation
The BAT spectrum was obtained from the 58-month survey archive, which provides both the spectrum and the long-term online BAT light curve; the data reduction procedure of the eight-channel spectrum is described in (Tueller et al. 2010 and Baumgartner et al. 2010). For the analysis we used the latest calibration response file (the diagonal matrix: diagonal.rsp) provided with the spectrum and we also inspected the light curve that shows no strong variability. The net count rate in the 14–195 keV band is cts s-1.
2.4 The Chandra observation
Recently 3C 445 was observed with the Chandra ACIS-S for 200 ksec. The observation was performed on September 2009 with the Low-Energy Transmission Grating (or LETG; Brinkman et al. 2000) in the focal plane. In this paper we concentrate on the Suzaku results, while the Chandra data reduction, analysis and results are described in a companion paper (Reeves et al., 2010). Thanks to the high sensitivity and spectral resolution the LETG data allowed us to resolve the soft X-ray emission lines, determining the gas density and location. Since 3C 445 is not highly variable either in flux and spectral shape, we were able to take the advantage of the Chandra results, while modelling the Suzaku data and vice-versa.
| Mission | DATE | Instrument | T(tot) (ks) | T(net) (ks) |
|---|---|---|---|---|
| Suzaku | 2007-5-25 | XIS-FI | 139.8 | 108 |
| Suzaku | 2007-5-25 | XIS 1 | 139.8 | 108 |
| Suzaku | 2007-5-25 | HXD-PIN | 139.8 | 109.5 |
| Chandra | 2009-09-25 | ACIS-S LETG | – | 43.950 |
| Chandra | 2009-09-29 | ACIS-S LETG | – | 73.720 |
| Chandra | 2009-10-02 | ACIS-S LETG | – | 83.440 |
3 Spectral Analysis
All the models have been fit to the data using standard software packages (XSPEC ver. 11.3). In the following, unless otherwise stated, fit parameters are quoted in the rest frame of the source and errors are at the 90% confidence level for one interesting parameter ().
3.1 The broad band continuum
Previous X-ray studies of 3C 445 revealed that its X-ray spectrum is complex and
cannot be modelled with a single power-law component. This is confirmed by our
Suzaku observation, where the XIS curved continuum is highly indicative of the
presence of strong absorption. A fit to the 0.4–10 keV XIS data with a single
redshifted power-law model modified by Galactic (Ncm-2; Dickey & Lockman, 1990) and intrinsic (in the rest-frame of
3C 445) absorption, yields a poor fit (), with a hard photon
index () and leaves strong residuals at low and high energies.
We then added to this model a soft power-law component absorbed only by the
Galactic column, which represents the primary X-ray emission scattered into our
line of sight. The photon indices of these two power-law components were
constrained to be the same. This model is still a poor description the X-ray
emission from 3C 445 () and as already noted with the XMM-Newton observation (S07) it fails to reproduce the overall curvature, which suggests that
a more complex absorber is required. Furthermore, it leaves strong residuals both
at the Fe K line energy range and in the soft X-ray band and the photon
index is found to be hard () with respect to the typical
values of radio loud AGN (Sambruna et al., 1999; Reeves & Turner, 2000).
We then tested a model for the continuum similar to the best fit found for the
XMM-Newton data, without including any reflection, and we ignored the 5–7.5 keV band,
where the Fe K emission complex is expected. The absorber is now modelled
with a dual absorber; one fully covering the primary X-ray emission and one only
partially covering it. A scattered component, modelled with a second power-law
with the same photon index of the primary one is still included. This is now a
better representation of the X-ray continuum and the photon index is now steeper
(). The column densities of the absorbers are found to be
N cm-2and N cm-2, for the fully and partial covering absorber
respectively; the covering fraction of the latter absorber is , while the scattering fraction is found to be
.
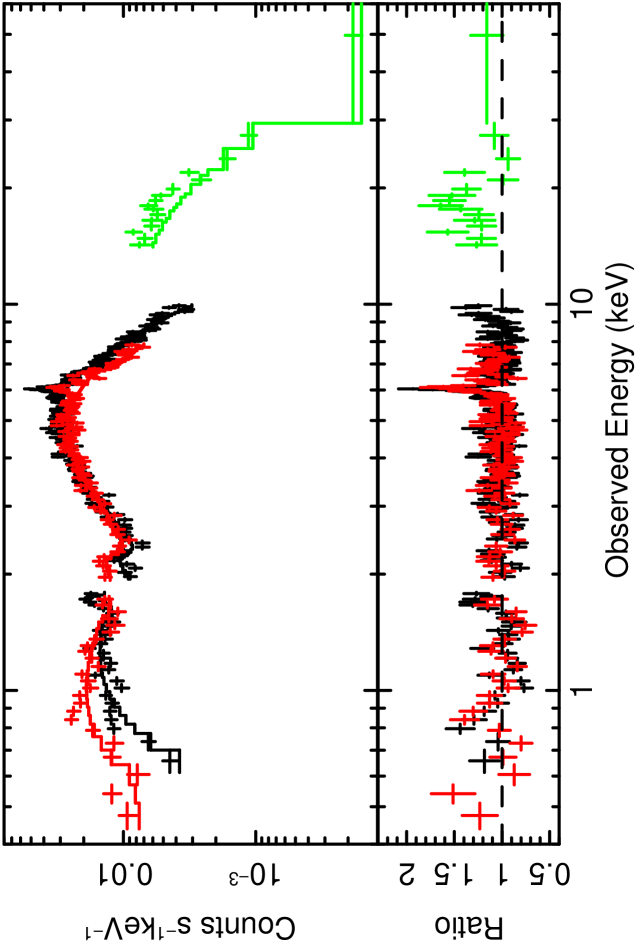
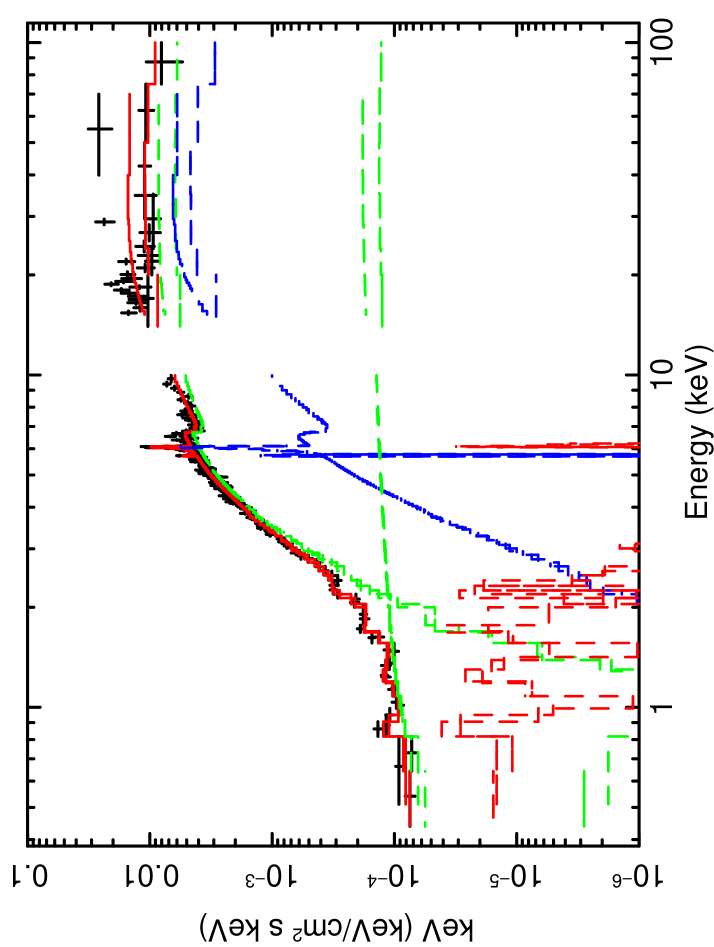
This continuum model is still too simple with respect to the broad band X-ray
emission, indeed its extrapolation under-predicts the counts collected above 10
keV (see Fig. 1). Furthermore, as seen with XMM-Newton this
model leaves strong line-like residuals at the energy of the Fe K
emission line. These residuals suggest the presence of a strong narrow core at
the expected energy of the Fe K line (6.4 keV) and a possible weak
component red-ward the narrow core at keV (observed frame), which could
be identified with the Compton shoulder (see Fig. 2). Both
these features and the hard excess seen in the spectrum above 10 keV suggest
the presence of a strong reflection component. The presence of this latter
component was already suggested with the previous BeppoSAX observation
(Dadina, 2007; Grandi et al., 2006), however taking into account the possible
contamination from a nearby cluster of galaxies (A2440, z=0.094) it was not
possible to derive strong constraints on it.
In order to obtain a better representation of the X-ray continuum, we then
fitted simultaneously the Suzaku XIS (0.4–10 keV) and HXD-PIN data (15.–
65. keV) and the Swift-BAT spectra. We set the cross-normalization factor
between the HXD and the XIS-FI spectra to 1.16, as recommended for XIS nominal
observations processed after 2008 July (Manabu et al. 2007; Maeda et al.
2008555http://www.astro.isas.jaxa.jp/suzaku/doc/suzakumemo/suzakumemo-2007-11.pdf;
http://www.astro.isas.jaxa.jp/suzaku/doc/suzakumemo/suzakumemo-2008-06.pdf), and
allowed the cross-normalization of the Swift-BAT data to vary, since the two
observations are not simultaneous.
We included in the model the Fe K
line and a Compton reflection component. At this stage this component was
modelled with the pexrav model in Xspec (Magdziarz & Zdziarski, 1995), with
the abundances set to solar values and the inclination angle to 60∘.
We note that the cluster A2440, which was thought to contaminate the X-ray emission
detected with the BeppoSAX-PDS instrument lies at the edge of the FOV of the HXD-PIN
and thus the contamination from it should be minimal. The cross-normalization with
the Swift data is consistent with one as indicated by the similar HXD and BAT
fluxes (), furthermore the slope of the Swift-BAT spectrum is
consistent with the HXD-PIN data, with no evidence of a high-energy cutoff. The
similarity in flux and shape confirm that the Suzaku HXD-PIN spectrum is
dominated by the emission of 3C 445 with no or minimal contamination from the
nearby cluster. It is worth noting that since the Swift-BAT data allow us to
extend the analysis only up to 150 keV, we cannot discriminate if the lack of any
roll over is real or simply due to the still limited bandpass and the complex
curvature of the spectrum. Indeed upon leaving the high energy cutoff free to vary
we can set only a lower limit ( keV).
The amount of reflection, defined by the subtending solid angle of the reflector
is found to be , while the parameters of the
absorbers are consistent with the values obtained with the previous model
(N cm-2 and N cm-2, and
). The photon index is now . The Fe emission line is centered at , it has an equivalent width of
with respect to the observed continuum and it is has a measured width of . We note that the inclusion of the reflection
component is not only statistically required ( for 1 dof or
), but also its strength is consistent with the
observed EW of the Fe emission line. This model gives a 2–10
keV observed flux of erg cm-2 s-1 and a intrinsic (corrected for
absorption) luminosity of erg s-1, which is similar to the
value measured with XMM-Newton and ASCA .
This model now provides a better phenomenological description 3C 445’s X-ray
continuum, however statistically the fit is still poor (),
with some residuals in the 2–10 keV band, suggesting that this model is still
too approximate for the broad band emission of 3C 445. Several line like residuals
are present at keV, in agreement with the previous detection from
ASCA and XMM-Newton (Sambruna et al., 1999, 2007; Grandi et al., 2007). Finally we note that without
the inclusion of the Swift-BAT, the overall statistics ()
and parameters, derived with this simple and phenomenological model, are similar
( and ). The reflection component is
also statistically required with the Suzaku data alone ( for
1 dof or ). A more detailed description of the modelling of
the Fe K emission line and of the overall hard X-ray spectral curvature
is provided in the sections 3.3 and 3.4; nevertheless we note that this modelling
does not strongly affect the results of the soft X-ray emission, which are
presented in the following section.
| Energy | Flux | ID | EW | ELab | |
| (keV) | (ph cm-2 s-1) | (eV) | (eV) | (keV) | |
| (1) | (2) | (3) | (4) | (5) | (6) |
| 0.54 | 15.92 | O vii He | 47.6 | 10.85 | 0.561(f); 0.569 (i); 0.574(r) |
| 0.88 | 7.37 | O viii RRC | 51.0 | 30.0 | |
| (Fe xviii- xix ) | 0.853-0.926 | ||||
| 0.99 | 2.85 | Ne x Ly | 24.0 | 7.7 | 1.022 |
| 1.36 | 1.40 | Mg xi He | 19.5 | 5.2 | 1.331(f); 1.343(i); 1.352 (r) |
| 1.80 | 2.89 | Si xiii He | 59.9 | 20.7 | 1.839(f); 1.853(i); 1.867 (r) |
| 2.33 | 1.65 | S i K | 45.7 | 9.2 | 2.307 |
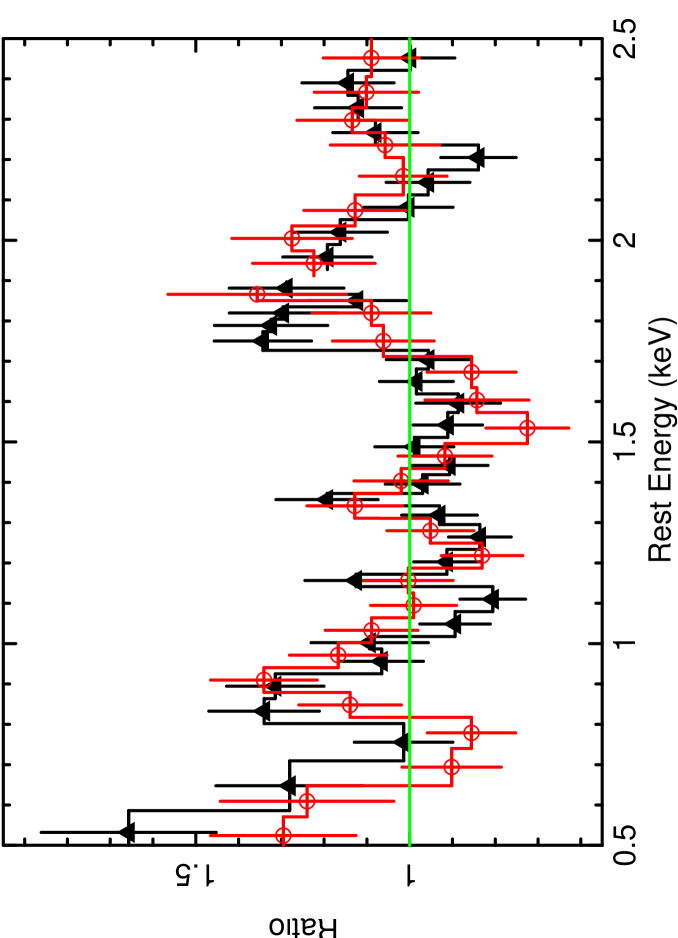
3.2 The soft X-ray spectrum
In order to model the soft X-ray emission, we allow the photon index of the soft
component to vary. The photon index of the scattered component is now found to
be slightly steeper, , and even at the CCD resolution of
the XIS instrument several lines from O, Ne, Mg and Si are clearly detected (see
Fig. 3; black and red data points). Taking into account the
lower count statistics of the soft X-ray spectrum, we decided to use a finer
binning for the XIS data adopting a minimum of 50 counts per bin. The fit
statistic of the continuum model is now . We first added
to the continuum model several narrow ( eV) Gaussian lines, allowing
also all the continuum parameters to vary; overall upon including 6 lines the
fit statistic improves and it is now (
for 12 dof). We note that the of the soft power-law is now similar to the
primary power-law component, we thus constrained the two photon indices to
be the same.
In Table 2, we list all the detected lines with their
properties, statistics and possible identification, which point toward emission
from lighter elements in particular transition of H- and He-like
O, Mg and Si. Though some of the soft X-ray emission lines are not detected with
high statistical significance (e.g. for Mg xi we have ), their detection and interpretation is in agreement with the
results obtained with the deep Chandra LETG observation (Reeves et al., 2010).
The Chandra spectrum confirms the identification of the feature detected at
0.88 keV with O viii RRC. This feature, along with the OVII
RRC at keV, are resolved by the Chandra LETG and have measured
widths which imply that the emitting gas is photo- rather than
collisionally-ionised.
Since with the Suzaku XIS CCD resolution, we cannot resolve the line triplets
and we cannot establish with high accuracy the identification of some of the
lines, and taking into account that 3C 445 is not highly variable, we adopted for
the soft X-ray emission the best fit model obtained with the Chandra LETG data.
This model includes two grids of photoionized emission models (with log
erg cm s-1 and log erg cm s-1) generated
by xstar (Kallman et al., 2004), which assumes a illuminating
continuum and a turbulence velocity of km/s and a column
density for the emitter of Ncm-2. We note that the column
density of the emitter cannot be directly measured from the spectrum because it is
degenerate with its covering factor and thus the normalisation of this component.
We thus kept the value fixed to the one adopted with the Chandra LETG analysis.
We applied this best fit model to the XIS soft spectrum, keeping the abundances
fixed to the values measured with the LETG spectrum and allowing only the
normalisations and the photon index to vary. This model is now a good
description of the soft spectrum () and no strong residuals
are present below 3 keV. As a final test, we allowed the ionisation parameter of
the two emitters to vary and found a good agreement between the Suzaku and
Chandra best-fit (log erg cm s-1 and log
erg cm s-1). We note that the presence of the
higher ionisation emitter is not statistically required (), and a
good fit is found with a single zone with log erg cm
s-1. We note also that there is still a line like residual at
keV, which cannot be modelled with these two components. We thus included in the
model an additional Gaussian line, the line is found to be keV
and could be associated with S . Finally, we note that both the
ionisation parameters and the fluxes of the ionised emitters measured with
Suzaku are consistent with the one measured with the Chandra LETG data.
The extraction region of the Suzaku XIS spectra includes the Narrow Line QSO
(1WGA J2223.7-0206), which was firstly detected by ROSAT and which is located at
about 1.3’ from the 3C 445. Its X-ray spectrum obtained with XMM-Newton was analysed
and discussed by Grandi et al. (2004). The observed X-ray flux (F (0.2-10 keV)erg cm-2 s-1 , with 80% emitted below 2 keV) was found to be comparable
in the soft X-ray band to the emission of 3C 445 and could thus, in principle,
strongly affect the Suzaku spectrum.
We note however that a contemporaneous Swift observation (of about 10 ks) of
3C 445 did not detect 1WGA J2223.7-0206 in the field of view of the Swift-XRT,
suggesting that 1WGA J2223.7-0206 was much fainter during the Suzaku observation.
We estimated an upper limit on its soft X-ray flux of erg cm-2 s-1 . We also note that the observed soft X-ray fluxes of 3C 445 measured
with Chandra and Suzaku are similar: F erg cm-2 s-1 and F erg cm-2 s-1 for the Chandra and Suzaku observation respectively. This
suggests that the X-ray emission of 1WGA J2223.7-0206 was not comparable to
3C 445, indeed the the roll angle of the Chandra observation of 3C 445 was
specifically set in order to avoid the contamination from Narrow Line QSO.
As a last check, we searched also the Chandra source catalog (Evans et al., 2010)
and the Chandra XAssist source list (Ptak & Griffiths, 2003) for X-ray bright
sources within the XIS extraction radius. Three sources are detected with a 0.3–8
keV flux greater than erg cm-2 s-1 and 1WGA J2223.7-0206 is the
brightest among them with a 0.5–8 keV flux of about erg cm-2 s-1 .
Thus we inspected the Chandra ACIS-S spectrum of 1 WGA J2223.7-0206, which has
net counts. In order to derive an estimate of the soft X-ray flux, we
fitted the Chandra data with a single absorbed power law component
(, N cm-2). We found that also
during the Chandra observation 1WGA J2223.7-0206 was fainter than during the
XMM-Newton pointing and its 0.5–2 keV observed flux was erg cm-2 s-1 .
We thus conclude that the contamination of this second AGN is minimal.
3.3 Modelling the Fe K line and the high energy emission
We then considered the hard X-ray emission of 3C 445 using for the soft X-ray
emission a single photoionised plasma plus a Gaussian emission line at keV as described above and keeping the ionisation parameter fixed to the
best fit value. For the remainder of the analysis we used again the XIS data
grouped with a minimum of 100 counts per bin. We examined simultaneously the
Suzaku XIS (0.4–10 keV) and HXD-PIN data (15.– 65. keV) and the Swift-BAT,
setting the cross-normalization factor between the HXD and the XIS-FI spectra to
1.16, and allowing the cross-normalization with the Swift data to vary, since
the two observations are not simultaneous.
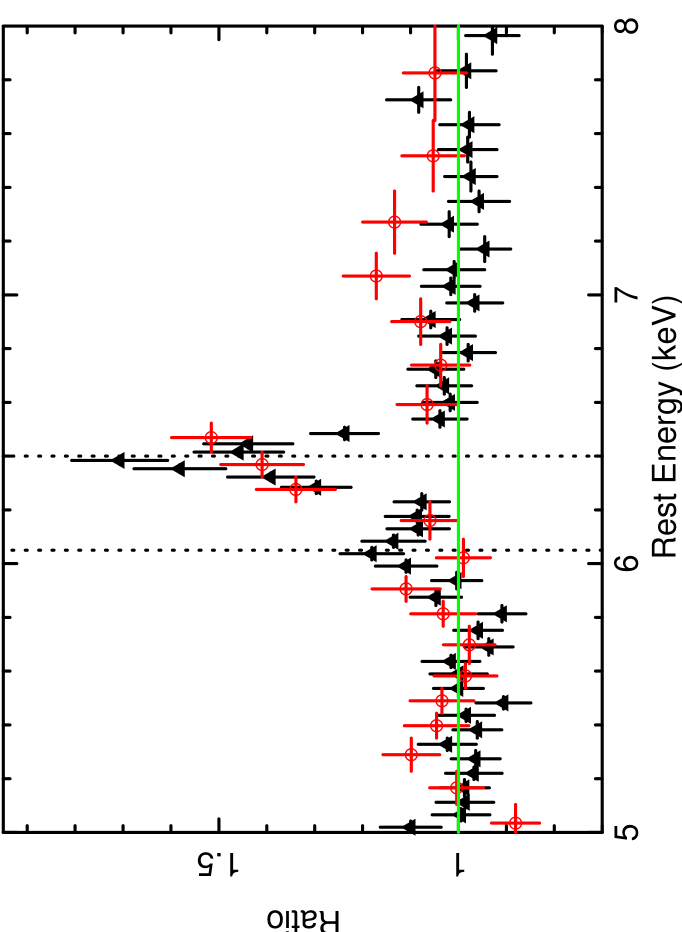
As shown in Fig. 2 the residuals at the energy of the Fe K
band clearly reveal the presence of a strong narrow core at the expected energy
of the Fe K line (6.4 keV), while no clear residuals are present at the
energy of the Fe K line. To model the Fe K line we first added a
narrow Gaussian line at the energies of Fe K; the inclusion of the line
in the model improves the fit by for 3 degrees of freedom
(). The Fe core has an equivalent width
of with respect to the observed continuum, it is
centered at and has a measured width of . As suggested by the residuals a Fe K is not
statistically required, however we found that the upper limit on its flux is
% of the Fe K line flux, consistent with the theoretical value. The
amount of reflection () is found to be consistent with the observed
EW of the Fe K line, for an inclination angle and .
Finally, we note that in the XIS-FI data, there are still some line-like residuals
red-wards the Fe K line. Upon adding a second narrow Gaussian line
the fit only marginally improves ( corresponding to for 2 dof), significant at 99.6% confidence from the F-test. If this
emission line is real the closest candidate for this feature could be the Compton
shoulder to the Fe K line. We note however that its energy ( keV) is slightly lower than the expected value of the first scattering
peak (E keV). An alternative possibility is that this line is a
redwing of a possible relativistic disk-line. Thus we replaced the Gaussian
with relativistic diskline component (DISKLINE in XSPEC;
Fabian et al., 1989); this code models a line profile from an accretion disk
around a Schwarzschild black hole. The main parameters of this model are the inner
and outer radii of the emitting region on the disk, and its inclination. The disk
radial emissivity is assumed to be a power-law, in the form of . For the
fit we fixed the emissivity and the angle to . The fit
statistic is similar to the Gaussian profile (), and we
found that the best fit parameters of this diskline corresponds to emission from an
annulus at Rg (with ) and with an EW eV. The energy of this putative line, although not well constrained, is
consistent with the ionised Fe line ( keV). Given, the lower
statistical significance and the uncertainties on the energy centroid of this
possible emission line, we will not discuss it any further.
We then replaced the pexrav and Gaussian components with a more updated model for the Compton reflection off an optically-thick photoionized slab of gas, which includes the Fe K emission line (reflionx; Ross & Fabian, 2005; Ross et al., 1999). We assumed Solar abundances, and we found the fit is equally good (). As expected the ionisation of the reflector is found to be low, erg cm s-1, in agreement with the measured energy centroid of the iron K emission line being close to the value for neutral iron (or less ionised than Fe xvii). We thus fixed the ionisation parameter to erg cm s-1, which is the lower boundary for the reflionx model. We note that the residuals at keV are still present, we thus keep in the model the additional redshifted emission line. The parameters of the absorber are consistent with the values obtained with the pexrav model (N cm-2 and N cm-2, ). The photon index is now .
| Model Component | Parameter | Value |
| Power-law | ||
| Normalisation | ||
| Scattered Component | Normalisation | |
| Absorber | NH1 | cm-2 |
| Absorber | NH2 | cm-2 |
| fcov | ||
| Ionised reflection | erg cm s-1 | |
| Normalisation | ||
| Ionised emission | Normalisation | |
| 454/406 | ||
| F (0.5-2)keV | erg cm-2 s-1 | |
| F(2-10)keV | erg cm-2 s-1 | |
| L (0.5-2)keV | erg s-1 | |
| L(2-10)keV | erg s-1 | |
| L(14-150)keV | erg s-1 |
3.4 The X-ray absorber
Assuming that the absorber is neutral the broadband X-ray emission of 3C 445 requires the presence of two absorbers one fully covering and one only partial
covering. The best fit parameters of this model, which we now consider our
best-fit neutral absorber model, are listed in Table 3. This
dual absorber plus reflection model is a good phenomenological description of
the broad band X-ray emission of 3C 445 ; however it may be too simple an
approximation of a more complex absorber. We note also that, taking into account
the optical classification of 3C 445 as type 1 AGN, the X-ray absorber is not
likely to be a neutral absorber covering a large fraction of the nuclear source as
derived with the above model. A possibility is that the absorber is mildly ionised
and thus it is partially transparent and not efficient in absorbing the optical
and soft X-ray emission.
To test this scenario, we then replaced both the partial and the fully covering
neutral absorbers with a photoionised absorber, the latter is made using a
multiplicative grid of absorption model generated with the xstar code
(Kallman et al., 2004). For simplicity we modelled the possible relativistic emission
line with an additive Gaussian component and we allowed to vary the Galactic
absorption (N cm-2). At first
we assumed a zero outflow velocity of the absorber and we tested a single zone of
absorption. The absorber is found to be mildly ionised ( erg cm s-1) and with a column density similar to the neutral absorber
N cm-2. We note also that the
fit marginally improves with respect to the neutral absorber
() and overall the model is able to reproduce the curvature
of the spectrum. The best fit parameters of this model are listed in
Table 4.
A similar ionised absorber was also found with the Chandra observation ( erg cm s-1, N cm-2); however, the
LETG spectrum of 3C 445 suggested that this absorber is outflowing with a
, indeed this solution was statistically preferred to a zero
outflow velocity (, Reeves et al. 2010). Thus we allowed the
absorber to be outflowing, but this does not statistically improve the fit
(). The parameters of this absorber (NH and ) are found to be similar to the case with no net velocity shift and albeit
it is not well constrained the outflowing velocity is found to be slightly lower
than the Chandra one ().
| Model Component | Parameter | Value |
| Power-law | ||
| Normalisation | ||
| Scattered Component | Normalisation | |
| Absorber | NH1 | cm-2 |
| erg cm s-1 | ||
| Ionised reflection | erg cm s-1 | |
| Normalisation | ||
| Ionised emission | Normalisation | |
| 443/406 | ||
| F (0.5-2)keV | erg cm-2 s-1 | |
| F(2-10)keV | erg cm-2 s-1 | |
| L (0.5-2)keV | erg s-1 | |
| L(2-10)keV | erg s-1 | |
| L(14-150)keV | erg s-1 |
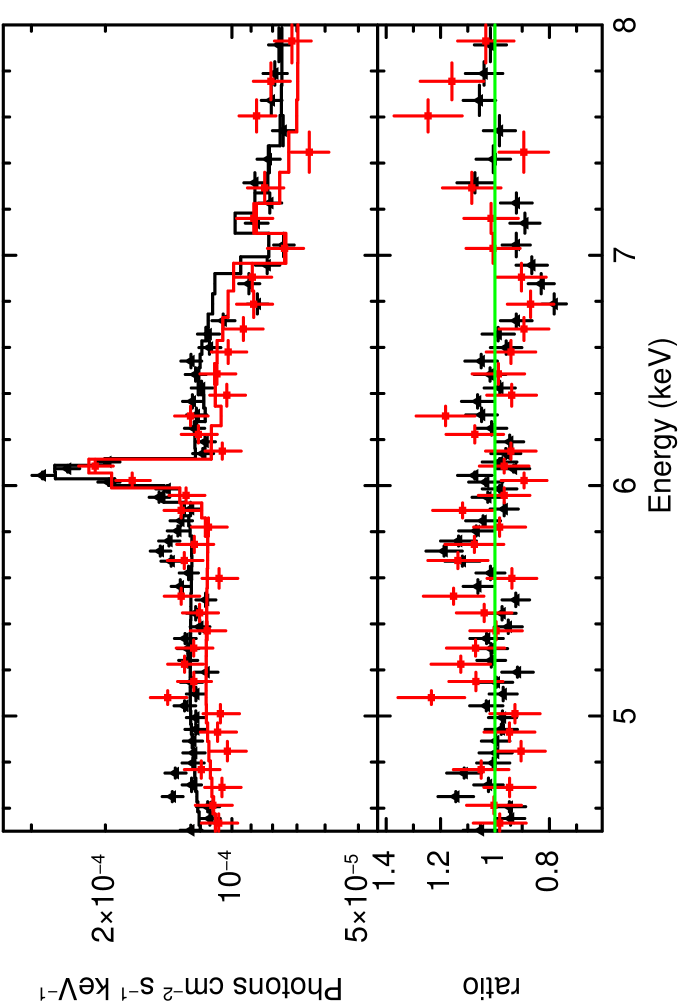
To further investigate the apparent discrepancy between the Chandra and
Suzaku’s results we performed a joint fit of the two observations. Though the
source is not highly variable we allow the relative normalisations of the primary
continuum and the parameters of the ionised absorber to vary. With this test we
found that the intrinsic emission is slightly brighter during the Suzaku observation (). As seen with the independent fit the NH and
of the ionised absorbers are found to be consistent within the two
observations (, N cm-2, erg cm s-1and
, N cm-2, erg cm s-1from the Chandra and Suzaku best fit respectively; see also Table 3 of Reeves et al. 2010) but not the
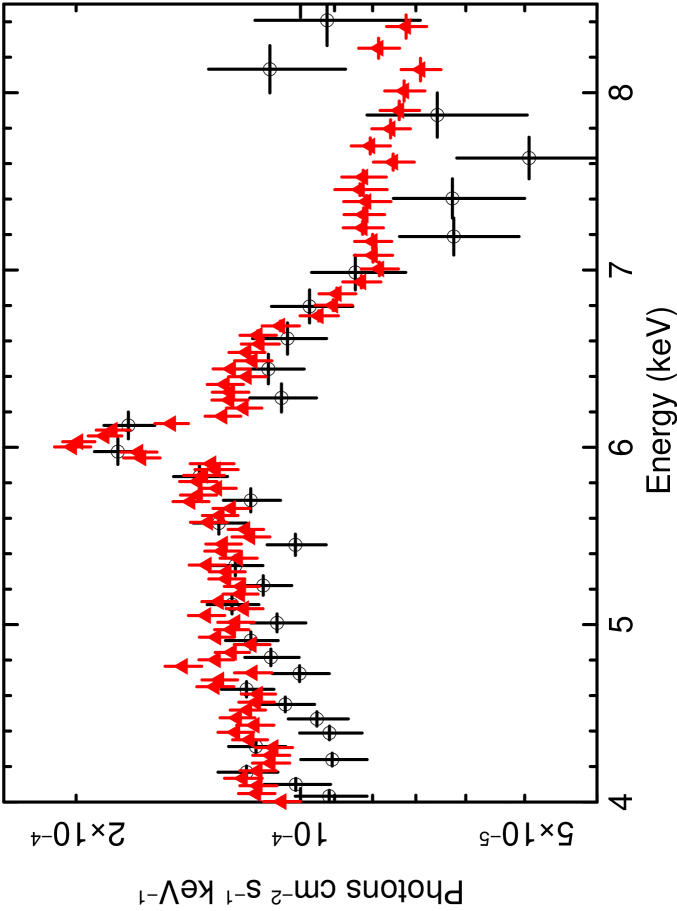
outflowing velocities. The comparison between the Chandra and Suzaku data is
shown in Fig. 4; in the Suzaku data the drop at high energies
appears to be broader and less deep. We note that there is also a possible
hint of a higher curvature of the Chandra spectrum, indeed the Chandra spectrum is below the Suzaku data also between 4–6 keV. This could be a
signature of a variation of the X-ray absorber, being less transparent during the
Chandra observation. As we show below, with the present data and taking into
account the complexity of the model we cannot confirm or rule out a modest
variability of the absorber.
As a final check we inspected the previous XMM-Newton observation, indeed also in
that observation there was a hint of a possible absorption feature at 6.9 keV
(Sambruna et al., 2007), though the underlying continuum shape was slightly different. In
particular, lacking the high energy data, the amount of reflection could not be
constrained. Taking into account, that the source did not strongly vary (in shape
and flux), between the two observations, we then simultaneously fitted the XMM-Newton and Suzaku spectra allowing the cross-normalization to vary and we tested a
single ionised absorber (with no outflowing velocity). We found that the XMM-Newton spectrum is remarkably in agreement with the Suzaku one. In particular we note
that the residuals are similar also redward the Fe K emission line.
However the short net exposure time of the XMM-Newton observation ( ksec)
prevents us from further investigating the presence of a possible redwing of a
relativistic Fe K line.
Two possible scenarios could explain the observed differences between the
Suzaku and the Chandra observations, the first is that the absorber has
indeed varied, with a lower ionisation and outflowing velocity during the Suzaku pointing. A second possibility is that the broader drop seen in Suzaku is due
to the presence of a more complex and possibly multi-phase absorber. In order to
test the second scenario we fixed the outflowing velocity of the ionised absorber
to the one seen with the Chandra observation. The fit is statistically worse
( corresponding to a ) and clear residuals
are present, both in the XMM-Newton and Suzaku spectra, at keV ( keV in the observed frame), which are reminiscent of a possible absorption
feature. Indeed, the Chandra absorption feature appears to be slightly narrower
and more blueshifted, compared to the drop in the Suzaku data. Forcing the low
ionisation absorber fitted to the Suzaku data to have the same outflow velocity
as inferred from the Chandra observation, then results in a deficit of counts
around 7 keV (observed frame) in the Suzaku and XMM-Newton spectra, when compared to
the Chandra model (see Fig. 5).
The deficit could then be modelled with an additional absorption line in the Suzaku
data, perhaps arising from a higher ionisation absorber. As a first test, using
only the Suzaku data, we included in the model an additional inverted
Gaussian, statistically the fit is similar with respect to the single ionised
absorber with no outflow velocity (). The energy of this
line is found to be keV (6.9 keV in the observed frame) and the
eV, which would imply a column density of the absorber of
about Ncm-2. The closest candidate for this absorption
feature is the transition transition of Fe xxvi
( keV) blueshifted by , while if the absorption is
associated with lower ionisation 1s-2p of Fe xxv ( keV),
the corresponding blueshift will be higher ().
We then tested a more complex model for the absorber including a second ionised
absorber and leaving free to vary the outflow velocity of this absorber, while the
outflow velocity of the mildly ionised absorber was fixed to best fit value
found with Chandra (). As for the mildly ionised absorber we used a
grid created with xstar, for this grid we assumed again solar abundances,
a illuminating continuum and, taking into account the apparent
broadening of the absorption feature, we assumed a turbulent velocity of 3000 km
s-1. The addition of this second absorber does not statistically improve
the fit with respect to the scenario with a single ionised absorber with no net
velocity shift (). This absorber if found to be fast
outflowing , highly ionised log erg cm s-1and high column
density N cm-2 (N cm-2). It is important to note that the significance of this second
absorber is hindered by the choice of the underlying continuum model and more
importantly by the choice of outflow velocity of the mildly ionised absorber.
The simplest interpretation is that there is a modest variability of the mildly ionised absorber, while we cannot rule out the presence of a second highly ionised absorber. To distinguish between these scenarios we need higher spectral resolution observations, such as the one that will be provided with the ASTRO-H calorimeter.
4 Discussion and conclusions
To summarise the Suzaku data confirm the complexity of the X-ray emission of
3C 445. The soft X-ray spectrum is dominated by several emission lines, which
require the presence of at least one ionised emitter with
erg cm s-1and which is in agreement with the results obtained with our deep
Chandra observation. The primary X-ray continuum is strongly obscured by an
absorber with a column density of cm-2, which
could be either a neutral partial covering absorber or a mildly ionised absorber.
Independently from the model assumed for the absorber, the broadband Suzaku spectrum allowed us to detect a relatively strong reflection component.
Overall, the X-ray spectrum of 3C 445 is remarkably similar to a Seyfert 2, which could be at odds with its classification as a type 1 AGN. The main characteristics resembling a Seyfert 2 are the presence of soft X-ray emission lines as well as the presence of a high column density X-ray absorber. As we will discuss in the next sections two competitive scenarios could explain the X-ray emission of 3C 445, both requiring that our line of sight is not completely blocked towards the central engine since we have evidence that we can see the emission from the Broad Line Regions (Eracleous & Halpern, 1994). We will show that our deep Suzaku observation combined with a recent Chandra observation, with the high-resolution grating LETG, strongly suggest that both the absorption and the soft X-ray lines originate within the putative torus and we are not seeing the source through a uniform and cold absorber.
4.1 The Soft X-ray emission, similarity and differences to Seyfert 2s
The Suzaku spectrum confirms the presence of several soft X-ray emission lines, as previously detected with
the XMM-Newton observation, from Oxygen, Neon, Magnesium and Silicon. In particular, we
detected a line at keV, which if associated with the O
viii RRC would strongly implies emission from a photoionized plasma
as seen in Compton-thin Seyfert galaxies (Bianchi et al., 2006; Guainazzi & Bianchi, 2007). As already
shown with the XMM-Newton observation a physical model for the observed soft X-ray
emission requires the presence of one or two ionised emitters, with ionisation
levels within the range of obscured radio-quiet AGN (Guainazzi & Bianchi, 2007).
The limited spectral resolution of the XIS data does not allow us to resolve
the lines, thus using only the Suzaku data we cannot measure the density of
this plasma and place strong constraints on the location of the emitter. However,
as 3C 445 is rather constant in flux, we could use the results obtained with the
long Chandra LETG observation, indeed assuming the same abundances we found
that the soft X-ray emission can be similarly described with two ionised emitters
with the same ionisation (log erg cm s-1 and log erg cm s-1) and luminosity as during the Chandra observation. The
Chandra data provided also the first measurement of the densities (
cm-3) and distance ( pc; Reeves et al. 2010) of these soft
X-ray emitters, which are suggestive of a location within the putative torus and
reminiscent of the Broad Line Region (BLR). Furthermore, in the Chandra data
several lines were resolved into their forbidden and intercombination line
components, and the velocity widths of the O vii and O viii
emission lines were determined ( km s-1).
Assuming Keplerian motion, this line broadening implies an origin of the gas on
sub-parsec scales (Reeves et al., 2010). 3C 445 is not an isolated example, indeed
there are other well known cases of Seyfert 1s where the soft X-ray emission lines
appear to be produced in the BLR (e.g. MKN 841, Longinotti et
al. 2010; Mrk 335,
Longinotti et
al. 2008, NGC4051, Ogle et al. 2004; NGC 5548,
Steenbrugge et
al. 2005).
Thus the emerging scenario is that the soft X-ray emission 3C 445 is not
produced in a region coincident with the optical narrow line region, as in obscured
radio quiet Seyfert galaxies. A possible origin of these lines in the BLR is also
in agreement with the multi-wavelength properties of 3C 445, indeed the optical
classification as a type 1 AGN, suggests that our line of sight toward the BLR is
not completely blocked by a high column density absorber. This photoionized
emitter also resembles the “warm gas” observed in more than 50% radio quiet
Seyferts 1 (Crenshaw et al., 2003), which acts as a “warm mirror” and at the same
time intercepts the line of sight producing absorption features. As we will
discuss below these photoionized clouds that we are seeing in emission might be
associated with the absorber responsible for the curvature of the X-ray continuum.
4.2 The X-ray absorber/reflector: a distant reflector?
The Suzaku spectrum, and in particular the data above 10 keV, allow us to confirm the
presence of a strong reflection component and for the first time to provide a measurement of its
intensity. The presence of this component was already suggested with the BeppoSAX observation
(Grandi et al., 2006; Dadina, 2007), indeed 3C 445 was detected with the PDS instrument. However,
taking into account the large field of view (FOV) of this detector and the presence of a nearby
(z=0.09) and bright cluster A2440 (located only 30’ away) it was not possible to derive strong
constraints on the amount of reflection. The presence of a strong reflection component was also
suggested by the intensity of the Fe K line detected in the BeppoSAX and in the XMM-Newton observations (EW eV Sambruna et al. 2007), which was consistent with being produced in
reflection off a medium with high column density (Turner et al., 1997; Murphy & Yaqoob, 2009).
Thanks to the smaller FOV of the HXD and more importantly to the Swift-BAT
detection we can now confirm the presence of this component. In particular both the
positional accuracy () and offset with respect to 3C 445 (’)
reported 54-month Palermo-BAT catalog (Cusumano et al. 2010) are compatible with
the emission from the center of 3C 445. As shown in Fig. 6, the
averaged Swift-BAT spectrum is in agreement with the one obtained with Suzaku.
This suggests that there is no strong variability of the intrinsic emission, but
more importantly that contamination from the nearby cluster is unlikely to be
present.
As shown in section 3.3, the amount of reflection measured is implying
a covering factor of the cold reflector of about 2 steradians. Furthermore,
as we showed in the previous section the primary X-ray emission of 3C 445 is
obscured by a high column density absorber (cm-2) with a covering
factor of about 80%. In the hypothesis that the absorber is neutral the
predicted extinction in the optical band would then far exceed the observed
reddening of the source (E Crenshaw et al. 1988). In particular a
scenario where our line of sight intercepts a homogeneous parsec scale torus is
difficult to reconcile with the observational evidence, from the soft X-ray and
optical band, that we are seeing the innermost region of this AGN. On the other
hand the inclination angle from the jet () combined with the
current estimates of the average opening angle of the “torus” implies that we
might be looking at the nucleus of 3C 445 on the edge of this putative torus.
Though we note that data with a high-resolution calorimeter at the Fe
K line energy are necessary to resolve the line complex and provide
more stringent constraints on the line width, the measured Fe K width
km s-1 is consistent with the width of the soft X-ray lines
measured with the Chandra LETG data (Reeves et al., 2010) and with the measured
FWHM of the H ( km s-1 Eracleous & Halpern 1994) and H
( km/s). The Fe K line could then be in part produced
either in the outer part of the accretion disk or in the BLR. We note however
that the relatively high EW of the Fe K line implies the presence of a
Compton thick reflector, which is also confirmed by the detection of a strong
reflection component. Indeed in order to be produced in transmission the observed
EW of Fe K requires a higher column density absorber than the one
measured with lower energy cutoff.
We thus tested the new model for the toroidal
reprocessor666http://www.mytorus.com/ (Murphy & Yaqoob, 2009), keeping the soft
X-ray emitter modelled with a single ionised zone and we found that the intensity
of the Fe K line and of the higher energy emission require the presence of
a reprocessor with a column density cm-2 viewed at , which is remarkably in agreement with the inclination
of the system as derived from the radio observations (Eracleous & Halpern, 1998). We note
however that the photon index is now harder () and there are some
residuals in the 2–5 keV band suggesting the presence of a second absorber. We
thus included a second and ionised absorber with no net outflowing velocity,
qualitatively we note that we now have an excellent representation of the overall
curvature of the X-ray emission. While the parameters of the ionised absorber are
similar to the one derived with the reflionx model, we found that
the reprocessor responsible for the Fe K line has a column density of
cm-2 and as before it is viewed at , the photon index is now . Qualitatively both these tests
show us that a high column density mirror responsible for the Fe K line
and the Compton reflection component is present and it could be associated with
the part of the putative torus lying close to the plane of the accretion disk.
One possibility is that the photoionised emission line clouds, although located
closer to the central SMBH, are lifted above the system’s equatorial plane; our
line of sight would then intercept the high column density absorber/reflector on
a sub parsec scale but also have an unobscured view of BLR emission, where the
optical and soft X-ray emission lines are produced. The alternative scenario which
is suggested by the clumpy and neutral absorber, required to model the X-ray
emission of 3C 445, is that the absorber/reflector is not a uniform “donut-like”
structure and as proposed in recent models (Risaliti et al., 2002; Elitzur, 2008; Maiolino et al., 2010) is clumpy and composed by many small and dense clouds, which
could extend further in with respect to putative torus and are not simply
obscuring the BLR but are part of the BLR themselves
(Risaliti et al., 2009a, b). In this hypothesis our line of sight could
then intercept a rather large number of clouds, which absorb/reflect the
primary continuum but at the same time may also produce the the broad emission
lines from innermost ionised clouds.
4.3 The nature of the X-ray absorber: a variable ionised absorber?
As shown in section 3.4, an alternative scenario to a clumpy and neutral
absorber is an ionised absorber. This scenario naturally accounts for the
discrepancy between the optical and the X-ray band, indeed this mildly ionised
absorber could be similar to the warm absorbers observed in the X-ray spectra of
radio quiet AGN (Crenshaw et al., 2003; Blustin et al., 2005; McKernan et al., 2007; Turner & Miller, 2009), which
appear to be outflowing with velocity of 100-1000 km/s and could be associated
with the presence of disk winds (King & Pounds, 2003).
As discussed in a companion paper (Reeves et al. 2010) the presence of an
ionised absorber, with the same ionisation level and column density, associated
with a disk wind is strongly supported by the deep observation with high spectral
resolution which provides more stringent constraints on the velocity of this
absorber () and on the launch radius (cm). As also shown in that paper at this distance the likely
density of the absorbing gas would be cm-3, which would
imply a cm and a and thus
suggesting a highly clumped absorber. It was also suggested that the clumpiness
of this absorber would produce short-timescale variations of the observed column
density, as seen in other Seyferts.
Indeed, the observed difference between the Chandra and Suzaku spectra could
be explained with variability of this low ionisation absorber, not in terms of the
covering factor or of the absorber but in terms of its velocity.
This is not surprising indeed not only red- and blueshifted absorption lines are
predicted in several theoretical models of failed disk winds
(Proga & Kallman, 2004; Sim et al., 2010) or of aborted jet (Ghisellini et al., 2004) but also
these models predict the outflows to be unstable and to show variability. In
particular, outflows and jets could be produced intermittently and/or they
could not have enough power to escape the system and eventually fall back into the
accretion disk. This will affect the expected signatures that this warm gas
imprints on the primary X-ray emission, which will produce transient absorption
features and variability of the derived outflowing velocities and their EW as
observed in several sources (Braito et al. 2007; Porquet et al. 2007; Dadina et al. 2005; Risaliti et al. 2005; Turner et al. 2008, 2010; Miller et al. 2010; Lobban et al. 2010).
An alternative scenario ascribes the difference between Chandra and Suzaku spectra to a further ionised and fast outflowing absorption component, detected
only with the Suzaku observation and characterised by a high ionisation
and column density (cm-2). In this scenario the
properties of the low ionisation absorber are thus the same as the one derived with
the Chandra observation (i.e., distance cm and
clumpiness ). For the high ionisation absorber,
although in the Suzaku data the parameters of this absorber not well
constrained, we can derive a order of magnitude estimate on its likely
location from the values measured for the ionisation parameter (
erg cm s-1), the outflow velocity () and the column
density. We can thus use the relation between these quantities and the
illuminating continuum luminosity: , where
is the intrinsic 1–1000 Rydberg luminosity ( erg s-1), assuming the thickness of the clouds is less
than the distance R, we found cm (or
0.001 pc), which points towards an association of this absorbers with a wind
launched off the disk at a sub-parsec distance from the central BH.
We note that both these ionised absorber scenarios imply that we are seeing a clumpy and possibly variable absorber located close to the central X-ray source. This could be associated with the presence of a disk wind which either is launched sporadically or it is highly clumped. However, in the absence of any stringent constraints on the launch radius we cannot speculate more as to whether these two absorbers are part of a single clumpy wind, where the lower ionisation component is associated to higher density clouds confined in the homogeneous highly ionised flow, or if the two components are part of single stratified medium. In order to determine whether it is a single and variable ionised absorber or a multi-phase wind would require higher resolution observations with instruments such as the calorimeter which will fly with Astro-H. These observations will allow to establish the complex nature and kinematics of this absorber confirming the presence of blueshifted absorption lines from highly ionised iron.
5 Conclusion
We have presented the results of a deep Suzaku observation of the BLRG 3C 445
which shows a complex absorbed X-ray spectrum. We confirm the results obtained with
the previous XMM-Newton observation which unveiled the presence of several soft X-ray
emission lines. The Suzaku and Swift spectra allowed us to measure a strong
reflection component, which we associate with the presence of a high column density
matter which is not in the line of sight. The primary X-ray continuum is strongly
absorbed either by a partially covering neutral or a mildly ionised absorber,
which could be associated with an accretion disk wind.
Regarding the overall geometry of 3C 445, we know from the radio observations
that we are seeing the central regions of this AGN at a relatively large
inclination. A plausible scenario is that we are viewing along the edge of the
putative torus through either a partially covering neutral absorber or mildly
ionised absorber, which could be associated with an equatorial disk-wind. In
both the scenarios with an ionised or neutral absorber, the matter needs to be
clumped, such as that the observer has a direct view of the clouds responsible of
the soft X-ray and optical lines, which could be in part uplifted with respect to
the equatorial plane. A possible schematic diagram for the geometry of the
inner regions of 3C 445 is presented in Figure 8 of Reeves et al. 2010, a new
addition to that schematic view is that Suzaku provided evidence for the presence
also of a Compton-thick reflector. We find no evidence that our line of sight
intercepts this Compton-thick absorber which is responsible for the reflected
component and Fe K line. This absorber could be either associated with
denser clouds probably located in the equatorial plane of the torus or of the
clumpy absorber or the outer part of the disk-wind.
Acknowledgments
This research has made use of data obtained from the Suzaku satellite and data obtained from the High Energy Astrophysics Science Archive Research Center (HEASARC), provided by NASA’s Goddard Space Flight Center. VB acknowledge support from the UK STFC research council.
References
- Antonucci (1993) Antonucci, R. 1993, ARA&A, 31, 473
- Ballantyne et al. (2002) Ballantyne, D. R., Fabian, A. C., & Ross, R. R. 2002, MNRAS, 329, L67
- Ballantyne (2007) Ballantyne, D. R. 2007, Modern Physics Letters A, 22, 2397
- Baumgartner et al. (2010) Baumgartner et al. 2010 ApJS submitted
- Bianchi et al. (2006) Bianchi, S., Guainazzi, M., & Chiaberge, M. 2006, A&A, 448, 499
- Boldt (1987) Boldt, E. 1987, Phys. Rep., 146, 215
- Braito et al. (2007) Braito, V., et al. 2007, ApJ, 670, 978
- Brinkman et al. (2000) Brinkman, A. C., et al. 2000, ApJ, 530, L111
- Blustin et al. (2005) Blustin, A. J., Page, M. J., Fuerst, S. V., Branduardi-Raymont, G., & Ashton, C. E. 2005, A&A, 431, 111
- Cattaneo et al. (2009) Cattaneo, A., et al. 2009, Nature, 460, 213
- Corbett et al. (1998) Corbett, E. A., Robinson, A., Axon, D. J., Young, S., & Hough, J. H. 1998, MNRAS, 296, 721
- Crenshaw et al. (1988) Crenshaw, D. M., Peterson, B. M., & Wagner, R. M. 1988, AJ, 96, 1208
- Crenshaw et al. (2003) Crenshaw, D. M., Kraemer, S. B., & George, I. M. 2003, ARA&A, 41, 117
- Cusumano et al. (2010) Cusumano, G., et al. 2010, A&A, 510, A48
- Dadina et al. (2005) Dadina, M., Cappi, M., Malaguti, G., Ponti, G., & de Rosa, A. 2005, A&A, 442, 461
- Dadina (2007) Dadina, M. 2007, A&A, 461, 1209
- Dickey & Lockman (1990) Dickey, J. M., & Lockman, F. J. 1990, ARA&A, 28, 215
- Eracleous & Halpern (1998) Eracleous, M., & Halpern, J. P. 1998, ApJ, 505, 577
- Eracleous & Halpern (1994) Eracleous, M., & Halpern, J. P. 1994, ApJS, 90, 1
- Elvis (2006) Elvis, M. 2006, Mem. Soc. Astron. Italiana, 77, 573
- Elitzur (2008) Elitzur, M. 2008, New A Rev., 52, 274
- Evans et al. (2010) Evans, I. N., et al. 2010, ApJS, 189, 37
- Fabian (2010) Fabian, A. C. 2010, IAU Symposium, 267, 341
- Fabian et al. (1989) Fabian, A. C., Rees, M. J., Stella, L., & White, N. E. 1989, MNRAS, 238, 729
- Grandi et al. (2004) Grandi, P., Foschini, L., Masetti, N., & Palazzi, E. 2004, A&A, 418, 907
- Grandi et al. (2006) Grandi, P., Malaguti, G., & Fiocchi, M. 2006, ApJ, 642, 113
- Grandi et al. (2007) Grandi, P., Guainazzi, M., Cappi, M., & Ponti, G. 2007, MNRAS, 381, L21
- Gruber et al. (1999) Gruber, D. E., Matteson, J. L., Peterson, L. E., & Jung, G. V. 1999, ApJ, 520, 124
- Ghisellini et al. (2004) Ghisellini, G., Haardt, F., & Matt, G. 2004, A&A, 413, 535
- Guainazzi & Bianchi (2007) Guainazzi, M., & Bianchi, S. 2007, MNRAS, 374, 1290
- King & Pounds (2003) King, A. R., & Pounds, K. A. 2003, MNRAS, 345, 657
- Kallman et al. (2004) Kallman, T. R., Palmeri, P., Bautista, M. A., Mendoza, C., & Krolik, J. H. 2004, ApJS, 155, 675
- Kinkhabwala et al. (2002) Kinkhabwala, A., et al. 2002, ApJ, 575, 732
- Koyama et al. (2007) Koyama, K., et al. 2007, PASJ, 59, 23
- Kokubun et al. (2007) Kokubun, M., et al. 2007, PASJ, 59, 53
- Kronberg et al. (1986) Kronberg, P. P., Wielebinski, R., & Graham, D. A. 1986, A&A, 169, 63
- Liedahl (1999) Liedahl, D. A. 1999, LNP Vol. 520: X-Ray Spectroscopy in Astrophysics, 520, 189
- Liedahl & Paerels (1996) Liedahl, D. A., & Paerels, F. 1996, ApJ, 468, L33
- Leahy et al. (1997) Leahy, J. P., Black, A. R. S., Dennett-Thorpe, J., Hardcastle, M. J., Komissarov, S., Perley, R. A., Riley, J. M., & Scheuer, P. A. G. 1997, MNRAS, 291, 20
- Longinotti et al. (2008) Longinotti, A. L., Nucita, A., Santos-Lleo, M., & Guainazzi, M. 2008, A&A, 484, 311
- Longinotti et al. (2010) Longinotti, A. L., et al. 2010, A&A, 510, A92
- Magdziarz & Zdziarski (1995) Magdziarz, P., & Zdziarski, A. A. 1995, MNRAS, 273, 837
- Maiolino et al. (2010) Maiolino, R., et al. 2010, A&A, 517, A47
- Mewe et al. (1985) Mewe, R., Gronenschild, E. H. B. M., & van den Oord, G. H. J. 1985, A&AS, 62, 197
- McKernan et al. (2007) McKernan, B., Yaqoob, T., & Reynolds, C. S. 2007, MNRAS, 379, 1359
- Miller et al. (2010) Miller, L., Turner, T. J., Reeves, J. N., Lobban, A., Kraemer, S. B., & Crenshaw, D. M. 2010, MNRAS, 403, 196
- Mitsuda et al. (2007) Mitsuda, K., et al. 2007, PASJ, 59, 1
- Murphy et al. (1996) Murphy, E. M., Lockman, F. J., Laor, A., & Elvis, M. 1996, ApJS, 105, 369
- Murphy & Yaqoob (2009) Murphy, K. D., & Yaqoob, T. 2009, MNRAS, 397, 1549
- Narayan & Yi (1995) Narayan, R., & Yi, I. 1995, ApJ, 444, 231
- Ogle et al. (2004) Ogle, P. M., Mason, K. O., Page, M. J., Salvi, N. J., Cordova, F. A., McHardy, I. M., & Priedhorsky, W. C. 2004, ApJ, 606, 151
- Porquet et al. (2007) Porquet, D., et al. 2007, A&A, 473, 67
- Proga & Kallman (2004) Proga, D., & Kallman, T. R. 2004, ApJ, 616, 688
- Ptak & Griffiths (2003) Ptak, A., & Griffiths, R. 2003, Astronomical Data Analysis Software and Systems XII, 295, 465
- Reeves et al. (2009) Reeves, J. N., Sambruna, R. M., Braito, V., & Eracleous, M. 2009, ApJ, 702, L187
- Reeves et al. (2010) Reeves, J. N., Gofford, J., Braito, V., & Sambruna, R. 2010, ApJ, 725, 8
- Reeves & Turner (2000) Reeves, J. N., & Turner, M. J. L. 2000, MNRAS, 316, 234
- Risaliti et al. (2002) Risaliti, G., Elvis, M., & Nicastro, F. 2002, ApJ, 571, 234
- Risaliti et al. (2005) Risaliti, G., Bianchi, S., Matt, G., Baldi, A., Elvis, M., Fabbiano, G., & Zezas, A. 2005, ApJ, 630, L129
- Risaliti et al. (2009a) Risaliti, G., et al. 2009, MNRAS, 393, L1
- Risaliti et al. (2009b) Risaliti, G., et al. 2009, ApJ, 696, 160
- Ross et al. (1999) Ross, R. R., Fabian, A. C., & Young, A. J. 1999, MNRAS, 306, 461
- Ross & Fabian (2005) Ross, R. R., & Fabian, A. C. 2005, MNRAS, 358, 211
- Rudy & Tokunaga (1982) Rudy, R. J., & Tokunaga, A. T. 1982, ApJ, 256, L1
- Sambruna et al. (2009) Sambruna, R. M., et al. 2009, ApJ, 700, 1473
- Sambruna et al. (1998) Sambruna, R. M., George, I. M., Mushotzky, R. F., Nandra, K., & Turner, T. J. 1998, ApJ, 495, 749
- Sambruna et al. (1999) Sambruna, R. M., Eracleous, M., & Mushotzky, R. F. 1999, ApJ, 526, 60
- Sambruna et al. (2002) Sambruna, R. M., Eracleous, M., & Mushotzky, R. F. 2002, New Astronomy Review, 46, 215
- Sambruna et al. (2007) Sambruna, R. M., Reeves, J. N., & Braito, V. 2007, ApJ, 665, 1030
- Sim et al. (2010) Sim, S. A., Proga, D., Miller, L., Long, K. S., & Turner, T. J. 2010, MNRAS, 408, 1396
- Spergel et al. (2003) Spergel, D. N., et al. 2003, ApJS, 148, 175
- Steenbrugge et al. (2005) Steenbrugge, K. C., et al. 2005, A&A, 434, 569
- Takahashi et al. (2007) Takahashi, T., et al. 2007, PASJ, 59, 35
- Tombesi et al. (2010) Tombesi, F., Sambruna, R. M., Reeves, J. N., Braito, V., Ballo, L., Gofford, J., Cappi, M., & Mushotzky, R. F. 2010, ApJ, 719, 700
- Torresi et al. (2009) Torresi, E., Grandi, P., Guainazzi, M., Palumbo, G. G. C., Ponti, G., & Bianchi, S. 2009, A&A, 498, 61
- Torresi et al. (2010) Torresi, E., Grandi, P., Longinotti, A. L., Guainazzi, M., Palumbo, G. G. C., Tombesi, F., & Nucita, A. 2010, MNRAS, 401, L10
- Tueller et al. (2010) Tueller, J., et al. 2010, ApJS, 186, 378
- Turner et al. (1997) Turner, T. J., George, I. M., Nandra, K., & Mushotzky, R. F. 1997, ApJ, 488, 164
- Turner et al. (2005) Turner, T. J., Kraemer, S. B., George, I. M., Reeves, J. N., & Bottorff, M. C. 2005, ApJ, 618, 155
- Turner et al. (2008) Turner, T. J., Reeves, J. N., Kraemer, S. B., & Miller, L. 2008, A&A, 483, 161
- Turner & Miller (2009) Turner, T. J., & Miller, L. 2009, A&A Rev., 17, 47
- Turner et al. (2010) Turner, T. J., Miller, L., Reeves, J. N., Lobban, A., Braito, V., Kraemer, S. B., & Crenshaw, D. M. 2010, ApJ, 712, 209