Earth-based detection of the millimetric thermal emission of the nucleus of comet 8P/Tuttle††thanks: Based on observations carried out with the IRAM Plateau de Bure Interferometer. IRAM is supported by INSU/CNRS (France), MPG (Germany) and IGN (Spain).
Abstract
Context. Little is known about the physical properties of cometary nuclei. Apart from space mission targets, measuring the thermal emission of a nucleus is one of the few means to derive its size, independently of its albedo, and to constrain some of its thermal properties. This emission is difficult to detect from Earth but space telescopes (Infrared Space Observatory, Spitzer Space Telescope, Herschel Space Observatory) allow reliable measurements in the infrared and the sub-millimetre domains.
Aims. We aim at better characterizing the thermal properties of the nucleus of comet 8P/Tuttle using multi-wavelentgh space- and ground-based observations, in the visible, infrared, and millimetre range.
Methods. We used the Plateau de Bure Interferometer to measure the millimetre thermal emission of comet 8P/Tuttle at 240 GHz (1.25 mm) and analysed the observations with the shape model derived from Hubble Space Telescope observations and the nucleus size derived from Spitzer Space Telescope observations.
Results. We report on the first detection of the millimetre thermal emission of a cometary nucleus since comet C/1995 O1 Hale-Bopp in 1997. Using the two contact spheres shape model derived from Hubble Space Telescope observations, we constrained the thermal properties of the nucleus. Our millimetre observations are best match with: i) a thermal inertia lower than 10 J K-1 m-2 s-1/2, ii) an emissivity lower than 0.8, indicating a non-negligible contribution of the colder sub-surface layers to the outcoming millimetre flux.
Key Words.:
Comet: individual: 8P/Tuttle – Radio continuum: planetary systems – Techniques: interferometric1 Introduction
Much of the scientific interest in comets stems from their potential role in elucidating the processes responsible for the formation and evolution of the Solar System. They appeared in the outer regions of the protoplanetary disk, when the giant planets were formed by core-accretion (Safronov & Zvjagina, 1969; Pollack et al., 1996) or disk instability (Cameron, 1978; Boss, 2003). Together with the asteroids, Centaurs, and transneptunian objects, comets are the remnants of the planetesimals not accumulated into the planets. Comets formed in the giant planets region were ejected to the outer Solar System and form the Oort Cloud. Some of them return to the inner Solar System as long-period comets (now called nearly isotropic comets NIC, Duncan et al., 1988), such as C/1995 O1 Hale-Bopp, or become periodic comets after several perihelion passages and shortening of their orbit due to gravitational perturbations. The later ones constitute the Halley-family comets (or returning NIC) to which 1P/Halley and 109P/Swift-Tuttle are significant representatives. Comet 8P/Tuttle also belongs to this group: its orbit has a high ecliptical inclination (55∘) with a short period (13.5 years). On the other hand, it is believed that the Kuiper Belt, gravitationally influenced by the outer planets, supplied the population of Jupiter-family short-period comets (now called ecliptic comets EC, Duncan et al., 1988). Comets 19P/Borrelly and 9P/Tempel 1, investigated by the Deep Space 1 and Deep Impact missions respectively, are typical comets of this category.
Given their different origins and the different evolution schemes followed since their formation, one could expect to observe different physical properties for the NICs and ECs. For the time being, no obvious correlation between the chemical and physical properties of a comet and its dynamical class has been measured (Crovisier et al., 2009).
One of the possible ways to investigate differences between the two classes of comets is to measure their size distribution. Reliable size determinations have been obtained for only 13 NICs (Lamy et al., 2004), using ground- and space-based telescopes in the visible and infrared domain. The range of radii is surprisingly broad, from 0.4 to 37 km, much broader than that of the ECs but with only 13 objects, robust conclusions cannot be drawn. Further measurements are required to confirm this trend. In this context, it is important to develop new methods to obtain reliable size estimates from the Earth. The millimetre wavelength range is well suited for this purpose because the atmospheric transmission is better than in the infrared, and also because the ALMA observatory will offer unique observing capabilities in the near future. However, the flux of a comet nucleus is much lower in the millimetre domain than in the infrared, and observations are still challenging and reserved to a few bright comets. When available, data sets at different wavelengths (visible, infrared, millimetre) complete one another and allow detailed studies of the nucleus properties.
Comet 8P/Tuttle was observed in 1992 using the Nordic Optical Telescope (NOT) at 6.3 AU from the Sun and appeared inactive at this time. From its apparent magnitude, the nucleus diameter was estimated to 15.6 km (Licandro et al., 2000), but photographic observations performed in 1980 at 2.3 AU suggested a nucleus 3 times smaller or highly elongated. The close approach to the Earth in December 2007-January 2008 (0.25 AU) and its supposed large size made it a very interesting target for Earth based observations. In 2007-2008, the comet was observed with different techniques in the visible (lightcurve measurements with the Hubble Space Telescope (HST), Lamy et al., 2010b), the infrared (Spitzer Space Telescope (SST) observations, Groussin et al., 2008, 2010) and the radio domains (radar experiments with Arecibo, Harmon et al., 2010). To complement this multi-wavelength set of observations, we observed comet 8P/Tuttle with the Plateau de Bure Interferometer to measure the millimetre thermal emission of its nucleus. The only similar measurement of a comet nucleus was performed more than 10 years ago, in 1997 for comet Hale-Bopp (Altenhoff et al., 1999), which demonstrates the difficutly of such observations and the unique opportunity offered by comet 8P/Tuttle.
In this paper we present the results of our observations of comet 8P/Tuttle carried out with the Plateau de Bure interferometer at 1.25 mm (240 GHz) in December 2007-January 2008. A description of the observations is given in Sect. 2. We analysed the data using a shape model of Lamy et al. (2010b) and a thermal model of the nucleus, which are described in Sect. 3. The results are presented in Sect. 4 and summarized in Sect. 5.
2 Observations
| Date | UT | Ephemeris | rh | Fluxb | ||
|---|---|---|---|---|---|---|
| h | AU | AU | mJy | |||
| 29 Dec. 2007 | 15–19 | JPL K074/19 | 0.26 | 1.11 | 54∘ | 2.40.7 |
| 08 Jan. 2008 | 15–17 | JPL K074/21 | 0.28 | 1.06 | 65∘ | 3.00.5 |
a Phase angle of the observations
b The flux and its uncertainty are measured by a fit of a point source to the observed visibilities. The absolute flux calibration adds an uncertainty of 20%.
Comet 8P/Tuttle has been observed twice at a wavelength of 1.25 mm (240 GHz) with the IRAM interferometer on 29 December 2007 and 8 January 2008 (Table 1). The IRAM interferometer is a 6 antennas (15 m each) array located at the Plateau de Bure, in the French Alps, and equipped with heterodyne, dual polarization, receivers operating around 1, 2 and 3 mm (230, 150, and 100 GHz, respectively). On both observing dates the array was set in a compact configuration with baseline lengths ranging from 20 to 150 m. This results in a synthesized beam diameter of about 1.2″ at 240 GHz. The whole calibration process was performed using the GILDAS software packages developed by IRAM (Pety, 2005).
29 Dec. 2007:
For this first attempt, the comet was tracked using an ephemeris computed using the JPL solution K074/19 for its orbital elements. The instrument was tuned in a way to search for CH3OH lines around 241 GHz: 4 narrow correlator units were dedicated to the CH3OH lines, and a total bandwidth of 1.2 GHz was used to measure the continuum emission of the comet. 8P/Tuttle was observed from 15 h to 23 h UT, under correct conditions (system temperature of 200 K and a phase rms of 30∘) during the first half, until 19 h UT. The second half of the observations suffered bad conditions (unstable phase, cloudy weather) and is not usable. The final dataset represents 1.6 h on source aquired between 15 h UT and 19 h UT. The gain calibration sources (observed every 22 minutes to monitor the instrumental and atmospheric phase and amplitude variations) were 0133+476 and 0059+581. MWC349 was used to determine the absolute flux scale. The pointing and focus corrections were measured every 40 and 80 minutes, respectively. Some single dish spectra of the CH3OH lines were recorded all along the observing period. The sky contribution was cancelled in position switching mode (ON-OFF), with a OFF position distant of 5’ from the comet. We do not retrieve any CH3OH line detection in interferometric mode but the lines were detected in the ON–OFF spectra. Their analysis is presented in Biver et al. (2008), together with other single dish observations of 8P/Tuttle.
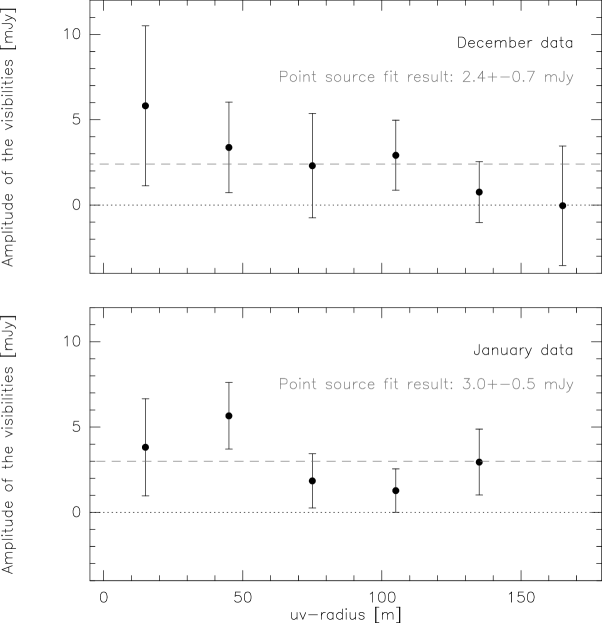
Given the distance of the comet, the apparent diameter of a nucleus with a radius of 10 km is about 0.1″ and we do not expect to resolve the nucleus of 8P/Tuttle in the Plateau de Bure data. As a result, we analysed the continuum observations in the Fourier plane, fitting the Fourier Transform (FT) of a point source to the observed visibilities. We measure a flux mJy located at an offset of (–0.5″,–1.4″) in (RA, Dec) with respect to the pointed position (the astrometric precision, estimated dividing the beam size by the signal to noise ratio, is ″). Compared to the latest ephemeris solution (JPL K074/27, including observations performed up to october 2008) the offset is (0.4″,3.8″). To illustrate the result of this fit, we present in Fig. 1 the real part of the visibilities as a function of the uv-radius. The visibility table has been shifted to the position where the point source was found in the fit, so that the imaginary part of the visibilities is null and their real part is the source flux. On the figure, the real part of the visibilities has been averaged in 30 m bins in uv-radius. We overplot the point source flux that was found by the fitting procedure. The absolute flux calibration adds an uncertainty of 20% on both the flux and its uncertainty. We estimate the overall limits as mJy and mJy. From this we deduce the final flux and corresponding errorbars mJy.
08 Jan. 2008:
An updated solution of orbital elements (JPL K074/21) was used to compute the ephemeris of the comet at this date. Our single dish observations of the comet at the IRAM-30 m telescope (in early January, Biver et al., 2008) showed that its gas production was not sufficient to enable interferometric study of the coma. As a result we dedicated all the correlator units of the Plateau de Bure to continuum observations for this second run, without changing the observing frequency 240 GHz. This results in a bandwidth of 2 GHz, which represents a gain of a factor 1.3 in point source sensitivity with respect to the December observations. The comet was observed from 15 h UT to 21 h UT, under poor, degrading with time, phase stability conditions (a system temperature of 200 K and a phase rms of 30–100∘, depending on the baseline length). As a result we use in the analysis only the 2 first hours of observations (1.3 h on source), when the conditions were the best. Although the integration time is longer for the December observing run, the larger bandwidth in January results in a lower thermal noise for this dataset. The gain calibration sources were 0235+164 and 0048-097 and 3C454.3 was used as a reference to determine the absolute flux scale.
Fitting the FT of a point source to the observed visibilities in the Fourier plane, we retrieve a flux of 3.00.5 mJy located at an offset of (1.4″,–0.1″) in (RA, Dec) with respect to the pointed position (the astrometric precision is ″). Compared to the latest solution (JPL K074/27) the offset is (1.8″,1.2″). This result is illustrated with the real part of the visibilities presented as a fuction of the uv-radius in Fig. 1. Taking into account the flux calibration uncertainty, we obtain a flux of mJy (1) or mJy (3). In the following analysis, we only use the flux measured on January 8, as it offers a better signal to noise ratio.
We assume that the detected emission is solely due to the nucleus thermal emission. The contribution of dust thermal emission is expected to be weak, based on previous observations of the dust continuum in the millimetre and submillimetre domains (e.g. Jewitt & Luu, 1992; Jewitt & Matthews, 1997). For exemple, using the JCMT (HPBW = 19 ″) Jewitt & Matthews (1997) measured a flux of 6.4 mJy at 350 m for comet C/1996 B2 (Hyakutake) at = 1.08 AU and AU. Assuming that the dust opacity varies according to (Jewitt & Matthews, 1997) and that the dust brightness distribution varies according to , where is the distance to nucleus, we derive a dust flux at 240 GHz of 0.05 mJy for a beam size of 1″and a geocentric distance of 0.26 AU. The gaseous activity of 8P/Tuttle in early January 2008 was typically 5–10 times lower that the activity of Hyakutake at = 1.08 AU (Mumma et al., 1996; Bonev et al., 2008; Kobayashi et al., 2010). Hence, the contribution of the dust emission to the detected flux at 240 GHz in comet 8P/Tuttle should not exceed 0.01 mJy, compared to the 3.0 mJy of the nucleus.
3 Nucleus thermal Model
3.1 Shape model
Harmon et al. (2008, 2010) interpreted their Arecibo radar observations of the nucleus of comet 8P/Tuttle as implying a contact binary and proposed a shape model composed of two spheroids in contact. Lamy et al. (2010b) found that the light curve of the nucleus derived from their Hubble Space Telescope observations indeed was best explained by a binary configuration and derived a model composed of two spheres in contact. However these two models profoundly differ first in the direction of the rotational axis and second, in the size ratio of the two components of the nucleus. Groussin et al. (2010) used both shape models to interpret Spitzer Space Telescope thermal light curves of the nucelus and concluded that the shape model of Lamy et al. (2010b) better matches the SST observations.
The shape model of Lamy et al. (2010b) consists of two contact spheres with respective radii of 2.60.1 km and 1.10.1 km; a sphere with a radius of 2.8 km would have the same cross-section. The pole orientation is RA = 285∘ and Dec = +20∘, which gives an aspect angle (defined as the angle between the spin vector and the comet-Earth vector) of 82∘ on 29 Dec. 2007 and 103∘ on 08 Jan. 2008, close to an equatorial view. The rotational period is 11.4 h (Lamy et al., 2008) in this model. Harmon et al. (2010) derived a more precise value of the period based on the radar experiments carried out at Arecibo: 11.3850.004 h. By rotating the nucleus back from the radar epoch to the HST epoch, we were able to connect the rotation phases and thus determine the true or sidereal rotation period = 11.4440.001 h (see Lamy et al., 2010b).
In view of the above discussion we used two different shape models for our analysis: i) a simple spherical shape model with a radius of 2.8 km and ii) the more complex and realistic shape model of Lamy et al. (2010b), made of two contact spheres. In the later model, the shape is divided into 2560 triangular facets of comparable size. We consider the size for these two shape models as robust, so that it is a fixed parameter.
3.2 Thermal model
The interpretation of the millimetric observations requires a thermal model for the nucleus. We used the thermal model presented in Groussin et al. (2010) for comet 8P/Tuttle and already extensively described in several past articles (e.g., Groussin et al., 2004; Lamy et al., 2010a). For each facet of the shape model, we solve for the surface energy balance between the flux received from the Sun, the re-radiated flux, and the heat conduction into the nucleus. As the nucleus rotates around its spin axis, the illumination changes, and the heat conduction equation is computed for each facet considering a one-dimensional time-dependent equation. The projected shadows are taken into account in our model. As a result, we obtained the temperature of each facet as a function of time, over one rotation period. We then integrate the flux over each facet to calculate the total millimetric flux received by the observer as a function of time and wavelength (1.25 mm).
The active area of 8P/Tuttle is restricted to 15 % of the surface (Groussin et al., 2010). As for 9P/Tempel 1 with an active area of 9% (Lisse et al., 2005), the sublimation of water ice can be neglected in the energy balance for the calculation of the thermal flux emitted from the nucleus surface (Groussin et al., 2007).
4 Results
Using the above simple spherical shape model with a radius of 2.8 km and our thermal model with the parameters of Groussin et al. (2008) (thermal inertia J K-1 m-2 s-1/2, beaming factor , emissivity ), which is in that case identical to the Standard Thermal Model (Lebofsky & Spencer, 1989), we obtain a millimetric flux of 5.6 mJy at 1.25 mm on 8 Jan. 2008. This is larger than, though barely in agreement with, our observed flux of mJy (1) or mJy (3), which in fact corresponds to a smaller radius of km (1) using the same thermal model and parameters. In order to investigate the origin of this discrepancy we studied the influence of several parameters in the calculation of the flux at 1.25 mm: i) shape, ii) thermal inertia , iii) beaming factor , and iv) emissivity from the surface and sub-surface layers. Our goal is to investigate which of these parameters can help to decrease the nucleus flux to make it compatible with our observations.
4.1 Shape effect
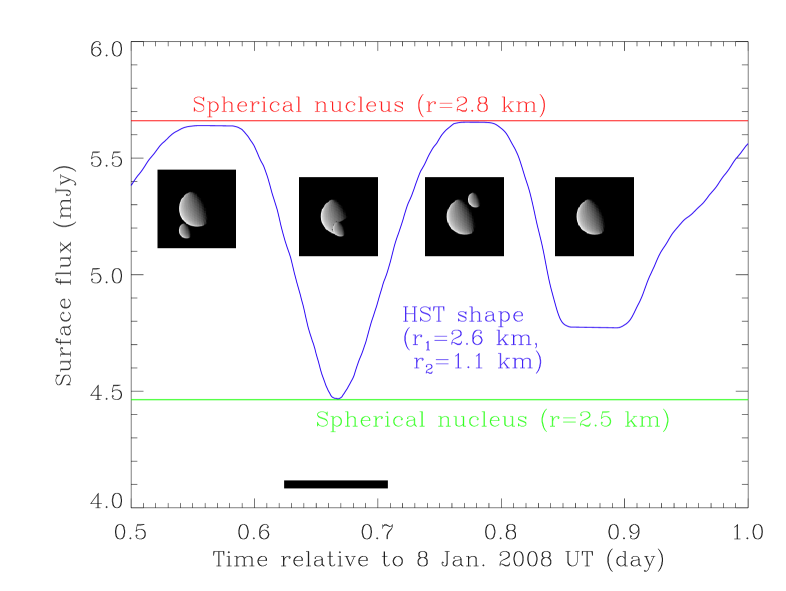
The simple calculation described above has been made using our spherical shape model with a radius of 2.8 km. As described in Sect. 3, a more realistic shape model exists, composed of two contact spheres (Lamy et al., 2008, 2010b). With this shape model, the flux is no more constant with time as for the spherical case, but changes during the nucleus rotation to produce a thermal lightcurve. Under our standard assumptions () we calculated the synthetic thermal light curve of this shape model, as illustrated in Fig. 2. The flux varies with time, with a minimum of 4.45 mJy and a maximum of 5.65 mJy. The maximum flux is reached when the primary and secondary are both illuminated, and this is equivalent to a spherical nucleus of radius 2.8 km as explained in Sect. 3.1. The minimum flux is reached when the secondary eclipses the primary, and this is equivalent to a spherical nucleus of radius 2.5 km. As the amplitude of the ligth curve is large (1.2 mJy), depending on the time of observation, the observed flux can be quite different.
Using the sidereal rotation period of 11.4440.001 h, we phased the observations performed at Plateau de Bure on 8 Jan. 2008 with the Arecibo radar experiments of Harmon et al. (2010) performed in early January 2008. The reference epoch of the Arecibo radar study is Jan. 4.0046, i.e. 10 rotation periods earlier than our observations, which translates to an uncertainty of 0.0004 day, i.e. less than 1 minute. At the reference epoch, the rotation phase is -51.5∘ with 0∘ being the time when the nucleus is seen broadside, with the larger lobe approaching (Harmon et al., 2010) and corresponds to the maximum that follows the lightcurve minimum in Fig. 2, on Jan. 8.75. The 1.5∘ error bar on the reference adds another 3 min of uncertainty on the rephasing. The total uncertainty does not exceed 5 min and is small in comparison with the length of the Plateau de Bure observations (2 h).
The lightcurve presented in Fig. 2 has been rephased and one can see that the Plateau de Bure observations (around Jan. 8.67) were performed around its minimum. Under the standard parameters, we expect a flux of 4.45 mJy at that time. This is still higher than the mJy measured with the Plateau de Bure, thus we assessed the impact of different thermal parameters of the nucleus to investigate this discrepancy.
4.2 Thermal inertia effect
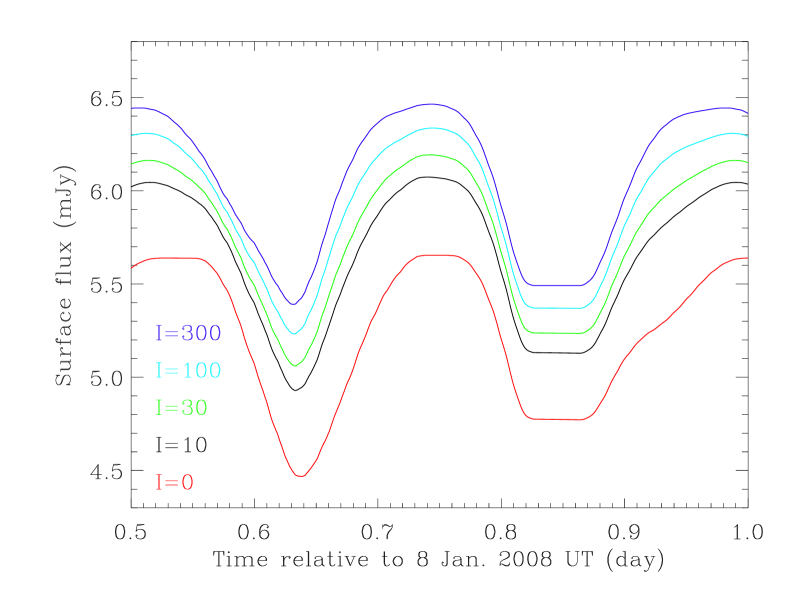
We present in Fig. 3 the thermal lightcurve expected from the comet 8P/Tuttle for different values of the nucleus thermal inertia. When the thermal inertia increases, the diurnal temperature variations decrease: the temperatures become cooler on the day side and warmer on the night side. In our case, since the phase angle is large (65∘), the heating on the night side is more pronounced than the cooling on the day side, and overall, the observed flux becomes larger as thermal inertia increases. It is clear from Fig. 3 that a larger thermal inertia does not help to solve our issue as the flux only gets larger. In the range 0-200 J K-1 m-2 s-1/2 for the thermal inertia estimated by Groussin et al. (2008), we then favour the lower values (typically 10 J K-1 m-2 s-1/2).
4.3 Beaming factor effect
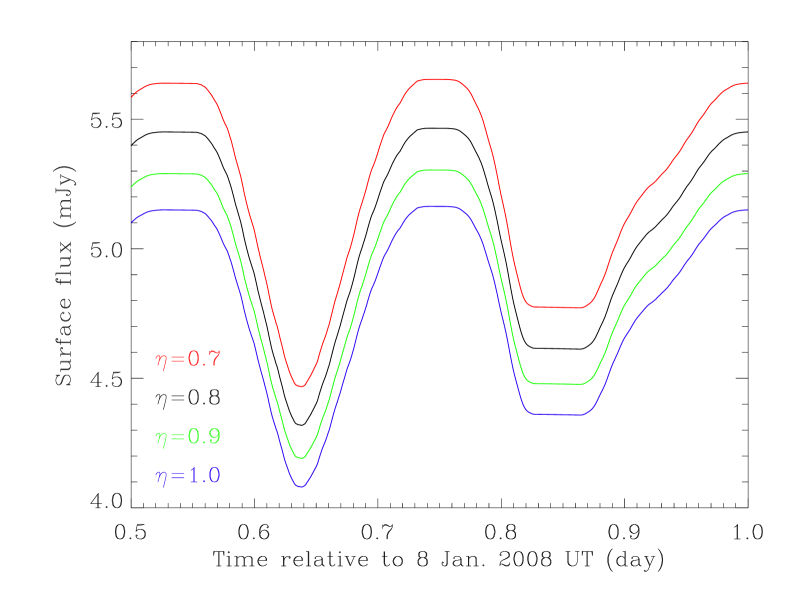
We present in Fig. 4 the thermal lightcurve emitted by our synthesized, bilobate nucleus as a function of the beaming factor . In our thermal model, the beaming factor follows the strict definition given by Lagerros (1998) where it only reflects the influence of surface roughness and must be lower or equal to 1.0. In addition, according to Lagerros (1998), must be larger than 0.7 to avoid unrealistic roughness, with r.m.s. slopes exceeding 45∘. The acceptable range for is then 0.7-1.0, as illustrated in Fig. 4. When roughness increases (i.e., decreases), the surface temperature increases due to self-heating on the surface, and the total flux increases. Changing from 0.7 (Groussin et al., 2008) to 1.0 decreases the minimum flux from 4.45 mJy to 4.1 mJy, which is a small improvement but not sufficient to explain the observed flux of 3.0 mJy.
The SST observations of comet 8P/Tuttle (Groussin et al., 2008, 2010) suggested a beaming factor on the order of 0.7. This value is constrained by the infrared spectrograph (IRS) observations, which lasted only 10 minutes, a short time compared to the rotation period of 11.4 h. The SST observations performed on 2.76 Nov. 2007 and, 141 periods later, the nucleus was in the same rotation phase on 8.650.02 Jan, 2008, exactly at the time of the Plateau de Bure observations (Fig. 2). As a result, although higher values correspond to lower millimetre fluxes, we favour the = 0.7, which is well constrained by the Spitzer observations.
Delbó et al. (2003) suggested an increase of the beaming factor with phase angle for Near-Earth Asteroids (NEAs). If confirmed, this trends could explain why our observations performed at 65∘ phase angle favor a larger value of , close to one, while SST observations performed at 39∘ phase angle favor a smaller value, close to 0.7. However, according to Delbó et al. (2003), their statistic is low and more observations are required to confirm this trend.
Finally, it cannot be excluded that the effect of the roughness () may be wavelength dependent. Roughness at micron scale could indeed be more important than at millimetre scale, resulting in a smaller beaming factor in the infrared. But this point cannot be confirmed since we cannot rule out a fractal surface, in which case the roughness would be more or less scale-independent.
4.4 Emissivity and depth effect
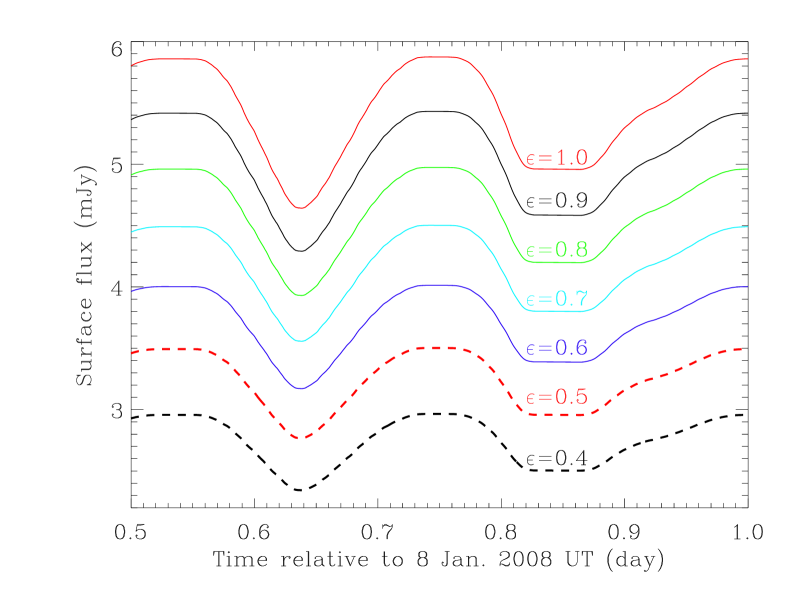
The thermal flux emitted from the nucleus is proportional to the surface emissivity, as illustrated in Fig. 5. The flux at the lightcurve minimum is in 1 agreement with our observations for an emissivity lower than 0.8. While the surface emissivity of small bodies in the mid-infrared is close to unity, it is still unknown at millimetre wavelengths and might be lower than in the mid-infrared. This point has already been addressed by Fernández (2002) for comet C/1995 O1 Hale-Bopp, where an emissivity of 0.5 is required in the millimetic range to reconcile the nucleus sizes derived from infrared and millimetric observations. Based on asteroid observations in the sub-millimetre, Redman et al. (1998) found that the emissivity of 7 asteroids decreases with increasing wavelength. The observations of asteroid (2867) Steins at 1.6 and 0.53 mm performed with the radiometer MIRO onboard the Rosetta spacecraft confirm this trend: Gulkis et al. (2010) found an emissivity decreasing from 0.85–9 at 1.6 to 0.6–0.7 at 0.53 mm. A low millimetric emissivity of 0.6 was also found for asteroid 4 Vesta by Mueller & Lagerros (1998). Overall, this means that our values () are plausible.
A possible physical explanation for the lower emissivity is that a part of the millimetre thermal flux arrises from sub-surface layers which are colder than the surface itself. Such a temperature gradient is expected given the low thermal intertia of the nucleus. The depth of the main contributing layer depends on the material opacity, which is unknown. Measurements on rocks showed that in most materials this depth lies between 3 and 100 (Campbell & Ulrichs, 1969). A depth of 10 is commonly used when dealing with planetary surfaces (e.g. 11 is used for the martian surface regolith, Muhleman & Berge, 1991; Goldin et al., 1997). Depending on the upper layers temperature gradient (controled by the thermal inertia) and the relative contribution of the different layers to the overall emission, the resulting spectral emissivity of the surface can be significantly lower than the usual infrared value close to unity.
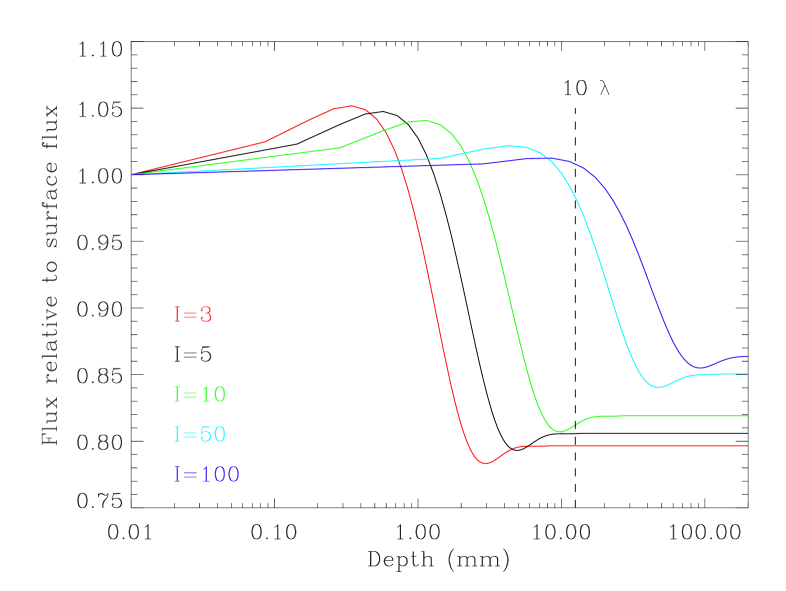
In order to investigate this effect, we calculated the nucleus integrated flux as a function of depth (down to 20 cm), relative to the surface flux, for different thermal inertia values. Figure 6 illustrates our results: as we observed the afternoon side of the nucleus, the shadowed part that we see is still warm because of thermal inertia and the contribution of the first sub-surface layers is comparable or larger to the surface, down to a certain depth (that depends on the thermal inertia) where it drops since diurnal temperature variations become negligible.
Assuming a Poissonian weighted function (that peaks at 10) to describe the relative contributions of the sub-surface layers, which seems to be a good approximation compared to the work of Moullet (2008), we integrate the weigthed flux from Fig. 6 as a function of depth, to derive the effective outcoming flux compared to a pure surface emission. The results are presented in Table 2. Depending on the thermal inertia, the flux is reduced by 9% to 17% compared to a pure surface emission. For low thermal inertia (10 J K-1 m-2 s-1/2), which are in better agreement with our observations as explained in Sect. 4.2, the flux is reduced by 14-17%, which corresponds to an “effective” emissivity of 0.79-0.82 assuming our standard surface emissivity of 0.95. According to Fig. 5 and as explained above, this allows to match our observations within 1.
Our results confirm that a low emissivity in the millimetric wavelength range can result from the emission of sub-surface layers with a low thermal inertia. In the mid-infrared, typically around 10 m, 10 corresponds to 0.1 mm, a depth over which the flux is close the surface flux (Fig. 6), explaining why the above effect only matters in the millimetric wavelength range and beyond, in the centimetric and radar wavelength range. However, for the centimetric and radar, there exists a few notable exceptions, and in particular Ganymede, which centrimetric emission corresponds to a brightness temperature of about 55-88 K, below any acceptable sub-surface temperature for this body (Muhleman & Berge, 1991), and whose radar reflection is highly anomalous (Ostro & Shoemaker, 1990). In this case, a higher reflectivity must also be invoked, likely resulting from backscattering of the surface.
| Thermal inertia | Relative depth-integrated flux |
|---|---|
| J K-1 m-2 s-1/2 | |
| 3 | 0.83 |
| 5 | 0.84 |
| 10 | 0.86 |
| 50 | 0.88 |
| 100 | 0.91 |
5 Summary
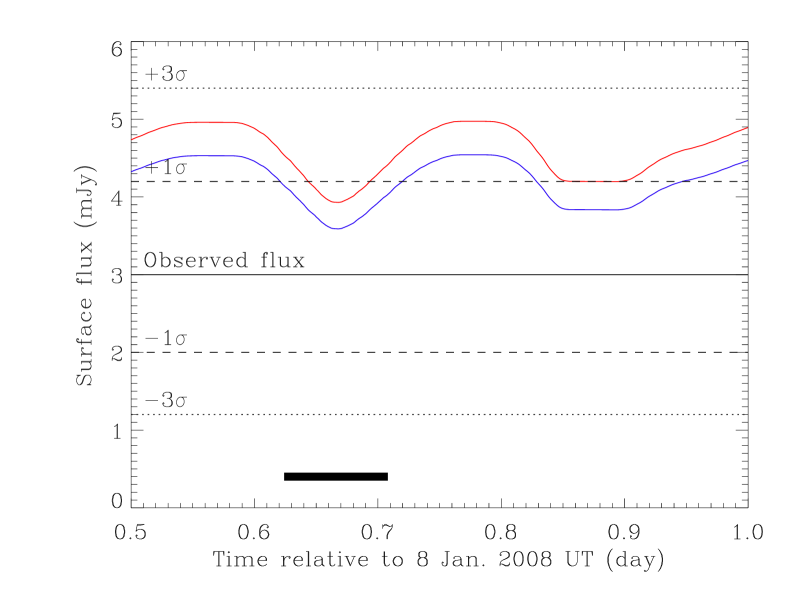
We report here the first detection of the thermal emission of a cometary nucleus at millimetre wavelength since C/1995 O1 Hale-Bopp, performed at Plateau de Bure on 8 Jan. 2008. Using the rotation period derived by Harmon et al. (2010), we phased our observations with respect to their radar experiments and found that Plateau de Bure observations were performed at a minimum of the lightcurve. We used the shape model developped by Lamy et al. (2010b) for 8P/Tuttle nucleus to compute thermal emission lightcurves using different thermal parameter sets. From our analysis, we can conclude that to match our observed flux of mJy at 1.25 mm, the thermal inertia of the nucleus should be low, typically 10 J K-1 m-2 s-1/2, in agreement with the range 0-200 J K-1 m-2 s-1/2 derived from Spitzer observations (Groussin et al., 2008). In addition, the millimetric emissivity of the nucleus should be lower than 0.8. According to our thermal model, such a low value can be due to the non-negligible emission of the sub-surface layers of the nucleus, which are colder than the surface at depth of a few millimetre or more for low thermal inertia values. Similar and even lower values of the millimetric emissivity have been already mentionned to explain the low flux emitted by asteroids (Redman et al., 1998; Mueller & Lagerros, 1998; Fernández, 2002). As to the beaming factor, the lowest flux of the lightucurve is in 1 agreement with our observed flux for any value in the plausible range 0.7–1.0, with a better agreement towards higher edge. However we favour = 0.7, the only value in agreement with Spitzer (IRS) observations (Groussin et al., 2010). From the above conclusions, we generated a synthetic lightcurve for the nucleus of comet 8P/Tuttle, as observed from the Plateau de Bure on 8 Jan. 2008, using the following parameters: = 0, = 0.8 and in the range 0.7-1.0 to cover the possible values. The result is illustrated in Figure 7.
In the future, the Rosetta spacecraft, equipped with a microwave instrument operating at 190 and 562 GHz (Gulkis et al., 2007), will provide an unequaled dataset to study the surface of a cometary nucleus and its thermal properties. It will be also important to repeat ground-based studies on other comets, to determine whether all comets present similar properties or if they change from one comet to another, revealing different surface natures. The (sub-)millimetre interferometer ALMA will offer a significant gain in sensitivity and allow similar studies on a larger sample of comets, from both the ecliptic and the Oort cloud dynamical classes.
Acknowledgements.
The research leading to these results has received funding from the European Community’s Seventh Framework Programme (FP7/2007–2013) under grant agreement No. 229517References
- Altenhoff et al. (1999) Altenhoff, W. J., Bieging, J. H., Butler, B., et al. 1999, A&A, 348, 1020
- Biver et al. (2008) Biver, N., Lis, D. C., Fray, N., et al. 2008, LPI Contributions, 1405, 8151
- Bonev et al. (2008) Bonev, B. P., Mumma, M. J., Radeva, Y. L., et al. 2008, ApJ, 680, L61
- Boss (2003) Boss, A. P. 2003, ApJ, 599, 577
- Cameron (1978) Cameron, A. G. W. 1978, M&P, 18, 5
- Campbell & Ulrichs (1969) Campbell, M. J. & Ulrichs, J. 1969, J. Geophys. Res., 74, 5867
- Crovisier et al. (2009) Crovisier, J., Biver, N., Bockelée-Morvan, D., et al. 2009, EM&P, 105, 267
- Delbó et al. (2003) Delbó, M., Harris, A. W., Binzel, R. P., Pravec, P., & Davies, J. K. 2003, Icarus, 166, 116
- Duncan et al. (1988) Duncan, M., Quinn, T., & Tremaine, S. 1988, ApJ, 328, L69
- Fernández (2002) Fernández, Y. R. 2002, EM&P, 89, 3
- Goldin et al. (1997) Goldin, A. B., Kowitt, M. S., Cheng, E. S., et al. 1997, ApJ, 488, L161
- Groussin et al. (2007) Groussin, O., A’Hearn, M. F., Li, J.-Y., et al. 2007, Icarus, 187, 16
- Groussin et al. (2008) Groussin, O., Kelley, M., Lamy, P., et al. 2008, BAAS, 40, 393
- Groussin et al. (2004) Groussin, O., Lamy, P., & Jorda, L. 2004, A&A, 413, 1163
- Groussin et al. (2010) Groussin, O., Lamy, P., Kelley, M., et al. 2010, submitted to A&A
- Gulkis et al. (2007) Gulkis, S., Allen, M., Backus, C., et al. 2007, P&SS, 55, 1050
- Gulkis et al. (2010) Gulkis, S., Keihm, S., Kamp, L., et al. 2010, P&SS, 58, 1077
- Harmon et al. (2010) Harmon, J. K., Nolan, M. C., Giorgini, J. D., & Howell, E. S. 2010, Icarus, 207, 499
- Harmon et al. (2008) Harmon, J. K., Nolan, M. C., Howell, E. S., & Giorgini, J. D. 2008, LPI Contributions, 1405, 8025
- Jewitt & Luu (1992) Jewitt, D. & Luu, J. 1992, Icarus, 100, 187
- Jewitt & Matthews (1997) Jewitt, D. C. & Matthews, H. E. 1997, ApJ, 113, 1145
- Kobayashi et al. (2010) Kobayashi, H., Bockelée-Morvan, D., Kawakita, H., et al. 2010, A&A, 509, A80
- Lagerros (1998) Lagerros, J. S. V. 1998, A&A, 332, 1123
- Lamy et al. (2010a) Lamy, P., Groussin, O., Fornasier, S., et al. 2010a, A&A, 516, A74
- Lamy et al. (2010b) Lamy, P., Jorda, L., Toth, I., et al. 2010b, in preparation
- Lamy et al. (2004) Lamy, P. L., Toth, I., Fernandez, Y. R., & Weaver, H. A. 2004, Comets II, ed. M. C. Festou, H. U. Keller, H. A. Weaver, 223
- Lamy et al. (2008) Lamy, P. L., Toth, I., Jorda, L., et al. 2008, BAAS, 40, 393
- Lebofsky & Spencer (1989) Lebofsky, L. A. & Spencer, J. R. 1989, in Asteroids II, ed. R. P. Binzel, T. Gehrels, & M. S. Matthews, 128–147
- Licandro et al. (2000) Licandro, J., Tancredi, G., Lindgren, M., Rickman, H., & Hutton, R. G. 2000, Icarus, 147, 161
- Lisse et al. (2005) Lisse, C. M., A’Hearn, M. F., Groussin, O., et al. 2005, ApJ, L625, L139
- Moullet (2008) Moullet, A. 2008, PhD thesis, Thèse de doctorat de l’Université Paris 7 Diderot
- Mueller & Lagerros (1998) Mueller, T. G. & Lagerros, J. S. V. 1998, A&A, 338, 340
- Muhleman & Berge (1991) Muhleman, D. O. & Berge, G. L. 1991, Icarus, 92, 263
- Mumma et al. (1996) Mumma, M. J., Disanti, M. A., Dello Russo, N., et al. 1996, Sci, 272, 1310
- Ostro & Shoemaker (1990) Ostro, S. J. & Shoemaker, E. M. 1990, Icarus, 85, 335
- Pety (2005) Pety, J. 2005, in SF2A-2005: Semaine de l’Astrophysique Francaise, ed. F. Casoli, T. Contini, J. M. Hameury, & L. Pagani, 721
- Pollack et al. (1996) Pollack, J. B., Hubickyj, O., Bodenheimer, P., et al. 1996, Icarus, 124, 62
- Redman et al. (1998) Redman, R. O., Feldman, P. A., & Matthews, H. E. 1998, ApJ, 116, 1478
- Safronov & Zvjagina (1969) Safronov, V. S. & Zvjagina, E. V. 1969, Icarus, 10, 109