22institutetext: Agenzia Spaziale Italiana Science Data Center, c/o ESRIN, via Galileo Galilei, Frascati, Italy
33institutetext: Astroparticule et Cosmologie, CNRS (UMR7164), Université Denis Diderot Paris 7, Bâtiment Condorcet, 10 rue A. Domon et Léonie Duquet, Paris, France
44institutetext: Astrophysics Group, Cavendish Laboratory, University of Cambridge, J J Thomson Avenue, Cambridge CB3 0HE, U.K.
55institutetext: Atacama Large Millimeter/submillimeter Array, ALMA Santiago Central Offices, Alonso de Cordova 3107, Vitacura, Casilla 763 0355, Santiago, Chile
66institutetext: Australia Telescope National Facility, CSIRO, P.O. Box 76, Epping, NSW 1710, Australia
77institutetext: CITA, University of Toronto, 60 St. George St., Toronto, ON M5S 3H8, Canada
88institutetext: CNRS, IRAP, 9 Av. colonel Roche, BP 44346, F-31028 Toulouse cedex 4, France
99institutetext: California Institute of Technology, Pasadena, California, U.S.A.
1010institutetext: Centre of Mathematics for Applications, University of Oslo, Blindern, Oslo, Norway
1111institutetext: DAMTP, University of Cambridge, Centre for Mathematical Sciences, Wilberforce Road, Cambridge CB3 0WA, U.K.
1212institutetext: DSM/Irfu/SPP, CEA-Saclay, F-91191 Gif-sur-Yvette Cedex, France
1313institutetext: DTU Space, National Space Institute, Juliane Mariesvej 30, Copenhagen, Denmark
1414institutetext: Departamento de Física, Universidad de Oviedo, Avda. Calvo Sotelo s/n, Oviedo, Spain
1515institutetext: Department of Astronomy and Astrophysics, University of Toronto, 50 Saint George Street, Toronto, Ontario, Canada
1616institutetext: Department of Physics & Astronomy, University of British Columbia, 6224 Agricultural Road, Vancouver, British Columbia, Canada
1717institutetext: Department of Physics and Astronomy, Tufts University, Medford, MA 02155, U.S.A.
1818institutetext: Department of Physics, Gustaf Hällströmin katu 2a, University of Helsinki, Helsinki, Finland
1919institutetext: Department of Physics, Princeton University, Princeton, New Jersey, U.S.A.
2020institutetext: Department of Physics, Purdue University, 525 Northwestern Avenue, West Lafayette, Indiana, U.S.A.
2121institutetext: Department of Physics, University of California, Berkeley, California, U.S.A.
2222institutetext: Department of Physics, University of California, One Shields Avenue, Davis, California, U.S.A.
2323institutetext: Department of Physics, University of California, Santa Barbara, California, U.S.A.
2424institutetext: Department of Physics, University of Illinois at Urbana-Champaign, 1110 West Green Street, Urbana, Illinois, U.S.A.
2525institutetext: Dipartimento di Fisica G. Galilei, Università degli Studi di Padova, via Marzolo 8, 35131 Padova, Italy
2626institutetext: Dipartimento di Fisica, Università La Sapienza, P. le A. Moro 2, Roma, Italy
2727institutetext: Dipartimento di Fisica, Università degli Studi di Milano, Via Celoria, 16, Milano, Italy
2828institutetext: Dipartimento di Fisica, Università degli Studi di Trieste, via A. Valerio 2, Trieste, Italy
2929institutetext: Dipartimento di Fisica, Università di Ferrara, Via Saragat 1, 44122 Ferrara, Italy
3030institutetext: Dipartimento di Fisica, Università di Roma Tor Vergata, Via della Ricerca Scientifica, 1, Roma, Italy
3131institutetext: Discovery Center, Niels Bohr Institute, Blegdamsvej 17, Copenhagen, Denmark
3232institutetext: Dpto. Astrofísica, Universidad de La Laguna (ULL), E-38206 La Laguna, Tenerife, Spain
3333institutetext: European Southern Observatory, ESO Vitacura, Alonso de Cordova 3107, Vitacura, Casilla 19001, Santiago, Chile
3434institutetext: European Space Agency, ESAC, Planck Science Office, Camino bajo del Castillo, s/n, Urbanización Villafranca del Castillo, Villanueva de la Cañada, Madrid, Spain
3535institutetext: European Space Agency, ESTEC, Keplerlaan 1, 2201 AZ Noordwijk, The Netherlands
3636institutetext: Haverford College Astronomy Department, 370 Lancaster Avenue, Haverford, Pennsylvania, U.S.A.
3737institutetext: Helsinki Institute of Physics, Gustaf Hällströmin katu 2, University of Helsinki, Helsinki, Finland
3838institutetext: INAF - Osservatorio Astrofisico di Catania, Via S. Sofia 78, Catania, Italy
3939institutetext: INAF - Osservatorio Astronomico di Padova, Vicolo dell’Osservatorio 5, Padova, Italy
4040institutetext: INAF - Osservatorio Astronomico di Roma, via di Frascati 33, Monte Porzio Catone, Italy
4141institutetext: INAF - Osservatorio Astronomico di Trieste, Via G.B. Tiepolo 11, Trieste, Italy
4242institutetext: INAF/IASF Bologna, Via Gobetti 101, Bologna, Italy
4343institutetext: INAF/IASF Milano, Via E. Bassini 15, Milano, Italy
4444institutetext: INRIA, Laboratoire de Recherche en Informatique, Université Paris-Sud 11, Bâtiment 490, 91405 Orsay Cedex, France
4545institutetext: IPAG: Institut de Planétologie et d’Astrophysique de Grenoble, Université Joseph Fourier, Grenoble 1 / CNRS-INSU, UMR 5274, Grenoble, F-38041, France
4646institutetext: ISDC Data Centre for Astrophysics, University of Geneva, ch. d’Ecogia 16, Versoix, Switzerland
4747institutetext: Imperial College London, Astrophysics group, Blackett Laboratory, Prince Consort Road, London, SW7 2AZ, U.K.
4848institutetext: Infrared Processing and Analysis Center, California Institute of Technology, Pasadena, CA 91125, U.S.A.
4949institutetext: Institut Néel, CNRS, Université Joseph Fourier Grenoble I, 25 rue des Martyrs, Grenoble, France
5050institutetext: Institut d’Astrophysique Spatiale, CNRS (UMR8617) Université Paris-Sud 11, Bâtiment 121, Orsay, France
5151institutetext: Institut d’Astrophysique de Paris, CNRS UMR7095, Université Pierre & Marie Curie, 98 bis boulevard Arago, Paris, France
5252institutetext: Institut de Ciències de l’Espai, CSIC/IEEC, Facultat de Ciències, Campus UAB, Torre C5 par-2, Bellaterra 08193, Spain
5353institutetext: Institute of Astronomy and Astrophysics, Academia Sinica, Taipei, Taiwan
5454institutetext: Institute of Astronomy, University of Cambridge, Madingley Road, Cambridge CB3 0HA, U.K.
5555institutetext: Institute of Theoretical Astrophysics, University of Oslo, Blindern, Oslo, Norway
5656institutetext: Instituto de Astrofísica de Canarias, C/Vía Láctea s/n, La Laguna, Tenerife, Spain
5757institutetext: Instituto de Física de Cantabria (CSIC-Universidad de Cantabria), Avda. de los Castros s/n, Santander, Spain
5858institutetext: Istituto di Fisica del Plasma, CNR-ENEA-EURATOM Association, Via R. Cozzi 53, Milano, Italy
5959institutetext: Jet Propulsion Laboratory, California Institute of Technology, 4800 Oak Grove Drive, Pasadena, California, U.S.A.
6060institutetext: Jodrell Bank Centre for Astrophysics, Alan Turing Building, School of Physics and Astronomy, The University of Manchester, Oxford Road, Manchester, M13 9PL, U.K.
6161institutetext: Kavli Institute for Cosmology Cambridge, Madingley Road, Cambridge, CB3 0HA, U.K.
6262institutetext: LERMA, CNRS, Observatoire de Paris, 61 Avenue de l’Observatoire, Paris, France
6363institutetext: Laboratoire AIM, IRFU/Service d’Astrophysique - CEA/DSM - CNRS - Université Paris Diderot, Bât. 709, CEA-Saclay, F-91191 Gif-sur-Yvette Cedex, France
6464institutetext: Laboratoire Traitement et Communication de l’Information, CNRS (UMR 5141) and Télécom ParisTech, 46 rue Barrault F-75634 Paris Cedex 13, France
6565institutetext: Laboratoire de Physique Subatomique et de Cosmologie, CNRS/IN2P3, Université Joseph Fourier Grenoble I, Institut National Polytechnique de Grenoble, 53 rue des Martyrs, 38026 Grenoble cedex, France
6666institutetext: Laboratoire de l’Accélérateur Linéaire, Université Paris-Sud 11, CNRS/IN2P3, Orsay, France
6767institutetext: Lawrence Berkeley National Laboratory, Berkeley, California, U.S.A.
6868institutetext: Max-Planck-Institut für Astrophysik, Karl-Schwarzschild-Str. 1, 85741 Garching, Germany
6969institutetext: MilliLab, VTT Technical Research Centre of Finland, Tietotie 3, Espoo, Finland
7070institutetext: National University of Ireland, Department of Experimental Physics, Maynooth, Co. Kildare, Ireland
7171institutetext: Niels Bohr Institute, Blegdamsvej 17, Copenhagen, Denmark
7272institutetext: Observational Cosmology, Mail Stop 367-17, California Institute of Technology, Pasadena, CA, 91125, U.S.A.
7373institutetext: Optical Science Laboratory, University College London, Gower Street, London, U.K.
7474institutetext: SISSA, Astrophysics Sector, via Bonomea 265, 34136, Trieste, Italy
7575institutetext: SUPA, Institute for Astronomy, University of Edinburgh, Royal Observatory, Blackford Hill, Edinburgh EH9 3HJ, U.K.
7676institutetext: School of Physics and Astronomy, Cardiff University, Queens Buildings, The Parade, Cardiff, CF24 3AA, U.K.
7777institutetext: Space Research Institute (IKI), Russian Academy of Sciences, Profsoyuznaya Str, 84/32, Moscow, 117997, Russia
7878institutetext: Space Sciences Laboratory, University of California, Berkeley, California, U.S.A.
7979institutetext: Spitzer Science Center, 1200 E. California Blvd., Pasadena, California, U.S.A.
8080institutetext: Stanford University, Dept of Physics, Varian Physics Bldg, 382 Via Pueblo Mall, Stanford, California, U.S.A.
8181institutetext: Universität Heidelberg, Institut für Theoretische Astrophysik, Albert-Überle-Str. 2, 69120, Heidelberg, Germany
8282institutetext: Université de Toulouse, UPS-OMP, IRAP, F-31028 Toulouse cedex 4, France
8383institutetext: Universities Space Research Association, Stratospheric Observatory for Infrared Astronomy, MS 211-3, Moffett Field, CA 94035, U.S.A.
8484institutetext: University of Granada, Departamento de Física Teórica y del Cosmos, Facultad de Ciencias, Granada, Spain
8585institutetext: University of Miami, Knight Physics Building, 1320 Campo Sano Dr., Coral Gables, Florida, U.S.A.
8686institutetext: Warsaw University Observatory, Aleje Ujazdowskie 4, 00-478 Warszawa, Poland
Planck Early Results. VII. The Early Release Compact Source Catalogue
A brief description of the methodology of construction, contents and usage of the Planck Early Release Compact Source Catalogue (ERCSC), including the Early Cold Cores (ECC) and the Early Sunyaev-Zeldovich (ESZ) cluster catalogue is provided. The catalogue is based on data that consist of mapping the entire sky once and 60% of the sky a second time by Planck, thereby comprising the first high sensitivity radio/submillimetre observations of the entire sky. Four source detection algorithms were run as part of the ERCSC pipeline. A Monte-Carlo algorithm based on the injection and extraction of artificial sources into the Planck maps was implemented to select reliable sources among all extracted candidates such that the cumulative reliability of the catalogue is 90%. There is no requirement on completeness for the ERCSC. As a result of the Monte-Carlo assessment of reliability of sources from the different techniques, an implementation of the PowellSnakes source extraction technique was used at the five frequencies between 30 and 143 GHz while the SExtractor technique was used between 217 and 857 GHz. The 10 photometric flux density limit of the catalogue at is 0.49, 1.0, 0.67, 0.5, 0.33, 0.28, 0.25, 0.47 and 0.82 Jy at each of the nine frequencies between and GHz. Sources which are up to a factor of 2 fainter than this limit, and which are present in “clean” regions of the Galaxy where the sky background due to emission from the interstellar medium is low, are included in the ERCSC if they meet the high reliability criterion. The Planck ERCSC sources have known associations to stars with dust shells, stellar cores, radio galaxies, blazars, infrared luminous galaxies and Galactic interstellar medium features. A significant fraction of unclassified sources are also present in the catalogs. In addition, two early release catalogs that contain 915 cold molecular cloud core candidates and 189 SZ cluster candidates that have been generated using multifrequency algorithms are presented. The entire source list, with more than 15000 unique sources, is ripe for follow-up characterisation with Herschel, ATCA, VLA, SOFIA, ALMA and other ground-based observing facilities.
Key Words.:
Cosmology:observations – Surveys – Catalogues – Radio continuum: general – Submillimetre: general1 Introduction
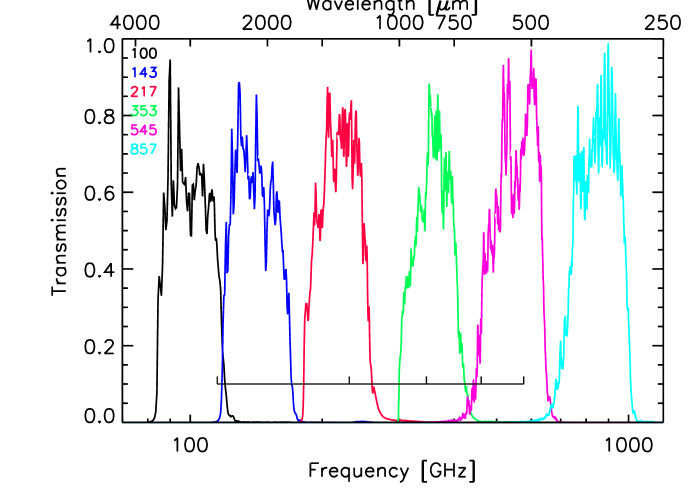
Planck111Planck (http://www.esa.int/Planck) is a project of the European Space Agency (ESA) with instruments provided by two scientific consortia funded by ESA member states (in particular the lead countries France and Italy), with contributions from NASA (USA) and telescope reflectors provided in a collaboration between ESA and a scientific consortium led and funded by Denmark. (Tauber et al. 2010; Planck Collaboration 2011a) is the third-generation space mission to measure the anisotropy of the cosmic microwave background (CMB). It observes the sky in nine frequency bands covering 30–857 GHz with high sensitivity and angular resolution from 33 arcmin to 4.2 arcmin (Table 1). The Low Frequency Instrument (LFI; Mandolesi et al. 2010; Bersanelli et al. 2010; Mennella et al. 2011) covers the 30, 44, and 70 GHz bands with amplifiers cooled to 20 K. The High Frequency Instrument (HFI; Lamarre et al. 2010; Planck HFI Core Team 2011a) covers the 100, 143, 217, 353, 545, and 857 GHz bands with bolometers cooled to 0.1 K. Polarisation is measured in all but the highest two bands (Leahy et al. 2010; Rosset et al. 2010). A combination of radiative cooling and three mechanical coolers produces the temperatures needed for the detectors and optics (Planck Collaboration 2011b). Two data processing centres (DPCs) check and calibrate the data and make maps of the sky (Planck HFI Core Team 2011b; Zacchei et al. 2011). Planck’s sensitivity, angular resolution, and frequency coverage make it a powerful instrument for Galactic and extragalactic astrophysics as well as cosmology.
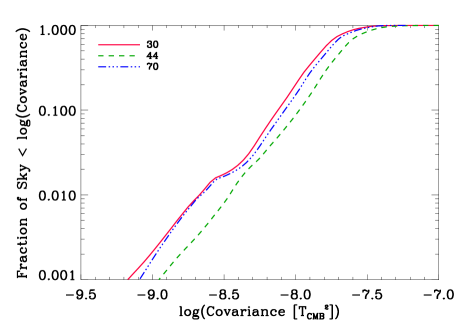
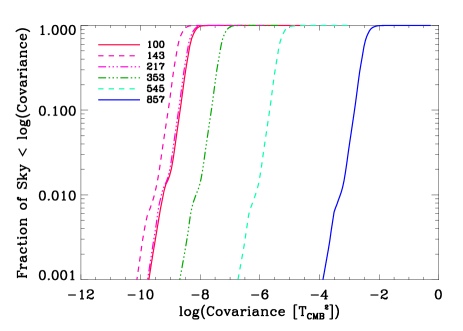
Planck spins around its axis at a rate of one rotation per minute. The focal plane is oriented at an angle of 85 to the satellite spin axis, which tracks the direction of the Sun at 1 per day. The effective Planck scan strategy described in Dupac & Tauber (2005) results in areas near the ecliptic poles being observed several times more frequently than regions of sky near the ecliptic plane. This implies that there is a range of almost 50 in instrumental noise between the most- and least-frequently observed areas of the sky (Figure 1). This scan strategy achieved greater than % coverage of the full sky on 1 April 2010 with gaps predominantly resulting from planet crossings and the masking of associated artefacts. A comparison between the all sky imaging capabilities of Planck, Wilkinson Microwave Anisotropy Probe (WMAP), Cosmic Background Explorer/Differential Microwave Radiometer (COBE/DMR), Akari, Infrared Astronomy Satellite (IRAS) and Wide-field Infrared Survey Explorer (WISE) is shown in Table 1. Planck straddles the wavelength range between WMAP (Bennett et al. 2003) at one end and Akari (Murakami et al. 2007) at the other end. At its lowest frequencies Planck improves upon the imaging resolution of WMAP. Although Planck does not have the high resolution of Akari or WISE(Wright et al. 2010) at higher frequencies, it matches the capabilities of IRAS at frequencies which are more than a factor of three lower than IRAS. The consequence of this unprecedented spatial resolution and wavelength coverage is a unique simultaneous, multiwavelength view of the sky, enabling the study of a broad class of sources, and facilitating improved separation between Galactic and extragalactic foregrounds and the CMB.
The Early Release Compact Source Catalogue is a catalogue of all high-reliability sources, both Galactic and extragalactic, detected over the entire sky, in the first Planck all-sky survey. This includes a sample of clusters detected through the Sunyaev-Zeldovich (SZ) effect and a catalogue of cold, molecular cloud cores with far-infrared colour temperatures cooler than the ambient 18K dust in our Galaxy. No polarisation information is provided for the sources at this time. One of the primary goals of the ERCSC is to provide an early catalogue of sources for follow-up observations with existing facilities, in particular Herschel, while they are still in their cryogenic operational phase. The need for a rapid turnaround (less than nine months) from the end of the first sky coverage to a community-wide release of source lists is the motivating factor behind the reliability and flux-density accuracy requirements as well as the choice of algorithms that were adopted for the ERCSC.
The sources of noise vary significantly as a function of location on the sky as well as a function of frequency. Apart from the instrumental noise and the Galaxy, at the lowest frequencies the dominant astrophysical source of noise is the CMB itself. At the highest frequencies, zodiacal dust and emission from the interstellar medium dominate. As a result, the flux density limits corresponding to the same reliability vary widely across the sky (Figure 1), with the sensitivity typically improving with increasing ecliptic latitude. The areas of deepest coverage are centred on the ecliptic pole regions due to the scan strategy and individual sources in that vicinity may be observed several times by Planck in the course of a single sky survey.
The data obtained from the scans of the sky between 2009 August 13 and 2010 June 6, corresponding to Planck operational days 91–389, have been processed and converted into all-sky maps at the HFI and LFI Data Processing Centres (DPCs). The data extend beyond a single sky coverage with 60% of the second sky coverage included in the maps. A description of the processing can be found in Zacchei et al. (2011); Planck HFI Core Team (2011b). Four different implementations of source detection algorithms were run on these maps. The performance of these algorithms was compared and the single implementation which provides superior source statistics at each frequency was selected for the final catalogue at that frequency. For the early SZ (ESZ) and early cold cores (ECC) catalogues, multifrequency algorithms described in Melin et al. (2006) and Planck Collaboration (2011s) respectively, have been run to provide a candidate source list, which has then been culled to maintain the high reliability required for the ERCSC. This paper describes the methodology through which the ERCSC pipeline generates a high reliability source catalogue as well as presents the contents and characteristics of the Planck ERCSC data release.
| DMR | WMAP | Planck | Akari | IRAS | WISE | |||||||||||
|---|---|---|---|---|---|---|---|---|---|---|---|---|---|---|---|---|
| FWHM | FWHM | FWHM | FWHM | FWHM | FWHM | |||||||||||
| 23 | 53 | |||||||||||||||
| 32 | 420 | 33 | 40 | 30 | 32.65 | |||||||||||
| 41 | 31 | 44 | 27.00 | |||||||||||||
| 53 | 420 | 61 | 21 | 70 | 13.01 | |||||||||||
| 90 | 420 | 94 | 13 | 100 | 9.94 | |||||||||||
| 143 | 7.04 | |||||||||||||||
| 217 | 4.66 | |||||||||||||||
| 353 | 4.41 | |||||||||||||||
| 545 | 4.47 | |||||||||||||||
| 857 | 4.23 | |||||||||||||||
| 1.9103 | 0.8 | |||||||||||||||
| 2.1103 | 0.7 | |||||||||||||||
| 3.3103 | 0.45 | 3103 | 5.2 | |||||||||||||
| 4.6103 | 0.32 | 5103 | 3.9 | |||||||||||||
| 16.7103 | 0.09 | 12103 | 4.5 | 13.6103 | 0.2 | |||||||||||
| 33103 | 0.05 | 25103 | 4.7 | 25103 | 0.11 | |||||||||||
| 65103 | 0.11 | |||||||||||||||
| 88103 | 0.1 | |||||||||||||||
2 The ERCSC Pipeline
This section summarises the steps involved in progressing from the initial Planck all-sky maps to the final catalogue. A full description of the entire process can be found in Planck Collaboration (2011v), which has been released with the ERCSC.
The intensity maps on which the ERCSC pipeline is run are in HEALPix format (Górski et al. 2005) in units of (Kelvin Rayleigh-Jeans, a measure of brightness temperature) in the Galactic coordinate system. Thermodynamic temperature (TCMB) is related to the Rayleigh-Jeans brightness temperature by:
| (1) | |||||
| (2) |
where is the Planck constant, is the Boltzmann constant and is the frequency. The pixel size is 3.4 arcmin for the LFI bands (30–70 GHz) and 1.7 arcmin for the HFI bands (100–857 GHz) which corresponds to NSIDE values of 1024 and 2048 in the HEALPix format. In addition to the intensity map, there is a corresponding covariance map at each frequency, which is a measure of the noise in that pixel measured as the standard deviation of all scans that have gone through that pixel, after removal of an offset from each ring of observations. The covariance maps are in units of . A full description of the map-making process can be found in Planck HFI Core Team (2011b).
The three core processing steps within the ERCSC pipeline are source detection, source extraction, and in the case of 857 GHz, measuring the flux densities of each source at the three lower frequencies, 217, 353, and 545 GHz, which is sometimes referred to as band-filling. These three steps are first run on the intensity maps to obtain catalogues of sources. The process is then repeated on maps which have a population of artificial point sources of varying flux densities injected directly into the maps. The performance of the algorithms are evaluated based on the positions and extracted flux densities of the artificial sources whose real flux density and positions are precisely known. Based on the properties of the extracted artificial sources, signal-to-noise ratio (SNR) cuts are defined such that the properties of the extracted artificial sources are robust both in terms of position and flux density. The same signal-to-noise cut is then applied to the real catalogue of sources generated from the intensity maps to obtain a high reliability catalogues. Secondary quality assessment cuts are applied to the catalogue to eliminate sources associated with known artefacts in the maps. Additional properties of the reliable sources such as the dates they were observed, their presence in CMB subtracted maps, their flux density estimated from point source fitting, and the potential contribution of Galactic cirrus emission are evaluated in the final stages of the pipeline.
We note that the maps used for the ERCSC are affected by uncorrected pointing errors of at least two types. The first is due to time-dependent, thermally-driven misalignment between the star tracker and the boresight of the telescope (Planck Collaboration 2011a). The second is due to uncorrected stellar aberration across the focal plane. Since 70% of the sky is observed at least twice with different orientations, the effect of stellar aberration for the majority of sources is negligible. However, for the remaining 30% of the sky, the effect would result in an offset ranging from 21 near the ecliptic poles to a value close to 0 in the ecliptic plane. We do not see this effect clearly in the centroids of sources in the ERCSC, likely because the intrinsic uncertainty in the positions is comparable to the maximum offset induced by these pointing errors. Furthermore, since these pointing errors are not factored into the injection of the artificial sources into the maps, the positional uncertainty from the Monte-Carlo analysis is an underestimate. The effect on the flux density of the catalogue sources is negligibly small, 2%. Both types of pointing error will be corrected in the maps used for future Planck catalogues.
2.1 Source Detection Algorithms
Four specific implementations of source detection algorithms were run as part of the ERCSC pipeline. These are the Paris Matched Filter (PMF; Melin et al. 2006), IFCA Mexican hat wavelet filter (IFCAMex; López-Caniego et al. 2007), PowellSnakes (PwS; Carvalho et al. 2011, in preparation; Carvalho et al. 2009) and SExtractor (Bertin & Arnouts 1996). Some of the algorithms are still in development and the results depended on version of algorithms used and their implementation methodology in the ERCSC pipeline. Of these, only two were selected to generate the final catalogues. The two algorithms were selected to provide the largest numbers of high reliability sources at high Galactic latitude in the Planck maps. These are PwS v2.0 for frequencies 30–143 GHz, and SExtractor for frequencies 217–857 GHz.
2.1.1 PowellSnakes
PowellSnakes is a fast Bayesian method for the detection of discrete objects immersed in a diffuse background. The application of Bayesian model selection and the Bayesian information criterion to source detection and extraction have been reviewed by Hobson & McLachlan (2003) and Savage & Oliver (2007). PwS builds on these ideas and incorporates them in a fast implementation.
The all-sky map is resampled onto a set of overlapping flat patches using a gnomonic (tangent plane) projection. Each patch is modelled as a set of discrete objects, of known shape, embedded in a stochastic background, with added instrumental noise. The object shape is chosen to be a circular Gaussian approximation to the effective point spread function (PSF), and the background and instrumental noise are modelled as a Gaussian random field with power spectrum to be estimated from the data. Because both the PSF and background vary with sky position, the analysis is performed on overlapping sky patches within which the properties are assumed to be uniform. At high latitudes and low frequencies the background is dominated by the CMB, so the Gaussian assumption is a good one; near the Galactic Plane, however, the background is dominated by emission from the ISM and the assumption breaks down. In practice, however, PwS gives good results in these cases. At the highest frequencies SExtractor was found to perform better than PwS, probably because the model of the background statistics is poor, and also because many of the sources are diffuse peaks in the ISM emission and are not well represented by the PSF model.
Given these assumptions, PwS estimates source parameters by maximising the posterior probability (i.e., the product of the likelihood and an assumed prior), using a simultaneous multiple maximisation code based on Powell’s direction set algorithm (hence the name) to rapidly locate local maxima in the posterior. This novel feature makes PwS substantially faster than Monte-Carlo Markov chain methods used by Hobson & McLachlan (2003). Whether or not a posterior peak corresponds to a source is determined by Bayesian model selection using an approximate evidence value based on a local Gaussian approximation to the peak. In this step, PwS minimises the average loss matrix rather than maximising either reliability or completeness: that is, it treats spurious detections and missing detections as equally undesirable.
For detection of sources with high signal-to-noise ratio, PwS is fairly insensitive to the choice of priors. For the version of the algorithm which was used for ERCSC, a flat distribution of priors was adopted with the distribution of priors on the intrinsic source radius being uniform between 0 and for all frequencies. Since this is smaller than Planck’s spatial resolution at any frequency, the effect of the priors is to favour point sources.
After merging the results from each patch, the output of PwS is a set of source positions with estimated flux densities. The ERCSC pipeline photometry algorithms are then applied at each position to obtain other measures of flux density and size, taking into account the instrumental noise in each pixel.
2.1.2 SExtractor
SExtractor (Bertin & Arnouts 1996), as for PwS, requires local flat patches created from gnomonic projections. Each map is pre-filtered with a Gaussian kernel the same size as the beam at each frequency (the built-in filtering step within SExtractor is not used as it uses a digitised filtering grid). Typically, a Mexican hat filter gives slightly more reliable detections of point sources in the presence of noise and background, although bright extended sources are often missed. However, a Gaussian filter is adopted because simulations show that it performed almost as well as the Mexican hat for high-latitude compact sources and is still sensitive to sources that are extended. The algorithm then finds objects by isolating connected groups of pixels above a certain sigma threshold. Sources which are extremely close to each other are deblended if a saddle point is found in the intensity distribution. Spurious detections due to neighbouring bright objects are cleaned, and finally the algorithm determines the centroids of each source and performs photometry in an elliptical Kron aperture (Bertin & Arnouts 1996; Kron 1980).
The performance of SExtractor’s own adaptive aperture photometry (MAG_AUTO) is good at high latitudes for all Planck frequencies, providing flux densities to within 10 accuracy, and errors typically 1–5%. Nevertheless, at low Galactic latitudes, particularly at the highest frequencies, the photometric accuracy is significantly degraded. This is because it uses a variable Kron radius, which becomes unstable in crowded fields with strong residual background fluctuations. To ensure homogeneous flux density estimates, the primary flux density estimate is obtained from an external source extraction code, as was done for PwS.
2.1.3 Flux Density Estimation
Each source that is extracted has four different measures of flux density associated with it. These are based on aperture photometry, PSF fitting, Gaussian fitting and a measure native to the source detection algorithm (Table 2). Each of these flux density estimates has a local background subtracted but they have not been colour corrected. Colour corrections are available in Planck Collaboration (2011v).
-
1.
The FLUX and FLUX_ERR columns in the ERCSC FITS files give the flux densities measured in a circular aperture of radius given by the nominal sky-averaged FWHM. Appropriate corrections have been applied for the flux density outside the aperture, assuming that the source profile is a point source.
-
2.
The PSFFLUX and PSFFLUX_ERR columns give flux densities estimated by fitting the source with the Planck point spread function at the location of the source (Mitra et al. 2011). The Planck point spread function is estimated at each point on the sky by combining the individual horn beams with the scan strategy, where the individual beams are derived from when the scans cross planet positions. A 2D Gaussian is fit to the PSF and the derived parameters of the Gaussian are used to perform a constrained Gaussian fit to the source.
-
3.
The GAUFLUX and GAUFLUX_ERR columns give flux densities estimated by fitting the source with an elliptical Gaussian model whose parameters are free.
-
4.
The FLUXDET and FLUXDET_ERR columns gives the flux densities estimated by the native detection algorithm. For the frequencies at which PwS is used, this is estimated by utilising the mean of the posterior distribution of all parameters, while for frequencies at which SExtractor is used, it is the flux density in an elliptical Kron aperture, i.e., FLUX_AUTO. The FLUXDET values at the frequencies where PwS is used have been corrected for an average bias that was seen in the difference between the extracted and input flux density of Monte-Carlo sources that were injected into the maps. This is most likely due to an inaccurate representation of the true beam inside the PwS detection algorithm. For faint extended sources in the upper HFI frequencies, the SExtractor FLUXDET values might be useful.
Once the initial pass of the algorithm generates the list of all sources in the map, the next step is to identify the ones which are highly reliable, i.e., those that have accurate positions as well as flux density uncertainties which are less than 30%222Spurious sources can be classified as those which have an intrinsic flux density of zero but with some arbitrary extracted flux density, corresponding to a flux density error of 100%. The presence of such sources would decrease the reliability at the corresponding extracted flux density.. In the absence of a “truth” catalogue for the sky, it is not possible to definitively identify reliable sources. The significant frequency difference between Akari, IRAS and Planck at submillimetre frequencies implies that uncertain extrapolations of the thermal dust spectral energy distribution (SED) need to be made to force associations between far-infrared sources and Planck sources. At radio frequencies, deeper surveys such as those with the Green Bank Telescope, Parkes and ATCA have been undertaken (e.g. Gregory et al. 1996; Griffith et al. 1995). However, the flat-spectrum radio sources that dominate the source population vary significantly even on short time scales. In addition, the high source density of those surveys requires assumptions about the thermal and non-thermal spectral indices in order to identify possible associations between the Planck sources and the radio sources. Although these ancillary external catalogues are used for cross-validation of the final ERCSC, the primary measure of reliability for the sources uses a Monte-Carlo Quality Assessment (MCQA) analysis that is described in the next section. This is the first application of a Monte-Carlo source characterisation algorithm at these frequencies, although the practise is fairly commonplace at higher frequencies (Chary et al. 2004, and references therein). The process is described below.
| Column Name | Description |
| Identification | |
| NAME | Source name |
| FLUX | Flux density (mJy) |
| FLUX_ERR | Flux density error (mJy) |
| CMBSUBTRACT | Flag indicating detection of source in CMB subtracted maps |
| EXTENDED | Flag indicating that source is extended |
| DATESOBS | UTC dates at which this source was observed |
| NUMOBS | Number of days this source observed |
| CIRRUS | Cirrus flag based on 857 GHz source counts |
| Source Position | |
| GLON | Galactic longitude (deg) based on extraction algorithm |
| GLAT | Galactic latitude (deg) based on extraction algorithm |
| POS_ERR | Standard deviation of positional offsets for sources with this SNR (arcminute) |
| RA | Right Ascension (J2000) in degrees transformed from (GLON,GLAT) |
| DEC | Declination (J2000) in degrees transformed from (GLON,GLAT) |
| Effective beam | |
| BEAM_FWHMMAJ | Elliptical Gaussian beam FWHM along major axis (arcmin) |
| BEAM_FWHMMIN | Elliptical Gaussian beam FWHM along minor axis (arcmin) |
| BEAM_THETA | Orientation of Elliptical Gaussian major axis (measured East of Galactic North) |
| Morphology | |
| ELONGATION | Ratio of major to minor axis lengths |
| Source Extraction Results | |
| FLUXDET | Flux density of source as determined by detection method (mJy) |
| FLUXDET_ERR | Uncertainty (1 sigma) of FLUXDET (mJy) |
| MX1 | First moment in X (arcmin) |
| MY1 | First moment in Y (arcmin) |
| MX2 | Second moment in X (arcmin2) |
| MXY | Cross moment in X and Y (arcmin2) |
| MY2 | Second moment in Y (arcmin2) |
| PSFFLUX | Flux density of source as determined from PSF fitting (mJy) |
| PSFFLUX_ERR | Uncertainty (1 sigma) of PSFFLUX (mJy) |
| GAUFLUX | Flux density of source as determined from 2-D Gaussian fitting (mJy) |
| GAUFLUX_ERR | Uncertainty (1 sigma) of GAUFLUX (mJy) |
| GAU_FWHMMAJ | Gaussian fit FWHM along major axis (arcmin) |
| GAU_FWHMMIN | Gaussian fit FWHM along minor axis (arcmin) |
| GAU_THETA | Orientation of Gaussian fit major axis |
| Quality Assurance | |
| RELIABILITY | Fraction of MC sources that are matched and have photometric errors 30% |
| RELIABILITY_ERR | Uncertainty (1 sigma) in reliabiliy based on Poisson statistics |
| MCQA_FLUX_ERR | Standard deviation of photometric error for sources with this SNR |
| MCQA_FLUX_BIAS | Median photometric error for sources with this SNR |
| BACKGROUND_RMS | Background point source RMS obtained from threshold maps (mJy) |
| Bandfilling (857 GHz catalogue only) | |
| BANDFILL217 | 217 GHz Aperture Photometry Flux Density at 857 GHz Source Position (mJy) |
| BANDFILL217_ERR | Uncertainty in BANDFILL217 |
| BANDFILL353 | 353 GHz Aperture Photometry Flux Density at 857 GHz Source Position (mJy) |
| BANDFILL353_ERR | Uncertainty in BANDFILL353 |
| BANDFILL545 | 545 GHz Aperture Photometry Flux Density at 857 GHz Source Position (mJy) |
| BANDFILL54_5ERR | Uncertainty in BANDFILL545 |
2.2 Primary Reliability Selection: Monte-Carlo Analysis
Quality assessment (QA) is an integral step in the validation of a catalogue. It helps quantify flux-density biases and flux-density uncertainties, positional errors, completeness and reliability in a catalogue. QA metrics based on external (“truth”) catalogues suffer at the brightest flux densities since source numbers are sparse and resultant QA metrics are dominated by Poisson noise. In addition, generating such a truth catalogue for the sky from past observational priors, requires uncertain assumptions about the behaviour of sources across a wide range of frequencies. As a result, the Monte-Carlo QA approach is adopted as the primary criterion for selecting high reliability sources.
The goals of the Monte-Carlo QA system are:
-
1.
To quantify flux-density biases and flux-density uncertainties as a function of background.
-
2.
To quantify completeness in extracted sources as a function of flux density.
-
3.
To quantify contamination or “spurious sources” as a function of flux density.
-
4.
To assess positional offsets between extracted and input sources.
-
5.
To assess systematic uncertainties associated with beam shape, gaps in coverage, scan strategy, etc.
The first step of the MC QA analysis is to run the ERCSC pipeline on the input maps to generate a source catalogue for the true sky. Unresolved point sources, convolved with a circularly symmetric Gaussian with full-width at half maximum identical to that of the derived effective beam, are injected into the maps at random positions and with random flux densities () and re-run the main ERCSC pipeline. The typical run parameters are 1000 sources per iteration, uniformly distributed across the sky. In order to minimise Poisson variation in our estimates of QA parameters, while keeping confusion low, we execute 10 iterations. The present set of runs uses a flat distribution at all flux densities ranging from 100 mJy to 100 Jy. We have previously tested Monte-Carlo runs where the injected sources follow a flux-density distribution that is similar to the Planck Sky Model. No significant differences due to the choice of flux density distribution have been found, particularly because source extraction in the Planck maps are not significantly affected by source confusion.
We note that to precisely assess the performance of the pipeline, including systematic effects associated with the generation of the all-sky maps, the artificial sources should be injected into the time-ordered data stream and processed through each each of the data-processing steps outlined in Zacchei et al. (2011); Planck HFI Core Team (2011b). This however, is prohibitively expensive in terms of computational resources and cannot be accomplished at the present time given the rapid turnaround required for the ERCSC.
At the end of the Monte-Carlo runs, we have one catalogue which only comprises the sources detected in the original map and 10 catalogues which have the original sources in addition to the detected fraction of the fake sources that were injected into the maps. We first match the sources in the original map to each of the remaining 10 catalogues with a matching threshold of twice the FWHM. This leaves only the artificial and spurious sources in the catalogues, whose properties can then be compared to the known flux densities and positions of the injected sources.
Reliability specifies the fraction of extracted sources that differ from their input flux densities to within 30%. This is based on the flux density accuracy requirement for the ERCSC. Imposing the requirement implies that the catalogue is equivalent to a catalogue with a 5 cut if the noise were Gaussian. That is, a typical 5 source would have a flux density error that is smaller than 20%, 68% of the time, which translates to a flux density error of 30% for 90% of the sources, for a Gaussian distribution of errors. It is well known that the contribution from the Galaxy and the CMB results in a non-Gaussian distribution for the background RMS, at least on large spatial scales. Future work will attempt to build upon our increased knowledge of the foregrounds from the Planck maps and undertake a more precise characterization of the noise.
The reliability is measured as a function of root-mean-square (RMS) signal-to-background where the signal is a measure of the flux density of the source and therefore either FLUX or FLUXDET. The background RMS is derived from the RMS measured in a 2 radius annulus on the maps after individual detected sources are masked. The choice of 2 was made empirically. It was found that if the outer radius were too small, i.e., tens of minutes of arc, the RMS was similar to the RMS returned by the detection algorithms which detect sources as peaks above the local RMS. These RMS returned by the codes are typically lower than the RMS measured in the larger annulus used here. If the outer radius were too large (several degrees), background structure gets smoothed out. A radius of 2 represents a trade-off between these two extremes and yields a background RMS which is a combination of substructure in the background and the instrumental noise in the maps. The RMS is converted to a 1 background RMS for a point source, by integrating over the Planck beam.
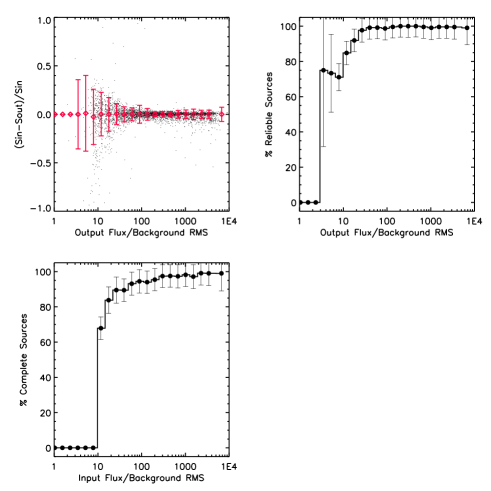
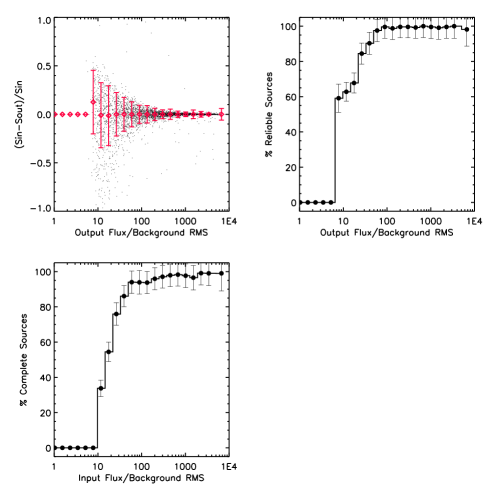
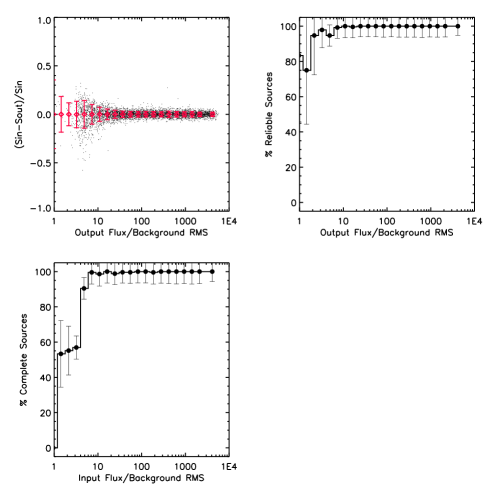
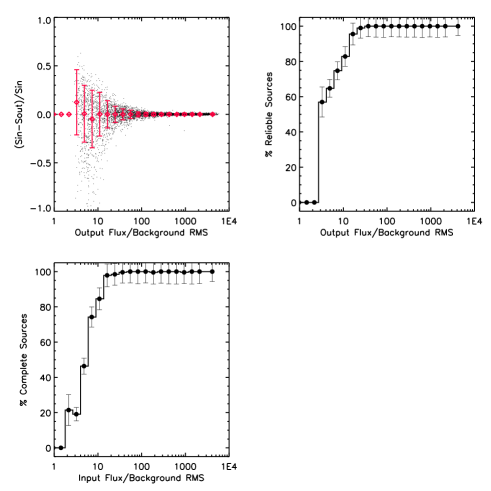
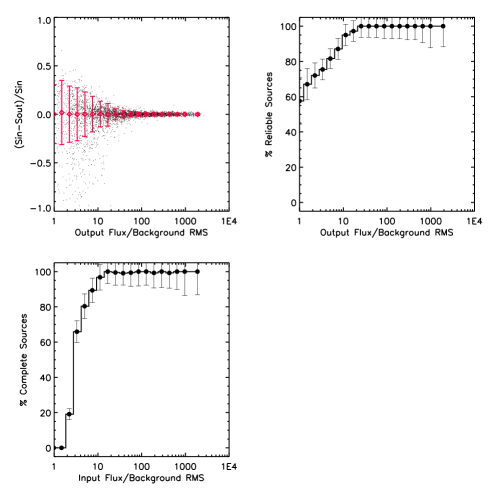
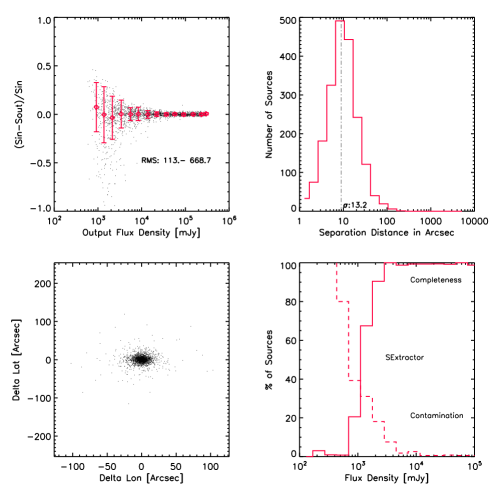
Figure 2 shows the flux-density accuracy, the positional accuracy and the differential reliability as a function of SNR at 30 GHz based on the artificially injected Monte-Carlo sources. The differential reliability is simply the reliability in each bin of SNR while the cumulative reliability is the integral of the differential reliability above a particular SNR value. Also shown in Figure 2 is the flux density accuracy, positional uncertainty, completeness and reliability as a function of flux density for the half of the sky with the lowest sky background RMS. Due to the differences between how FLUX and FLUXDET are estimated, the top panels and lower panels are not the same. First, FLUXDET flux densities have a larger scatter at almost all SNR ratios compared to FLUX. This is partly due to the prior assumptions on the source profile that are made in the estimation of FLUXDET. Deviations from this assumed source profile result in errors in the derived flux density.
Second, the FLUXDET reliabilities appear to be higher at low SNR compared to the FLUX based reliability values. At low values, the aperture flux-density based FLUX estimates tend to become increasingly affected by sky noise and even the background estimation becomes more uncertain. FLUXDET values are derived assuming a fixed source shape and a flat background. As a result, for point sources, the scatter in FLUXDET values at low SNR is smaller. When the error in the flux density estimate exceeds 30%, the reliability decreases. We note that the uncertainty on the reliability estimate is dominated by the Poisson statistics of the number of sources in the corresponding SNR bins. That is, if the completeness in a particular SNR bin is low, the uncertainty on the reliability is high. The typical uncertainty on the reliability estimate in a particular SNR bin is about 5%.
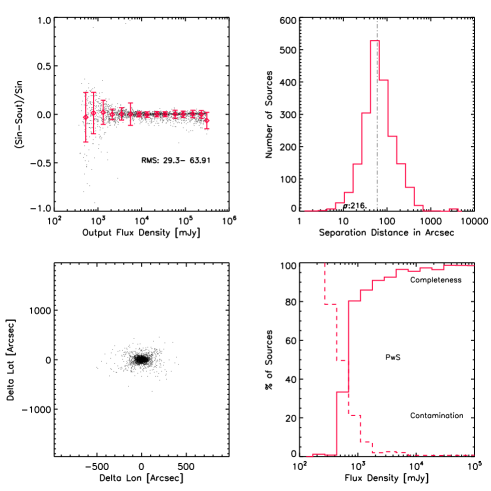
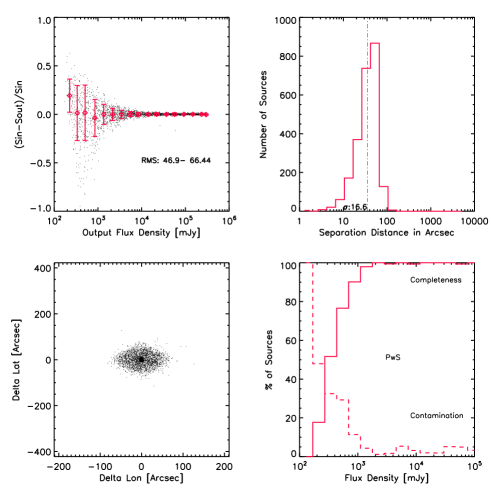
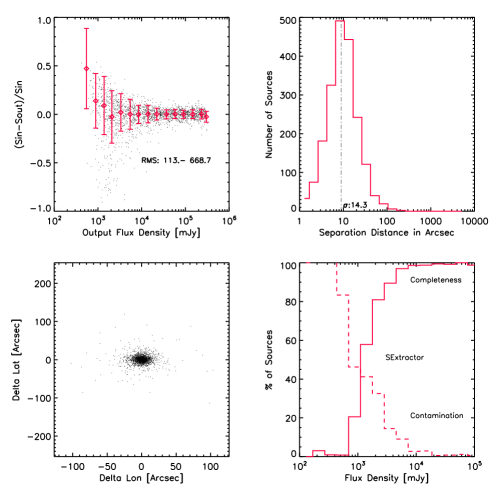
Also shown in Figure 2 is the histogram of separations between the injected and extracted positions. The 1 positional offset is approximately in low background regions, which is almost FWHM/10 at 30 GHz.
The completeness plots for the Monte-Carlo point sources are shown for illustrative purposes for the half of the sky with the lowest background RMS. Without factoring in the source size distribution and flux density distribution of the real source populations, as well as the fraction of sky observed with a particular amount of exposure time, the completeness plot cannot be used to directly infer the actual completeness of the ERCSC.
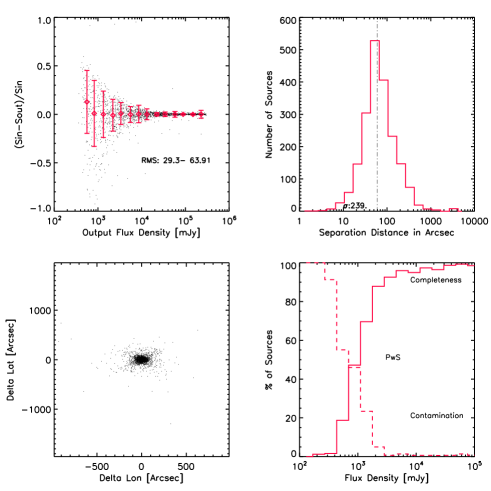
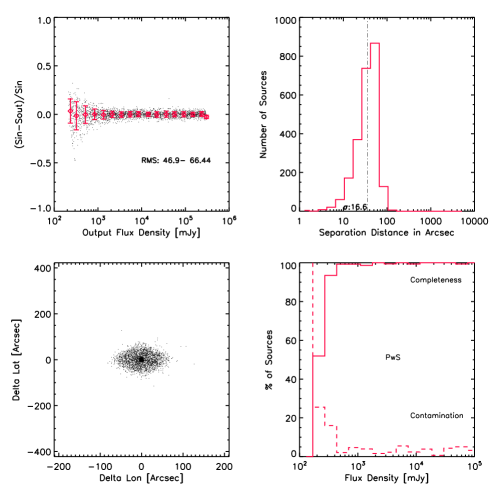
Figures 3 and 4 show similar plots for the Monte-Carlo sources at 143 and 857 GHz. Interesting trends can be observed by comparing these plots. The obvious one is an improvement in positional accuracy with increasing frequency due to the spatial resolution of Planck improving with increasing frequency. Another interesting trend is the evolution in the range of background RMS values for the cleanest half of the sky, which is provided in mJy in the numbers following “RMS:”. The numbers indicate that the background RMS is the largest at 857 GHz due to the enhanced contribution of ISM emission.
The SNR values of the real sources are then estimated from the ratio of FLUX/Background RMS or FLUXDET/Background RMS. The reliability of the Monte-Carlo sources shown in these Figures is applied to the real sources using the SNR value as the comparison metric. These reliability values are between 0 and 1 although the minimum over all frequencies after the cumulative reliability cuts are applied is 0.74. If an arbitrary source has a reliability of 0.74, it implies that 74% of the time, a source lying in a patch of sky with similar sky noise will have an estimated flux density that is accurate to within 30%.
Once the differential reliability of each source in the original map has been estimated, the sources are sorted in decreasing order of SNR. The differential reliability is converted to a cumulative reliability by integrating the differential reliability over increasing SNR values. We imposed a cumulative reliability threshold of 90% and a maximum standard deviation in the reliability of 10% for the ERCSC. This is the primary criterion used to select high reliability sources. The reliability cut is applied to both the FLUX/Background RMS as well as the FLUXDET/Background RMS, since these are two distinct measures of flux density and the resultant catalogue is the union of the two reliability cuts. The union is selected to maximise source counts since different measures of flux density tend to be more accurate in different regimes as described in Sect. 5.1.
The technique that is chosen at each frequency is the one that returns the maximum number of sources above a cumulative reliability of 90%. These happen to be our particular implementation of PwS between and GHz and SExtractor between and GHz.

2.3 Secondary Cuts in Selection of Sources
The primary selection criteria described above have been augmented by a set of secondary cuts which take into account known source artefacts in the maps.
First, the transit of bright sources (especially planets) across the beam results in a pattern of bright and dark patches that is repeated every 36 arcmin along the scan pattern, in the upper HFI bands (Planck HFI Core Team 2011b). These are due to the imprecise removal of an instrumental artefact (the 4K cooler spectral line). A subset of these patterns have been visually identified in the maps and masks have been generated for those patches of sky. These masks are reflected in the incomplete sky coverage in Table 3. If more than 5% of the pixels within one FWHM from the source fall on the mask, the source is rejected.
Second, there are known gaps in the maps associated with the masking of planets and asteroids333The following objects have been masked in the map making. Asteroids: 10 Hygiea, 11 Parthenope, 128 Nemesis, 12 Victoria, 13 Egeria, 14 Irene, 15 Eunomia, 16 Psyche, 18 Melpomene, 19 Fortuna, 1 Ceres, 20 Massalia, 29 Amphitrite, 2 Pallas, 324 Bamberga, 3 Juno, 41 Daphne, 45 Eugenia, 4 Vesta, 511 Davida, 52 Europa, 704 Interamnia, 7 Iris, 88 Thisbe, 8 Flora, 9 Metis. Comets: Broughton, Cardinal, Christensen, d’Arrest, Encke, Garradd, Gunn, Hartley 2, Holmes, Howell, Kopff, Kushida, LINEAR, Lulin, McNaught, NEAT, Shoemaker-Levy 4, SidingSpring, Tempel 2, Wild 2. . If sources have any of their pixels within one FWHM falling on such a gap, the source is rejected. This prevents edge effects due to the side lobes of bright planets from being classified as sources and also prevents the introduction of large errors in the photometry of sources.
Third, sources are also required to have either an aperture-photometry () or a detection method photometry (). The distinction is important, due to the fact that the photometry from the PowellSnakes implementation consistently underestimates the flux density for even marginally extended sources at the lower frequencies.
Fourth, due to the requirements on the flux-density accuracy in the ERCSC, the standard deviation in the photometric error for the artificial sources with the same SNR as the real source is required to be less than 30%.
Fifth, in order to remove extended sources associated with substructure in the Galactic ISM, we eliminate non-circular sources (ELONGATION 3) in the upper HFI bands. These are sources whose ratio of major to minor axis is greater than three.
As a sixth criterion, we also insist that the aperture flux density is positive (APERFLUX 0), which alleviates problems due to sources whose sky background estimate is biased high by the presence of bright sources in the sky annulus. These sources will have uncertain photometry and are therefore rejected.
The final ERCSC compilation is the list of sources which have satisfied the primary Monte-Carlo based reliability criterion as well as all the aforementioned secondary QA criteria. These cuts imply that about half the sources in the uncut lower frequency catalogues and about a third of the sources in the upper frequency catalogues are classified as high reliability sources.
As mentioned earlier, each source has four different measures of flux density associated with it. These flux density values have not been colour corrected. Users should identify appropriate colour corrections from Planck Collaboration (2011v) and apply them to the flux densities. The absolute calibration uncertainty of the HFI and LFI instruments is better than 7% at all frequencies (Zacchei et al. 2011; Planck HFI Core Team 2011b). However, the requirements on the ERCSC are a photometric accuracy of 30%.
3 Characteristics of the ERCSC
3.1 Sky Coverage and Sensitivity
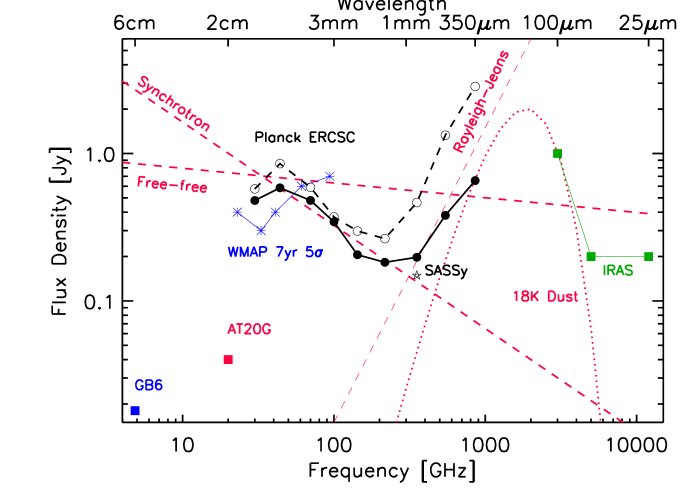
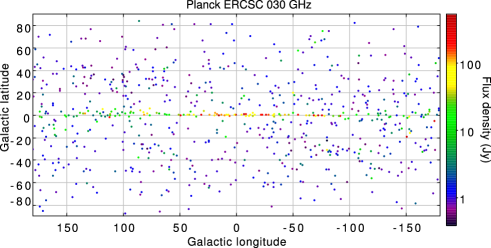
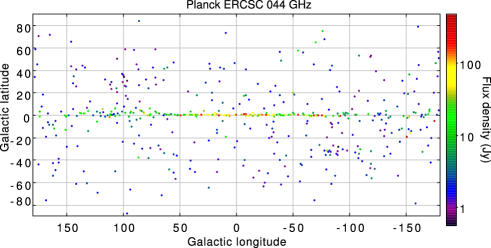
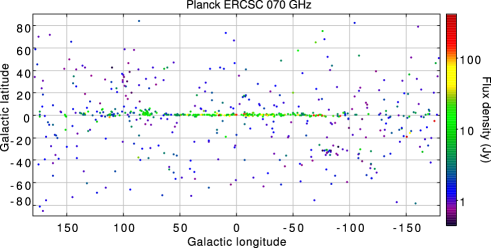
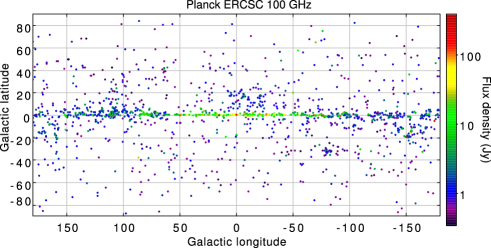
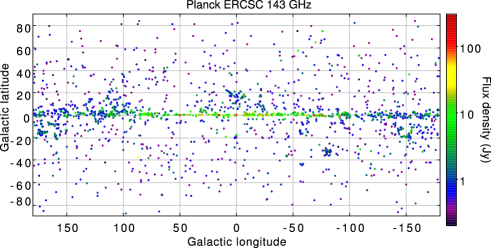
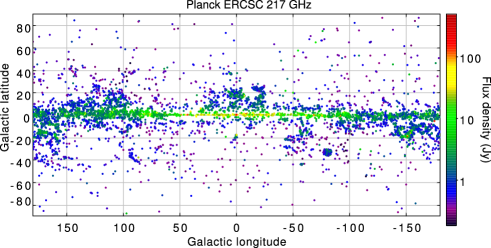
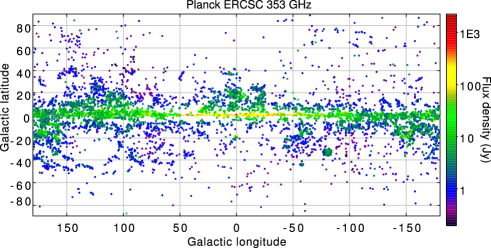
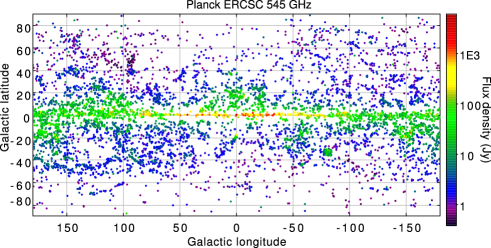
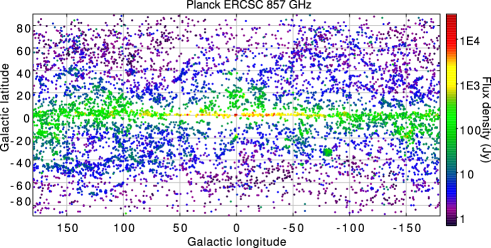
Table 3 shows the fraction of sky coverage, the beam FWHM and the sensitivity of the ERCSC after all cuts have been applied. Although the 10 values are quoted, sources which are up to a factor of 2 fainter and located in regions of low sky background are included in the ERCSC since they meet the high reliability criterion described in the previous section. As an illustration, Figure 5 shows the flux density limit of Planck both in the Galactic Plane () and at high Galactic latitude () relative to other wide area surveys at comparable frequencies. Also shown are the spectrum of typical sources of foreground emission. Figures 6 show the all sky distribution of sources colour coded by flux density.
| Freq [GHz] | 30 | 44 | 70 | 100 | 143 | 217 | 353 | 545 | 857 |
| [m] | 10000 | 6818 | 4286 | 3000 | 2098 | 1382 | 850 | 550 | 350 |
| Sky Coverage in % | 99.96 | 99.98 | 99.99 | 99.97 | 99.82 | 99.88 | 99.88 | 99.80 | 99.79 |
| Beam FWHM [arcmin]a𝑎aa𝑎aThe precise beam values are presented in Zacchei et al. (2011) and Planck HFI Core Team (2011b). This table shows the values which were adopted for the ERCSC. | 32.65 | 27.00 | 13.01 | 9.94 | 7.04 | 4.66 | 4.41 | 4.47 | 4.23 |
| # of Sources | 705 | 452 | 599 | 1381 | 1764 | 5470 | 6984 | 7223 | 8988 |
| # of Sources | 307 | 143 | 157 | 332 | 420 | 691 | 1123 | 2535 | 4513 |
| 10b𝑏bb𝑏bFlux density of the median 10 source at in the ERCSC where is the photometric uncertainty of the source. [mJy] | 1173 | 2286 | 2250 | 1061 | 750 | 807 | 1613 | 2074 | 2961 |
| 10c𝑐cc𝑐cFlux density of the faintest 10 source at in the ERCSC. [mJy] | 487 | 1023 | 673 | 500 | 328 | 280 | 249 | 471 | 813 |
| Flux Density Limitd𝑑dd𝑑dFaintest source at in the ERCSC. [mJy] | 480 | 585 | 481 | 344 | 206 | 183 | 198 | 381 | 655 |
3.2 Statistical Nature of Sources
In this section, we characterise the sources detected by Planck at each frequency. A source, called source one, at frequency one is associated with a source, called source two, at frequency two, if it lies within , if source two is the closest source at frequency two to source one, and vice versa. The results are summarised in Table 4. Naturally, at the lowest frequency, 30 GHz, it is impossible to find associations at a lower frequency and hence columns B & C are blank. Similarly, at the highest frequency, 857 GHz, it is impossible to find associations at a higher frequency and hence columns B & D are blank.
We find that at 30 GHz, where the radio spectrum might have a significant optically thin synchrotron emission component (which implies decreasing flux density with increasing frequency), the number of sources seen in the adjacent passband is 54%. Similarly, at the highest frequency where the thermal dust emission has a steep spectrum of the form , the fraction of 857 GHz sources seen at 545 GHz is predictably low due to the relative sensitivities of the two bands. However, at the intermediate frequencies, the fraction of sources which are associated with sources in the adjacent bandpasses is high. Although the fraction of associations is not 100%, we can use the spectral information from these associations to characterise the nature of sources at each frequency.
| Frequency | A | B | C | D | E | F |
|---|---|---|---|---|---|---|
| 30 | 705 | … | … | 379 | 379 | 0.54 |
| 44 | 452 | 334 | 379 | 388 | 433 | 0.96 |
| 70 | 599 | 363 | 389 | 520 | 546 | 0.91 |
| 100 | 1381 | 496 | 520 | 1104 | 1128 | 0.82 |
| 143 | 1764 | 929 | 1106 | 1357 | 1534 | 0.87 |
| 217 | 5470 | 1067 | 1357 | 4190 | 4480 | 0.82 |
| 353 | 6984 | 2848 | 4189 | 4244 | 5585 | 0.80 |
| 545 | 7223 | 3404 | 4245 | 5363 | 6204 | 0.86 |
| 857 | 8988 | … | 5365 | … | 5365 | 0.60 |
The spectral index is calculated by fitting a single power law () to the flux density of sources in adjacent bands. For 30 GHz sources, only the 30 and 44 GHz flux densities of sources are considered. Similarly, at 857 GHz, only the 545 and 857 GHz flux densities of sources are fit. For all the intermediate bands, the frequencies just below and just above are included in the fit, if the source is detected in the ERCSC.
Figure 7 shows the distribution of spectral indices for the sources within which are likely to be sources within our Galaxy. At low frequencies, the median SED of sources in the Galactic Plane is an spectrum. The distribution of values significantly broaden between 30 and 100 GHz, likely due to varying amounts of free-free emission along different sightlines. At 100 GHz, the spectrum becomes noticeably flatter with a median , partly due to the increasing contribution of thermal dust emission and partly due to the large contribution from the CO line to the 100 GHz flux density. At 143 GHz, the spectral index distribution shows the presence of both radio sources as well as the dominant contribution from sources with thermal dust emission. Expectedly, at higher frequencies, the distribution of spectral indices is narrow and is centred between and , tracing the Rayleigh-Jeans component of dust emission. The reason the median is almost 3 at 217 GHz but evolves to 2 at 857 GHz is a selection effect. As can be seen in Figure 5, thermal dust emission with emissivity 0 would increase faster with increasing frequency compared to a Rayleigh-Jeans spectrum, relative to the Planck sensitivity. As a result, sources at the intermediate frequencies can span a broader range of spectral indices than a faint source at 857 GHz which would have an estimated spectral index only if it were detected at 545 GHz, and thereby preferentially have a spectrum that is less steep.
Figure 8 shows the distribution of spectral indices for the sources at which are likely to be extragalactic. At the lower frequencies, the distribution of spectral indices is centred at . However, unlike the Galactic sources where the distribution broadens with increasing frequency, among the extragalactic sources, the spectral index distribution narrows between GHz. There are two possible origins for this. One is that the CO contribution is generally negligible for the extragalactic sources and that the larger distribution of spectral indices around 100 GHz for the Galactic sources is simply a tracer of variation of the CO contribution to the broadband photometry. A second possibility is that the spectral index distribution of Galactic sources is intrinsically broader while the extragalactic sources at 100 GHz are dominated by a power-law distribution of electrons produced in relativistic shocks, which tend to display a more uniform power-law index. At 143 and 217 GHz, the radio source population continues to dominate although the dusty sources start to become significant. This is in contrast to the Galactic population where the infrared luminous sources are the dominant contributor. It is also striking that even at 353 GHz, the radio source population continues to make a significant contribution. At the highest frequencies, both the Galactic and extragalactic source populations show similar behaviour expected from the Rayleigh-Jeans tail of dust emission.
A comparison with the statistical properties of sources found in the South Pole Telescope 1.4mm and 2mm surveys (Vieira et al. 2010) is warranted. The SPT surveys found that 30% of the 1.4mm sources are dusty while the majority are synchrotron dominated. This is similar to the results for the high Galactic latitude ERCSC sources; 25% of the ERCSC 217 GHz sources show an SED consistent with thermal dust emission. The difference however is that the dusty sources observed by the SPT dominate at fainter flux densities (15 mJy). In contrast, the dusty population in the ERCSC appears to be at brighter flux densities with a median FLUX of 2.4 Jy, while the synchrotron sources have a median FLUX of 0.8 Jy. This difference is because the ERCSC 217 GHz dusty sources are associated with the Large Magellanic Cloud and are thereby brighter than the typical dusty sources that the SPT has observed.


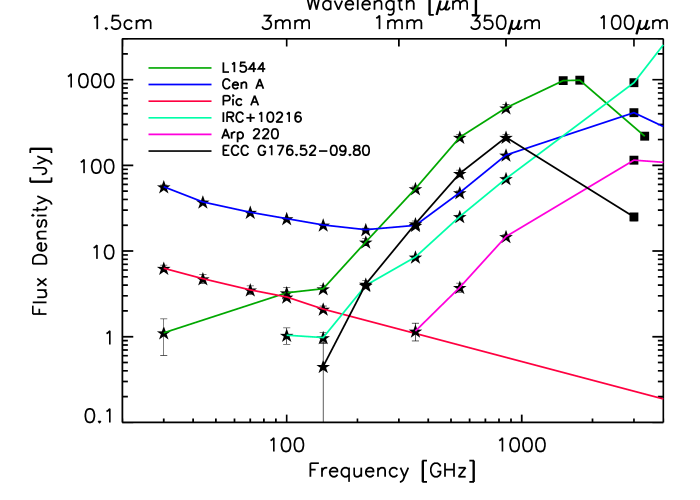
3.3 Individual Case Studies
The SED of representative sources of different classes that can be found in the ERCSC are presented in this sub-section. The selected sources are a pre-stellar core L1544 (Ward-Thompson et al. 2002), an extragalactic radio source Centaurus A, a synchrotron dominated radio galaxy Pictor A, IRC+10216 which is the prototype of stars with dust shells, the starbursting ultraluminous infrared galaxy Arp 220 and the cold stellar core ECC G176.52-09.80. The sensitivity and wavelength coverage of Planck enables synchrotron emission, thermal bremsstrahlung emission, thermal dust emission as well as the transition frequencies between the emission processes to be studied. Figure 9 shows the SED of these representative sources.
Since some of these sources are extended at the Planck angular resolution, the ERCSC Gaussian fit flux densities (i.e. “GAUFLUX”) are shown, except in the cases where the fit failed in the low signal-to-noise regime. In those cases the aperture photometry values (i.e. “FLUX” in the ERCSC) are plotted. Uncertainties include the Monte-Carlo estimate of flux density uncertainties. The plotted SED also show IRAS and/or ISO flux densities at far-infrared wavelengths. Planck can clearly reveal the contribution of cold dust at wavelengths longward of IRAS/ISO and observe the transition from thermal dust emission to synchrotron/free-free radio emission.
4 Validation of the ERCSC
At the three lowest frequencies of Planck, it is possible to validate ERCSC source identifications, reliability, positional accuracy and flux density accuracy using external data sets, particularly large-area radio surveys. This external validation was undertaken using the following catalogues and surveys: (1) full sky surveys and catalogues: WMAP 5-year catalogue (Wright et al. 2009) and the NEWPS catalogue, based on earlier WMAP results (Massardi et al. 2009); (2) in the southern hemisphere the AT20G survey at 20 GHz (Murphy et al. 2010); (3) in the northern hemisphere, where no large-area, high-frequency survey like AT20G is available, we used CRATES (Healey et al. 2007).
An ERCSC source was considered reliably identified if it falls within a circle of radius one half the Planck beam FWHM which is centered on a source at the corresponding frequency in one of the above catalogs. This means of identification was employed at where confusion was less of a problem and the majority of the sources were extragalactic. Very few such sources were spatially resolved by Planck. Table 5 shows the percentage of sources thus identified. For the three lowest Planck frequencies and for , the ERCSC clearly meets its 90% reliability specification as measured by this external validation. Table 5 also displays results of an attempt to assess reliability of ERCSC sources in the Galactic Plane at . Here, an ERCSC source was considered reliably identified if it falls within from Galactic objects like planetary nebulae, supernova remnants, HII regions (or in a few cases, extragalactic sources that happen to be found at low Galactic latitude). The percentage of identifications in the Galactic Plane is lower, but still leaves the overall reliability figures at greater than 90%, meeting the ERCSC specification for reliability.
| Frequency | # at | # Identified | # at | # Identified | Total # | # Identified |
|---|---|---|---|---|---|---|
| 30 | 563 | 547 (97%) | 142 | 95 (67%) | 705 | 642 (91%) |
| 44 | 278 | 265 (95%) | 176 | 144 (82%) | 454 | 409 (90%) |
| 70 | 320 | 289 (90%) | 280 | … | 600 | … |
We also examine the positional accuracy of ERCSC sources by comparing positions taken from the ERCSC with those determined quasi-simultaneously using the Very Large Array (VLA) of the US National Radio Astronomy Observatory. ERCSC positions were also compared to the positions of several hundred bright quasars (Figure 10) at frequencies of 353 GHz and below where a significant fraction are detected. The median scatter in offset for frequencies 30–217 GHz was 2.0, 1.7, 1.1, 0.8, 0.7, 0.3 and 0.35 arcmin. The results of these two tests are consistent, and suggest that the ERCSC clearly meets its specification of RMS scatter in positions being less than FWHM/5.


A comparison between the ERCSC flux densities with VLA measurements of the same source has also been made (Figure 11) and is discussed in Planck Collaboration (2011j). At both 30 and 44 GHz the two flux density scales appear to be in good overall agreement with any difference attributable partly to noise in the Planck measurements and partly due to variability in the radio sources, since the Planck and VLA measurements were not exactly simultaneous. At 70 GHz however, the comparison is challenging since the VLA measurements are made at 43 GHz and an extrapolation needs to be made assuming some spectral index for the source. If a simple extrapolation to a 70 GHz flux density is made based on the VLA 22–43 GHz spectral index, the extrapolated VLA values are either too high or the flux density scale of Planck is too low. The most likely interpretation of this discrepancy is that the spectral index of radio sources detected by Planck steepens at frequencies above 44 or 70 GHz. If, for instance, a spectral index change of is allowed at frequencies above 43 GHz, the agreement between the extrapolated and measured 70 GHz fluxes would be entirely acceptable (Planck Collaboration 2011j).
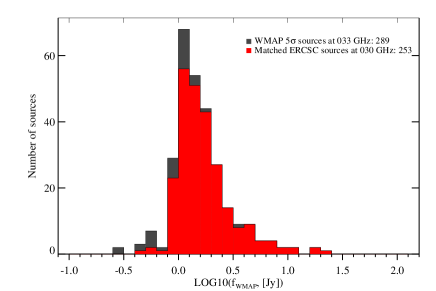
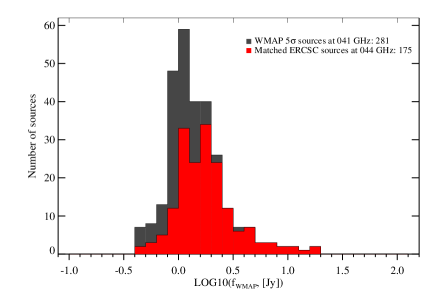
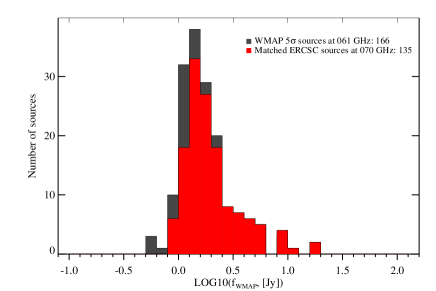
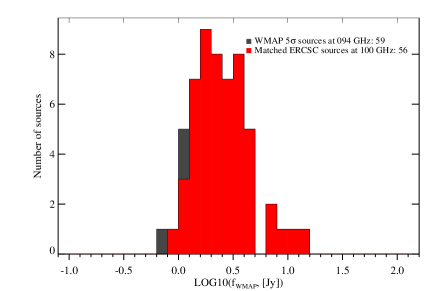
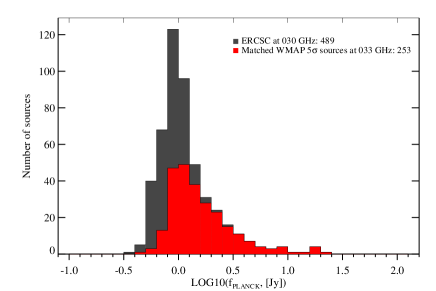
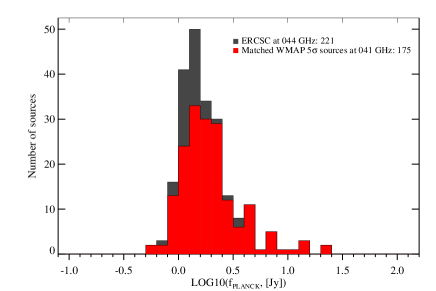
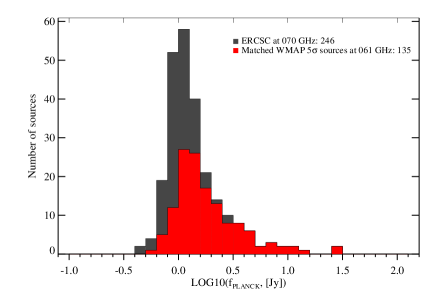
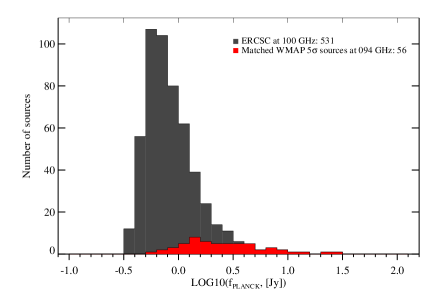
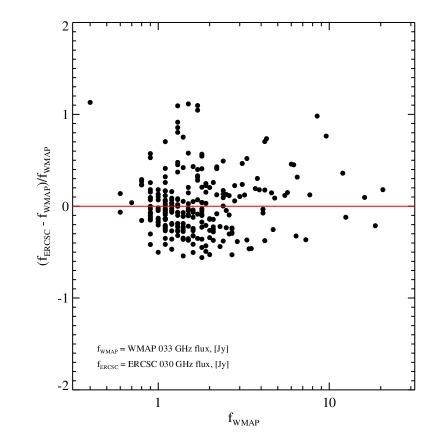
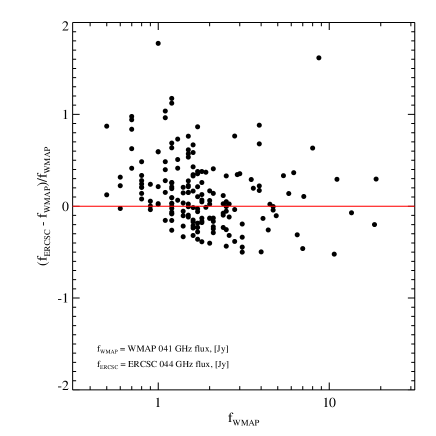
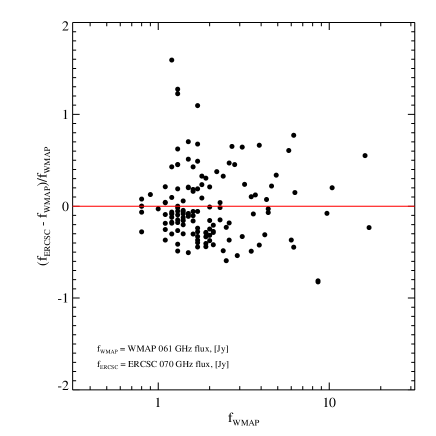
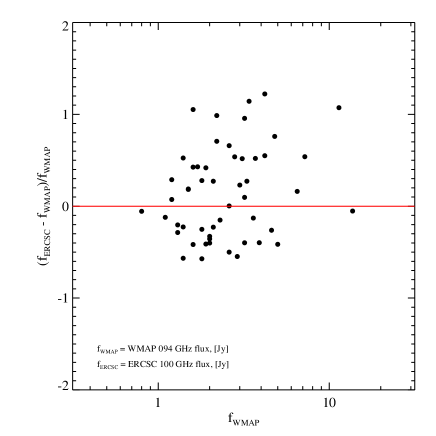
A comparison between the ERCSC sources and the WMAP point source catalogue was also undertaken. The WMAP seven-year catalogue (Gold et al. 2011) contains a total of 471 sources in the five WMAP bands. We have compared the WMAP 5 sources at 33, 41, 61, 94 GHz with the sources in the ERCSC at 30, 44, 70 and 100 GHz, respectively. A search radius corresponding to the FWHM of the WMAP beam at each frequency (0.66, 0.51, 0.35, 0.22 at 33 to 94 GHz channels) is used to find a match of WMAP sources in the ERCSC. Figure 12 shows the histogram distribution of WMAP flux densities; the WMAP 5 sources are shown in gray, and the ones with an ERCSC match are in red. The ERCSC include 88, 62, 81 and 95 of the WMAP 5 sources at the four bands, individually. Figure 13 is a similar plot, but shows the histogram distribution of the ERCSC flux densities: the ERCSC sources are shown in gray, and the ones with a WMAP match are in red. The WMAP seven-year point source catalogue mask which excludes the Galactic Plane and the LMC/SMC region has been applied to the ERCSC beforehand to ensure the same sky coverage. It is evident that the ERCSC is a much deeper and more complete catalogue than the WMAP 7 year catalog, especially at the 100 GHz channel.
The WMAP 5 detections that are missed in the ERCSC at 30, 70 and 100 GHz are further investigated. The 44 GHz channel is skipped since it is known to have lower sensitivity compared to the WMAP 7-year data. It is found that at 100 GHz, all the missed WMAP sources can be explained by either the WMAP source not having a 5 GHz counterpart or only being weakly associated with a 5 GHz source suggesting that the WMAP source might be spurious. At 70 GHz, of the unmatched sources are variable (this is a lower limit as the variability info was obtained from the WMAP five-year catalog, which is a subset of the WMAP seven-year catalog), of the unmatched sources have no 5 GHz ID or are only loosely associated with a 5 GHz source, are recovered after the CMB subtraction. At 30 GHz, of the unmatched sources are variable (again, this is only a lower limit), of the unmatched sources have no solid identification, are recovered after the CMB subtraction. This analysis suggests that the reason these sources are not detected in Planck is a combination of source variability, map sensitivity (different scanning strategy of WMAP and Planck result in a difference in the local background noise; also the ERCSC is based on 1.6 sky surveys whereas the WMAP catalogue is based on 14 sky surveys), and incompleteness of the ERCSC.
The similarity between the WMAP frequencies and Planck bands also motivates a comparison between their flux densities which is shown in Figure 14. Overall we find there is no systematic difference between the WMAP and ERCSC flux densities at the corresponding bands. The significant scatter in Figure 14 again indicates that variability is an issue. There is no variability analysis of the WMAP seven-year point sources, but an analysis of the variability on the five-year WMAP point sources mentioned above, shows that a high fraction of the sources are variable at greater than 99 confidence, and these are in general the brighter sources (Wright et al. 2009).

5 The ERCSC: Access, Contents and Usage
The ERCSC is available from both the ESA Planck Legacy Archive666http://www.sciops.esa.int/index.php?project=planck&page=Planck_Legacy_Archive and the NASA Infrared Science Archive777http://irsa.ipac.caltech.edu/Missions/planck.html (IRSA).
The source lists contain 35 columns per source at the LFI bands and 36 columns at the HFI bands. The 857 GHz source list has six additional columns which consist of the band-filled flux densities and flux uncertainties at the three adjacent lower frequencies, 217, 353 and 545 GHz for each source detected at 857 GHz. The locations of sources are provided in Galactic coordinates. In addition, we also provide for each detected source, a postage-stamp cutout of the source from the all sky map of the corresponding frequency after the CMB has been subtracted. The size of the cutout is a square of side 4FWHM at the corresponding frequency. The primary purpose of these cutouts is to aid in the visual validation of sources. We also provide notes in a text file, one per frequency, for particular sources in the catalogues which state associations of the ERCSC source with sources in ancillary catalogues (e.g. IRAS, GB6, WMAP) as well as potential variability information.
Including the ECC and ESZ, the entire data release thus consists of 11 source list files, 11 all-sky source distribution maps, 11 notes files and postage-stamp cutouts in JPEG format of all the sources detected at the nine individual frequencies as well as in the ECC list. No postage stamp cutouts are provided for the ESZ.
5.1 Catalogue Contents and Usage
The key columns in the catalogues are:
-
1.
source identification: NAME (string)
-
2.
position: GLON, GLAT, POS_ERR which gives the Galactic coordinates in degrees and the estimated 1 positional uncertainty in arcminutes.
-
3.
flux density: FLUX, FLUX_ERR in mJy measured in a circular aperture with radius equal to the nominal FWHM of the beam.
The one additional column for the HFI bands compared to the LFI bands is due to the inclusion of a cirrus estimate, described below.
Individual sources can be searched for in the list either by Galactic coordinates (GLON, GLAT), or by the equivalent J2000 equatorial coordinates (RA, DEC). The 1 positional uncertainty for a source, given by POS_ERR in arcminutes, depends on the local background RMS and SNR. This uncertainty is only a measure of the uncertainty for fitting the location of the source in the maps and does not take into account any astrometric offset in the maps. Furthermore, POS_ERR is measured from the positional uncertainty of artificial point sources injected into the maps. As a result, sources might have larger positional uncertainties which are not reflected in this value (See Section 2).
When a source is classified as extended, we set EXTENDED=1. This implies that the square root of the product of the major and minor axis of the source is 1.5 times larger than the square root of the major and minor axis of the estimated Planck point spread function at the location of the source, i.e.,
| (3) |
In the upper HFI bands, sources which are extended tend to be associated with structure in the Galactic interstellar medium although individual nearby galaxies are also extended sources as seen by Planck [see Planck Collaboration (2011l)]. The choice of the threshold being set at 1.5 times the beam is motivated by the accuracy with which source profiles can be measured from maps where the Point Spread Function is critically sampled (1.7′ pixel scale for a 4′ FWHM). Naturally, faint sources for which the Gaussian profile fit might have failed do not have the EXTENDED tag set.
As described in Sec. 2.1.3, four measures of flux density are provided in mJy. For extended sources, both FLUX and PSFFLUX will likely be significant underestimates of the true source flux density. Furthermore, at faint flux densities corresponding to low signal-to-noise ratios (less than 20), the PSF fit might have failed. This would be represented either by a negative flux density or by a significant difference between the PSFFLUX and FLUX values. In general, for bright extended sources, we recommend using the GAUFLUX and GAUFLUX_ERR values although even these might be biased high if the source is located in a region of complex, diffuse foreground emission.
Uncertainties in the flux density measured by each technique are reflected in the corresponding “_ERR” column. The flux uncertainties derived from the artificial point sources injected into the maps are available in MCQA_FLUX_ERR. MCQA_FLUX_ERR is the standard deviation of the dimensionless for input and output flux densities based on the aperture flux density (i.e., FLUX) at the signal-to-noise ratio of the source. We believe that the most conservative flux uncertainty is the quadrature sum of the Monte-Carlo flux uncertainty and the “_ERR” value relevant for the appropriate flux density (FLUX, PSFFLUX, GAUFLUX or FLUXDET).
MCQA_FLUX_BIAS provides the median in the difference between the injected flux and extracted aperture flux of the artificial point sources. In principle, the bias should be close to zero if the aperture corrections are precisely known, the aperture is perfectly centred on each source, and the background can be precisely estimated. In practice, there is an offset of a few percent, which can become large at the lowest signal-to-noise ratios or in high-background regions. This is a median offset estimated as a function of SNR from the artificial point sources, and has already been applied to the FLUX value of all sources. The bias correction has been applied such that the FLUX in the catalogue is the measured flux density divided by (1-MCQA_FLUX_BIAS) and increases the flux density values by about 5%.
The 1 point source flux uncertainty due to structure in the background is given in BACKGROUND_RMS in units of mJy. At the lowest frequencies this is a combination of CMB noise and instrumental noise, with the latter dominating. At 143 GHz, the noise is dominated by the CMB. At higher frequencies, it is dominated by Galactic ISM. The ratio of source flux density to BACKGROUND_RMS is the primary parameter which is used to calibrate the RELIABILITY of sources.
The dates on which the source was observed are included in DATESOBS (UTC) in the yyyymmdd format. This will be useful in the analysis of time-variable sources. The flux-density value in the ERCSC is an average over all the dates of observations.
Sources in the HFI bands each have a CIRRUS number which is based on the number of sources (both low and high reliability) within a 2 radius of the source, in raw 857 GHz catalogues derived from the maps. The number has been normalised to a peak value of one. The normalisation factor is in practice, derived from the number density of sources in the Large Magellanic Cloud region where the maximum number of 857 GHz sources is located.
Finally, each source has a CMBSUBTRACT flag. This flag has values of 0, 1 or 2. The value is 0 if the source is detected in the CMB-subtracted maps and has an aperture flux difference . CMBSUBTRACT=1 if the source is detected in the CMB subtracted maps but has a flux difference of greater than 30%. CMBSUBTRACT=2 if the source is not detected in the CMB subtracted maps. CMB subtraction results in artefacts in the maps which might remove real sources. It is recommended that a conservative user who wants a guarantee of source detection in follow-up observations neglect sources with CMBSUBTRACT=2.
5.2 Cautionary Notes in Usage of Catalogues
In this section, we list some cautionary notes associated with usage of the ERCSC list.
-
•
Statistical Character: The ERCSC list is an early list of highly reliable sources from the first Planck all sky survey. It is not a flux density limited sample or even a complete sample of sources and therefore care should be taken before undertaking statistical studies such as source counts. This is partly due to the fact that the scan strategy results in significant variation in instrumental sensitivity as a function of position on the sky. In addition, the relative contribution of astrophysical sources of “noise” such as the CMB and the emission from the Galactic interstellar medium (ISM) vary across the Planck frequencies. The CMB contribution peaks between 100 and 143 GHz while the ISM contribution peaks above 857 GHz. In conjunction with the varying spatial resolution, this results in varying limits to the sensitivity of sources that can be detected both as a function of position on the sky and as a function of frequency. The Monte-Carlo analysis presented later, does quantify this variation in sensitivity for the overall catalogue. However, the estimates for the fraction of sky area above a particular completeness limit, have not been factored into the catalogue.
-
•
Variability: At radio frequencies, many of the extragalactic sources are highly variable. A small fraction of them vary even on time scales of a few hours based on the brightness of the same source as it passes through the different Planck horns. Follow-up observations of these sources might show significant differences in flux density compared to the values in the data products. Although the maps used for the ERCSC are based on 1.6 sky coverages, the ERCSC provides only a single average flux density estimate over all Planck data samples that were included in the all sky maps and does not contain any measure of the variability of the sources. The Planck Quick Detection System (QDS; Aatrokoski et al. 2010) attempts to quantify the variability of sources seen by Planck. The information from the QDS has been included in the notes for certain sources.
-
•
Contamination from CO: At infrared/submillimetre frequencies (100 GHz and above), the Planck bandpasses straddle energetically significant CO lines (Figure 15). The effect is the most significant at 100 GHz, where the line might contribute more than 50% of the measured flux density. Follow-up observations of these sources, especially those associated with Galactic star-forming regions, at a similar frequency but different bandpass, should correct for the potential contribution of line emission to the continuum flux density of the source. See Planck HFI Core Team (2011b) for details.
-
•
Photometry: Each source has multiple measures of photometry FLUX, GAUFLUX, PSFFLUX and FLUXDET as defined above. The appropriate photometry to be used depends on the nature of the source. For sources which are unresolved at the spatial resolution of Planck, FLUX and PSFFLUX are most appropriate. Even in this regime, PSF fits of faint sources fail and consequently these have a PSFFLUX value of “NaN” (“Not a Number”). For bright resolved sources, GAUFLUX might be most appropriate although GAUFLUX appears to overestimate the flux of sources close to the Galactic plane due to an inability to fit for the contribution of the Galactic background at the spatial resolution of the data. For faint resolved sources in the upper HFI bands, FLUXDET, which is the flux density in an elliptical Kron aperture provided by SExtractor, might give the most accurate numbers. The user should also note that the absolute calibration of flux-density values are required to be accurate to within about 30% although the signal-to-noise of the sources are much higher.
-
•
Cirrus/ISM: A significant fraction of the sources detected in the upper HFI bands could be associated with Galactic interstellar medium features or cirrus. The IRAS 100 m surface brightness in MJy sr-1 for each of the sources, which is commonly used as a proxy for cirrus, is available through a search of the ERCSC with IRSA. Candidate ISM features can also be selected by choosing objects with EXTENDED=1 although nearby Galactic and extragalactic sources which are extended at Planck spatial resolution will meet this criterion. Alternately, the value of CIRRUS in the catalogue can be utilised to flag sources which might be clustered together and thereby associated with ISM structure.
6 Astrophysical Source Classes Identified by their Multifrequency Signature
In addition to the single frequency catalogs described in the previous sections, there are two other source catalogs that are provided as part of the ERCSC. These two additional catalogs leverage the spectral signature of two specific classes of astrophysical sources through the Planck bands and are generated using specialized multifrequency algorithms which have been developed within the Planck Collaboration. These are a list of galaxy clusters detected through the Sunyaev-Zeldovich effect and cold pre-stellar cores identified by the derived far-infrared color temperature in fits to the Planck photometry.
6.1 The Early Sunyaev-Zeldovich Cluster Catalogue
The Planck Early Release Sunyaev-Zeldovich (ESZ) cluster sample [described in more detail in Planck Collaboration (2011d)] is a list of 189 SZ cluster candidates which are detected by their multi-frequency signature in the Planck bands. The thermal SZ effect is the result of energetic electrons in the hot intra-cluster medium inverse-Compton scattering off the CMB photons. The net result is a distortion in the shape of the CMB spectrum, which results in a deficit of flux density below 220 GHz and an increment in flux density at higher frequencies (Sunyaev & Zel’dovich 1972; Carlstrom et al. 2002). By utilising a matched multi-frequency filter, the spectral signature of this distortion can be detected and measured in the Planck all-sky maps, which enables cluster candidates to be detected.
The ESZ sample generated as part of the Planck early data release is the result of a blind multi-frequency search in the all sky maps, i.e., no prior positional information on clusters detected in any existing catalogues was used as input to the detection algorithm. The ESZ sample is produced using one of the four matched multi-frequency filter (MMF) algorithms available within the Planck collaboration (hereafter MMF3; see Melin et al. (2010) for details of the comparison of the cluster extraction algorithms available within the collaboration). MMF3 is an all-sky extension of the algorithm described in Melin et al. (2006) and is run blindly over the six HFI frequency maps. The technique first divides the all-sky maps into a set of overlapping square patches. The matched multi-frequency filter then optimally combines the six frequencies of each patch, assuming the SZ frequency spectrum and using the Arnaud et al. (2010) pressure profile as the cluster profile. Auto- and cross- power spectra used by the MMF are directly estimated from the data. They are thus adapted to the local instrumental noise and astrophysical contamination such as ISM emission. For each patch, the scale radius of the cluster profile is varied to maximise the signal-to-noise ratio of each detection. The algorithm thus assigns to each detected source an estimated size and an integrated flux. The detected sources extracted from individual patches are finally merged into an all-sky cluster list. Non-SZ sources captured by the MMF algorithm can contaminate the list and an additional step of validation of the detection is needed.
Unlike the individual frequency source list or the ECC list, which are validated through a Monte-Carlo technique, the reliability of the ESZ list has been estimated through a validation process based on internal checks and on cross-checks with ancillary optical/near-infrared and X-ray cluster catalogues or images. Cross-matches with the Meta-Catalogue of X-ray detected Clusters of galaxies (MCXC hereafter; Piffaretti et al. 2010), Abell and Zwicky catalogues, SDSS-based catalogues, MAXBCG and Wen et al. (2009) and a compilation of SZ observed clusters were undertaken. For each known X-ray cluster, several entries are available among which the identifiers, redshift, coordinates, total mass , and radius were used during the external validation process. R500 is the radius that encompasses a mean matter density which is 500 times the critical density at the corresponding redshift. R500 is less than the virial radius of the cluster. is the mass within . Further searches in Virtual Observatory (VO) and in logs of observatories were performed. The goal of this search was to identify cluster candidates which might already have ancillary data available for community access. Of the 189 cluster candidates, 169 are associated with known X-ray or optical clusters and the Planck data provides the first measure of the SZ signature for the majority of them. In addition to the cross-check with ancillary data, follow-up observations with XMM confirmed an additional 11 new clusters which are described in Planck Collaboration (2011e). 9 other new clusters have not been confirmed in the X-ray as yet.
A full description of the validation effort is in (Planck Collaboration 2011d). Figure 16 shows the all sky distribution of the clusters and cluster candidates while Figure 17 shows their redshift distribution. Table 6 gives the list of columns in the ESZ catalogue.
All clusters have a Planck name which is given in the column NAME. This name is constructed from GLON and GLAT, the best estimated Galactic coordinates of the SZ signal. SNR gives the detection’s signal-to-noise ratio as defined by the matched multi-filter method MMF3.
When a Planck SZ cluster candidate is identified as an X-ray cluster in the MCXC the coordinates of the X-ray counterpart (i.e., the X-ray centroid) is given. The same positional information is given for the Planck cluster candidates confirmed by XMM-Newton observation (apart from one candidate identified with a double cluster, see notes below). For those clusters with an X-ray counterpart, the Compton- parameter, which is the integral of the Compton- over the cluster area, is re-extracted from the Planck maps using the X-ray centroid coordinates and X-ray size THETA_X as priors, yielding the value Y_PSX and its error Y_PSX_ERR. The Compton- parameter measured using the X-ray position and size priors is known to be more robust than the blind value estimated without priors (Planck Collaboration 2011d).
For cluster candidates without available estimates of X-ray position or size, the derived SZ parameters THETA, Y, and the associated errors THETA_ERR and Y_ERR are the values returned directly by the matched filter. These are likely to be more uncertain than cases where the cluster has been confirmed in the X-ray data. THETA and THETA_X are the estimated angular size of the cluster at 5 times R500.
Notes on individual clusters can be found in Planck Collaboration (2011v). These notes include cross-matches with ERCSC sources as well as the origin of the redshift.
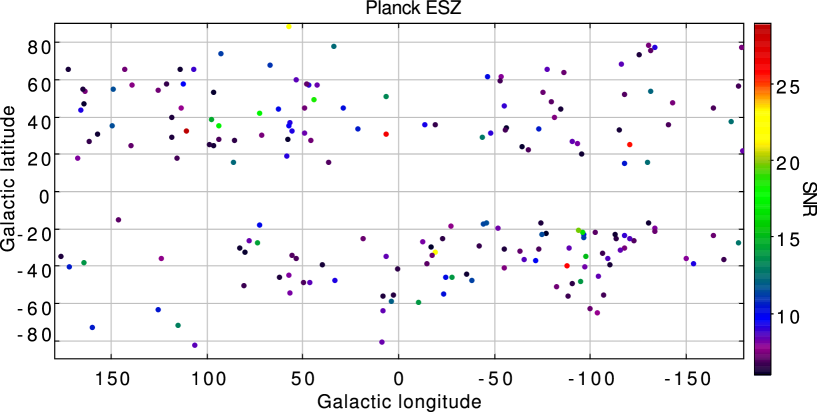

| Keyword | Type |
|---|---|
| INDEX | Index of clusters i.e., 1, 2, 3… |
| NAME | Planck name of cluster candidate |
| GLON | Galactic Longitude from Planck (deg) |
| GLAT | Galactic Latitude from Planck (deg) |
| RA | Right Ascension (deg) from Planck (J2000) |
| DEC | Declination (deg) from Planck (J2000) |
| SNR | Signal-to-noise ratio returned by the matched multi-filter (MMF3) |
| ID | External identifier of cluster e.g., Coma, Abell etc. |
| REDSHIFT | Redshift of cluster from the MCXC X-ray cluster compilation (Piffaretti et al. 2010) unless stated otherwise in the notes |
| GLON_X | Galactic Longitude of the associated X-ray cluster (deg) |
| GLAT_X | Galactic Latitude of the associated X-ray cluster (deg) |
| RA_X | Right Ascension (deg) of the associated X-ray cluster (J2000) |
| DEC_X | Declination (deg) of the associated X-ray cluster (J2000) |
| THETA_X | Angular size (arcmin) at 5R500 from X-ray data. |
| Y_PSX | Integrated Compton-Y (arcmin2) at X-ray position and within 5R500 (THETA_X) |
| Y_PSX_ERR | Uncertainty in Y_PSX |
| THETA | Estimated angular size (arcmin) from matched multi-filter (MMF3) |
| THETA_ERR | Uncertainty in THETA |
| Y | Integrated Compton-Y (arcmin2) at Planck position and within THETA from matched multi-filter (MMF3) |
| Y_ERR | Uncertainty in Y |
6.2 The Early Cold Cores Catalogue
Pre-stellar cloud cores represent the transition from turbulence dominated large scales to the gravitation dominated protostellar scales and are therefore a crucial step in the process of star formation. Imprinted in their structure and statistics is information of the properties of the parental clouds and the core formation processes where interstellar turbulence, magnetic fields, self-gravity, and external triggering all play a role.
The Planck all-sky submillimetre/millimetre survey has both the very high sensitivity and spatial resolution required for the detection of compact cores. The highest frequency channels at 857, 545 and 353 GHz cover the frequencies around and longwards of the intensity maximum of the cold dust emission: peaks at a wavelength close to 300 mwhile, with a temperature of K, the coldest dust inside the cores has its maximum close to 500 m. When Planck data are combined with far-infrared data like the IRAS survey, the observations enable accurate determination of both the dust temperatures and its spectral index. For historical reasons, we use “Cold Cores” to designate the entries in the ECC, since pre-stellar cores were a major scientific goal of this product. However, as two companion papers (Planck Collaboration 2011r, s) demonstrate, most of these entries are more correctly described as “cold clumps”, intermediate in their structure and physical scale between a true pre-stellar core and a molecular cloud. This is of course to be expected as the Planck effective beam dictates a preferred angular scale for ECC detection, and the selection process places their emission peak in the submm range.
In order to detect the cold cores, a warm background determined by the scaled IRAS 100 m emission is subtracted from the Planck maps at 217, 353 and 545 GHz (Montier et al. 2010; Planck Collaboration 2011s). The scaling factor is determined by measuring the sky background in a disk of 15 arcmin outer radius. We search for the presence of a source in the residual emission, and perform photometry at the location of detected sources. The band-merging process positionally matches objects in the 353 GHz detection list, which contains the least number of entries, against both the 545 and 857 GHz catalogues using a 5 matching radius. Sources only detected in one or two bands are discarded. The SNR and position of the detection having the greatest SNR are assigned to the band-merged entry.
Aperture photometry is performed on the IRAS 100 m and 353, 545, and 857 GHz maps using a source radius of five arcminute and a background annulus spanning radii from five to ten arcminutes. An unconstrained three-parameter (T, , and S857) greybody is fit to the four-band aperture photometry with the fitted temperatures used in the source selection process.
As for the ERCSC, a Monte-Carlo process is used to define signal-to-noise thresholds where the derived temperatures are consistent with being 14 K. A full description of the process can be found both in Planck Collaboration (2011v). The delivered ECC catalogue consists of 915 objects (Figure 18) meeting the ECC selection criteria of SNR 15 and T 14 K., after removal of selected sources having obviously discrepant SEDs or are closely positionally matched to bright AGN, e.g., 3C 273. The columns in the ECC catalogue are shown in Table 7.
It should be noted that the derived temperatures of the Cold Cores are degenerate with the derived emissivity due to the absence of more than one flux-density estimate at wavelengths shortward of the peak in the blackbody spectrum. This issue is discussed in detail in Planck Collaboration (2011s).
Further information on the ECC is given in Planck Collaboration (2011v, s). Additional remarks on individual sources, including cross-matches with ERCSC sources are provided in the notes file that accompany the individual catalogs (see Sect. 5).
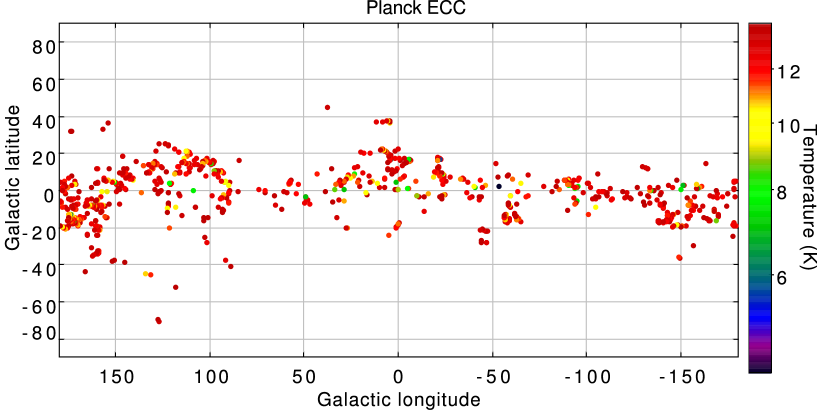
| Keyword | Type |
|---|---|
| NAME | Source name |
| SNR | Signal to Noise ratio of detection |
| GLON | Galactic longitude (deg) based on bandmerge algorithm |
| GLAT | Galactic latitude (deg) based on bandmerge algorithm |
| RA | Right Ascension in degrees (J2000) |
| DEC | Declination in degrees (J2000) |
| APFLUX353 | Aperture flux density at 353 GHz (mJy) |
| APFLUX545 | Aperture flux density at 545 GHz (mJy) |
| APFLUX857 | Aperture flux density at 857 GHz (mJy ) |
| APFLUX3000 | Aperture flux density at 3000 GHz (mJy) |
| APFLUX353_ERR | Uncertainty (1 sigma) in APFLUX353 |
| APFLUX545_ERR | Uncertainty (1 sigma) in APFLUX545 |
| APFLUX857_ERR | Uncertainty (1 sigma) in APFLUX857 |
| APFLUX3000_ERR | Uncertainty (1 sigma) in APFLUX3000 |
| TEMPERATURE | Temperature from greybody fit (K) |
| BETA | Emissivity index from greybody fit |
| S857 | Flux density at 857 GHz from greybody fit (mJy) |
| TEMPERATURE_ERR | Uncertainty (1 sigma) in TEMPERATURE (K) |
| BETA_ERR | Uncertainty (1 sigma) in BETA |
| S857_ERR | Uncertainty (1 sigma) in S857 |
| BESTNORM | Summed squared residuals for best fit (mJy2) |
| TEMPERATURE_CORE | Core Temperature from greybody fit to cold residual emission (K) |
| BETA_CORE | Emissivity index from greybody fit to cold residual emission |
| MAJ_AXIS_FWHM_CORE | Ellipse major axis of cold residual emission (arcmin) |
| MIN_AXIS_FWHM_CORE | Ellipse minor axis of cold residual emission (arcmin) |
| TEMPERATURE_CORE_ERR | Uncertainty (1 sigma) TEMPERATURE_CORE (K) |
| BETA_CORE_ERR | Uncertainty (1 sigma) BETA_CORE |
| MAJ_AXIS_FWHM_CORE_ERR | Uncertainty (1 sigma) MAJ_AXIS_FWHM_CORE |
| MIN_AXIS_FWHM_CORE_ERR | Uncertainty (1 sigma) MIN_AXIS_FWHM_CORE |
7 Concluding Remarks
Planck is the third generation space based CMB experiment with more than an order of magnitude higher spatial resolution than COBE and with a broader range of frequency coverage than WMAP. The completion of the first sky survey in April 2010 yields a unique opportunity to study the classes of astrophysical sources that are foreground contributors to the CMB. The ERCSC is a catalogue with % reliability and is based on 1.6 sky coverages by Planck. It has been produced with a very rapid turnaround time to facilitate follow up observations with existing and future telescope facilities. The Planck Collaboration expects that the diversity of sources present in the ERCSC, ranging from protostellar cores to SZ selected clusters, radio galaxies and luminous star-forming galaxies, will provide a rich opportunity for follow-up studies of interesting astrophysical phenomena.
Acknowledgements.
The production of the Planck Early Release Compact Source Catalogue was funded by NASA and carried out at the U.S. Planck Data Center at the Infrared Processing and Analysis Center (IPAC), California Institute of Technology, on behalf of and in collaboration with the LFI and HFI Data Processing Centers and with many contributions by members of the Planck Collaboration. The Planck Collaboration acknowledges the support of: ESA; CNES and CNRS/INSU-IN2P3-INP (France); ASI, CNR, and INAF (Italy); NASA and DoE (USA); STFC and UKSA (UK); CSIC, MICINN and JA (Spain); Tekes, AoF and CSC (Finland); DLR and MPG (Germany); CSA (Canada); DTU Space (Denmark); SER/SSO (Switzerland); RCN (Norway); SFI (Ireland); FCT/MCTES (Portugal); and DEISA (EU). A description of the Planck Collaboration and a list of its members with the technical or scientific activities they have been involved into, can be found at http://www.rssd.esa.int/index.php?project=PLANCK&page=Planck_CollaborationReferences
- Arnaud et al. (2010) Arnaud, M., Pratt, G. W., Piffaretti, R., Böhringer, H., Crost on, J. H., & Pointecouteau, E. 2010, A&A, 517, A92
- Aatrokoski et al. (2010) Aatrokoski, J., Lähteenmäki, A., Tornikoski, M., Valtaoja, E., Maino, D., Galeotta, S., Zacchei, A., & Pasian, F. 2010, MNRAS, 401, 597
- Beichman et al. (1988) Beichman, C. A., Neugebauer, G., Habing, H. J., Clegg, P. E., & Chester, T. J. 1988, Infrared astronomical satellite (IRAS) catalogs and atlases. Volume 1: Explanatory s upplement, 1
- Bennett et al. (2003) Bennett, C. L., et al. 2003, ApJS, 148, 1
- Bersanelli et al. (2010) Bersanelli, M., Mandolesi, N., Butler, R. C., et al. 2010, A&A, 520, A4+
- Bertin & Arnouts (1996) Bertin, E., & Arnouts, S. 1996, A&AS, 117, 393
- Carlstrom et al. (2002) Carlstrom, J., et al., 2002, ARA&A, 40, 643
- Carvalho et al. (2009) Carvalho, P., Rocha, G., & Hobson, M. P. 2009, MNRAS, 393, 681
- Chary et al. (2004) Chary, R., et al., 2004, ApJ, 154, 80
- Dupac & Tauber (2005) Dupac, X. & Tauber, J. 2005, A&A, 430, 363
- Gold et al. (2011) Gold, B., Odegard, N., Weiland, J. L., et al. 2011, ApJS, 192, 15
- Górski et al. (2005) Górski, K. M., Hivon, E., Banday, A. J., Wandelt, B. D., Hansen, F. K., Reinecke, M., & Bartelmann, M. 2005, ApJ, 622, 759
- Gregory et al. (1996) Gregory, P. C., Scott, W. K., Douglas, K., & Condon, J. J. 1996, ApJS, 103, 427
- Griffith et al. (1995) Griffith, M. R., Wright, A. E., Burke, B. F., & Ekers, R. D. 1995, ApJS, 97, 347
- Healey et al. (2007) Healey, S. E., Romani, R. W., Taylor, G. B., Sadler, E. M., Ricci, R., Murphy, T., Ulvestad, J. S., & Winn, J. N. 2007, ApJS, 171, 61
- Hobson & McLachlan (2003) Hobson, M. P., & McLachlan, C. 2003, MNRAS, 338, 765
- Kron (1980) Kron, R. G. 1980, ApJS, 43, 305
- Lamarre et al. (2010) Lamarre, J., Puget, J., Ade, P. A. R., et al. 2010, A&A, 520, A9+
- Leahy et al. (2010) Leahy, J. P., Bersanelli, M., D’Arcangelo, O., et al. 2010, A&A, 520, A8+
- López-Caniego et al. (2007) López-Caniego, M., González-Nuevo, J., Herranz, D., Massardi, M., Sanz, J. L., De Zotti, G., Toffolatti, L., & Argüeso, F. 007, ApJS, 170, 108
- Mandolesi et al. (2010) Mandolesi, N., Bersanelli, M., Butler, R. C., et al. 2010, A&A, 520, A3+
- Massardi et al. (2009) Massardi, M., López-Caniego, M., González-Nuevo, J., Herranz, D., de Zotti, G., & Sanz, J. L. 2009, MNRAS, 392, 733
- Melin et al. (2006) Melin, J., Bartlett, J. G., & Delabrouille, J. 2006, A&A, 459, 341
- Melin et al. (2010) Melin, J.-B., et al. 2010, A&A, submitted
- Mennella et al. (2011) Mennella et al. 2011, Planck early results 03: First assessment of the Low Frequency Instrument in-flight performance (Submitted to A&A, [arXiv:astro-ph/1101.2038])
- Mitra et al. (2011) Mitra, S., Rocha, G., Górski, K. M., et al. 2011, ApJS, 193, 5
- Montier et al. (2010) Montier, L. A., Pelkonen, V.-M., Juvela, M., Ristorcelli, I., & Marshall, D. J. 2010, A&A, 522, A83+
- Murakami et al. (2007) Murakami, H., et al. 2007, PASJ, 59, 369
- Murphy et al. (2010) Murphy, T., et al. 2010, MNRAS, 402, 2403
- Piffaretti et al. (2010) Piffaretti, R., Arnaud, M., Pratt, G. W., Pointecouteau, E., & Melin, J.-B. 2010, A&A, submitted, arXiv:1007.1916
- Planck Collaboration (2011a) Planck Collaboration. 2011a, Planck early results 01: The Planck mission (Submitted to A&A, [arXiv:astro-ph/1101.2022])
- Planck Collaboration (2011b) Planck Collaboration. 2011b, Planck early results 02: The thermal performance of Planck (Submitted to A&A, [arXiv:astro-ph/1101.2023])
- Planck Collaboration (2011c) Planck Collaboration. 2011c, Planck early results 07: The Early Release Compact Source Catalogue (Submitted to A&A, [arXiv:astro-ph/1101.2041])
- Planck Collaboration (2011d) Planck Collaboration. 2011d, Planck early results 08: The all-sky early Sunyaev-Zeldovich cluster sample (Submitted to A&A, [arXiv:astro-ph/1101.2024])
- Planck Collaboration (2011e) Planck Collaboration. 2011e, Planck early results 09: XMM-Newton follow-up for validation of Planck cluster candidates (Submitted to A&A, [arXiv:astro-ph/1101.2025])
- Planck Collaboration (2011f) Planck Collaboration. 2011f, Planck early results 10: Statistical analysis of Sunyaev-Zeldovich scaling relations for X-ray galaxy clusters (Submitted to A&A, [arXiv:astro-ph/1101.2043])
- Planck Collaboration (2011g) Planck Collaboration. 2011g, Planck early results 11: Calibration of the local galaxy cluster Sunyaev-Zeldovich scaling relations (Submitted to A&A, [arXiv:astro-ph/1101.2026])
- Planck Collaboration (2011h) Planck Collaboration. 2011h, Planck early results 12: Cluster Sunyaev-Zeldovich optical Scaling relations (Submitted to A&A, [arXiv:astro-ph/1101.2027])
- Planck Collaboration (2011i) Planck Collaboration. 2011i, Planck early results 13: Statistical properties of extragalactic radio sources in the Planck Early Release Compact Source Catalogue (Submitted to A&A, [arXiv:astro-ph/1101.2044])
- Planck Collaboration (2011j) Planck Collaboration. 2011j, Planck early results 14: Early Release Compact Source Catalogue validation and extreme radio sources (Submitted to A&A, [arXiv:astro-ph/1101.1721])
- Planck Collaboration (2011k) Planck Collaboration. 2011k, Planck early results 15: Spectral energy distributions and radio continuum spectra of northern extragalactic radio sources (Submitted to A&A, [arXiv:astro-ph/1101.2047])
- Planck Collaboration (2011l) Planck Collaboration. 2011l, Planck early results 16: The Planck view of nearby galaxies (Submitted to A&A, [arXiv:astro-ph/1101.2045])
- Planck Collaboration (2011m) Planck Collaboration. 2011m, Planck early results 17: Origin of the submillimetre excess dust emission in the Magellanic Clouds (Submitted to A&A, [arXiv:astro-ph/1101.2046])
- Planck Collaboration (2011n) Planck Collaboration. 2011n, Planck early results 18: The power spectrum of cosmic infrared background anisotropies (Submitted to A&A, [arXiv:astro-ph/1101.2028])
- Planck Collaboration (2011o) Planck Collaboration. 2011o, Planck early results 19: All-sky temperature and dust optical depth from Planck and IRAS — constraints on the “dark gas” in our Galaxy (Submitted to A&A, [arXiv:astro-ph/1101.2029])
- Planck Collaboration (2011p) Planck Collaboration. 2011p, Planck early results 20: New light on anomalous microwave emission from spinning dust grains (Submitted to A&A, [arXiv:astro-ph/1101.2031])
- Planck Collaboration (2011q) Planck Collaboration. 2011q, Planck early results 21: Properties of the interstellar medium in the Galactic plane (Submitted to A&A, [arXiv:astro-ph/1101.2032])
- Planck Collaboration (2011r) Planck Collaboration. 2011r, Planck early results 22: The submillimetre properties of a sample of Galactic cold clumps (Submitted to A&A, [arXiv:astro-ph/1101.2034])
- Planck Collaboration (2011s) Planck Collaboration. 2011s, Planck early results 23: The Galactic cold core population revealed by the first all-sky survey (Submitted to A&A, [arXiv:astro-ph/1101.2035])
- Planck Collaboration (2011t) Planck Collaboration. 2011t, Planck early results 24: Dust in the diffuse interstellar medium and the Galactic halo (Submitted to A&A, [arXiv:astro-ph/1101.2036])
- Planck Collaboration (2011u) Planck Collaboration. 2011u, Planck early results 25: Thermal dust in nearby molecular clouds (Submitted to A&A, [arXiv:astro-ph/1101.2037])
- Planck Collaboration (2011v) Planck Collaboration. 2011v, The Explanatory Supplement to the Planck Early Release Compact Source Catalogue (ESA)
- Planck HFI Core Team (2011a) Planck HFI Core Team. 2011a, Planck early results 04: First assessment of the High Frequency Instrument in-flight performance (Submitted to A&A, [arXiv:astro-ph/1101.2039])
- Planck HFI Core Team (2011b) Planck HFI Core Team. 2011b, Planck early results 06: The High Frequency Instrument data processing (Submitted to A&A, [arXiv:astro-ph/1101.2048])
- Rosset et al. (2010) Rosset, C., Tristram, M., Ponthieu, N., et al. 2010, A&A, 520, A13+
- Savage & Oliver (2007) Savage, R. S., & Oliver, S. 2007, ApJ, 661, 1339
- Sunyaev & Zel’dovich (1972) Sunyaev, R. & Zeldovich, Ya. (1972), A&A, 20, 189
- Tauber et al. (2010) Tauber, J. A., Mandolesi, N., Puget, J., et al. 2010, A&A, 520, A1+
- Vieira et al. (2010) Vieira, J. D., et al. 2010, ApJ, 719, 763
- Ward-Thompson et al. (2002) Ward-Thompson, D., André, P., & Kirk, J. M. 2002, MNRAS, 329, 257
- Wright et al. (2009) Wright, E. L., Chen, X., Odegard, N., et al. 2009, ApJS, 180, 283
- Wright et al. (2010) Wright, E. L., et al. 2010, AJ, 140, 1868
- Zacchei et al. (2011) Zacchei et al. 2011, Planck early results 05: The Low Frequency Instrument data processing (Submitted to A&A, [arXiv:astro-ph/1101.2040])