Addendum to “Anomalous scaling and super-roughness in the growth of CdTe polycrystalline films”
Abstract
The scaling of the growth of CdTe films on glass substrates was investigated by Mata et al. [Phys. Rev. B 78, 115305 (2008)]. Part of the analysis consisted of the estimation of the correlation length using the decay in the height-height correlation function. Afterwards, the dynamical exponent was determined using the scaling hypothesis . In this Addendum, we show that the correlation lengths obtained by Mata et al. provide a long wavelength coarsening exponent that does not correspond to the dynamical exponent . We also show that the short wavelength coarsening exponent is consistent with the exponent obtained by Nascimento et al. [arXiv:1101.1493] via generic dynamical scaling theory.
pacs:
68.55.-a, 64.60.Ht, 68.35.Ct, 81.15.AaIntroduction. The scaling exponents involved in the deposition of CdTe on glass substrates has been investigated as functions of temperature Mata2008 ; Ferreira2006 . Details of the growth systems can be found in Ref. Ferreira2006 . The surfaces were scanned with a profiler and 1+1 interfaces of 300 microns and 4570 pixels of resolution were obtained. The scaling analysis in the real space (surface height fluctuations) involves the determination of four exponents: , , and , being only three of them independent due to the scaling relation Lopez . The exponents and were reported formerly in ref. Ferreira2006 . Growth exponent was determined using the global interface width defined as the rms fluctuations of profile height. The scaling law defines the growth exponent. The Hurst or local roughness exponent , was determined using the rms height widths on a scale of length and applying the scaling law .
In Ref. Mata2008 , it was investigated the dynamical exponent using the scaling law . The correlation length was estimated using the decay in the two-point correlation function . The roughness exponent was thus obtained via scaling relation . Two equivalent definitions of were used [Eqs. (7) and (8) in Ref. Mata2008 ] and the exponents diverge less than 10% Mata2008 . The correlation length was finally obtained by solving . Let us discuss the case in which is defined as the probability of the height difference between two points distant by be lower than a fixed value , where and are the maximum and the minimum heights in the profile. The usual correlation undergoes exactly the same effects that we shall discuss in this Addendum.
Results. A single exponential decay, commonly used to fit correlation functions, does not work properly for our data as one can see in Fig. 1. Hence, a two-exponential decay was adopted [Eq. (9) in Ref. Mata2008 ]. However, either a single or a double exponential provided the same exponents considering the error bars inasmuch as the respective correlation lengths are simply proportional. The region where the fit is done is indeed what matters. In Ref. Mata2008 , the tails corresponding to the long wavelength height fluctuations were included in the non-linear regressions and, when necessary, a few points at the shortest scales were excluded (3 to 5 among more than points). Again, the exponents are not altered inside the margins of errors if these few points are or not included. However, if the tail is left out of the regression, the exponents may change considerably which is exactly the subject of this Addendum.
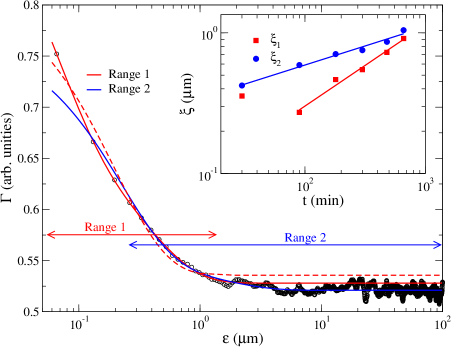
In Fig. 1, we compare the regressions of the correlation functions in two ranges: discarding (range 1) and including (range 2) the tail. The regression in the range 2, the same used in Ref. Mata2008 , misfits the data only for m whereas the regression in the range 1 fits very well the small scales but deviates for m. The insertion to Fig. 1 shows the correlation lengths against time and the respective power law regressions. Both cases yield quite satisfactory scaling laws with different exponents. For the regression in the regions 1 and 2 we obtained and , respectively. Assuming , where , we found and . Notice that the regressions provided two characteristic lengths of the same magnitude () but exhibiting very different scalings with time. Repeating this analysis for lower temperatures (C) we found m but no clear scaling law could be identified. We supposed that these scales are too small to be accurately analyzed using a profiler with a large tip of 2.5 m of radius. AFM images, in which the grain characteristic sizes do not exceed a few hundred nanometers, confirm our hypothesis. Only for C the grains are of the order of 1 m as shown in Fig. 4b of Ref. Nascimento .
In Ref. Nascimento , this system was investigated using the Generic Dynamical Scaling Theory (GDST), in which both real (height fluctuations) and momentum (power spectra) spaces analysis are performed Lopez . It was confirmed that the scaling exponents obtained in Mata2008 , which corresponds to range 2 in Fig. 1, do not agree with those of the GDST. However, the dynamical exponent obtained via GDST, , is consistent with the estimate for C, indicating that the dynamical exponent corresponds to the coarsening exponent .
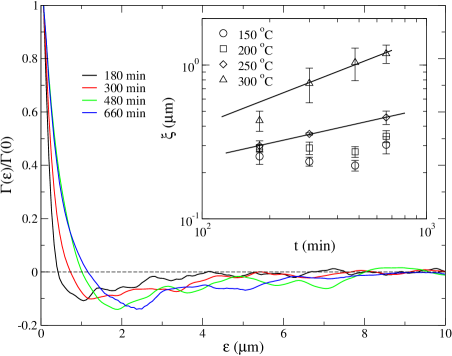
Finally, we measured the slope-slope correlation function that was not investigated in Ref. Mata2008 . The correlation length can be defined as the first zero of the correlation function () and, consequently, no regression is required to estimate . The correlation functions and lengths are shown in Fig. 2. Similarly to the height-height correlation, there is no satisfactory power law regime for C and C. For and C, the slopes provides and , respectively, which are consistent with GDST analysis in Nascimento .
Conclusions. The conclusions of Ref. Mata2008 are partially modified since we cannot apply GDST to infer about which dynamical scaling regime the system belongs to. The regime claimed as intrinsically anomalous, in which and , has been shown to be described by the exponents and Nascimento . The exponent presented in Mata2008 is not the dynamical exponent of the GDST. It would be better to refer to this exponent as a long wavelength coarsening exponent, which increases with temperature whereas the actual dynamical exponent obtained via GDST in Ref. Nascimento decreases.
These results also stress out the difficulties usually observed in the fitting procedure of experimental data and the problems which can arise from a misinterpretation of the parameters obtained. For instance, the power spectrum itself used in GDST is usually noisy due the Fourier transforms. The GDST proposes that the power spectra at different growth times collapse in a single curve if the suitable rescaling is applied Lopez . Even though high quality collapses of the power spectra in experimental data have been reported Nascimento ; Cordoba , there are also examples where the large noise does not allow a clear resolution of the collapses Bru ; Soriano . Therefore, a combination of different methods of scaling is the best procedure to avoid misinterpretations in the scaling analyses.
Acknowledgements.
This work was supported by the Brazilian agencies CNPq, FAPEMIG and CAPES. SCF thanks the kind hospitality at the Departament de Física i Enginyeria Nuclear/UPC.References
- (1) A. S. Mata, S. C. Ferreira, I. R. B. Ribeiro, S. O. Ferreira, Phys. Rev. B 78, 115305 (2008); arXiv:1101.1167v1.
- (2) S. O. Ferreira et al., Appl. Phys. Lett. 88, 244102 (2006).
- (3) F. S. Nascimento, S. C. Ferreira, and S. O. Ferreira, arXiv:1101.1493 [cond-mat.stat-mech].
- (4) J. M. López, Phys. Rev. Lett. 83, 4594 (1999).
- (5) I. G. Szendro, J. M. López, M. A. Rodríguez, Phys. Rev. E 76, 011603 (2007).
- (6) P. Córdoba-Torres, T. J. Mesquita, I. N. Bastos, and R. P. Nogueira. Phys. Rev. Lett. 102, 055504 (2009).
- (7) A. Brú, et al., Phys. Rev. Lett. 81, 4008 (1998); Biophy. J. 85, 2948 (2003).
- (8) J. Soriano et al., Phys. Rev. Lett. 89, 026102 (2003).