The pressure profiles of hot gas in local galaxy groups
Abstract
Recent measurements of the Sunyaev-Zel’dovich (SZ) angular power spectrum from the South Pole Telescope (SPT) and the Atacama Cosmology Telescope (ACT) demonstrate the importance of understanding baryon physics when using the SZ power spectrum to constrain cosmology. This is challenging since roughly half of the SZ power at =3000 is from low-mass systems with M M⊙, which are more difficult to study than systems of higher mass. We present a study of the thermal pressure content for a sample of local galaxy groups from Sun et al. (2009). The group relation agrees with the one for clusters derived by Arnaud et al. (2010). The group median pressure profile also agrees with the universal pressure profile for clusters derived by Arnaud et al. (2010). With this in mind, we briefly discuss several ways to alleviate the tension between the measured low SZ power and the predictions from SZ templates.
1 Introduction
Galaxy groups are not scaled-down versions of rich clusters following simple self-similar relations (e.g., Ponman et al. 2003; Voit 2005). They are systems where the role of complex baryon physics (e.g., cooling, galactic winds, and AGN feedback) begins to dominate over gravity. The effects of these baryon processes are not large but still significant in massive clusters, and therefore need to be calibrated if we want to further improve the cosmological constraints from clusters. Since the role of these processes is less pronounced in massive clusters, it is easier to study and understand them by observing groups. The importance of galaxy groups for cosmology has also been well demonstrated by the recent measurements of the Sunyaev-Zel’dovich (SZ) angular power spectrum. SPT measured a value for the SZ power at (scales of ) that was lower than most prior predictions by at least a factor of two (Lueker et al. 2010). A measurement of the SZ power spectrum by ACT is consistent with these results (Das et al. 2010; Dunkley et al. 2010). The SZ angular power spectrum is a sensitive probe both of cosmological parameters and of the hot gas content of galaxy clusters and groups (e.g. Komatsu & Seljak 2002). Regarding the latter, it opens a new window into low-mass, high-redshift systems as about half of the SZ power at =3000 comes from halos with M M⊙ and (e.g., Trac et al. 2010). While the examination of the thermal pressure content in groups is a challenge to current X-ray telescopes with typical exposures, such work can be done for local groups. Group pressure profiles have received little attention to date and the existing samples are small (e.g., Mahdavi et al. 2005; Finoguenov et al. 2007). In this letter, we present the pressure profiles of hot gas in 43 local galaxy groups from the Sun et al. (2009, S09 hereafter) sample. We assume M=0.24, =0.76 and H0 = 73 km s-1 Mpc-1.
2 The group sample and data analysis
The group sample and the Chandra data analysis have been discussed in S09. There are 43 groups at =0.01 - 0.12 (a median of 0.033), all with intracluster medium (ICM) properties derived to at least . Twenty-three have masses measured to . The mass range is M M⊙. As an archival sample, there is not a well defined selection function. The sample does include some X-ray faint groups, usually with strong radio AGNs at the center.
The analysis in S09 was based on Chandra CALDB 3.4.3. Since then, there have been major Chandra calibration releases on the on-axis effective area and the ACIS low-energy contamination models. To check the impact of calibration changes on the S09 results, we examined spectra from 40 regions from 18 observations which we studied in S09. The temperatures of these regions range from 0.7 to 3.0 keV and the abundances range from 0.15 to 1.5 solar. The observation dates are from 2000 to 2006, and both ACIS-I and ACIS-S observations are examined. CIAO 4.3 with CALDB 4.4.1 and XSPEC 12.6 were used. The temperature decrease with the new calibration is less than 1% on average. This is not surprising (e.g., Nevalainen et al. 2010) as temperatures at this range are mainly determined by the centroid of the iron-L hump. The decrease of the ACIS effective area below 5 keV causes the normalization of the spectral model to increase, on average, by 9.9%, which is independent of the temperature. This implies an average 4.9% increase in gas density. We do not include this small change in this work.
While small ACIS calibration uncertainties may still remain after the release of CALDB 4.4.1, the results for groups should not be affected much. The Chandra flux in the 0.5 - 2.0 keV band agrees with the XMM-Newton flux to better than 4% (e.g., Nevalainen et al. 2010). The existing temperature bias is small for low-temperature gas as long as the iron-L hump is significant. Even if temperatures of low-temperature gas are still biased high by e.g., 10%, the relation (Fig. 1) should not be affected much as and will both be lower, by 15% and 20% respectively, producing a small change in the relation that is insignificant compared to the large statistical uncertainties on (a median 1 uncertainty of 18%).
3 The integrated pressure content
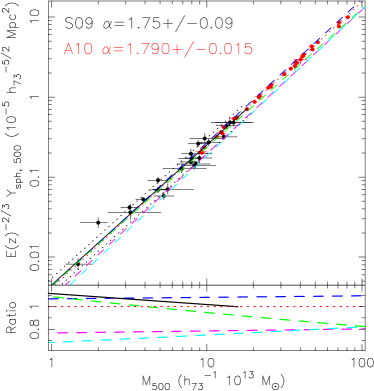
We first compare the scaling relation between mass and the volume-integrated Compton parameter for the S09 groups with the Arnaud et al. (2010, A10 hereafter) results. The A10 sample is from XMM-Newton observations of 31 Representative XMM-Newton Cluster Structure Survey (REXCESS) clusters with M⊙ - M⊙. The spherically integrated quantity, (defined in Equ. 14 in A10), is derived within . The S09 relation agrees well with A10’s (Fig. 1). This can be expected from the good agreement of the relation between the two works. The difference between and is the ratio between the spectroscopic temperature and the gas-mass-weighted temperature within ( vs. ). The in S09 is measured between 0.15 and (we call it ), while the in A10 is measured between 0.15 and 0.75 . For the S09 sample, / = 0.980.04 and = (0.950.02) (0.15 - 0.75 ). Arnaud et al. (2007) quoted 0.94-0.97 for the latter ratio. Thus, / (0.15 - 0.75 ) 0.93 for the S09 sample, which agrees with the A10 result of 0.9240.004. Because of this consistency and the agreement between the relations, we expect the relations from S09 and A10 to agree. We also examined the twenty tier 3 and 4 groups in S09 (where gas properties are only derived to 45% - 72% of ). The - relation for the tier 3 and 4 groups agrees with the relation for the tier 1 and 2 groups. Overall, we conclude that for the S09 groups, the derived is 1.050.25 times predicted from the A10 relation. We also plot the predicted relations from recent SZ templates (Sehgal et al. 2010a; Battaglia et al. 2010; Shaw et al. 2010; Trac et al. 2010) in Fig. 1. The Sehgal et al. (2010a) template used the ICM model by Bode et al. (2009), which was calibrated with the Vikhlinin et al. (2006) and S09 gas fraction relations. Vikhlinin et al. (2009) included six more clusters with on average lower gas fractions within than the eight clusters in Vikhlinin et al. (2006). As the relation from Vikhlinin et al. (2009) agrees well with that in A10, it is not surprising that the Sehgal et al. (2010a) template has 9% higher normalization than the A10 result for clusters.
4 The radial pressure profiles
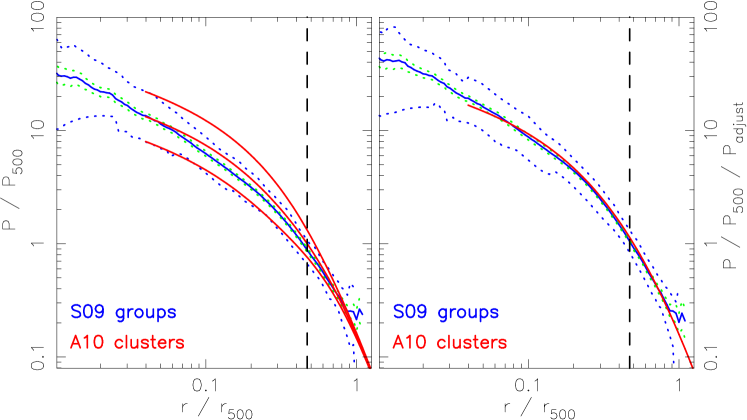
We also examine the radial pressure profiles of the S09 groups. A10 derived a universal pressure profile of the ICM by removing the mass dependence. If the ICM scaling relations are self-similar, the mass dependence is (Equ. 5 of A10, , also see Nagai et al. 2007). Since deviations from self-similarity exist, A10 defined a term (Equ. 7 and 8 of A10, which we call ) to further remove the mass dependence in addition to , where and ) = 0.22/(1+), . While the form of can be examined with the S09 groups, the large uncertainties in for the S09 groups do not allow good constraints on this adjustment factor. We derived the and the profiles for all 43 groups. Uncertainties are estimated from those in the temperature and density profiles. In Fig. 2, we show the median and the 1 scatter of both profiles. To account for uncertainties in pressure profiles, 1000 Monte Carlo simulations were run to examine the uncertainties on the median profiles, which is small as shown in Fig. 2. The 1 scatter for is 26% - 40% at 0.2 - 0.8 (compared to less than 30% scatter for the A10 clusters) and is consistent with a log-normal form. Thus, the radial pressure profiles of the S09 groups agree well with the universal pressure profile defined by A10. This is consistent with the good agreement between the two works on the mass proxies and entropy scalings (S09; Pratt et al. 2010).
5 Discussions and conclusions
The results above suggest that the thermal pressure of local galaxy groups from the S09 sample is consistent with the extrapolation from the A10 results, although statistical errors and scatter are still large. Interestingly, recent measurements of the SZ angular power spectrum are at least a factor of two lower than prior expectations at (Lueker et al. 2010). The thermal SZ power spectrum scales roughly as the square of the thermal SZ flux. Given the results presented above, we briefly discuss several possibilities that may alleviate this tension.
X-ray selection bias: The S09 sample is an X-ray archival sample and the REXCESS sample is an X-ray-luminosity-selected sample. Both samples can be different from mass-selected samples. The Chandra archive may be biased to systems with bright cores, while X-ray under-luminous groups and clusters may exist (e.g., Rasmussen et al. 2006; Popesso et al. 2007). However, the relation at and beyond is less affected by the presence of X-ray bright regions (e.g., a large cool core) than the relation. For the S09 sample, 12% - 68% of the X-ray flux (a median of 34%) is from within , while such regions only contribute 5% to for - M⊙ halos, assuming the A10 pressure profile. The contribution may be even smaller than 5% for X-ray under-luminous systems as their gas cores are fainter than those of the REXCESS clusters used to derive the A10 profile. One main conclusion of the S09 work is that the gas content of groups is comparable to that of clusters at , at least for the S09 sample. If we combine the relations from Vikhlinin et al. (2009), S09 and REXCESS, the trend of slope flattening with increasing radius is significant, with an almost constant density at from groups to clusters. This trend is consistent with the scenario that much of the low-entropy gas in low-mass systems has been ejected to large radii by strong feedback (e.g., McCarthy et al. 2010). However, it remains to see whether this result applies to mass-selected samples. One way to test this is to examine scaling relations from non-X-ray-selected samples. This kind of work has been done on optically selected samples by stacking the ROSAT all-sky survey data (Dai et al. 2010; Rykoff et al. 2008). Besides the systematic uncertainties with stacking, the ROSAT temperatures from stacking are often biased (Rykoff et al. 2008) and contamination to those samples, especially at the low-mass end, can be severe.
Pressure contribution at : The total SZ flux is more sensitive to the gas in cluster outskirts () than the total X-ray flux. Few direct X-ray constraints exist at such large radii, especially for groups. Although the contribution from to is significant (e.g., 40% - 70% increase by integrating to 2 for the A10 profile), the contribution to the SZ power spectrum at =3000 assuming the A10 profile is smaller, only about 20% from regions. So an overestimate of the thermal pressure from the A10 model only at could overpredict the SZ power spectrum by at most 20% at =3000.
Dynamical state of the ICM: The SZ signal measures the total thermal energy of electrons. However, the potential energy of halos may not be fully converted into thermal energy of electrons because of e.g., recent mergers and weak viscosity of the ICM (e.g., Lau et al. 2009; Burns et al. 2010). Galaxies can also contribute to the non-thermal pressure support by e.g., injected magnetic fields and cosmic rays. The non-thermal pressure support may also cause the ICM to be clumpy. For a clumpy ICM, the SZ signal predicted from the X-ray data will be biased high. All these effects may have a dependence on mass (or the ICM temperature), and the evolution of these effects with redshift may not be self-similar.
The impact of the non-thermal pressure support on the SZ power spectrum has been discussed by Shaw et al. (2010), who examined models with a radial dependence of the non-thermal pressure. Trac et al. (2010) examined a model with non-thermal pressure for all clusters and groups at all masses and redshifts. However, both models do not predict the mean value measured for the SZ power spectrum at by Lueker et al. (2010), being high by about 1. Interestingly, SZ observations suggest the latter model predicts too little SZ flux for very massive clusters (Sehgal et al. 2010b). As for clumpiness, the good agreement between the measured SZ radial profile and the prediction from X-ray data for individual clusters (e.g., Plagge et al 2010; Komatsu et al. 2010; Sehgal et al. 2010b) suggests that clumpiness should be weak for massive clusters. However, one can imagine a mass dependence for clumpiness, as both heat conduction and dynamic viscosity can be much weaker in groups than in clusters.
If the hydrostatic equilibrium mass under-estimates the true mass by 20% from = 1013 h-1 M⊙ - 1015 h-1 M⊙ (e.g., Nagai et al. 2007), will increase by 4% - 7%, if the universal pressure profile from A10 is assumed. Therefore, the normalization of the relation will decrease by 24%, which roughly translates to 42% decrease on the predicted SZ power spectrum. If the mass bias is larger for low-mass halos, the relation will be steeper and the decrease will be larger. However, it is a big challenge to constrain the effects of non-thermal pressure support in groups and clusters, especially its dependence with mass and redshift. For groups, robust mass measurements that do not assume hydrostatic equilibrium are required. Two promising methods are stacking of the lensing data (e.g., Leauthaud et al. 2010) and caustics (Rines & Diaferio 2010). Future X-ray microcalorimeter observations (e.g., by Astro-H) may also constrain the ICM turbulence directly.
Evolution of the ICM properties: While local groups are discussed in this paper, most of the SZ power at =3000 from groups is from systems at . Evolution of the ICM properties is poorly constrained for poor clusters and groups. Recent results on groups suggest that the evolution of the scalings is not weaker than the self-similar prediction (e.g., Jeltema et al. 2009; Leauthaud et al. 2010), but the statistical uncertainties are large. Proper understanding of the evolution of the scalings requires a good understanding of the selection function (e.g. Pacaud et al. 2007). Better constraints on the evolution of the low-mass end of the scaling relations should be achieved with more XMM-Newton and Chandra data on larger samples with well-defined selection functions. Of course, the evolution of the scaling relations is not equal to the evolution of the relation. More factors, e.g., the evolution of the cool core fraction and the gas distribution, need to be accounted for. Alternatively, deep SZ observations of high- groups, either individually or by stacking, can directly constrain the evolution of the relation.
Contamination from radio and infrared galaxies:
Both radio and infrared galaxies could potentially fill in SZ decrements at
150 GHz. While the contamination from radio galaxies should be small (see
discussion in Sehgal et al 2010a), the contamination from dusty star-forming
(infrared) galaxies is less clear. In Lueker et al. (2010), the signal from
infrared galaxies was removed from maps at 150 GHz by subtracting maps
at 220 GHz after fitting for a weighting factor. If all infrared sources
have the same spectral index of , then this should effectively
remove infrared contamination from the 150 GHz maps. If some infrared sources
have a shallower slope (e.g., as in Knox et al. 2004), then
residual contamination will remain. However, a more recent analysis
by Shirokoff et al. (2010) suggests that even a large correlation between
infrared galaxies and groups/clusters would
not increase the 95% CL upper limit on the thermal SZ power spectrum to the
level that it is consistent with predictions prior to Lueker et al (2010).
This work shows that the local groups from the S09 sample follow the extrapolation of the pressure scaling relations from A10. More data are required to reduce the statistical errors and more importantly explore the systematic uncertainties discussed above. Regarding the low SZ power measured by recent experiments, we suggest some astrophysical possibilities that may alleviate the apparent tension between models and measurements. Understanding the SZ power spectrum will provide important insights into both baryon physics and cosmology.
References
- (1)
- (2) Akritas, M. G., & Bershady, M. A. 1996, ApJ, 470, 706
- (3) Arnaud, M., Pointecouteau, E., & Pratt, G. W. 2007, A&A, 474, L37
- (4) Arnaud, M. et al. 2010, A&A, 517, 92 (A10)
- (5) Battaglia, N. et al. 2010, ApJ, 725, 91
- (6) Bode, P., Ostriker, J. P., & Vikhlinin, A. 2009, ApJ, 700, 989
- (7) Burns, J. O. et al. 2010, ApJ, 721, 1105
- (8) Dai, X. et al. 2010, ApJ, 719, 119
- (9) Das, S. et al. 2010, arXiv:1009.0847
- (10) Dunkley, J. et al. 2010, arXiv:1009.0866
- (11) Finoguenov, A. et al. 2007, MNRAS, 374, 737
- (12) Jeltema, T. E. et al. 2009, MNRAS, 399, 715
- (13) Knox, L., Holder, G. P., & Church, S. E. 2004, ApJ, 612, 96
- (14) Komatsu, E., & Seljak, U. 2002, MNRAS, 336, 1256
- (15) Komatsu, E. et al. 2010, ApJS, in press, arXiv:1001.4538
- (16) Lau, E. T., Kravtsov, A. V., & Nagai, D. 2009, ApJ, 705, 1129
- (17) Leauthaud, A. et al. 2010, ApJ, 709, 97
- (18) Lueker, M. et al. 2010, ApJ, 719, 1045
- (19) Mahdavi, A. et al. 2005, ApJ, 622, 187
- (20) McCarthy, I. G. et al. 2010, MNRAS, in press, arXiv:1008.4799
- (21) Nagai, D. et al. 2007, ApJ, 668, 1
- (22) Nevalainen, J., David, L., & Guainazzi, M. 2010, A&A, 523, 22
- (23) Pacaud, F. et al. 2007, MNRAS, 382, 1289
- (24) Plagge, T. et al. 2010, ApJ, 716, 1118
- (25) Ponman, T. J. et al. 2003, MNRAS, 343, 331
- (26) Popesso, P. et al. 2007, A&A, 461, 397
- (27) Pratt, G. W. et al. 2010, A&A, 511, 85
- (28) Rasmussen, J. et al. 2006, MNRAS, 373, 653
- (29) Rines, K., & Diaferio, A. 2010, AJ, 139, 580
- (30) Rykoff, E. S. et al. 2008, ApJ, 675, 1106
- (31) Sehgal, N. et al. 2010a, ApJ, 709, 920
- (32) Sehgal, N. et al. 2010b, ApJ submitted, arXiv:1010.1025
- (33) Shaw, L. et al. 2010, ApJ, arXiv:1006.1945
- (34) Shirokoff, E. et al. 2010, ApJ, submitted, arXiv:1012.4788
- (35) Sun, M. et al. 2009, ApJ, 693, 1142 (S09)
- (36) Trac, H., Bode, P., & Ostriker, J. P. 2010, arXiv1006.2828
- (37) Vikhlinin, A. et al. 2006, ApJ, 640, 691
- (38) Vikhlinin, A. et al. 2009, ApJ, 692, 1033
- (39) Voit, G. M. 2005, Rev. Mod. Phys., 77, 207
- (40)