The ACS Fornax Cluster Survey. IV. Deprojection of the Surface Brightness Profiles of Early-Type Galaxies in the Virgo and Fornax Clusters: Investigating the “Core/Power-Law Dichotomy”
Abstract
Although early observations with the Hubble Space Telescope (HST) pointed to a sharp dichotomy among early-type galaxies in terms of the logarithmic slope of their central surface brightness profiles, several studies in the past few years have called this finding into question. In particular, recent imaging surveys of early-type galaxies belonging to the Virgo and Fornax Clusters using the Advanced Camera for Surveys (ACS) on board HST have not found a dichotomy in , but instead a systematic progression from central luminosity deficit to excess relative to the inward extrapolation of the best-fitting global Sérsic model. Given that earlier studies also found that the dichotomy persisted when analyzing the deprojected density profile slopes, we investigate the distribution of the three-dimensional luminosity density profiles of the ACS Virgo and Fornax Cluster Survey galaxies. Having fitted the surface brightness profiles with modified Sérsic models, we then deproject the galaxies using an Abel integral and measure the inner slopes of the resulting luminosity density profiles at various fractions of the effective radius . We find no evidence of a dichotomy, but rather, a continuous variation in the central luminosity profiles as a function of galaxy magnitude. We introduce a parameter, , that measures the central deviation of the deprojected luminosity profiles from the global Sérsic fit, showing that this parameter varies smoothly and systematically along the luminosity function.
1 Introduction
The launch of the Hubble Space Telescope (HST) two decades ago made it possible to study the innermost regions of galaxies at spatial resolutions that were previously unattainable at optical wavelengths. The first HST imaging surveys of bright early-type galaxies agreed in finding a luminosity-dependent structural dichotomy in the central brightness profiles — within the innermost few hundred parsecs, galaxies brighter than mag showed surface brightness profiles that increased very gently towards the center (“core” galaxies) while fainter galaxies exhibited steeper surface brightness cusps (“power-law” galaxies; e.g., Ferrarese et al. 1994; Lauer et al. 1995; Faber et al. 1997). The paucity of galaxies with intermediate slopes was striking — in plots of radially-scaled luminosity density profiles, core and power-law galaxies were seen to define two distinct, and virtually non-overlapping, populations (see, e.g., Figure 3 of Gebhardt et al. 1996; hereafter G96).
However, as subsequent studies targeted larger and better defined samples, some galaxies having intermediate slopes were discovered. The distinction between core and power-law galaxies became either less pronounced (e.g., Rest et al. 2001; Ravindranath et al. 2001; Lauer et al. 2007, hereafter L07) or disappeared entirely (Ferrarese et al. 2006a, b; Côté et al. 2007; hereafter C07. Note that these later studies parameterized the surface brightness profiles using modified Sérsic profiles rather than the so-called “Nuker” profiles used by earlier authors. See §3.3.1 of Ferrarese et al. 2006b for a more detailed discussion.)
In particular, C07 utilized high-quality HST imaging from the Advanced Camera for Surveys Virgo and Fornax Cluster Surveys (ACSVCS, Côté et al. 2004; ACSFCS, Jordán et al. 2007). Taken together, these two surveys represent the largest and most homogeneous imaging database currently available for a well characterized sample of early-type galaxies located in low-mass galaxies clusters in the local universe (i.e., at distances Mpc). The distribution of surface brightness profiles for the ACSVCS/FCS galaxies was found to be a smoothly varying function of galaxy magnitude: galaxies brighter than mag showed central luminosity “deficits” (typically within pc) with respect to the inward extrapolation of the Sérsic model that best fit the outer parts of the profiles, gradually transitioning toward the fainter galaxies that showed central luminosity “excesses” with respect to the Sérsic law (Côté et al. 2006; Ferrarese et al. 2006b). C07 further showed that a bimodality in the central slopes could be introduced by using a biased sample: in particular, Monte-Carlo simulations showed that the bimodal luminosity distribution of galaxies observed by L07 would lead naturally to a bimodal slope distribution, even when the intrinsic slope distribution was continuous along the galaxy luminosity function.
Since C07 was published, Kormendy et al. (2009; hereafter K09) have commented on the core/power-law dichotomy issue as well, although they did not compute inner profile slopes. They extracted surface brightness profiles from 40 of the 100 ACSVCS galaxies and combined them with profiles from other space- and ground-based photometry, in some cases adding somewhat to the radial extent of the data. They also included profiles from space- and ground-based imaging of three additional galaxies, NGC 4261, NGC 4636, and M32. Their fits to the surface brightness profiles were determined in a very similar manner to C07, i.e., fitting modified Sérsic models (see §2.1 of C07 and Appendix A of K09) and, as such, there were no systematic differences in the fits for individual galaxies, as shown in Figure 75 of K09. In fact, K09 confirmed the trend from central light deficit to excess along the luminosity function of this sample that was noted by Ferrarese et al. (2006b) and Côté et al. (2006, 2007). However, K09 excluded 60% of the ACSVCS sample – in particular, the vast majority of galaxies in the range – and, unlike C07, included none of the Fornax cluster galaxies. They consequently found a qualitative gap in the inner slopes of their surface brightness profiles (see their Figure 40) and interpreted this gap as confirming the existence of the core/power-law dichotomy. P. Côté et al. (2011, in prep) will provide a much more thorough comparison of the ACSVCS/FCS results with K09.
Several previous authors (e.g., G96; L07) who claimed a dichotomy in central surface brightness slopes, extended their work by examining the slopes of three-dimensional (i.e., deprojected) luminosity density profiles. These studies again found that a dichotomy exists, a result that cannot be immediately assumed given how rapidly shallow projected inner profiles deproject to relatively steeper inner profiles (see, e.g., Dehnen 1993; Merritt & Fridman 1996; G96; Figure 5a-c of this paper). To address this issue, we show here that the distribution of slopes noted by Ferrarese et al. (2006a, b) and C07 remains continuous once the profiles are deprojected into three-dimensional luminosity density profiles. The deprojections — which are based on a numerical inversion of the parameterized surface brightness profiles under the assumption of sphericity — produce individual inner slopes that are consistent with those obtained using the non-parametric methodologies of G96 and L07. This finding provides additional support for the conclusion that the apparent division of galaxies into core and power-law types is a consequence of the galaxy selection function used in previous studies, which was greatly overabundant in luminous core galaxies, while galaxies in the magnitude range corresponding to the transition between core and power-law types were under-represented. (See Figure 4 of C07.) At the same time, we note that the characterization of galaxies by the slopes of the central brightness profiles is rather sensitive to a number of factors (including the choice of measurement radius, resolution, and model parameterization). We introduce a parameter, , that quantifies the central deviation of the luminosity density profile from the inward extrapolation of the Sérsic model fitted to the main body of the galaxy. We show that, when parameterized in this way, early-type galaxies show a systematic progression from central luminosity deficits to excesses (nuclei) along the luminosity function.
2 Observations
2.1 The ACS Virgo and Fornax Cluster Surveys
The ACS Virgo and Fornax Cluster Surveys imaged 143 early-type galaxies (morphological types: E, S0, dE, dE,N, dS0, and dS0,N) using the ACS Wide Field Channel (WFC) in the F475W () and F850LP () filters. For the purpose of this work, five galaxies were excluded because of severe dust obscuration in the inner region. The galaxies used in this analysis are listed in Tables 1 and 2. Combined, the survey galaxies span a -band luminosity range of . The ACSVCS is magnitude-limited down to mag ( mag, i.e. 1-1.5 mag fainter than the expected core/power-law transition) and complete down to its limiting magnitude of mag ( mag). The ACSFCS sample is complete down to its limiting magnitude of mag ( mag).
The ACS/WFC consists of two pixel CCDs with a spatial scale of per pixel, covering a field of view of roughly . The spatial resolution corresponds to pc in Virgo ( Mpc; Mei et al. 2007) and pc in Fornax ( Mpc; Blakeslee et al. 2009). Azimuthally averaged surface brightness profiles were generated for each galaxy, in each band, as explained in detail in Ferrarese et al. (2006b) and Côté et al. (2006). These papers provide full details on corrections for dust obscuration, masking of background sources, the identification of offset nuclei via centroid shifts, and the weighting schemes and minimization routines used in fitting the one-dimensional profiles.
2.2 Parameterization of the Surface Brightness Profiles
To deproject the brightness profiles for the program galaxies, point-spread function (PSF) convolved parametric models were fitted to the observed surface brightness profiles derived from both the F475W (-band) and F850LP (-band) images. Parametric models represent the profiles before PSF convolution; in what follows, when discussing a comparison between “model” and “observed” profiles, it will be implicitly assumed that the model is first PSF convolved.
Over the vast majority of their radial ranges, the global brightness profiles of the galaxies in our sample are well represented by (PSF-convolved) Sérsic models (Sérsic, 1963, 1968), however, in the innermost regions – typically within of the effective radius (C07) – the surface brightness profiles tend to diverge from a Sérsic model. For galaxies brighter than mag, the surface brightness profiles within fall below the global best-fit Sérsic models. For galaxies with mag, a single Sérsic model generally provides an acceptable fit over all radii, including the innermost regions. Galaxies fainter than mag tend to have surface brightness profiles that, within , extend significantly above the inward extrapolation of the global Sérsic models. In what follows, we shall refer to these light excesses as “stellar nuclei”, or simply “nuclei” (consistent with Ferrarese et al. 2006b).iiiA note on terminology: whereas these bright regions at the centers of early-type galaxies have historically been referred to as “stellar nuclei” and the host galaxies as “nucleated”, groups studying what are likely the same type of objects at a different point in their evolution in late-type galaxies tend to refer to them as “nuclear star clusters” or simply “nuclear clusters” (e.g., Rossa et al. 2006; Böker 2007). In early types, they have also been referred to as “light excesses” (e.g., Côté et al. 2006, C07) or “extra light” (e.g., Kormendy 1999; Kormendy et al. 2009). For the sake of simplicity (and because some nuclei — such as in VCC 1146 — are in fact disk-like structures, therefore making the term “cluster” somewhat misleading in these cases) we refer to them here as “compact stellar nuclei” in “nucleated” galaxies. In any case, the practical definition of a nucleus is the same as that adopted in all previous papers in this and the ACSVCS series: i.e., “a central excess in the brightness profile relative to the fitted Sérsic model” (i.e., Appendix A of Côté et al. 2006). As one moves down the galaxy luminosity function — and the surface brightness of the underlying galaxy drops in kind — these nuclei become increasingly obvious in both the HST images and the 1D surface brightness profiles (see, e.g., Figures 1 and 2 of C07, as well as our Figure 1a-e).
We can account for central luminosity variations from a global Sérsic fit using a single fitting function, the “core-Sérsic” model (e.g., Graham et al. 2003; Trujillo et al. 2004), in which the Sérsic model is modified to have a power-law profile inside a break radius, :
| (1) |
where is related to by:
| (2) |
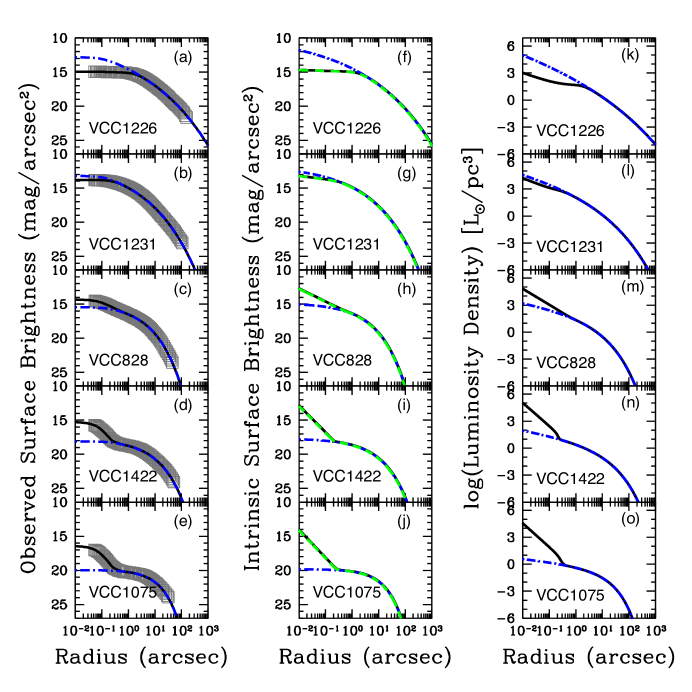
and (e.g., Graham & Driver 2005). The core-Sérsic fits for five representative galaxies from our sample, arranged top to bottom from brightest to faintest, are illustrated in Figure 1a-e by the solid black lines; the Sérsic component of the fits are highlighted by the dot-dashed blue lines. The progression from central light deficit to excess shown is characteristic of our sample, although it should be noted that there are also a small number ( of our sample) of fainter galaxies ( mag) which do not deviate significantly from a single Sérsic model at small radii. These “non-nucleated dwarf” galaxies are discussed in §4 of C07.
2.3 Deprojecting the Surface Brightness Profiles
Under the assumption of spherical symmetry, the surface brightness profile of a galaxy can be deprojected into the luminosity density profile using an Abel integral,
| (3) |
where denotes the radius of the galaxy in spherical coordinates and denotes the radius of the galaxy projected onto the sky (e.g., Binney & Tremaine 1987).
For each program galaxy (excepting five for which we were unable to perform a core-Sérsic fit due to the presence of dust) the above integration was performed numerically using as specified in §2.2 and using surface brightness fluctuation distances from Blakeslee et al. (2009). The deprojections of five representative galaxies are shown by the solid black lines in the rightmost panels in Figure 1. The deprojections were carried out a second time excluding the central power law (i.e., using the Sérsic component of the surface brightness profile fit only). This is plotted as the blue curves in panels (-) of Figure 1. In order to verify our deprojection routine, each luminosity density profile was “re-projected” numerically to confirm agreement with the original (parameterized) surface brightness profile. These re-projections were found to match the original profiles very closely, as shown by the green dashed lines in Figure 1f-j.
3 Results
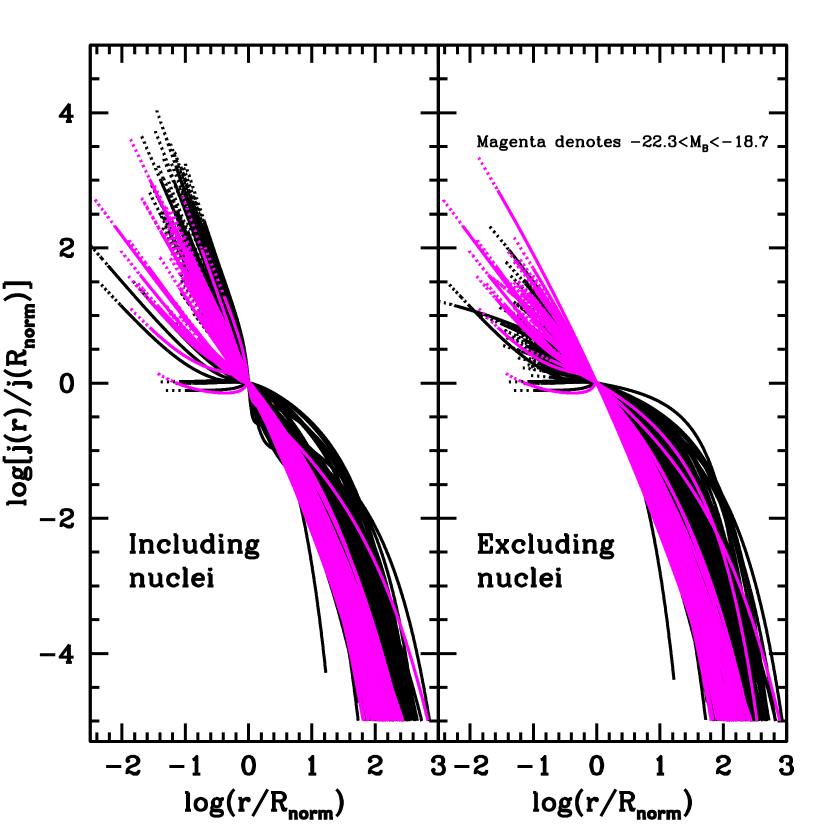
The luminosity density profiles of the ACSVCS and ACSFCS galaxies are plotted in Figure 2, normalized as a function of in order to compare all galaxies at once. The panel on the left shows the deprojections of the full core-Sérsic profiles while the one on the right shows the deprojections excluding nuclei. (In other words, for those galaxies with central light excesses, only the deprojected Sérsic component of the outer surface brightness profile fits are shown on the right whereas galaxies with central light deficits are deprojected from the core-Sérsic fits including the central power-law component in both panels.) Galaxies brighter than mag have been highlighted in magenta: these galaxies span a 3.6 mag range centered at mag, which marks the reported separation between the core and power-law galaxies (e.g., L07). For the sake of simplicity, we show the profiles obtained from the -band observations only, given that the overall results using the -band observations are the same.
The left panel of Figure 2 is analogous to Figure 3 of G96 and Figure 6 of L07, who numerically deprojected non-parametric representations (which therefore include nuclei) of the surface brightness profiles of a heterogeneous sample of galaxies drawn from the HST archive. Whereas they find a clear region in which the inner profiles do not fall, the inner profiles in Figure 2 fan out to cover a continuous range of slopes. This is true whether we look at the entire sample or only at those galaxies with magnitudes around mag. It is also true whether nuclei are included or not. Note that a small gap in the inner slopes of the luminosity density profiles in the left panel may be perceived. We do not, however, believe this is significant, for several reasons. Firstly, the gap is so small that one single galaxy with the appropriate central slope would fill it in. Secondly, this gap is nowhere near the magnitude of the gaps seen by G96 and L07. Lastly, and most importantly, as we show in what follows, no quantitative analysis of the inner slopes of these profiles reveals a discontinuity with galaxy magnitude.
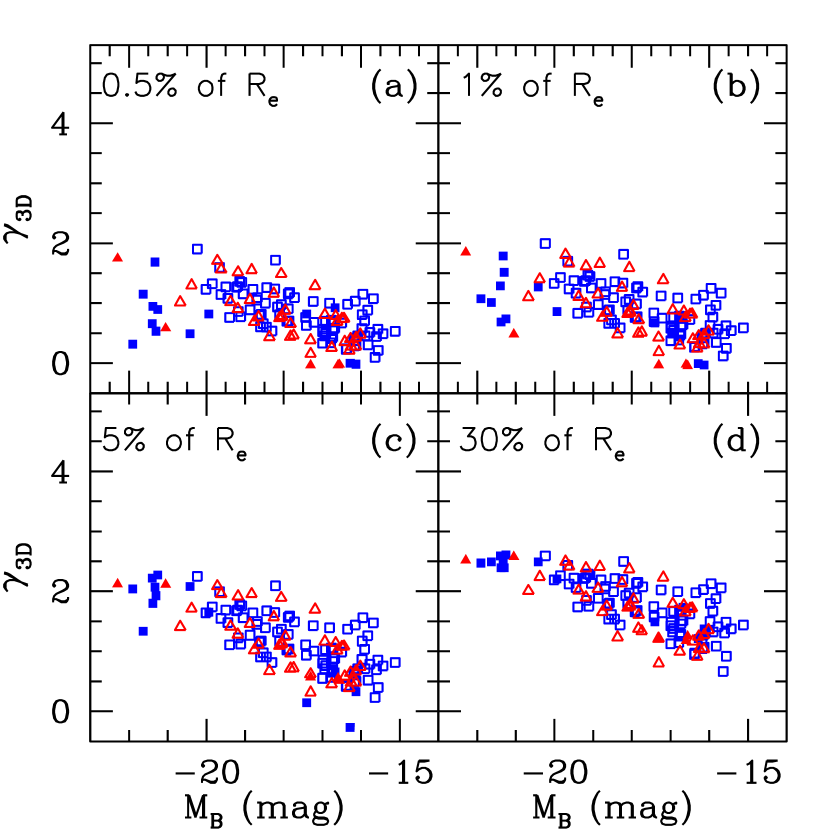
To this end, in order to further characterize the behavior of the inner luminosity density profiles, we compute the logarithmic derivative of numerically at different fractions (0.5%, 1%, 5%, and 30%) of the effective radius , where . The resulting values of are given for the Virgo galaxies in Table 1 and for the Fornax galaxies in Table 2.
Figures 3 and 4 plot as a function of for the -band, including and excluding nuclei, respectively. As expected, the nuclei do not impact the distributions when the slope is measured beyond 5% of : most stellar nuclei have effective radii of of and their contribution at much larger radii is therefore negligible. There is no evidence of disjoint populations in these figures, although the distributions have large scatter (especially when nuclei are included and the slope is measured at small radii, since under these conditions the gradients in the profiles can change dramatically), are not linear, and show clearly varying systematic trends as one moves down the luminosity function. For instance, in the brightest galaxies the central brightness profile (projected or not) flattens as galaxies become brighter, while the opposite is true for fainter systems if the nuclei are excluded. (Indeed, as noted by Ferrarese et al. 2006b, once we subtract the nuclei, the shallowest inner profiles belong to the faintest systems.) Likewise, while the fainter galaxies define nearly linear relations in all plots, the brighter galaxies deviate from the extrapolation of such relations. However, non-linearity should not be mistaken as evidence of separate populations. As one moves from the brightest to the faintest systems, the slopes change smoothly and continuously: in none of the panels do the points segregate into separate regions of the parameter space.
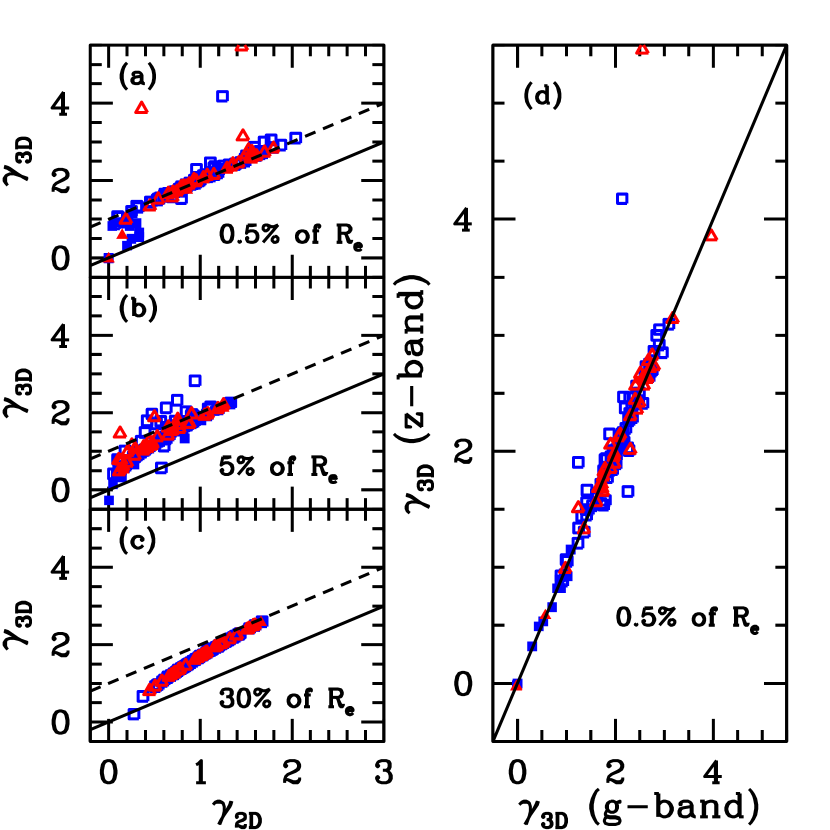
A comparison of and its two-dimensional analog, (in the -band), as well as a comparison of in the and -bands, is shown in Figure 5a-d. (The nuclei have been included in this figure.) As expected (e.g., Dehnen 1993; Merritt & Fridman 1996; G96), correspond to projected slopes that are shallower by dex, whereas galaxies spanning the range of slopes all translate, once projected, to surface brightness profiles with nearly identical shallow cores characterized by , a point to which we will return later. Panel (d) of Figure 5, which compares the results obtained using the different bandpasses at 0.5% of , demonstrates that there is good agreement between the and profiles. Taken together with Figures 3 and 4, there is no evidence of a separation of galaxies into distinct classes claimed by G96 and L07.

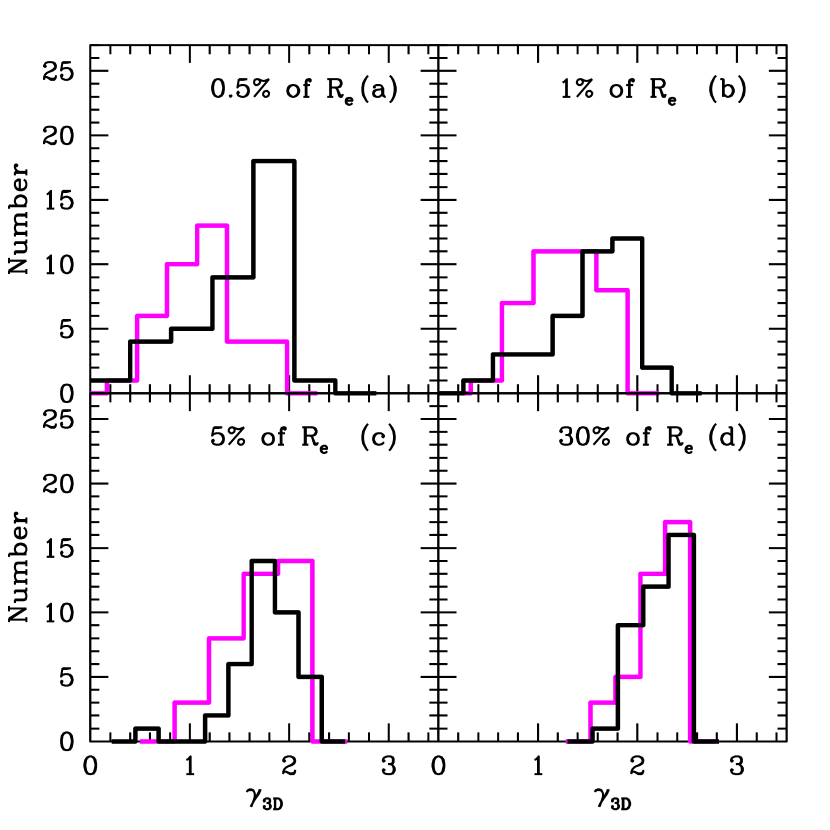
Finally, histograms of the distributions at various fractions of are shown in Figure 6a-d, both including (black) and excluding (magenta) compact stellar nuclei, as well as in Figure 7a-d for galaxies with mag mag (a range, as mentioned earlier, centered on mag, where the dichotomy is supposed to occur). The ACSVCS and ACSFCS samples are combined in both figures as the histograms of each sample individually do not differ in substance. The bin size is the “optimal” bin size given by Izenman (1991) as , where is the total number of objects and is the interquartile range, i.e., the range of the second and third quartiles of the ordered distribution. These figures confirm the impression, drawn from Figures 3 and 4, that the distributions of are not bimodal. Note also that the distribution of is dependent on where is measured, as expected given that, in Sérsic models, the curvature itself is a function of radius.
By comparing the histograms showing the slopes obtained including and excluding the nuclei in Figure 6, it is evident that the large values of observed at the innermost radii reflect the presence of nuclei: not only do the largest values disappear in the histogram excluding the nuclei, but also, the histograms including and excluding the nuclei become very similar when the slopes are measured at larger radii, past the point at where the underlying galaxy begins to dominate the profile. All in all, and most importantly, the distributions do not appear bimodal, regardless of whether or not the nuclei are included and whether the entire sample, or just a limited magnitude range around the point where a minimum is supposed to occur, are plotted.

4 Caveats and Comparisons with Previous Work
The results presented above hinge on two main assumptions: (1) that the adopted parameterization — which, once convolved with the instrumental PSF, describes the observed surface brightness profile quite well — is a good description of the intrinsic (pre-convolution) projected profile; and (2) that the galaxies can be deprojected under the assumption of sphericity. In their analyses, G96 and L07 performed numerical deprojections of non-parametric spline fits to the surface brightness profiles derived by fitting isophotes to deconvolved images; in this paper, we have opted to perform a numerical deprojection of the parametric models that, once convolved with the instrumental PSF, best fit the surface brightness profiles derived by fitting isophotes to PSF-convolved images.
Both methods have disadvantages. Deconvolution of noisy data does not generate images with infinitely high spatial resolution, and therefore, pre-convolution images are not generally coincident with deconvolved images. Noise amplification in deconvolved images can also be a concern. Additionally, using a parametric approach, the nucleus can be either included or excluded, whereas this cannot be easily accomplished using the deprojection method of G96 and L07. (Indeed, nuclei are included in their analysis.) Conversely, because the nuclear component is often just barely resolved in the images, a given parameterization may not be unique. A priori, therefore, there is no obvious reason to prefer one approach to the other.
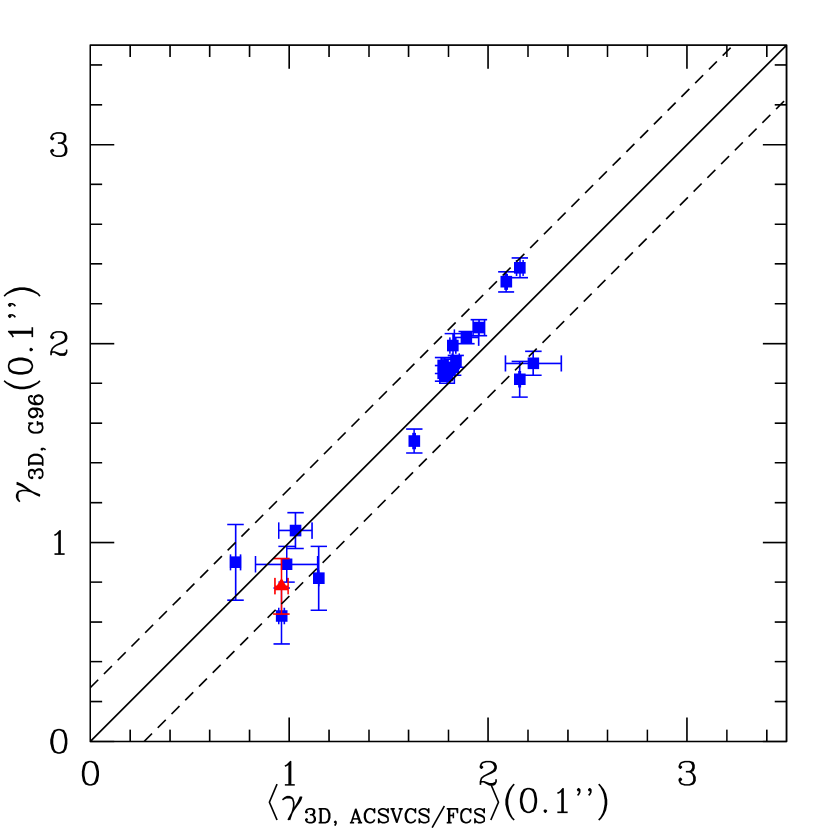
We have compared our values for the 19 galaxies (14 classified as E, 3 as E/S0, and 2 as S0) in common between our sample and that of G96, spanning a magnitude range between mag (although most are brighter than mag). This is shown in Figure 8. For this comparison, our measurements are made at , the fixed angular radius adopted for the slope measurements presented in G96. The values we compute for are given in Tables 1 and 2 for our entire sample. (We are unable to compare with L07 because they did not tabulate their values for .) The systematic difference between our slopes and those of G96 amounts to an average of only of , with no obvious trend with galaxy magnitude. We therefore conclude that the choice of image processing (whether or not to deconvolve the images) and fitting functions (core-Sérsic versus spline) has little effect on the derived slopes and is not sufficient to alter any of our conclusions.
The consequences of our assumption of sphericity are more difficult to assess. As detailed in Ferrarese et al. (2006b), the observed one-dimensional surface brightness profiles used to carry out the model fitting are given as a function of the “geometric mean radius”, , where is the radius measured along the isophotal semimajor axis and is the ellipticity at . Using the geometric mean radius instead of the semi-major axis has the effect of “circularizing” the isophotes on the plane of the sky. In this sense, the deprojected profiles represent a characteristic luminosity density along an axis that is intermediate between the observed (projected) major and minor axes of the galaxy.
The assumption that the galaxy is circularly symmetric perpendicular to the plane of the sky is born out of necessity, as the inclination angle of the galaxy is generally unknown. The expectation, however, is that when looking at a sample of randomly oriented galaxies, our “edge-on” approximation would lead us to overestimate the luminosity density and inner slopes (by amounts which depend on the inclination and on the shape of the observed profiles). Qualitatively, this is unlikely to reconcile our results with the existence of a core/power-law dichotomy because luminous (“core”) galaxies are traditionally believed to be close to spherically-symmetric, pressure-supported systems, while fainter (“power-law”) galaxies are believed to be flattened (e.g., Lauer et al. 2007; but see also Emsellem et al. 2007). Relaxing our edge-on assumption would therefore have little affect on the core galaxies, but would decrease the luminosity density slope of power-law galaxies, therefore narrowing, rather than widening, any gap between the two. In any case, both our analysis and that of G96 and L07 assume sphericity. This assumption, therefore, could not account for the different conclusions reached by their studies and ours.
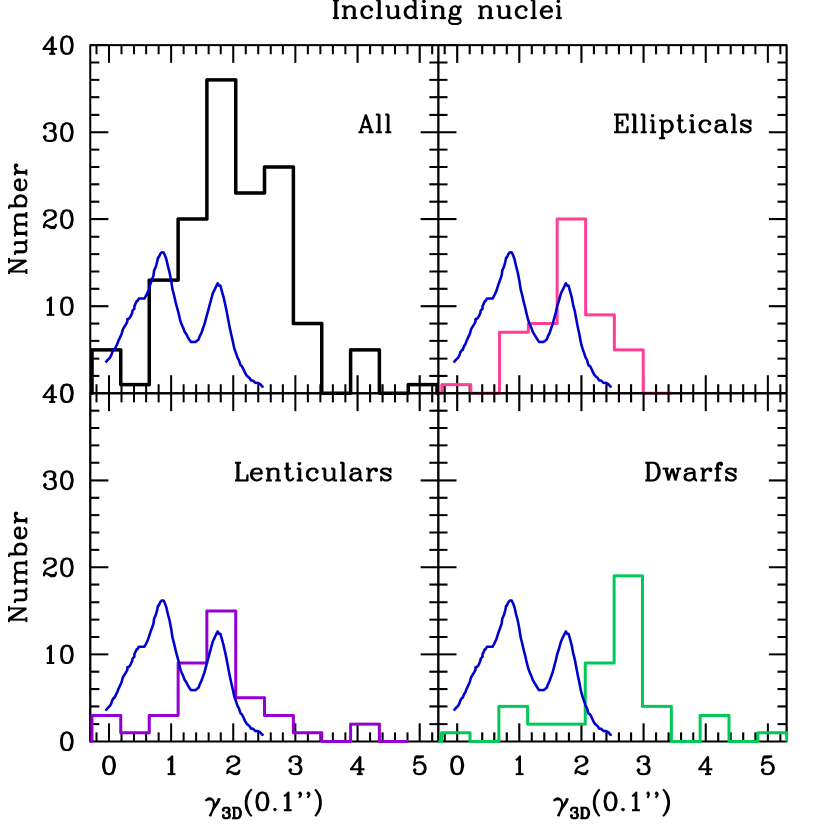
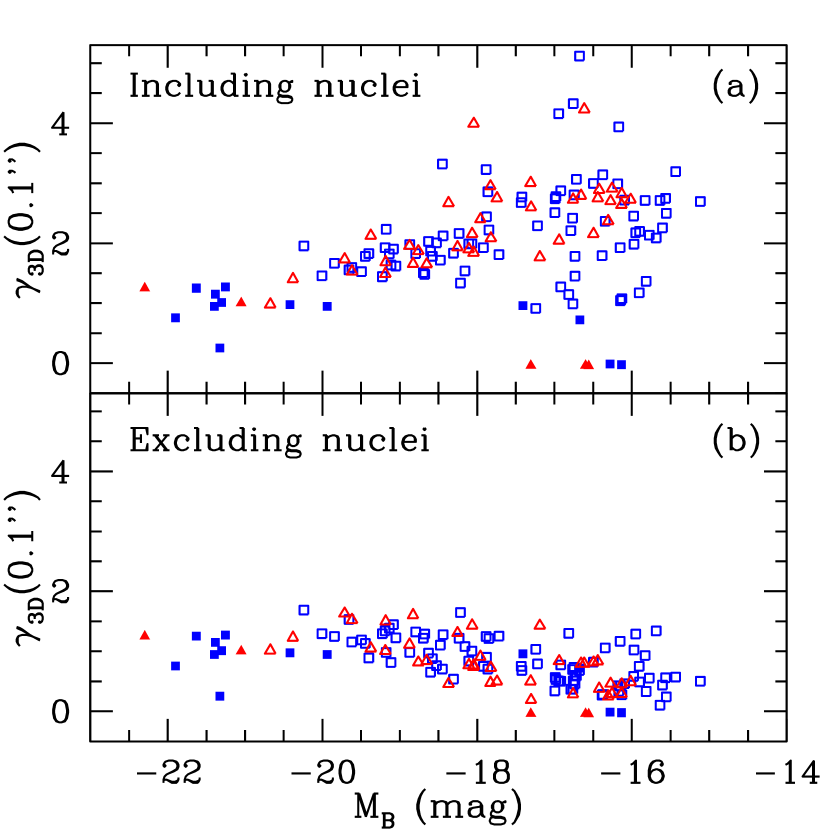
The disagreement between our results and those of L07, specifically, is made clear by the histograms in Figures 9 and 10, which plot the distribution of both including and excluding nuclei. Figure 9, which plots including nuclei, is directly analogous to the second panel of L07’s Figure 7 as they include nuclei in their analysis. For completeness, we also show our distributions excluding nuclei in Figure 10. In the past, there has been some debate as to which morphological types should be included in this type of analysis. In a companion paper (P. Côté et al. 2011, in prep), we will present a detailed comparison of morphological classifications for ACSVCS and ACSFCS galaxies from a variety of sources, including Binggeli et al. (1985), the RC3 (de Vaucouleurs et al., 1991), Ferguson (1989), and new classifications by S. van den Bergh made directly from the ACS imaging used in this paper. Although there is, at best, only fair agreement among the different studies, we have used these classifications to assign “consensus morphologies” (E, S0, or dwarf) to the complete sample of galaxies. While these morphologies are often quite uncertain for individual galaxies, classifying them into three broad bins for ellipticals, lenticulars, and dwarfs (which we take to include both dEs and dS0s) allows an examination of how our results might change with different morphological samples. At the same time, we emphasize that the distinction between, e.g., Es and S0s is often highly ambiguous as these galaxies follow the same global scaling relations (e.g., Ferrarese et al. 2006b; P. Côté et al. 2011, in prep) and can often not be differentiated even with the addition of kinematic information (e.g., Emsellem et al. 2007; Chilingarian et al. 2009b).iiiiiiIn fact, it is for these reasons, as well as because disk fitting functions are degenerate – meaning that, although exponential profiles are generally assumed, there is no a priori reason to prefer this functional form to another – that we feel it is justified not to perform a bulge-disk decomposition in our analysis. In any case, neither G96 nor L07 perform a decomposition for the lenticular galaxies in their samples, so this does not explain our differing results. Nevertheless, Figures 9 and 10 show the results of dividing the sample in this way into ellipticals (in pink), lenticulars (in purple), and dwarfs (in green). Whereas L07 find peaks in the distribution at and , and a trough at – as shown by the fit to L07’s distribution, plotted over our distributions in Figures 9 and 10 – none of our distributions support this type of dichotomy. For completeness, we have also plotted versus in Figure 11, both including and excluding nuclei. It clearly shows a gradual trend in with magnitude, not a discontinuous steepening.

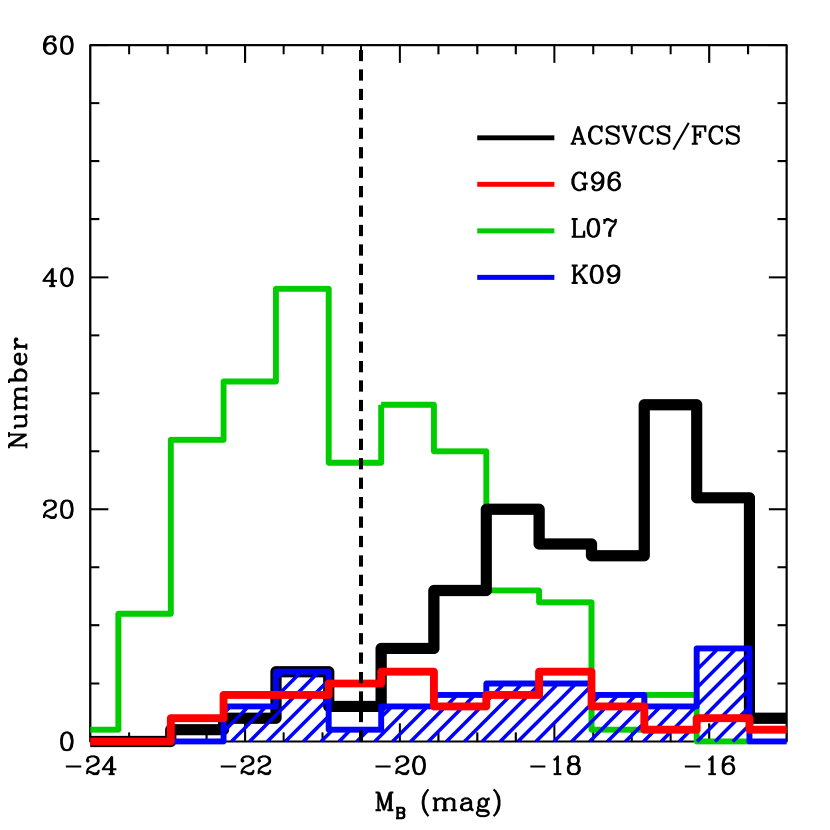
The origin of the discrepancy with the results of both G96 and L07 lies in the samples analyzed in the different studies. As C07 explain in more detail, our sample consists of early-type galaxies in Virgo and Fornax that have a well-understood selection function, one that closely resembles the Schechter-type luminosity function exhibited by galaxies in general and in these clusters specifically. By contrast, the samples analyzed by G96 and L07 are strongly overabundant in bright (“core”) galaxies compared to standard luminosity functions and quickly become incomplete at fainter magnitudes – a luminosity regime where the ACSVCS and ACSFCS samples show clearly that the class of early-type so-called “power-law” galaxies nearly always have a two-component structure: i.e., the galaxy itself and a nuclear component. Figure 12 plots the luminosity functions for the combined ACSVCS/FCS, G96 , and L07 – as well as for K09 for comparison.
5 An alternative, integral characterization of early-type galaxies
It is apparent that measuring the logarithmic slopes of the inner regions of early-type galaxies can be a rather ambiguous process. In particular, the radius at which either or should be measured is not clear and is often not consistent from one study to the next. This is troubling given that, as we have shown in § 3 and §4, can vary substantially over relatively small radii.
In their paper addressing , C07 propose a new, physically motivated parameter designed to quantify the behavior of the inner surface brightness profile and the tendency of early-type galaxies to transition systematically from central light deficit below the global Sérsic fit for the brightest galaxies to a central light excess above the global Sérsic fit as galaxies become fainter. This quantity, dubbed , is essentially the logarithm of the ratio of the observed luminosity in the central region to the luminosity from the inward extrapolation of the Sérsic fit, both integrated within 2% of the effective radius. For the deprojected profiles here, we define a similar quantity as:
| (4) |
where and are the luminosities inside the break radius , integrated from the deprojected core-Sérsic profile for the former and from the deprojection of the Sérsic-only profile for the latter. This parameter allows us to quantitatively characterize a galaxy as having a light deficit () or a light excess (i.e., a nucleus; ).
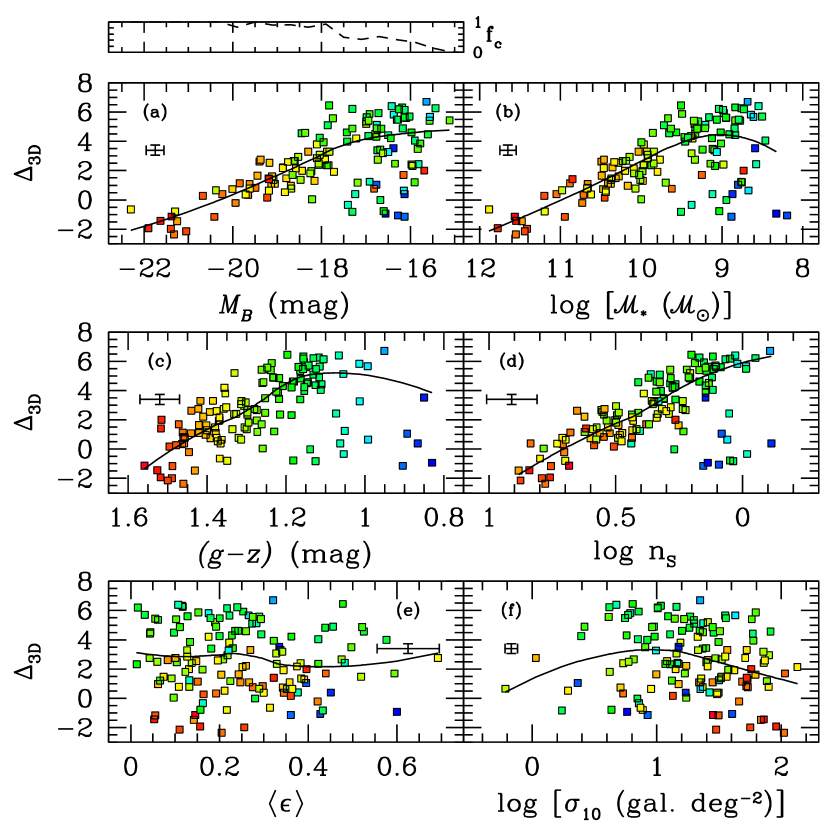
We have computed for each galaxy in our sample, the results of which are listed in Tables 1 and 2. In Figure 13, these values are plotted against a variety of galaxy parameters (e.g., Peng et al. 2008; Ferrarese et al. 2006b; L. Ferrarese et al. 2011, in prep; P. Côté et al. 2011, in prep). Panels – show as a function of absolute blue magnitude , galaxy (stellar) mass , color, Sérsic index , mean ellipticity , and local galaxy density iiiiiiiiiDefined as the surface density corresponding to the distance of the 10 nearest confirmed or probable cluster members according to Binggeli et al. (1985) and Ferguson (1989), i.e., .. Symbols have been color-coded according to the galaxy colors, which are shown in panel . To highlight any trends with , the smooth curve shown in each panel shows the (non-parametric) locally-weighted scatterplot smoothing (LOWESS) fit to the data (see Cleveland & McGill 1984). It is advisable to view the extremes of the LOWESS curves with some caution given their reliance on a small number of data points. In the small panel in the upper left we show the completeness fraction of our sample of early-type galaxies in the Virgo and Fornax Clusters as a function of absolute magnitude.
There are obvious correlations in a number of these panels: i.e., there is a systematic increase in as one moves to lower luminosities or masses, bluer colors and lower Sérsic indices. Note that although most intermediate- and low-luminosity galaxies in our sample are strongly nucleated, there is a population of faint (), blue galaxies which either have smaller-than-expected nuclei or which are not nucleated at all, resulting in a skewed distribution around this magnitude. These could be galaxies that have not yet completed or indeed begun forming their nuclei. (See §4 of C07 for further discussion.) The most luminous, most massive, and reddest galaxies are always characterized by central light deficits, , although there is also a small number of faint and anomalously red galaxies that have . These are compact elliptical galaxies, which may be the tidal-stripped remains of more massive systems (e.g., Faber 1973, Bekki et al. 2001, Chilingarian et al. 2009a, P. Côté et al. 2011 in prep). By contrast, there is little or no correlation between and mean ellipticity or galaxy density — aside from the well known tendency for deficit/core galaxies to have low ellipticities in their central regions, and to occupy high-density environments at the centers of clusters or subclusters.
There are many advantages to using over to characterize the inner regions of early-type galaxies. Because is an integral quantity, it is not measured at an instantaneous radius and is therefore much easier to measure consistently than (although, of course is not model-independent). The inner region is simply defined as the radius inside which the total galaxy profile departs from the global Sérsic profile. Note that this does not necessarily require fitting a core-Sérsic profile in particular to a given galaxy. One need only combine a good global fit (likely a Sérsic profile) with a fit to the central region. This is advantageous, for example, in the case of a distant galaxy with an unresolved nucleus: the nucleus could be simply modeled as a point source and a value for obtained, whereas it would not be possible to measure including the nucleus for such a galaxy. Additionally, indicates whether a galaxy is nucleated or non-nucleated in a clear, intuitive way; conversely, it is not possible to state whether a galaxy contains a nucleus or not simply by knowing .
6 Discussion
The main result of this paper is that the deprojected profiles of the ACS Virgo and Fornax Cluster Survey galaxies do not support the existence of a core/power-law dichotomy around mag. Rather, we find that the inner luminosity density profiles fan out over a continuum of slopes, as C07 found when analyzing the projected profiles of the same sample. This result holds whether the compact nuclear components (i.e., nuclei, present in the vast majority of galaxies fainter than mag) are included or excluded in the deprojection.
This finding is in contrast to the results of L07 who also analyzed the projected and deprojected inner slopes of a sample of galaxies for which “Nuker”-law fits to the surface brightness profiles were available in the literature. As discussed in §4, the actual details of the deprojection technique are unlikely to be responsible for the difference in our findings. C07 point out that the L07 results are, in fact, biased by their sample selection, which is described by a luminosity function (shown in Figure 12) that is itself bimodal, as L07 themselves also note. Given the observed trend between galaxy magnitudes and inner profile slopes, C07 show that inner slopes drawn from a continuous distribution (such as the one observed for the ACSVCS/FCS galaxies) for galaxies following a bimodal luminosity function (such as the one characterizing the sample of L07) will produce a bimodal slope distribution that closely resembles the one observed by L07. The analysis presented in this paper adds further weight to this explanation by showing that, when using a representative galaxy sample such as the ACSVCS/FCS (see Figure 12), both the two-dimensional surface brightness profiles and the three-dimensional deprojected profiles define a nearly continuous sequence as a function of galaxy magnitude. Indeed, as shown in Figure 1, the apparent contrast in central brightness profiles between the brightest (shallow slopes) and the fainter galaxies (steeper slopes) is less striking in the deprojected profiles, as noted by previous investigators (e.g., G96, L07).
The absence of a dichotomy between “core” and “power-law” galaxies should perhaps not be surprising. It is generally believed that the core galaxies that populate the upper end of the luminosity function are nearly spherically symmetric, pressure supported, slowly rotating, boxy systems, while the opposite is true for power-law galaxies. In fact, although isophotal shape, kinematics and stellar populations do show systematic trends as a function of galaxy magnitude (Bender et al., 1989; Kormendy & Djorgovski, 1989; Caon et al., 1993; Ferrarese et al., 2006b), there is not a one-to-one correspondence between the core/power-law classification and the above mentioned properties. Most notably, the SAURON team found no clear correspondence between “core/power-law” galaxies and their “slow/fast rotators” (Emsellem et al., 2007). Similarly, P. Côté et al. (2011, in prep) find that stellar content and global structural parameters of ACSVCS and ACSFCS galaxies vary systematically along the luminosity function, but do not show any sign of a discontinuity across the alleged “core/power-law” divide.
From a theoretical standpoint, a dichotomy is also difficult to reconcile with a hierarchical merging scenario for the formation of early-type galaxies. Based on hydrodynamic simulations, Hopkins et al. (2008, 2009a) find that the “core” and “power-law” galaxies actually form a continuous family, very much in agreement with the results presented in this paper, as well as in Ferrarese et al. (2006b) and C07. A continuity is, in fact, expected given that the key processes involved in the formation of spheroids (e.g., the degree of dissipation) depend on factors such as the gas fractions and masses of the progenitors, which are themselves not believed to be discontinuous. This is not at all to argue that the faintest galaxies in our sample are simply scaled-down versions of the giant ellipticals. There are a number of processes that likely affect these galaxies, including mergers (with various gas fractions), stripping, harassment, cold gas accretion, etc. However, these processes should have differing – but not discontinuous – levels of importance as we travel down the luminosity function. In our view, parsing complete, or nearly complete, galaxy samples into small subgroups where certain physical mechanisms are expected to dominate and then concluding that these populations are fundamentally distinct will lead to an overly simplified, not to mention logically cyclical, view of the galaxy formation process.
As an aside, note that, moving down the luminosity function, our results also show no evidence of a discontinuity across the so called “giant/dwarf” transition, traditionally thought to occur at mag (e.g., Kormendy 1985). One of the arguments often cited in support of the notion that dwarf galaxies are physically distinct from regular ellipticals is that the former have exponential surface brightness profiles (i.e., Sérsic index ). Indeed, as Figure 1h-j demonstrates, as one travels down to fainter galaxies (from VCC 828 to VCC 1075 in this case) the underlying galaxy at inner radii tends to become very flat in projection. This trend may make it tempting to conclude that galaxies with flat underling inner surface brightness profiles are dwarf ellipticals while those with steeper inner slopes are giants. However, as Figure 5 illustrates, whereas for , since tends to deproject to a range of values between and , many of those “dwarf” galaxies that appear flat in projection fan out to create a continuous trend with magnitude when deprojected, bridging the gap to the so-called “giants”. Referring back to Figure 4, it is apparent that of the underlying galaxy is continuous with magnitude and does not suddenly flatten around .
At this stage, it is worth emphasizing that although Sérsic profiles were used to parameterize the observed surface brightness profiles globally simply because they provided the best empirical match, the very fact that this family of models so accurately fits the surface brightness profiles (for ) of both “core” and “power-law” galaxies, and of high- (“giant”) and low-luminosity (“dwarf”) galaxies must be a fundamental clue to the physics underlying the hierarchical assembly of baryons within merging dark matter halos. So is there any evidence for a physically motivated origin for Sérsic model? Hjorth & Madsen (1995) were the first to show that the deviations of the brightness profiles of real galaxies from a de Vaucouleurs law — the same deviations that can be accounted for explicitly by a Sérsic law — can be reproduced using a simple distribution function constructed on the basis of the statistical mechanics of violent relaxation. In a series of papers by Gerbal et al. (1997), Lima Neto et al. (1999), Márquez et al. (2000), and Márquez et al. (2001) it has been shown that elliptical galaxies lie on the intersection between two manifolds — one a scaling relation between potential energy and mass and the other representing quasi-constant specific entropy. These investigators were able to express this intersection in terms of the three Sérsic parameters and verify that actual elliptical galaxies fall within the Sérsic parameter space predicted theoretically. Finally, in a review article, Londrillo (2006) discusses how N-body numerical simulations of collisionless gravitating systems can reproduce Sérsic profiles given appropriate initial conditions.
Finally, in terms of the origin of galaxies with central light deficits versus those with light excess, it is widely accepted that the light deficits in “core” galaxies are the result of central scouring by coalescing black hole binaries following predominantly dissipationless galaxy mergers (Ebisuzaki et al. 1991; Faber et al. 1997; Gualandris & Merritt 2008) whereas nuclei are thought to be mainly the result of gas inflows into the core (Mihos & Hernquist 1994; Côté et al. 2006; C07; Emsellem & van de Ven 2008; Kormendy et al. 2009), with possible contributions from other processes, such as the infall of star clusters via dynamical friction (Tremaine et al. 1975; Tremaine 1976). It has been suggested that gas inflows played a role in the centers of light-deficit galaxies as well (see, e.g., Hopkins et al. 2009b), although Emsellem & van de Ven (2008) find that the tidal forces in a galaxy are compressive for Sérsic indices such that available gas could collapse and form a cluster of stars in the center while, for , the tidal forces become disruptive. It may be that, although gas compression becomes increasingly important as one moves down the luminosity function, inflows still occur at higher masses, albeit at reduced levels.
| ID | Name | ||||||||||||
|---|---|---|---|---|---|---|---|---|---|---|---|---|---|
| (1) | (2) | (3) | (4) | (5) | (6) | (7) | (8) | (9) | |||||
| 1 | VCC 1226 | -21.90 | 0.30 | 1.00 | 2.02 | 2.46 | 0.70 | -1.99 | |||||
| 0.32 | 1.08 | 2.04 | 2.47 | 0.76 | -1.93 | ||||||||
| 2 | VCC 1316 | -21.63 | 1.09 | 0.93 | 1.38 | 2.52 | 1.23 | -1.74 | |||||
| 1.15 | 1.01 | 1.33 | 2.49 | 1.25 | -1.43 | ||||||||
| 3 | VCC 1978 | -21.38 | 0.95 | 0.69 | 1.78 | 2.37 | 1.15 | -1.04 | |||||
| 0.95 | 0.69 | 1.80 | 2.40 | 1.15 | -1.14 | ||||||||
| 4 | VCC 881 | -21.33 | 1.69 | 1.79 | 2.07 | 2.48 | 0.30 | -2.26 | |||||
| 1.69 | 1.79 | 2.07 | 2.48 | 0.25 | -2.36 | ||||||||
| 5 | VCC 798 | -21.30 | 0.53 | 1.37 | 1.93 | 2.39 | 0.96 | -0.90 | |||||
| 0.53 | 1.52 | 1.93 | 2.39 | 1.01 | -0.79 | ||||||||
| 6 | VCC 763 | -21.25 | 0.86 | 0.76 | 2.23 | 2.59 | 1.25 | -1.41 | |||||
| 0.89 | 0.74 | 2.27 | 2.61 | 1.27 | -1.47 | ||||||||
| 7 | VCC 731 | -21.40 | 0.71 | 0.78 | 2.07 | 2.50 | 1.12 | -1.31 | |||||
| 0.66 | 1.29 | 2.22 | 2.59 | 0.95 | -1.98 | ||||||||
| 8 | VCC 1535 | -20.58 | |||||||||||
| 9 | VCC 1903 | -20.24 | |||||||||||
| 1.93 | 1.90 | 1.86 | 2.00 | 2.24 | 2.25 | 2.59 | 2.59 | 1.95 | 1.69 | 0.39 | |||
| 10 | VCC 1632 | -20.42 | 0.43 | 1.38 | 2.08 | 2.49 | 0.95 | -1.20 | |||||
| 0.49 | 1.27 | 2.08 | 2.49 | 0.98 | -1.16 | ||||||||
| 11 | VCC 1231 | -19.94 | 0.81 | 0.89 | 1.65 | 2.21 | 0.95 | -0.19 | |||||
| 0.82 | 0.86 | 1.65 | 2.21 | 0.95 | -0.21 | ||||||||
| 12 | VCC 2095 | -20.01 | 1.45 | 1.41 | 1.41 | 1.51 | 1.59 | 1.82 | 2.29 | 2.32 | 1.44 | 1.43 | 0.05 |
| 1.50 | 1.23 | 1.43 | 1.33 | 1.62 | 1.64 | 2.19 | 2.19 | 1.46 | 1.30 | 0.74 | |||
| 13 | VCC 1154 | -19.85 | 1.42 | 1.64 | 1.63 | 1.74 | 2.03 | 2.03 | 2.46 | 2.46 | 1.51 | 1.56 | 0.25 |
| 1.67 | 1.33 | 1.52 | 1.43 | 1.74 | 1.74 | 2.26 | 2.26 | 1.67 | 1.25 | 1.14 | |||
| 14 | VCC 1062 | -19.62 | 1.62 | 1.07 | 1.61 | 1.17 | 1.47 | 1.47 | 2.06 | 2.06 | 1.62 | 1.09 | 1.18 |
| 1.60 | 1.14 | 1.58 | 1.24 | 1.55 | 1.55 | 2.12 | 2.12 | 1.60 | 1.16 | 1.09 | |||
| 15 | VCC 2092 | -19.66 | 1.80 | 1.38 | 1.50 | 1.48 | 1.79 | 1.79 | 2.29 | 2.29 | 1.79 | 1.35 | 1.27 |
| 1.58 | 1.60 | 1.64 | 1.70 | 1.94 | 1.99 | 2.42 | 2.43 | 1.56 | 1.53 | 0.34 | |||
| 16 | VCC 369 | -19.40 | 2.02 | 0.81 | 2.01 | 0.89 | 1.63 | 1.17 | 1.81 | 1.80 | 1.98 | 0.94 | 2.80 |
| 1.89 | 0.76 | 1.86 | 0.83 | 1.66 | 1.11 | 1.82 | 1.74 | 1.83 | 0.89 | 2.62 | |||
| 17 | VCC 759 | -19.49 | 1.41 | 1.23 | 1.26 | 1.33 | 1.64 | 1.64 | 2.19 | 2.19 | 1.44 | 1.15 | 0.69 |
| 1.50 | 1.27 | 1.35 | 1.37 | 1.69 | 1.69 | 2.22 | 2.22 | 1.52 | 1.19 | 0.83 | |||
| 18 | VCC 1692 | -19.44 | 1.77 | 1.09 | 1.76 | 1.18 | 1.67 | 1.49 | 2.06 | 2.07 | 1.76 | 1.13 | 1.47 |
| 1.80 | 1.08 | 1.77 | 1.17 | 1.70 | 1.48 | 2.06 | 2.06 | 1.78 | 1.13 | 1.65 | |||
| 19 | VCC 1030 | -19.39 | |||||||||||
| 20 | VCC 2000 | -19.08 | |||||||||||
| 1.90 | 1.35 | 1.91 | 1.45 | 1.76 | 1.76 | 2.27 | 2.27 | 1.90 | 1.44 | 1.36 | |||
| 21 | VCC 685 | -19.22 | 1.41 | 1.29 | 1.37 | 1.39 | 1.56 | 1.70 | 2.24 | 2.24 | 1.41 | 1.30 | 0.09 |
| 1.45 | 1.27 | 1.42 | 1.37 | 0.57 | 1.68 | 2.22 | 2.22 | 1.44 | 1.29 | 0.17 | |||
| 22 | VCC 1664 | -19.14 | 1.86 | 1.23 | 1.85 | 1.33 | 1.77 | 1.64 | 2.19 | 2.19 | 1.85 | 1.26 | 1.27 |
| 1.82 | 1.37 | 1.81 | 1.47 | 1.78 | 1.78 | 2.29 | 2.29 | 1.82 | 1.39 | 1.10 | |||
| 23 | VCC 654 | -19.17 | 1.81 | 0.88 | 1.89 | 0.96 | 1.31 | 1.25 | 1.87 | 1.87 | 1.93 | 1.00 | 2.20 |
| 1.94 | 0.86 | 2.12 | 0.94 | 1.24 | 1.23 | 1.85 | 1.85 | 2.23 | 0.98 | 2.54 | |||
| 24 | VCC 944 | -19.05 | 1.61 | 1.16 | 1.59 | 1.25 | 1.62 | 1.56 | 2.10 | 2.13 | 1.60 | 1.21 | 1.08 |
| 1.63 | 1.16 | 1.62 | 1.25 | 1.65 | 1.56 | 2.10 | 2.13 | 1.62 | 1.22 | 1.10 | |||
| 25 | VCC 1938 | -19.19 | 1.91 | 1.27 | 1.91 | 1.37 | 1.68 | 1.68 | 2.22 | 2.22 | 1.91 | 1.31 | 1.51 |
| 1.92 | 1.28 | 1.92 | 1.37 | 1.70 | 1.69 | 2.22 | 2.22 | 1.92 | 1.34 | 1.48 | |||
| 26 | VCC 1279 | -19.11 | 1.63 | 0.61 | 1.62 | 0.67 | 1.56 | 0.92 | 1.80 | 1.55 | 1.62 | 0.64 | 2.06 |
| 1.64 | 0.77 | 1.63 | 0.85 | 1.59 | 1.12 | 1.84 | 1.75 | 1.63 | 0.82 | 1.62 | |||
| 27 | VCC 1720 | -18.87 | 2.03 | 0.86 | 2.04 | 0.94 | 1.87 | 1.23 | 1.87 | 1.85 | 2.04 | 0.94 | 2.60 |
| 1.97 | 0.89 | 1.97 | 0.98 | 1.96 | 1.27 | 1.89 | 1.89 | 1.98 | 0.98 | 2.22 | |||
| 28 | VCC 355 | -18.70 | 1.71 | 1.00 | 1.70 | 1.09 | 1.40 | 1.39 | 1.99 | 1.99 | 1.70 | 1.15 | 1.50 |
| 1.55 | 1.05 | 1.53 | 1.14 | 1.48 | 1.45 | 2.02 | 2.04 | 1.51 | 1.22 | 0.97 | |||
| 29 | VCC 1619 | -18.60 | 1.81 | 0.56 | 1.81 | 0.62 | 1.87 | 0.85 | 1.48 | 1.48 | 1.81 | 0.61 | 2.56 |
| 1.86 | 0.60 | 1.87 | 0.67 | 2.03 | 0.91 | 1.54 | 1.54 | 1.87 | 0.65 | 2.67 | |||
| 30 | VCC 1883 | -18.63 | 2.28 | 0.78 | 2.33 | 0.85 | 1.76 | 1.13 | 1.76 | 1.76 | 2.44 | 0.95 | 3.48 |
| 2.01 | 0.80 | 2.00 | 0.87 | 2.83 | 1.15 | 1.79 | 1.79 | 2.03 | 0.97 | 2.66 | |||
| 31 | VCC 1242 | -18.53 | 1.91 | 0.67 | 1.93 | 0.73 | 1.65 | 0.99 | 1.62 | 1.62 | 1.95 | 0.76 | 2.81 |
| 1.95 | 0.66 | 1.97 | 0.72 | 1.71 | 0.98 | 1.61 | 1.61 | 2.01 | 0.76 | 2.94 | |||
| 32 | VCC 784 | -18.44 | 2.18 | 1.21 | 1.60 | 1.31 | 1.62 | 1.62 | 2.17 | 2.17 | 2.29 | 1.23 | 2.17 |
| 2.08 | 1.26 | 1.51 | 1.36 | 1.67 | 1.67 | 2.21 | 2.21 | 2.12 | 1.28 | 1.99 | |||
| 33 | VCC 1537 | -18.47 | 1.70 | 0.95 | 1.70 | 1.04 | 1.65 | 1.34 | 1.95 | 1.95 | 1.70 | 1.06 | 1.40 |
| 1.72 | 1.00 | 1.72 | 1.09 | 1.65 | 1.39 | 1.99 | 1.99 | 1.72 | 1.11 | 1.37 | |||
| 34 | VCC 778 | -18.68 | 1.53 | 1.10 | 1.51 | 1.19 | 1.20 | 1.50 | 2.08 | 2.08 | 1.48 | 1.27 | 0.79 |
| 1.53 | 1.09 | 1.52 | 1.19 | 1.14 | 1.50 | 2.08 | 2.08 | 1.48 | 1.29 | 0.77 | |||
| 35 | VCC 1321 | -18.22 | 1.76 | 1.76 | 1.86 | 1.86 | 2.13 | 2.13 | 2.52 | 2.52 | 1.38 | 1.66 | 0.08 |
| 1.54 | 1.71 | 1.82 | 1.82 | 2.09 | 2.09 | 2.50 | 2.50 | 1.34 | 1.65 | 0.04 | |||
| 36 | VCC 828 | -18.58 | 1.76 | 0.80 | 1.77 | 0.87 | 1.64 | 1.15 | 1.78 | 1.78 | 1.76 | 0.85 | 2.14 |
| 1.77 | 0.82 | 1.79 | 0.89 | 1.62 | 1.17 | 1.80 | 1.80 | 1.78 | 0.88 | 2.15 | |||
| 37 | VCC 1250 | -18.45 | 2.17 | 0.61 | 2.25 | 0.67 | 0.91 | 0.91 | 1.54 | 1.54 | 2.39 | 0.70 | 3.81 |
| 2.47 | 0.60 | 2.66 | 0.66 | 0.91 | 0.91 | 1.54 | 1.54 | 3.32 | 0.70 | 4.56 | |||
| 38 | VCC 1630 | -18.30 | 1.82 | 0.66 | 1.80 | 0.72 | 1.69 | 0.97 | 1.85 | 1.61 | 1.81 | 0.68 | 2.63 |
| 1.83 | 0.53 | 1.80 | 0.59 | 1.71 | 0.82 | 1.96 | 1.44 | 1.83 | 0.54 | 3.30 | |||
| 39 | VCC 1146 | -18.23 | 2.16 | 1.14 | 2.16 | 1.23 | 2.15 | 1.54 | 2.12 | 2.12 | 2.16 | 1.12 | 2.18 |
| 2.16 | 1.24 | 2.16 | 1.34 | 2.15 | 1.65 | 2.20 | 2.20 | 2.16 | 1.22 | 1.96 | |||
| 40 | VCC 1025 | -18.79 | 1.76 | 1.23 | 1.76 | 1.33 | 1.67 | 1.64 | 2.19 | 2.19 | 1.76 | 1.31 | 1.34 |
| 1.83 | 1.23 | 1.83 | 1.33 | 1.71 | 1.64 | 2.19 | 2.19 | 1.83 | 1.33 | 1.48 | |||
| 41 | VCC 1303 | -18.11 | 2.02 | 0.86 | 1.95 | 0.94 | 1.81 | 1.23 | 2.05 | 1.85 | 1.99 | 0.89 | 3.55 |
| 2.02 | 0.81 | 1.95 | 0.89 | 1.84 | 1.17 | 2.09 | 1.79 | 1.99 | 0.84 | 3.80 | |||
| 42 | VCC 1913 | -18.07 | 1.98 | 0.93 | 2.01 | 1.02 | 1.54 | 1.31 | 1.93 | 1.93 | 1.99 | 0.96 | 2.50 |
| 1.98 | 0.98 | 2.01 | 1.07 | 1.58 | 1.37 | 1.97 | 1.97 | 1.99 | 1.01 | 2.40 | |||
| 43 | VCC 1327 | -18.16 | 1.41 | 0.97 | 1.38 | 1.06 | 1.36 | 1.36 | 1.96 | 1.96 | 1.35 | 1.09 | 1.09 |
| 1.56 | 0.94 | 1.55 | 1.02 | 1.32 | 1.32 | 1.93 | 1.93 | 1.54 | 1.08 | 1.30 | |||
| 44 | VCC 1125 | -17.92 | 1.95 | 0.84 | 2.47 | 0.92 | 1.20 | 1.20 | 1.83 | 1.83 | 2.01 | 0.86 | 2.67 |
| 1.84 | 0.70 | 1.98 | 0.76 | 1.02 | 1.02 | 1.66 | 1.66 | 1.92 | 0.75 | 2.75 | |||
| 45 | VCC 1475 | -17.89 | 1.88 | 1.10 | 1.95 | 1.20 | 1.50 | 1.50 | 2.09 | 2.09 | 1.94 | 1.19 | 1.94 |
| 2.15 | 1.16 | 2.81 | 1.26 | 1.57 | 1.57 | 2.13 | 2.13 | 3.22 | 1.25 | 2.36 | |||
| 46 | VCC 1178 | -17.72 | 1.89 | 1.14 | 1.87 | 1.24 | 1.81 | 1.55 | 2.14 | 2.12 | 1.84 | 1.31 | 1.86 |
| 1.85 | 1.09 | 1.83 | 1.18 | 1.81 | 1.49 | 2.14 | 2.08 | 1.81 | 1.26 | 1.92 | |||
| 47 | VCC 1283 | -17.88 | 2.29 | 0.83 | 2.39 | 0.91 | 1.20 | 1.19 | 1.82 | 1.82 | 2.32 | 0.84 | 3.32 |
| 2.46 | 0.91 | 2.21 | 0.99 | 1.28 | 1.28 | 1.90 | 1.90 | 2.44 | 0.90 | 3.30 | |||
| 48 | VCC 1261 | -17.86 | 2.79 | 0.70 | 2.83 | 0.77 | 1.17 | 1.03 | 1.74 | 1.68 | 2.78 | 0.69 | 5.16 |
| 2.86 | 0.70 | 2.85 | 0.77 | 1.15 | 1.04 | 1.73 | 1.68 | 2.86 | 0.70 | 5.28 | |||
| 49 | VCC 698 | -17.85 | 2.08 | 1.16 | 1.91 | 1.26 | 1.61 | 1.57 | 2.14 | 2.14 | 2.06 | 1.19 | 2.47 |
| 2.13 | 1.18 | 2.69 | 1.28 | 1.59 | 1.59 | 2.15 | 2.15 | 2.22 | 1.21 | 2.36 | |||
| 50 | VCC 1422 | -17.43 | 2.63 | 0.69 | 3.61 | 0.76 | 1.02 | 1.02 | 1.65 | 1.65 | 2.62 | 0.69 | 4.66 |
| 2.73 | 0.76 | 5.80 | 0.84 | 1.11 | 1.11 | 1.74 | 1.74 | 2.68 | 0.75 | 4.61 | |||
| 51 | VCC 2048 | -17.42 | 2.27 | 0.63 | 3.02 | 0.70 | 0.95 | 0.95 | 1.58 | 1.58 | 2.70 | 0.69 | 3.94 |
| 2.29 | 0.63 | 3.07 | 0.69 | 0.94 | 0.94 | 1.57 | 1.57 | 2.77 | 0.68 | 3.98 | |||
| 52 | VCC 1871 | -17.22 | 2.43 | 0.55 | 2.33 | 0.61 | 1.84 | 0.84 | 1.66 | 1.46 | 2.26 | 0.64 | 4.94 |
| 2.41 | 0.68 | 2.35 | 0.75 | 1.78 | 1.01 | 1.71 | 1.64 | 2.29 | 0.79 | 4.20 | |||
| 53 | VCC 9 | -17.41 | 0.89 | 0.77 | 0.29 | 1.38 | 0.98 | -0.13 | |||||
| 0.82 | 0.67 | 0.14 | 1.49 | 0.96 | -0.34 | ||||||||
| 54 | VCC 575 | -17.68 | |||||||||||
| 55 | VCC 1910 | -16.99 | 2.69 | 0.54 | 2.87 | 0.59 | 0.95 | 0.82 | 1.44 | 1.44 | 2.77 | 0.57 | 5.28 |
| 2.64 | 0.53 | 2.84 | 0.58 | 0.86 | 0.80 | 1.43 | 1.43 | 2.74 | 0.56 | 5.20 | |||
| 56 | VCC 1049 | -16.92 | 1.37 | 0.89 | 1.33 | 0.97 | 1.26 | 1.26 | 1.88 | 1.88 | 1.34 | 0.96 | 1.11 |
| 1.30 | 0.70 | 1.28 | 0.77 | 1.03 | 1.03 | 1.66 | 1.66 | 1.27 | 0.77 | 1.24 | |||
| 57 | VCC 856 | -16.99 | 2.49 | 0.20 | 2.51 | 0.23 | 2.52 | 0.38 | 0.99 | 0.89 | 2.50 | 0.21 | 5.65 |
| 2.50 | 0.33 | 2.53 | 0.37 | 2.32 | 0.55 | 1.17 | 1.13 | 2.51 | 0.34 | 5.36 | |||
| 58 | VCC 140 | -16.94 | 2.29 | 0.44 | 3.11 | 0.49 | 0.70 | 0.69 | 1.30 | 1.30 | 3.23 | 0.49 | 4.39 |
| 2.33 | 0.46 | 3.94 | 0.51 | 0.71 | 0.71 | 1.33 | 1.33 | 4.16 | 0.51 | 4.37 | |||
| 59 | VCC 1355 | -16.98 | 2.85 | 0.43 | 3.43 | 0.48 | 0.71 | 0.68 | 1.29 | 1.29 | 2.79 | 0.42 | 5.99 |
| 3.00 | 0.56 | 4.13 | 0.62 | 0.85 | 0.85 | 1.48 | 1.48 | 2.78 | 0.53 | 5.65 | |||
| 60 | VCC 1087 | -16.92 | 2.96 | 0.47 | 3.64 | 0.52 | 0.74 | 0.73 | 1.34 | 1.34 | 3.01 | 0.47 | 6.13 |
| 2.85 | 0.49 | 3.44 | 0.55 | 0.76 | 0.76 | 1.38 | 1.38 | 2.88 | 0.50 | 5.87 | |||
| 61 | VCC 1297 | -16.82 | 1.31 | 1.00 | 1.26 | 1.09 | 1.28 | 1.39 | 1.99 | 1.99 | 0.83 | 1.30 | 0.43 |
| 1.44 | 1.00 | 1.41 | 1.09 | 1.32 | 1.39 | 1.99 | 1.99 | 1.14 | 1.30 | 0.76 | |||
| 62 | VCC 1861 | -16.79 | 2.21 | 0.34 | 2.23 | 0.38 | 2.52 | 0.56 | 1.14 | 1.14 | 2.22 | 0.37 | 4.53 |
| 2.20 | 0.34 | 2.22 | 0.38 | 1.01 | 0.56 | 1.15 | 1.15 | 2.21 | 0.37 | 4.52 | |||
| 63 | VCC 543 | -16.73 | 2.14 | 0.43 | 6.66 | 0.48 | 0.68 | 0.68 | 1.29 | 1.29 | 2.66 | 0.45 | 3.83 |
| 4.18 | 0.43 | 0.48 | 0.48 | 0.68 | 0.68 | 1.29 | 1.29 | 1.45 | 0.46 | 4.82 | |||
| 64 | VCC 1431 | -16.73 | 1.84 | 0.45 | 1.85 | 0.50 | 2.01 | 0.71 | 1.33 | 1.32 | 1.85 | 0.50 | 3.05 |
| 1.77 | 0.55 | 1.78 | 0.60 | 2.12 | 0.83 | 1.46 | 1.46 | 1.78 | 0.60 | 2.75 | |||
| 65 | VCC 1528 | -16.68 | 2.25 | 0.59 | 2.84 | 0.65 | 0.89 | 0.89 | 1.52 | 1.52 | 5.86 | 0.68 | 3.96 |
| 2.03 | 0.58 | 2.46 | 0.64 | 0.88 | 0.88 | 1.51 | 1.51 | 5.12 | 0.68 | 3.44 | |||
| 66 | VCC 1695 | -16.76 | 2.43 | 0.47 | 2.99 | 0.52 | 0.74 | 0.74 | 1.35 | 1.35 | 3.81 | 0.54 | 4.75 |
| 2.56 | 0.45 | 3.20 | 0.50 | 0.70 | 0.70 | 1.31 | 1.31 | 4.33 | 0.51 | 5.13 | |||
| 67 | VCC 1833 | -16.67 | 1.02 | 0.75 | 0.90 | 0.81 | 0.67 | 1.08 | 1.71 | 1.72 | 0.84 | 0.84 | 0.26 |
| 0.92 | 0.92 | 0.77 | 0.77 | 0.66 | 0.66 | 1.73 | 1.73 | 0.72 | 0.72 | -0.01 | |||
| 68 | VCC 437 | -16.77 | 2.46 | 0.69 | 2.69 | 0.75 | 1.01 | 1.01 | 1.65 | 1.65 | 2.45 | 0.67 | 4.46 |
| 2.44 | 0.72 | 2.76 | 0.79 | 1.05 | 1.05 | 1.69 | 1.69 | 2.42 | 0.70 | 4.30 | |||
| 69 | VCC 2019 | -16.72 | 2.90 | 0.43 | 2.99 | 0.47 | 1.14 | 0.67 | 1.28 | 1.28 | 2.93 | 0.45 | 6.18 |
| 3.05 | 0.59 | 3.20 | 0.64 | 0.93 | 0.88 | 1.51 | 1.51 | 3.06 | 0.59 | 5.93 | |||
| 70 | VCC 33 | -16.38 | 2.60 | 0.24 | 2.96 | 0.27 | 0.63 | 0.42 | 0.96 | 0.96 | 3.05 | 0.28 | 5.84 |
| 2.64 | 0.24 | 3.06 | 0.28 | 0.60 | 0.43 | 0.97 | 0.97 | 3.14 | 0.28 | 5.83 | |||
| 71 | VCC 200 | -16.75 | 2.35 | 0.65 | 2.17 | 0.71 | 1.00 | 0.97 | 1.60 | 1.60 | 2.35 | 0.69 | 3.82 |
| 2.29 | 0.70 | 2.65 | 0.76 | 1.02 | 1.02 | 1.66 | 1.66 | 2.80 | 0.73 | 3.39 | |||
| 72 | VCC 571 | -17.24 | 0.89 | 1.04 | 0.76 | 1.13 | 1.44 | 1.44 | 2.03 | 2.03 | 0.86 | 1.05 | 0.36 |
| 0.93 | 1.03 | 0.34 | 1.12 | 1.43 | 1.43 | 2.02 | 2.02 | 0.91 | 1.03 | 0.40 | |||
| 73 | VCC 21 | -16.76 | 0.93 | 0.34 | 0.81 | 0.39 | 0.54 | 0.56 | 1.15 | 1.15 | 1.00 | 0.31 | 1.17 |
| 0.88 | 0.41 | 0.72 | 0.46 | 0.60 | 0.65 | 1.25 | 1.25 | 0.99 | 0.37 | 1.04 | |||
| 74 | VCC 1488 | -16.38 | 2.26 | 0.25 | 2.92 | 0.29 | 0.44 | 0.44 | 0.99 | 0.99 | 4.62 | 0.30 | 4.94 |
| 1.65 | 0.23 | 1.75 | 0.27 | 0.42 | 0.42 | 0.95 | 0.95 | 1.79 | 0.27 | 3.53 | |||
| 75 | VCC 1779 | -16.13 | -0.02 | -0.03 | 0.40 | 1.53 | -0.02 | -1.37 | |||||
| -0.01 | -0.03 | 0.33 | 1.38 | -0.02 | -1.14 | ||||||||
| 76 | VCC 1895 | -16.17 | 2.34 | 0.30 | 3.34 | 0.34 | 0.52 | 0.51 | 1.08 | 1.08 | 3.79 | 0.35 | 4.87 |
| 2.36 | 0.29 | 3.52 | 0.32 | 0.49 | 0.49 | 1.05 | 1.05 | 3.94 | 0.34 | 4.89 | |||
| 77 | VCC 1499 | -16.28 | -0.00 | -0.01 | -0.19 | 1.33 | -0.01 | -1.28 | |||||
| -0.00 | -0.01 | -0.27 | 1.22 | -0.01 | -1.07 | ||||||||
| 78 | VCC 1545 | -16.34 | 1.95 | 0.92 | 2.18 | 1.01 | 1.31 | 1.31 | 1.92 | 1.92 | 2.09 | 0.99 | 2.50 |
| 2.01 | 0.98 | 2.63 | 1.07 | 1.37 | 1.37 | 1.97 | 1.97 | 2.37 | 1.06 | 2.48 | |||
| 79 | VCC 1192 | -16.15 | 2.00 | 1.05 | 1.99 | 1.14 | 2.01 | 1.44 | 2.03 | 2.03 | 2.00 | 1.17 | 1.90 |
| 1.92 | 1.04 | 1.92 | 1.13 | 1.91 | 1.44 | 2.03 | 2.03 | 1.92 | 1.17 | 1.70 | |||
| 80 | VCC 1857 | -16.13 | 1.00 | 0.15 | 0.94 | 0.18 | 0.61 | 0.31 | 0.31 | 0.79 | 1.02 | 0.14 | 0.66 |
| 1.07 | 0.30 | 1.03 | 0.34 | 0.79 | 0.50 | 0.20 | 1.07 | 1.08 | 0.28 | 0.39 | |||
| 81 | VCC 1075 | -16.09 | 2.75 | 0.34 | 2.98 | 0.38 | 0.69 | 0.56 | 1.14 | 1.14 | 2.80 | 0.36 | 6.07 |
| 2.70 | 0.46 | 3.23 | 0.50 | 0.71 | 0.71 | 1.32 | 1.32 | 2.72 | 0.46 | 5.59 | |||
| 82 | VCC 1948 | -16.15 | 1.02 | 0.34 | 0.94 | 0.39 | 0.52 | 0.56 | 1.12 | 1.15 | 1.00 | 0.36 | 0.86 |
| 1.05 | 0.42 | 0.99 | 0.47 | 0.59 | 0.67 | 1.25 | 1.27 | 1.04 | 0.43 | 0.64 | |||
| 83 | VCC 1627 | -15.97 | 2.02 | 0.52 | 1.98 | 0.57 | 1.85 | 0.79 | 1.92 | 1.41 | 1.92 | 0.65 | 3.51 |
| 1.99 | 0.81 | 2.00 | 0.89 | 1.92 | 1.17 | 1.87 | 1.80 | 1.98 | 1.03 | 2.42 | |||
| 84 | VCC 1440 | -15.95 | 2.13 | 1.11 | 2.14 | 1.20 | 1.55 | 1.51 | 2.09 | 2.09 | 2.14 | 1.24 | 2.35 |
| 2.15 | 1.15 | 2.17 | 1.25 | 1.56 | 1.56 | 2.13 | 2.13 | 2.18 | 1.29 | 2.33 | |||
| 85 | VCC 230 | -16.18 | 2.90 | 0.34 | 2.94 | 0.39 | 2.03 | 0.57 | 1.16 | 1.15 | 2.94 | 0.39 | 6.40 |
| 2.92 | 0.38 | 2.98 | 0.42 | 1.79 | 0.61 | 1.21 | 1.20 | 2.99 | 0.43 | 6.32 | |||
| 86 | VCC 2050 | -15.90 | 2.12 | 0.40 | 2.31 | 0.44 | 0.71 | 0.64 | 1.24 | 1.24 | 2.25 | 0.44 | 4.24 |
| 2.10 | 0.46 | 2.30 | 0.50 | 0.71 | 0.71 | 1.32 | 1.32 | 2.20 | 0.49 | 4.05 | |||
| 87 | VCC 1993 | -15.91 | 1.23 | 0.58 | 1.22 | 0.64 | 0.87 | 0.87 | 1.50 | 1.50 | 1.21 | 0.65 | 1.47 |
| 1.21 | 0.70 | 1.15 | 0.77 | 1.03 | 1.03 | 1.67 | 1.67 | 1.17 | 0.75 | 1.21 | |||
| 88 | VCC 751 | -15.83 | 2.20 | 0.74 | 2.43 | 0.81 | 1.10 | 1.08 | 1.72 | 1.72 | 2.42 | 0.81 | 3.49 |
| 2.37 | 0.89 | 4.39 | 0.97 | 1.26 | 1.26 | 1.88 | 1.88 | 2.71 | 0.93 | 3.48 | |||
| 89 | VCC 1828 | -15.97 | 2.48 | 0.48 | 2.68 | 0.53 | 0.78 | 0.74 | 1.36 | 1.36 | 2.51 | 0.50 | 4.99 |
| 2.43 | 0.58 | 2.73 | 0.63 | 0.87 | 0.87 | 1.50 | 1.50 | 2.45 | 0.59 | 4.61 | |||
| 90 | VCC 538 | -16.50 | 2.39 | 0.65 | 2.41 | 0.72 | 0.97 | 0.97 | 1.60 | 1.60 | 2.71 | 0.81 | 4.29 |
| 2.46 | 0.67 | 2.49 | 0.73 | 0.99 | 0.99 | 1.62 | 1.62 | 3.00 | 0.82 | 4.42 | |||
| 91 | VCC 1407 | -15.78 | 2.16 | 0.44 | 2.18 | 0.49 | 2.45 | 0.70 | 1.31 | 1.31 | 2.18 | 0.49 | 4.10 |
| 2.12 | 0.51 | 2.15 | 0.57 | 1.97 | 0.79 | 1.41 | 1.41 | 2.14 | 0.55 | 3.86 | |||
| 92 | VCC 1886 | -15.64 | 2.74 | 0.08 | 2.98 | 0.10 | 0.37 | 0.19 | 0.61 | 0.61 | 2.77 | 0.08 | 6.90 |
| 2.69 | 0.10 | 2.95 | 0.12 | 0.42 | 0.23 | 0.67 | 0.67 | 2.71 | 0.10 | 6.71 | |||
| 93 | VCC 1199 | -15.69 | 2.09 | 1.05 | 2.09 | 1.14 | 2.10 | 1.45 | 2.04 | 2.04 | 2.10 | 1.32 | 2.00 |
| 2.10 | 1.08 | 2.09 | 1.17 | 2.10 | 1.47 | 2.06 | 2.06 | 2.09 | 1.34 | 2.00 | |||
| 94 | VCC 1743 | -15.82 | 1.25 | 0.29 | 1.25 | 0.33 | 0.52 | 0.49 | 1.05 | 1.05 | 1.25 | 0.31 | 2.14 |
| 1.34 | 0.31 | 1.39 | 0.35 | 0.52 | 0.52 | 1.09 | 1.09 | 1.36 | 0.33 | 2.43 | |||
| 95 | VCC 1539 | -15.60 | 2.28 | 0.54 | 2.30 | 0.59 | 1.76 | 0.82 | 1.47 | 1.45 | 2.27 | 0.52 | 4.26 |
| 2.26 | 0.44 | 2.28 | 0.49 | 1.78 | 0.69 | 1.35 | 1.31 | 2.26 | 0.44 | 4.49 | |||
| 96 | VCC 1185 | -15.56 | 2.70 | 0.47 | 2.82 | 0.52 | 1.25 | 0.73 | 1.35 | 1.35 | 2.71 | 0.48 | 5.57 |
| 2.75 | 0.56 | 3.00 | 0.62 | 0.98 | 0.85 | 1.48 | 1.48 | 2.74 | 0.56 | 5.41 | |||
| 97 | VCC 1826 | -15.43 | 3.10 | 0.48 | 3.15 | 0.53 | 1.54 | 0.74 | 1.36 | 1.35 | 3.15 | 0.56 | 6.33 |
| 3.10 | 0.49 | 3.16 | 0.54 | 1.48 | 0.76 | 1.38 | 1.38 | 3.19 | 0.57 | 6.26 | |||
| 98 | VCC 1512 | -15.80 | |||||||||||
| 99 | VCC 1489 | -15.56 | 2.56 | 0.19 | 2.72 | 0.22 | 1.26 | 0.36 | 0.87 | 0.87 | 2.68 | 0.22 | 6.12 |
| 2.41 | 0.22 | 2.57 | 0.25 | 0.72 | 0.40 | 0.92 | 0.92 | 2.50 | 0.24 | 5.67 | |||
| 100 | VCC 1661 | -15.12 | 2.72 | 0.54 | 2.80 | 0.60 | 1.28 | 0.83 | 1.45 | 1.45 | 2.71 | 0.52 | 5.41 |
| 2.72 | 0.53 | 2.84 | 0.59 | 1.26 | 0.81 | 1.44 | 1.44 | 2.70 | 0.50 | 5.44 | |||
Note. — For each galaxy, the first row indicates the -band values and the second the -band values. Cols. (1) and (2) list, respectively, the ACSVCS identification number of each galaxy (Côté et al., 2004) and the Virgo Cluster Catalogue number (Binggeli et al., 1985). Col. (3) lists the absolute -band magnitudes of the galaxies, computed using apparent magnitudes from Binggeli et al. (1985), extinctions from Schlegel et al. (1998) (for the Landolt filter), and distances from Blakeslee et al. (2009). Cols. (4)-(8) are (where is in /pc3 and is in parsecs) at , , , and of each galaxy’s effective radius , and at (for comparison with G96 and L07). The left hand side of each column gives for the total profile, whereas the right side is obtained from the deprojection of the Sérsic component only, for those galaxies that are nucleated. Col. (10) denotes , which quantifies the extent to which a light deficit () or excess () exists in the inner region of a given galaxy. Note that we were not able to fit surface brightness profiles to a handful of ACSVCS galaxies due to the presence of dust and were thus unable to extract values for and for these.
| ID | Name | ||||||||||||
|---|---|---|---|---|---|---|---|---|---|---|---|---|---|
| (1) | (2) | (3) | (4) | (5) | (6) | (7) | (8) | (9) | |||||
| 1 | FCC 21 | -22.30 | 1.73 | 1.83 | 2.10 | 2.51 | 1.30 | -0.46 | |||||
| 1.75 | 1.85 | 2.12 | 2.52 | 1.25 | -0.64 | ||||||||
| 2 | FCC 213 | -21.05 | 0.57 | 0.54 | 2.13 | 2.58 | 1.01 | -2.10 | |||||
| 0.58 | 0.48 | 2.11 | 2.58 | 1.00 | -2.14 | ||||||||
| 3 | FCC 219 | -20.67 | 0.98 | 1.01 | 0.67 | 1.10 | 1.41 | 1.41 | 2.00 | 2.00 | 0.98 | 1.01 | 0.29 |
| 0.98 | 1.01 | 0.70 | 1.10 | 1.41 | 1.41 | 2.01 | 2.01 | 0.98 | 1.01 | 0.27 | |||
| 4 | NGC 1340 | -20.38 | 1.36 | 1.24 | 1.25 | 1.34 | 1.65 | 1.65 | 2.20 | 2.20 | 1.41 | 1.18 | 0.78 |
| 1.33 | 1.30 | 1.36 | 1.40 | 1.71 | 1.71 | 2.24 | 2.24 | 1.40 | 1.23 | 0.65 | |||
| 5 | FCC 167 | -20.41 | |||||||||||
| 6 | FCC 276 | -19.71 | 1.72 | 1.68 | 1.63 | 1.78 | 2.07 | 2.07 | 2.48 | 2.48 | 1.74 | 1.61 | 0.38 |
| 1.71 | 1.71 | 1.56 | 1.81 | 2.09 | 2.09 | 2.49 | 2.49 | 1.73 | 1.63 | 0.38 | |||
| 7 | FCC 147 | -19.62 | 1.61 | 1.53 | 1.63 | 1.63 | 1.93 | 1.93 | 2.39 | 2.39 | 1.65 | 1.48 | 0.86 |
| 1.56 | 1.56 | 1.66 | 1.66 | 1.96 | 1.96 | 2.41 | 2.41 | 1.53 | 1.52 | 0.78 | |||
| 8 | IC 2006 | -19.37 | 2.06 | 0.99 | 2.07 | 1.08 | 1.63 | 1.38 | 1.99 | 1.98 | 2.07 | 1.02 | 2.68 |
| 2.12 | 1.02 | 2.13 | 1.11 | 1.68 | 1.41 | 2.01 | 2.01 | 2.12 | 1.05 | 2.75 | |||
| 9 | FCC 83 | -19.18 | 1.65 | 1.40 | 1.57 | 1.50 | 1.81 | 1.81 | 2.31 | 2.31 | 1.65 | 1.40 | 0.96 |
| 1.68 | 1.51 | 1.63 | 1.62 | 1.92 | 1.92 | 2.38 | 2.38 | 1.69 | 1.50 | 0.64 | |||
| 10 | FCC 184 | -19.19 | 1.24 | 0.92 | 1.31 | 1.01 | 1.56 | 1.30 | 2.16 | 1.92 | 1.28 | 0.97 | 0.37 |
| 1.51 | 0.90 | 1.49 | 0.99 | 1.52 | 1.28 | 1.93 | 1.90 | 1.49 | 1.01 | 1.41 | |||
| 11 | FCC 63 | -18.83 | 1.73 | 1.45 | 1.70 | 1.55 | 1.86 | 1.86 | 2.34 | 2.34 | 1.72 | 1.50 | 0.89 |
| 1.68 | 1.55 | 1.62 | 1.66 | 1.95 | 1.95 | 2.41 | 2.41 | 1.66 | 1.61 | 0.52 | |||
| 12 | FCC 193 | -18.87 | 1.97 | 0.98 | 2.00 | 1.07 | 1.57 | 1.37 | 1.98 | 1.98 | 1.99 | 1.04 | 2.44 |
| 1.95 | 1.06 | 1.96 | 1.15 | 1.54 | 1.46 | 2.05 | 2.05 | 1.96 | 1.11 | 2.17 | |||
| 13 | FCC 170 | -18.76 | 1.90 | 0.69 | 1.91 | 0.75 | 1.86 | 1.01 | 1.68 | 1.65 | 1.92 | 0.80 | 2.77 |
| 1.85 | 0.69 | 1.86 | 0.76 | 1.81 | 1.02 | 1.68 | 1.65 | 1.87 | 0.81 | 2.59 | |||
| 14 | FCC 153 | -18.65 | 1.75 | 0.77 | 1.75 | 0.84 | 1.80 | 1.11 | 1.75 | 1.75 | 1.75 | 0.84 | 2.13 |
| 1.65 | 0.77 | 1.65 | 0.84 | 1.61 | 1.11 | 1.75 | 1.75 | 1.65 | 0.84 | 1.70 | |||
| 15 | FCC 177 | -18.37 | 2.66 | 0.44 | 2.74 | 0.48 | 1.46 | 0.67 | 1.93 | 1.24 | 2.68 | 0.45 | 6.40 |
| 2.63 | 0.44 | 2.73 | 0.48 | 1.36 | 0.67 | 1.79 | 1.23 | 2.67 | 0.46 | 6.15 | |||
| 16 | FCC 47 | -18.06 | 2.10 | 1.50 | 2.10 | 1.60 | 2.17 | 1.90 | 2.47 | 2.37 | 2.11 | 1.44 | 2.28 |
| 2.14 | 1.49 | 2.13 | 1.59 | 2.19 | 1.89 | 2.48 | 2.37 | 2.15 | 1.43 | 2.49 | |||
| 17 | FCC 43 | -18.04 | 3.96 | 0.80 | 0.87 | 0.87 | 1.15 | 1.15 | 1.78 | 1.78 | 4.08 | 0.78 | 4.41 |
| 3.85 | 0.79 | 0.86 | 0.86 | 1.14 | 1.14 | 1.77 | 1.77 | 3.99 | 0.77 | 4.25 | |||
| 18 | FCC 190 | -18.11 | 1.98 | 0.69 | 2.02 | 0.76 | 1.03 | 1.02 | 1.65 | 1.65 | 1.99 | 0.71 | 3.21 |
| 1.89 | 0.75 | 1.94 | 0.82 | 1.10 | 1.10 | 1.73 | 1.73 | 1.90 | 0.77 | 2.86 | |||
| 19 | FCC 310 | -18.04 | 1.77 | 0.79 | 1.73 | 0.86 | 1.65 | 1.14 | 1.96 | 1.77 | 1.78 | 0.76 | 2.83 |
| 1.83 | 0.77 | 1.78 | 0.84 | 1.68 | 1.12 | 1.96 | 1.75 | 1.84 | 0.74 | 3.07 | |||
| 20 | FCC 249 | -18.25 | 1.79 | 1.12 | 1.79 | 1.21 | 1.52 | 1.52 | 2.10 | 2.10 | 1.82 | 1.25 | 1.72 |
| 1.84 | 1.16 | 2.05 | 1.26 | 1.57 | 1.57 | 2.14 | 2.14 | 1.93 | 1.31 | 1.81 | |||
| 21 | FCC 148 | -17.96 | 2.49 | 0.87 | 2.42 | 0.96 | 2.05 | 1.25 | 2.02 | 1.87 | 2.46 | 0.91 | 4.31 |
| 2.42 | 0.87 | 2.37 | 0.96 | 1.95 | 1.25 | 1.93 | 1.87 | 2.40 | 0.91 | 3.94 | |||
| 22 | FCC 255 | -17.83 | 3.17 | 0.47 | 2.69 | 0.53 | 0.89 | 0.75 | 1.45 | 1.40 | 2.98 | 0.50 | 6.80 |
| 3.14 | 0.44 | 2.67 | 0.50 | 0.89 | 0.71 | 1.45 | 1.38 | 2.95 | 0.48 | 6.78 | |||
| 23 | FCC 277 | -17.82 | 1.98 | 0.60 | 2.06 | 0.66 | 1.15 | 0.91 | 1.54 | 1.54 | 2.09 | 0.67 | 3.42 |
| 1.98 | 0.65 | 2.06 | 0.72 | 1.11 | 0.97 | 1.61 | 1.61 | 2.08 | 0.73 | 3.29 | |||
| 24 | FCC 55 | -17.74 | 2.51 | 0.39 | 2.61 | 0.43 | 1.38 | 0.62 | 1.22 | 1.22 | 2.60 | 0.43 | 5.42 |
| 2.67 | 0.46 | 2.77 | 0.51 | 1.06 | 0.72 | 1.34 | 1.34 | 2.75 | 0.50 | 5.57 | |||
| 25 | FCC 152 | -17.30 | -0.02 | -0.03 | 0.42 | 1.03 | -0.03 | -0.60 | |||||
| -0.03 | -0.03 | 0.57 | 1.21 | -0.04 | -0.82 | ||||||||
| 26 | FCC 301 | -17.31 | 2.44 | 0.39 | 2.48 | 0.43 | 0.69 | 0.62 | 1.22 | 1.22 | 2.97 | 0.50 | 5.07 |
| 2.36 | 0.38 | 2.40 | 0.43 | 0.99 | 0.62 | 1.21 | 1.21 | 3.00 | 0.50 | 4.87 | |||
| 27 | FCC 335 | -17.30 | 2.41 | 0.15 | 2.43 | 0.18 | 4.62 | 0.31 | 0.79 | 0.79 | 2.44 | 0.19 | 5.80 |
| 2.56 | 0.16 | 2.59 | 0.19 | 1.45 | 0.31 | 0.80 | 0.80 | 2.60 | 0.19 | 6.22 | |||
| 28 | FCC 143 | -17.19 | 1.75 | 1.30 | 1.74 | 1.40 | 1.71 | 1.71 | 2.24 | 2.24 | 1.74 | 1.42 | 1.13 |
| 1.78 | 1.29 | 1.77 | 1.39 | 1.70 | 1.70 | 2.23 | 2.23 | 1.77 | 1.43 | 1.18 | |||
| 29 | FCC 95 | -16.94 | 2.55 | 0.69 | 3.38 | 0.76 | 1.02 | 1.02 | 1.65 | 1.65 | 2.85 | 0.74 | 4.61 |
| 5.46 | 0.81 | 0.89 | 0.88 | 1.16 | 1.16 | 1.79 | 1.79 | 2.05 | 0.84 | 5.42 | |||
| 30 | FCC 136 | -16.66 | 2.68 | 0.68 | 2.82 | 0.75 | 1.17 | 1.01 | 1.64 | 1.64 | 2.71 | 0.70 | 4.97 |
| 2.78 | 0.79 | 2.76 | 0.86 | 1.20 | 1.14 | 1.77 | 1.77 | 2.79 | 0.79 | 4.86 | |||
| 31 | FCC 182 | -16.61 | 2.31 | 0.72 | 2.55 | 0.79 | 1.08 | 1.05 | 1.69 | 1.69 | 2.44 | 0.81 | 3.68 |
| 2.01 | 0.69 | 2.51 | 0.76 | 1.02 | 1.02 | 1.65 | 1.65 | 4.23 | 0.80 | 3.19 | |||
| 32 | FCC 204 | -16.76 | 2.60 | 0.11 | 2.71 | 0.14 | 1.36 | 0.25 | 1.65 | 0.69 | 2.67 | 0.13 | 7.35 |
| 2.64 | 0.26 | 2.77 | 0.30 | 1.26 | 0.45 | 1.65 | 0.99 | 2.73 | 0.28 | 6.72 | |||
| 33 | FCC 119 | -16.60 | -0.03 | -0.03 | 0.46 | 1.06 | -0.04 | -0.64 | |||||
| -0.03 | -0.02 | 0.55 | 1.18 | -0.04 | -0.78 | ||||||||
| 34 | FCC 90 | -16.50 | 1.91 | 0.78 | 1.95 | 0.86 | 1.14 | 1.14 | 1.77 | 1.77 | 1.98 | 0.88 | 2.74 |
| 2.06 | 0.74 | 2.14 | 0.81 | 1.08 | 1.08 | 1.71 | 1.71 | 2.15 | 0.82 | 3.27 | |||
| 35 | FCC 26 | -16.56 | -0.02 | -0.04 | 0.49 | 1.36 | -0.05 | -1.11 | |||||
| -0.02 | -0.04 | 0.51 | 1.25 | -0.04 | -0.93 | ||||||||
| 36 | FCC 106 | -16.44 | 2.40 | 0.68 | 2.52 | 0.74 | 1.07 | 1.00 | 1.64 | 1.64 | 2.64 | 0.77 | 4.30 |
| 2.44 | 0.74 | 2.59 | 0.81 | 1.09 | 1.08 | 1.72 | 1.72 | 2.75 | 0.84 | 4.22 | |||
| 37 | FCC 19 | -16.42 | 2.75 | 0.26 | 2.82 | 0.30 | 0.95 | 0.45 | 1.00 | 1.00 | 2.80 | 0.29 | 6.47 |
| 2.82 | 0.36 | 3.07 | 0.40 | 0.60 | 0.58 | 1.17 | 1.17 | 2.89 | 0.38 | 6.40 | |||
| 38 | FCC 202 | -16.27 | 2.59 | 0.45 | 2.70 | 0.50 | 1.07 | 0.71 | 1.32 | 1.32 | 2.68 | 0.50 | 5.44 |
| 2.56 | 0.40 | 2.65 | 0.45 | 1.15 | 0.65 | 1.24 | 1.24 | 2.70 | 0.46 | 5.48 | |||
| 39 | FCC 324 | -16.25 | 2.79 | 0.26 | 3.34 | 0.30 | 0.54 | 0.46 | 1.01 | 1.01 | 2.96 | 0.28 | 6.36 |
| 2.73 | 0.28 | 7.05 | 0.32 | 0.48 | 0.48 | 1.04 | 1.04 | 2.91 | 0.29 | 6.19 | |||
| 40 | FCC 288 | -16.30 | 2.31 | 0.25 | 2.34 | 0.29 | 0.50 | 0.44 | 0.98 | 0.98 | 2.35 | 0.29 | 5.34 |
| 2.30 | 0.21 | 2.35 | 0.25 | 0.77 | 0.39 | 0.91 | 0.91 | 2.37 | 0.25 | 5.48 | |||
| 41 | FCC 303 | -16.02 | 2.72 | 0.35 | 2.75 | 0.39 | 2.68 | 0.57 | 1.16 | 1.15 | 2.73 | 0.37 | 6.03 |
| 2.72 | 0.48 | 2.78 | 0.53 | 1.88 | 0.74 | 1.36 | 1.36 | 2.72 | 0.49 | 5.70 | |||
| 42 | FCC 203 | -16.13 | 2.56 | 0.37 | 2.76 | 0.42 | 0.71 | 0.60 | 1.19 | 1.19 | 2.66 | 0.40 | 5.65 |
| 2.62 | 0.42 | 3.08 | 0.47 | 0.71 | 0.67 | 1.27 | 1.27 | 2.82 | 0.45 | 5.62 | |||
| 43 | FCC 100 | -16.13 | 2.65 | 0.32 | 2.72 | 0.36 | 0.72 | 0.53 | 1.11 | 1.11 | 2.66 | 0.33 | 6.08 |
| 2.62 | 0.28 | 2.70 | 0.32 | 0.76 | 0.48 | 1.04 | 1.04 | 2.64 | 0.29 | 6.15 | |||
Note. — For each galaxy, the first row indicates the -band values and the second the -band values. Cols. (1) and (2) list, respectively, the ACSFCS identification number of each galaxy (Côté et al., 2004) and the Fornax Cluster Catalogue number (Ferguson, 1989). Col. (3) lists the absolute -band magnitudes of the galaxies, computed using apparent magnitudes from NED, extinctions from Schlegel et al. (1998) (for the Landolt filter), and distances from Blakeslee et al. (2009). Cols. (4)-(8) are (where is in /pc3 and is in parsecs) at , , , and of each galaxy’s effective radius , and at (for comparison with G96 and L07). The left hand side of each column gives for the total profile, whereas the right side is obtained from the profile deprojected without the fit to the nucleus, for those galaxies that are nucleated. Col. (10) denotes , which quantifies the extent to which a light deficit () or excess () exists in the inner region of a given galaxy. Note that we were not able to fit surface brightness profiles to FCC 167 due to the presence of dust and were thus unable to extract values for and for this galaxy.
References
- Bekki et al. (2001) Bekki, K., Couch, W. J., & Drinkwater, M. J. 2001, ApJ, 552, L105
- Bender et al. (1989) Bender, R., Surma, P., Doebereiner, S., Moellenhoff, C., & Madejsky, R. 1989, A&A, 217, 35
- Binggeli et al. (1985) Binggeli, B., Sandage, A., & Tammann, G. A. 1985, AJ, 90, 1681
- Binney & Tremaine (1987) Binney, J. & Tremaine, S. 1987, Galactic dynamics (Princeton, NJ, Princeton University Press, 1987, 747 p.)
- Blakeslee et al. (2009) Blakeslee, J. P., Jordán, A., Mei, S., Côté, P., Ferrarese, L., Infante, L., Peng, E. W., Tonry, J. L., & West, M. J. 2009, ApJ, 694, 556
- Böker (2007) Böker, T. 2007, ArXiv e-prints 0708.1093
- Caon et al. (1993) Caon, N., Capaccioli, M., & D’Onofrio, M. 1993, MNRAS, 265, 1013
- Chilingarian et al. (2009a) Chilingarian, I., Cayatte, V., Revaz, Y., Dodonov, S., Durand, D., Durret, F., Micol, A., & Slezak, E. 2009a, Science, 326, 1379
- Chilingarian et al. (2009b) Chilingarian, I. V., Novikova, A. P., Cayatte, V., Combes, F., Di Matteo, P., & Zasov, A. V. 2009b, A&A, 504, 389
- Cleveland & McGill (1984) Cleveland, W. S. & McGill, R. 1984, Journal of the American Statistical Association, 79, 807
- Côté et al. (2004) Côté, P., Blakeslee, J. P., Ferrarese, L., Jordán, A., Mei, S., Merritt, D., Milosavljević, M., Peng, E. W., Tonry, J. L., & West, M. J. 2004, ApJS, 153, 223
- Côté et al. (2007) Côté, P., Ferrarese, L., Jordán, A., Blakeslee, J. P., Chen, C.-W., Infante, L., Merritt, D., Mei, S., Peng, E. W., Tonry, J. L., West, A. A., & West, M. J. 2007, ApJ, 671, 1456
- Côté et al. (2006) Côté, P., Piatek, S., Ferrarese, L., Jordán, A., Merritt, D., Peng, E. W., Haşegan, M., Blakeslee, J. P., Mei, S., West, M. J., Milosavljević, M., & Tonry, J. L. 2006, ApJS, 165, 57
- de Vaucouleurs et al. (1991) de Vaucouleurs, G., de Vaucouleurs, A., Corwin, Jr., H. G., Buta, R. J., Paturel, G., & Fouque, P. 1991, Third Reference Catalogue of Bright Galaxies (Springer-Verlag, New York)
- Dehnen (1993) Dehnen, W. 1993, MNRAS, 265, 250
- Ebisuzaki et al. (1991) Ebisuzaki, T., Makino, J., & Okumura, S. K. 1991, Nature, 354, 212
- Emsellem et al. (2007) Emsellem, E., Cappellari, M., Krajnović, D., van de Ven, G., Bacon, R., Bureau, M., Davies, R. L., de Zeeuw, P. T., Falcón-Barroso, J., Kuntschner, H., McDermid, R., Peletier, R. F., & Sarzi, M. 2007, MNRAS, 379, 401
- Emsellem & van de Ven (2008) Emsellem, E. & van de Ven, G. 2008, ApJ, 674, 653
- Faber (1973) Faber, S. M. 1973, ApJ, 179, 423
- Faber et al. (1997) Faber, S. M., Tremaine, S., Ajhar, E. A., Byun, Y.-I., Dressler, A., Gebhardt, K., Grillmair, C., Kormendy, J., Lauer, T. R., & Richstone, D. 1997, AJ, 114, 1771
- Ferguson (1989) Ferguson, H. C. 1989, AJ, 98, 367
- Ferrarese et al. (2006a) Ferrarese, L., Cote, P., Blakeslee, J. P., Mei, S., Merritt, D., & West, M. J. 2006a, ArXiv e-prints: astro-ph/0612139
- Ferrarese et al. (2006b) Ferrarese, L., Côté, P., Jordán, A., Peng, E. W., Blakeslee, J. P., Piatek, S., Mei, S., Merritt, D., Milosavljević, M., Tonry, J. L., & West, M. J. 2006b, ApJS, 164, 334
- Ferrarese et al. (1994) Ferrarese, L., van den Bosch, F. C., Ford, H. C., Jaffe, W., & O’Connell, R. W. 1994, AJ, 108, 1598
- Gebhardt et al. (1996) Gebhardt, K., Richstone, D., Ajhar, E. A., Lauer, T. R., Byun, Y.-I., Kormendy, J., Dressler, A., Faber, S. M., Grillmair, C., & Tremaine, S. 1996, AJ, 112, 105
- Gerbal et al. (1997) Gerbal, D., Lima Neto, G. B., Marquez, I., & Verhagen, H. 1997, MNRAS, 285, L41
- Graham & Driver (2005) Graham, A. W. & Driver, S. P. 2005, Publications of the Astronomical Society of Australia, 22, 118
- Graham et al. (2003) Graham, A. W., Erwin, P., Trujillo, I., & Asensio Ramos, A. 2003, AJ, 125, 2951
- Gualandris & Merritt (2008) Gualandris, A. & Merritt, D. 2008, ApJ, 678, 780
- Hjorth & Madsen (1995) Hjorth, J. & Madsen, J. 1995, ApJ, 445, 55
- Hopkins et al. (2009a) Hopkins, P. F., Cox, T. J., Dutta, S. N., Hernquist, L., Kormendy, J., & Lauer, T. R. 2009a, ApJS, 181, 135
- Hopkins et al. (2008) Hopkins, P. F., Hernquist, L., Cox, T. J., Dutta, S. N., & Rothberg, B. 2008, ApJ, 679, 156
- Hopkins et al. (2009b) Hopkins, P. F., Lauer, T. R., Cox, T. J., Hernquist, L., & Kormendy, J. 2009b, ApJS, 181, 486
- Izenman (1991) Izenman, A. J. 1991, Journal of the American Statistical Association, 86, 205
- Jordán et al. (2007) Jordán, A., Blakeslee, J. P., Côté, P., Ferrarese, L., Infante, L., Mei, S., Merritt, D., Peng, E. W., Tonry, J. L., & West, M. J. 2007, ApJS, 169, 213
- Kormendy (1985) Kormendy, J. 1985, ApJ, 295, 73
- Kormendy (1999) Kormendy, J. 1999, in Astronomical Society of the Pacific Conference Series, Vol. 182, Galaxy Dynamics - A Rutgers Symposium, ed. D. R. Merritt, M. Valluri, & J. A. Sellwood, 124–+
- Kormendy & Djorgovski (1989) Kormendy, J. & Djorgovski, S. 1989, ARA&A, 27, 235
- Kormendy et al. (2009) Kormendy, J., Fisher, D. B., Cornell, M. E., & Bender, R. 2009, ApJS, 182, 216
- Lauer et al. (1995) Lauer, T. R., Ajhar, E. A., Byun, Y.-I., Dressler, A., Faber, S. M., Grillmair, C., Kormendy, J., Richstone, D., & Tremaine, S. 1995, AJ, 110, 2622
- Lauer et al. (2007) Lauer, T. R., Gebhardt, K., Faber, S. M., Richstone, D., Tremaine, S., Kormendy, J., Aller, M. C., Bender, R., Dressler, A., Filippenko, A. V., Green, R., & Ho, L. C. 2007, ApJ, 664, 226
- Lima Neto et al. (1999) Lima Neto, G. B., Gerbal, D., & Márquez, I. 1999, MNRAS, 309, 481
- Londrillo (2006) Londrillo, P. 2006, Nuclear Instruments and Methods in Physics Research A, 561, 180
- Márquez et al. (2000) Márquez, I., Lima Neto, G. B., Capelato, H., Durret, F., & Gerbal, D. 2000, A&A, 353, 873
- Márquez et al. (2001) Márquez, I., Lima Neto, G. B., Capelato, H., Durret, F., Lanzoni, B., & Gerbal, D. 2001, A&A, 379, 767
- Mei et al. (2007) Mei, S., Blakeslee, J. P., Côté, P., Tonry, J. L., West, M. J., Ferrarese, L., Jordán, A., Peng, E. W., Anthony, A., & Merritt, D. 2007, ApJ, 655, 144
- Merritt & Fridman (1996) Merritt, D. & Fridman, T. 1996, ApJ, 460, 136
- Mihos & Hernquist (1994) Mihos, J. C. & Hernquist, L. 1994, ApJ, 437, L47
- Peng et al. (2008) Peng, E. W., Jordán, A., Côté, P., Takamiya, M., West, M. J., Blakeslee, J. P., Chen, C., Ferrarese, L., Mei, S., Tonry, J. L., & West, A. A. 2008, ApJ, 681, 197
- Ravindranath et al. (2001) Ravindranath, S., Ho, L. C., Peng, C. Y., Filippenko, A. V., & Sargent, W. L. W. 2001, AJ, 122, 653
- Rest et al. (2001) Rest, A., van den Bosch, F. C., Jaffe, W., Tran, H., Tsvetanov, Z., Ford, H. C., Davies, J., & Schafer, J. 2001, AJ, 121, 2431
- Rossa et al. (2006) Rossa, J., van der Marel, R. P., Böker, T., Gerssen, J., Ho, L. C., Rix, H.-W., Shields, J. C., & Walcher, C.-J. 2006, AJ, 132, 1074
- Schlegel et al. (1998) Schlegel, D. J., Finkbeiner, D. P., & Davis, M. 1998, ApJ, 500, 525
- Sérsic (1963) Sérsic, J. L. 1963, Boletin de la Asociacion Argentina de Astronomia La Plata Argentina, 6, 41
- Sérsic (1968) Sérsic, J. L. 1968, Atlas de galaxias australes (Cordoba, Argentina: Observatorio Astronomico, 1968)
- Tremaine (1976) Tremaine, S. D. 1976, ApJ, 203, 345
- Tremaine et al. (1975) Tremaine, S. D., Ostriker, J. P., & Spitzer, Jr., L. 1975, ApJ, 196, 407
- Trujillo et al. (2004) Trujillo, I., Erwin, P., Asensio Ramos, A., & Graham, A. W. 2004, AJ, 127, 1917