The LABOCA survey of the Extended Chandra Deep Field South – radio and mid-infrared counterparts to submillimetre galaxies
Abstract
We present radio and infrared (3.6–24-m) counterparts to submillimetre galaxies (SMGs) detected in the Extended Chandra Deep Field South with the LABOCA 870-m bolometer camera on the 12-m Atacama Pathfinder Experiment. Using the Very Large Array at 1.4 GHz and Spitzer we have identified secure counterparts to 79 of the 126 SMGs (SNR3.7, mJy) in the field, 62 via their radio and/or 24-m emission, the remainder using a colour-flux cut on IRAC 3.6- and 5.8-m sources chosen to maximise the number of secure, coincident radio and 24-m counterparts. In constructing our radio catalogue, we have corrected for the effects of ‘flux boosting’, then used the corrected flux densities to estimate the redshifts of the SMGs based on the radio/submm spectral indices. The effect of the boosting correction is to increase the median redshift by 0.2 resulting in a value of (1- errors) for the secure radio counterparts, in agreement with other studies, both spectroscopic and photometric.
keywords:
galaxies: starburst – galaxies: formation – cosmology: observations – cosmology: early Universe1 Introduction
Although rare today, ultraluminous infrared galaxies (ULIRGs) – galaxies with infrared (IR) luminosities exceeding L⊙ – were extremely common in the early Universe, signposting systems undergoing intense, dust-obscured star formation. Moreover, they contribute a significant fraction of the submillimetre (submm) background (Fixsen et al., 1998). This important high-redshift population was first discovered in the form of bright submm sources behind massive, lensing clusters (Smail, Ivison & Blain, 1997), and in blank fields (e.g. Hughes et al., 1998; Barger et al., 1998; Eales et al., 1999), using the Submm Common User Bolometer Array (SCUBA; Holland et al., 1999) on the 15-m James Clerk Maxwell Telescope (JCMT); a number of surveys with a variety of instruments have now brought the number of known submm galaxies (SMGs) to several hundred (e.g. Coppin et al., 2006; Bertoldi et al., 2007; Greve et al., 2008; Scott et al., 2008).
Cross-identifying the submm sources with emission at other wavelengths is made difficult by the poor spatial resolution of even the largest submm telescopes. For example, the combination of JCMT and SCUBA resulted in a resolution of 14 arcsecond (arcsec; fwhm) at 850 m. The best way to overcome this would be with mm/submm interferometric observations – capable of locating the submm emission directly, with arcsec accuracy (e.g. Downes et al., 1999; Gear et al., 2000; Iono et al., 2006; Wang et al., 2007; Younger et al., 2007; Ivison et al., 2008; Cowie et al., 2009). Such observations, however, require a large investment of observing time with the few existing facilities that are capable, although the advent of the Atacama Large Millimeter/Submillimeter Array (ALMA) will make this strategy much easier in the future.
In the meantime, attaining higher resolution is possible using radio interferometric and IR observations, where the empirical correlations between the far-IR and radio wavebands (Condon, 1992) or the bolometric IR/mid-IR (Elbaz et al., 2002) make it much easier to identify the submm emitter, particularly given the low source densities in the radio (Ivison et al., 1998, 2000, 2002; Smail et al., 2000; Dannerbauer et al., 2004). This work has typically relied on data from the Very Large Array (VLA) at 1.4 GHz and Spitzer using the 24-m channel of the MIPS instrument (Werner et al., 2004; Rieke et al., 2004). In addition, high-redshift SMGs can be identified through their IR colours as measured by Spitzer’s IRAC camera (e.g. Pope et al., 2006).
Here we present radio, mid-IR (24-m) and IRAC counterparts to the 126 SMGs that have been detected in the Large APEX Bolometer Camera (LABOCA) Extended Chandra Deep Field South [ECDFS] Submm Survey (LESS), a deep blank-field 870-m survey, down to a 3.7- limit of 4.4 mJy (Weiß et al., 2009). The ECDFS is an exceptional area for multi-wavelength, wide-field studies of galaxy evolution due to deep X-ray (Giacconi et al., 2001; Lehmer et al., 2005; Luo et al., 2008), optical (Giavalisco et al., 2004; Beckwith et al., 2006), IR (Dickinson et al., in preparation) and radio (Miller et al., 2008; Ivison et al., 2010) data. The CDFS portion of the field has also been surveyed (Scott et al., 2010) with the AzTEC 1.1-mm bolometric camera (Wilson et al., 2008) on the Atacama Submillimeter Telescope Experiment.
The paper is organised as follows: in Section 2 we describe the submm, radio, 24-m and IRAC data that have been used to identify counterparts to the submm sources, with particular emphasis on the techniques used to extract source fluxes and positions from the radio map. Section 3 contains details of our counterpart identification strategy and in Sections 4 and 5 we present lists of the likely counterparts and their properties. Section 6 discusses these results in detail, ascertaining the effectiveness of our strategy. We also derive the redshift distribution of the radio-detected robust counterparts using the radio-submm spectral index relation of Carilli & Yun (1999, 2000) before drawing our conclusions in Section 7. In an appendix we present detailed notes on some of the sources as well as multi-wavelength maps with the counterparts marked.
We assume a flat CDM cosmology of , and km s-1 Mpc-1 (Hinshaw et al., 2009).
2 Observations, Reduction and analysis
2.1 APEX 870-m catalogue
LABOCA (Siringo et al., 2009) is a 295-element bolometer camera operating at the 12-m Atacama Pathfinder Telescope (APEX111This publication is based on data acquired with the Atacama Pathfinder Experiment (APEX) under program IDs 078.F-9028(A), 079.F-9500(A), 080.A-3023(A) and 081.F-9500(A). APEX is a collaboration between the Max–Planck–Institut fur Radioastronomie, the European Southern Observatory and the Onsala Space Observatory.) in the exceptionally dry environment of the Atacama desert in Chile (Güsten et al., 2006). The LESS map comprises 200 hr of on-sky integration (excluding overheads) and has extremely uniform noise coverage (average rms = 1.2 mJy beam-1) over the -arcmin2 extent of the ECDFS, with a resolution of 19 arcsec (fwhm). The catalogue of submm sources identified by LESS is described in detail by Weiß et al. (2009). The full catalogue comprises 126 sources above 3.7- with a false-detection expectation of 5. This is based on extensive simulations as described in Weiß et al. (2009).
2.2 VLA 1.4-GHz catalogue
To identify the radio counterparts to the LESS SMGs we use the VLA 1.4-GHz map of Miller et al. (2008) which we briefly describe here. The map is constructed from six separate pointings arranged in a hexagonal pattern, centred on the coordinates (J2000). Each pointing consists of approximately eight separate 5-hr observations. The noise in the final -arcmin2 mosaic is 6.5Jy beam-1 at its deepest. All data were taken in ‘A’ configuration, resulting in a synthesised beam with dimensions arcsec2, aligned north–south. When looking for radio counterparts to the SMGs, we do not use the Miller et al. (2008) catalogue as this is truncated at a signal-to-noise ratio (SNR) of seven; instead, we have created our own catalogue containing sources down to a SNR of three.
Seven of the SMGs in the LESS catalogue lie outside the -arcmin2 area of the radio map. For these, we use our own reduction of the VLA data to search for counterparts. Our map was created in a similar fashion to that of Miller et al. (2008) and achieves an r.m.s. just below 7Jy beam-1. The flux density of the brightest of the SMG counterparts has a flux density in the two maps that differs by less than one per cent and thus we are confident that the two maps are tied to the same flux scale.
2.2.1 Source extraction
The first step in producing a catalogue of radio sources is to create a map of the noise across the field. Sources with a peak-flux-density-to-noise ratio (PNR) greater than five are detected and removed using the standard aips source-extraction code, sad. The residual image is then inverted and the source extraction process repeated in order to remove ‘sources’ with negative flux – mainly prominent sidelobes caused by Gibbs ringing (associated with high-SNR sources) which become increasingly prominent with distance from the phase centre of each pointing. Once all significant sources have been removed, a noise map is created for each pixel by fitting a Gaussian to the histogram of pixel values contained within a surrounding circle of diameter 50 arcsec (using rmsd with optype = ‘hist’). Aided by the accurate noise map, we start the source extraction again, this time restricting the fitting to positive sources with a PNR equal to or greater than three.
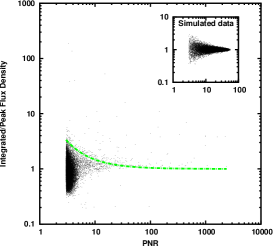
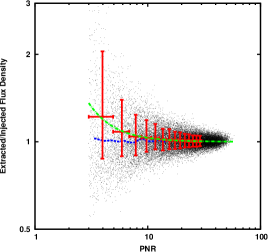
To improve the accuracy of our extracted flux densities, we extract sources in two ways. In the vast majority of cases we assume that the source is unresolved and fix the size of the fitted Gaussian to that of the restoring beam. For those sources that are significantly resolved we instead allow the size of the Gaussian to vary. The reason for this approach is that allowing the size of unresolved sources to vary often produces cases where the peak flux density is greater than the total, a consequence of its measured size being smaller than the beam. The result is that the measured flux densities are less accurate than if their sizes had been held fixed at the width of the restoring beam. We have simulated this effect by injecting multiple point sources into our residual map and extracting them, as with the real map, first with the source size unconstrained, then again with the size fixed to that of the beam. The scatter in the ratio of injected and extracted flux densities was significantly reduced in the latter case (see also Ibar et al., 2009). In all the radio source simulations described in this section, we created 50 fake maps, each containing 500 sources, i.e. a total of 25 000 sources.
In order to use this approach it is obviously necessary to decide which sources are unresolved and which are resolved. We do this in the following way. When the source size is allowed to vary, the uncertainties in the fitting process cause the ratio of peak to total flux density to increase from unity as often (and by as much) as it decreases; this symmetry is illustrated using our simulated data in the inset of Fig. 1. Each point represents a source injected with the same size as the synthesised beam, but which has increased or decreased in size upon being extracted. The envelope of this plot locates sources in the real data which are inherently unresolved and which should be fitted as such, yielding a more accurate flux density. A similar approach was adopted by Bondi et al. (2003), but using the observed data only and not simulations. Fig. 1 also shows the envelope (containing 98 per cent of the simulated sources) plotted over the real data. Those sources lying above the upper envelope are fitted using a variable width; all other sources are constrained to be point sources.
2.2.2 Bias correction
We have also studied the effects of biases in the model fitting by comparing the fluxes that we recover from our simulations to those that were injected. A plot of this flux density ratio against PNR (calculated based on the recovered peak flux, a measure against which we can correct our data) is also shown in the right panel of Fig. 1 (lower line) – we find that the median value is close to unity, independent of PNR i.e. there is no bias in the measured flux densities. This is in contrast to the findings of Seymour et al. (2004), who find a significant positive bias. This is because Seymour et al. plot their flux ratios as a function of input flux density, a quantity which is unknown in the real radio data and which is biased towards sources whose flux densities have increased due to the model-fitting uncertainties.
2.2.3 Flux boosting
‘Flux boosting’ is an effect regularly taken into account when estimating the flux densities of SMGs (e.g. Coppin et al., 2006; Austermann et al., 2009; Weiß et al., 2009), but very rarely with radio sources. The apparent flux density of such a source deviates from its true value if it sits on/in a noise peak/trough. Because faint sources are more numerous than bright ones, the measured flux density of a catalogued source (i.e. a source lying above the chosen SNR threshold) is more likely to have been boosted than reduced. The most likely flux density is produced by ‘deboosting’ the measured flux densities by the appropriate factor.
We have measured the magnitude of the flux boosting as a function of recovered peak flux density by using the same simulations that were used to investigate the biases in the model fitting. These were performed using equal numbers of sources per flux density bin and therefore do not show the effects of flux boosting (the dots in the right panel of Fig. 1). The source counts can however be added retrospectively by defining flux density bins and again forming a median, but this time weighting each point (source) in a bin by its differential source count (). Using our catalogue, we measured a Euclidean slope for the source counts, based on sources above a flux density of 100 Jy. This should be valid for all sources fainter than this limit as extremely deep radio observations have shown that there is no change in the slope of the counts down to flux densities as low as 15 Jy (Owen & Morrison, 2008). The bins and the value of the flux boosting correction in each are overplotted on the unweighted data in the right panel of Fig. 1 as red points with errorbars; the flux boosting at any value of PNR is calculated by fitting a function to these points (also shown in the figure). For a 3- source the flux boosting is equal to 36 per cent.
2.3 Spitzer MIPS catalogues
The 24-m data are taken from FIDEL, the Far-Infrared Deep Extragalactic Legacy Survey (Dickinson et al., in preparation), a programme to map the ECDFS (as well as the Extended Groth Strip and GOODS-N) at 24 m using the MIPS camera on board Spitzer. The FIDEL MIPS data were reduced following the procedures given in Chary et al. (2004), Frayer et al. (2006) and Frayer et al. (2009). The final image depth at 24 m varies across the field, with typical exposure times ranging from 11 000 to 30 000 s (with a maximum of approximately 36 000 s). The 24-m image almost completely covers the area mapped by LABOCA and only one submm source (LESS046) falls off its edge.
For the counterpart analysis, we have used a catalogue produced by the daophot package from iraf; the source extraction was not guided by information on positions from other wavelengths. Examination of the differential number counts in the 24 m data show that these turn over at 30 Jy due to incompleteness; thus we have not considered sources with fluxes lower than this. The flux errors reported by the daophot software are gross underestimates, but simulations have shown that the values of SNR reported by the apex point-source extraction software specifically developed for Spitzer (Makovoz et al., 2002) are accurate. Although we have not used the apex catalogue for our counterpart analysis (it does not go as deep as that produced using daophot), matching sources from the two catalogues to within 1 arcsec shows that the apex SNR and daophot flux/flux measurements are linearly related and that the latter need to be multiplied by a factor of three; the simulations also showed that the flux measurements from each catalogue were consistent.
2.4 Spitzer IRAC catalogues
The Spitzer Infrared Array Camera (IRAC; Fazio et al., 2004) images are taken from the Spitzer IRAC and MUSYC Public Legacy in ECDFS (SIMPLE) survey (Damen et al., in preparation). We use SExtractor (Bertin & Arnouts, 1996) to extract source positions on a summed image of all four IRAC channels, weighted such that a source of a given magnitude in each image is equally represented. The areas within 15 arcsec of each LESS source were checked visually to ensure the catalogues were complete. We then use apphot in iraf to extract fluxes in 3.8-arcsec diameter apertures on the 3.6-m and 5.8-m images, and apply aperture corrections as derived by the SWIRE team (Surace et al., 2005) to obtain total source magnitudes.
3 Identifying counterparts to SMGs
Following several other authors (e.g. Ivison et al., 2002, 2007; Pope et al., 2006; Chapin et al., 2009) we have identified the most likely radio and 24-m counterparts to the LESS sources by calculating the corrected Poissonian probability (Browne & Cohen, 1978; Downes et al., 1986) of radio and 24-m sources that lie within a search radius, , of each SMG. Given a potential counterpart at radius, , with flux density, , we can calculate the a priori probability, , of finding at least one object within that radius of at least that flux density from the expected number of events
| (1) |
where is the surface density of sources with fluxes . The probability is
| (2) |
However, as the search is being conducted over the (generally) larger radius , this is not the probability we require, i.e. searching at random locations will find more sources as extreme as the one found than would be expected given its measured probability, . Having found a source of probability , at radius , we need to know the number of similar events that would be found in our random search out to . Provided that , this is given by
| (3) |
where the so-called critical probability is defined as
| (4) |
and is the source surface density at our lowest detectable flux density222The critical probability corresponds to finding the faintest possible source at the largest possible distance. By definition, there is no possibility of finding other sources that are at least as probable anywhere else within and so such sources do not require a correction factor, i.e. the factor in square brackets in Equation 3 is unity.. The final probability of a counterpart being a chance coincidence is calculated by inserting the corrected number of events () into Equation 2 in place of . As has been typical in the literature (Ivison et al., 2002, 2007; Pope et al., 2006; Chapin et al., 2009) we take a value of to indicate a secure association.

Offsets between the SMG and radio/24-m sources will be dominated by the uncertainty in the SMG positions, this being a function of the SNR of the submm detection. Therefore, in contrast to some studies of this type that use a search radius based on some representative SNR, we have chosen a different search radius for each SMG that is some multiple of its 1- positional uncertainty in Right Ascension/Declination (1–3 arcsec); Smail et al. (2000) similarly used a SNR-dependent search radius. Effects such as telescope pointing errors might conspire to produce systematic offsets between the submm source and its counterpart, but as the final map is an average of multiple observations taken at different times, any such systematic offsets are minimal. Greve et al. (2010) come to the same conclusion from a stacking analysis of the LESS data which confirms the absolute astrometry of the submm map.
In choosing a value for , our over-riding concern has been to make it large enough to avoid missing significant numbers of counterparts, but small enough to avoid choosing counterparts from unrelated, bright field sources; too large a radius also over-estimates the value of . A reasonable maximum value for is 3 as this will ensure that we only miss the counterpart for one per cent of the SMGs333From the cumulative distribution function (CDF) of the Rayleigh distribution, , where . i.e. 1.3 sources. The number of SMGs with missed counterparts is plotted in Fig. 2 over a wide function of radius, 0 to 5 . Also plotted in Fig. 2 are the numbers of secure counterparts found as a function of radius for both the radio and 24-m catalogues. Both rise steeply between 0 and 2 and gently decline above 3 . We have therefore set our search radius to .
We have also used Monte Carlo simulations to investigate the effect of varying the search radius, producing 100 realisations of the SMG catalogue at radii between 0 and 5 in steps of 0.5 and searching for secure counterparts in the same way as with the real data. Each simulated catalogue has the same distribution of flux densities, and therefore search radii, as the real catalogue, but with randomised positions. The results are again shown in Fig. 2 and illustrate that the number of false detections is approximately constant beyond 1.5 .
The positional errors for each SMG have been determined using the simulated source extractions of Weiß et al. (2009). This offers advantages over analytical formulae such as Equation B22 of Ivison et al. (2007) in that it includes all sources of uncertainty, including those originating in the data reduction and source extraction processes. The empirical formula for the positional uncertainties is
| (5) |
where , , and is the intrinsic flux of the source, i.e. the observed flux after de-boosting.
Integrated source counts were calculated for both the radio and 24-m data from the respective catalogues; these are used to calculate the value of at both the flux density of the potential counterpart and the flux limit (for the radio catalogue we formed the counts using the un-deboosted fluxes as these correspond to the actual source densities in the radio map). In order to test these and the entire -statistic procedure, we have again performed Monte Carlo simulations, producing 500 realisations of the 126-source submm catalogue as described above. On average, five per cent of the SMGs should have a counterpart with . This corresponds to 6.3 sources on average and we indeed find values of 6.326 for the radio and 6.302 for the 24-m data. We are thus confident that we are measuring the correct probablilities for each counterpart.
4 The radio and MIPS counterparts
| ID | SMG name | Submm position | Radio position | Radio flux | Offset | ||
|---|---|---|---|---|---|---|---|
| () () | (arcsec) | () () | (Jy) | (arcsec) | |||
| 001 | LESS J033314.3275611 | 03:33:14.26 27:56:11.2 | 3.1 | ||||
| 002 | LESS J033302.5275643 | 03:33:02.50 27:56:43.6 | 3.8 | 03:33:02.7150 27:56:42.539 | 3.0 | 0.004 | |
| 003 | LESS J033321.5275520 | 03:33:21.51 27:55:20.2 | 3.8 | ||||
| 004 | LESS J033136.0275439 | 03:31:36.01 27:54:39.2 | 4.1 | ||||
| 005 | LESS J033129.5275907 | 03:31:29.46 27:59:07.3 | 4.6 | ||||
| 006 | LESS J033257.1280102 | 03:32:57.14 28:01:02.1 | 4.8 | 03:32:56.9734 28:01:01.204 | 2.4 | 0.013 | |
| 007 | LESS J033315.6274523 | 03:33:15.55 27:45:23.6 | 5.1 | 03:33:15.4267 27:45:24.430 | 1.8 | 0.006 | |
| 008 | LESS J033205.1273108∗ | 03:32:05.07 27:31:08.8 | 4.0 | ||||
| 009 | LESS J033211.3275210 | 03:32:11.29 27:52:10.4 | 5.1 | 03:32:11.3737 27:52:12.139 | 2.1 | 0.025 | |
| 010 | LESS J033219.0275219 | 03:32:19.02 27:52:19.4 | 5.1 | 03:32:19.0632 27:52:14.829 | 4.6 | 0.035 | |
| 03:32:19.1370 27:52:18.115 | 2.0 | 0.011 | |||||
| 03:32:19.3086 27:52:19.018 | 3.8 | 0.029 | |||||
| 011 | LESS J033213.6275602 | 03:32:13.58 27:56:02.5 | 5.2 | 03:32:13.8475 27:56:00.247 | 4.2 | 0.029 | |
| 012 | LESS J033248.1275414 | 03:32:48.12 27:54:14.7 | 5.3 | 03:32:47.9995 27:54:16.497 | 2.4 | 0.020 | |
| 03:32:48.3987 27:54:16.741 | 4.2 | 0.113 | |||||
| 013 | LESS J033249.2274246 | 03:32:49.23 27:42:46.6 | 5.3 | ||||
| 014 | LESS J033152.6280320 | 03:31:52.64 28:03:20.4 | 5.1 | 03:31:52.4870 28:03:18.934 | 2.5 | 0.007 | |
| 015 | LESS J033333.4275930 | 03:33:33.36 27:59:30.1 | 5.3 | ||||
| 016 | LESS J033218.9273738 | 03:32:18.89 27:37:38.7 | 5.8 | 03:32:18.6870 27:37:43.145 | 5.2 | 0.039 | |
| 017 | LESS J033207.6275123 | 03:32:07.59 27:51:23.0 | 6.1 | 03:32:07.3105 27:51:20.849 | 4.3 | 0.015 | |
| 018 | LESS J033205.1274652 | 03:32:05.12 27:46:52.1 | 6.2 | 03:32:04.9033 27:46:47.449 | 5.5 | 0.020 | |
| 019 | LESS J033208.1275818 | 03:32:08.10 27:58:18.7 | 6.4 | 03:32:08.2721 27:58:14.069 | 5.2 | (0.090) | |
| 020 | LESS J033316.6280018 | 03:33:16.56 28:00:18.8 | 6.5 | 03:33:16.7726 28:00:16.120 | 3.9 | 0.001 | |
| 021 | LESS J033329.9273441 | 03:33:29.93 27:34:41.7 | 6.2 | ||||
| 022 | LESS J033147.0273243 | 03:31:47.02 27:32:43.0 | 5.9 | 03:31:46.9496 27:32:39.547 | 3.6 | 0.009 | |
| 023 | LESS J033212.1280508 | 03:32:12.11 28:05:08.5 | 5.8 | ||||
| 024 | LESS J033336.8274401 | 03:33:36.79 27:44:01.0 | 6.3 | 03:33:36.9881 27:43:58.749 | 3.5 | 0.019 | |
| 025 | LESS J033157.1275940 | 03:31:57.05 27:59:40.8 | 6.8 | 03:31:56.8845 27:59:39.653 | 2.5 | 0.012 | |
| 026 | LESS J033136.9275456 | 03:31:36.90 27:54:56.1 | 7.0 | ||||
| 027 | LESS J033149.7273432 | 03:31:49.73 27:34:32.7 | 6.5 | ||||
| 028 | LESS J033302.9274432 | 03:33:02.92 27:44:32.6 | 6.9 | ||||
| 029 | LESS J033336.9275813 | 03:33:36.90 27:58:13.0 | 6.6 | 03:33:36.8866 27:58:09.382 | 3.6 | 0.024 | |
| 030 | LESS J033344.4280346 | 03:33:44.37 28:03:46.1 | 5.5 | ||||
| 031 | LESS J033150.0275743 | 03:31:49.96 27:57:43.9 | 7.2 | 03:31:49.8280 27:57:40.833 | 3.5 | (0.085) | |
| 032 | LESS J033243.6274644 | 03:32:43.57 27:46:44.0 | 7.2 | ||||
| 033 | LESS J033149.8275332 | 03:31:49.78 27:53:32.9 | 7.2 | ||||
| 034 | LESS J033217.6275230 | 03:32:17.64 27:52:30.3 | 7.2 | ||||
| 035 | LESS J033110.3273714∗ | 03:31:10.35 27:37:14.8 | 5.9 | ||||
| 036 | LESS J033149.2280208 | 03:31:49.15 28:02:08.7 | 7.2 | 03:31:48.9740 28:02:14.399 | 6.2 | (0.057 + MIPS) | |
| 037 | LESS J033336.0275347 | 03:33:36.04 27:53:47.6 | 6.9 | ||||
| 038 | LESS J033310.2275641 | 03:33:10.20 27:56:41.5 | 7.5 | ||||
| 039 | LESS J033144.9273435 | 03:31:44.90 27:34:35.4 | 7.3 | 03:31:45.0493 27:34:37.060 | 2.6 | 0.017 | |
| 03:31:45.0634 27:34:30.112 | 5.7 | (0.105) | |||||
| 040 | LESS J033246.7275120 | 03:32:46.74 27:51:20.9 | 7.6 | 03:32:46.8465 27:51:21.024 | 1.4 | 0.003 | |
| 041 | LESS J033110.5275233∗ | 03:31:10.47 27:52:33.2 | 6.2 | ||||
| 042 | LESS J033231.0275858 | 03:32:31.02 27:58:58.1 | 7.7 | ||||
| 043 | LESS J033307.0274801 | 03:33:07.00 27:48:01.0 | 7.6 | 03:33:07.4844 27:47:59.336 | 6.6 | 0.168 | |
| 044 | LESS J033131.0273238 | 03:31:30.96 27:32:38.5 | 6.9 | 03:31:31.2272 27:32:39.111 | 3.6 | 0.012 | |
| 045 | LESS J033225.7275228 | 03:32:25.71 27:52:28.5 | 7.7 | 03:32:25.2714 27:52:30.692 | 6.2 | 0.135 | |
| 046 | LESS J033336.8273247 | 03:33:36.80 27:32:47.0 | 6.5 | 03:33:36.7533 27:32:49.574 | 2.6 | 0.008 | |
| 047 | LESS J033256.0273317 | 03:32:56.00 27:33:17.7 | 7.2 | ||||
| 048 | LESS J033237.8273202 | 03:32:37.77 27:32:02.0 | 6.8 | 03:32:38.0090 27:31:59.927 | 3.8 | 0.015 | |
| 049 | LESS J033124.4275040 | 03:31:24.45 27:50:40.9 | 7.6 | 03:31:24.2001 27:50:42.774 | 3.8 | (0.056) | |
| 03:31:24.5046 27:50:37.576 | 3.4 | 0.038 | |||||
| 03:31:24.7140 27:50:46.507 | 6.6 | 0.029 | |||||
| 050 | LESS J033141.2274441 | 03:31:41.15 27:44:41.5 | 7.9 | 03:31:40.9917 27:44:35.238 | 6.6 | 0.047 | |
| 03:31:41.4170 27:44:46.966 | 6.5 | (0.090) | |||||
| 051 | LESS J033144.8274425 | 03:31:44.81 27:44:25.1 | 7.9 | 03:31:45.0647 27:44:27.794 | 4.3 | (0.093) |
| ID | SMG name | Submm position | Radio position | Radio flux | Offset | ||
|---|---|---|---|---|---|---|---|
| () () | (arcsec) | () () | (Jy) | (arcsec) | |||
| 052 | LESS J033128.5275601 | 03:31:28.51 27:56:01.3 | 7.9 | ||||
| 053 | LESS J033159.1275435 | 03:31:59.12 27:54:35.5 | 8.0 | ||||
| 054 | LESS J033243.6273353 | 03:32:43.61 27:33:53.6 | 7.6 | ||||
| 055 | LESS J033302.2274033 | 03:33:02.20 27:40:33.6 | 8.0 | ||||
| 056 | LESS J033153.2273936 | 03:31:53.17 27:39:36.1 | 8.1 | 03:31:53.1189 27:39:38.555 | 2.5 | 0.036 | |
| 057 | LESS J033152.0275329 | 03:31:51.97 27:53:29.7 | 8.0 | 03:31:51.9370 27:53:27.179 | 2.6 | 0.018 | |
| 058 | LESS J033225.8273306 | 03:32:25.79 27:33:06.7 | 7.6 | 03:32:25.5399 27:33:06.953 | 3.3 | (0.069) | |
| 059 | LESS J033303.9274412 | 03:33:03.87 27:44:12.2 | 8.2 | 03:33:03.8207 27:44:14.497 | 2.4 | (0.069) | |
| 03:33:03.5906 27:44:13.586 | 4.0 | (0.085) | |||||
| 060 | LESS J033317.5275121 | 03:33:17.47 27:51:21.5 | 8.3 | 03:33:17.4972 27:51:28.796 | 7.3 | (0.067 + MIPS) | |
| 061 | LESS J033245.6280025 | 03:32:45.63 28:00:25.3 | 8.3 | ||||
| 062 | LESS J033236.4273452 | 03:32:36.41 27:34:52.5 | 8.2 | 03:32:36.5309 27:34:53.363 | 1.8 | 0.003 | |
| 03:32:36.6933 27:34:47.261 | 6.5 | 0.136 | |||||
| 063 | LESS J033308.5280044 | 03:33:08.46 28:00:44.3 | 8.3 | 03:33:08.5591 28:00:44.866 | 1.4 | [0.013] | |
| 064 | LESS J033201.0280025 | 03:32:01.00 28:00:25.6 | 8.4 | 03:32:00.9468 28:00:26.467 | 1.1 | 0.018 | |
| 065 | LESS J033252.4273527 | 03:32:52.40 27:35:27.7 | 8.3 | ||||
| 066 | LESS J033331.7275406 | 03:33:31.69 27:54:06.1 | 8.2 | 03:33:31.9745 27:54:10.257 | 5.6 | 0.041 | |
| 067 | LESS J033243.3275517 | 03:32:43.28 27:55:17.9 | 8.4 | 03:32:43.2046 27:55:14.289 | 3.7 | 0.018 | |
| 03:32:43.8211 27:55:15.380 | 7.6 | 0.225 | |||||
| 068 | LESS J033233.4273918 | 03:32:33.44 27:39:18.5 | 8.4 | 03:32:33.9689 27:39:14.491 | 8.1 | 0.257 | |
| 069 | LESS J033134.3275934 | 03:31:34.26 27:59:34.3 | 8.5 | ||||
| 070 | LESS J033144.0273832 | 03:31:43.97 27:38:32.5 | 8.5 | 03:31:44.0325 27:38:35.859 | 3.5 | 0.005 | |
| 071 | LESS J033306.3273327 | 03:33:06.29 27:33:27.7 | 8.0 | ||||
| 072 | LESS J033240.4273802 | 03:32:40.40 27:38:02.5 | 8.5 | 03:32:40.0506 27:38:09.235 | 8.2 | 0.118 | |
| 073 | LESS J033229.3275619 | 03:32:29.33 27:56:19.3 | 8.5 | 03:32:29.3049 27:56:19.404 | 0.3 | 0.005 | |
| 03:32:29.3518 27:56:23.802 | 4.5 | 0.228 | |||||
| 074 | LESS J033309.3274809 | 03:33:09.34 27:48:09.9 | 8.4 | 03:33:09.1492 27:48:16.833 | 7.4 | (0.085 + IRAC) | |
| 03:33:09.3836 27:48:15.887 | 6.0 | (0.095) | |||||
| 075 | LESS J033126.8275554 | 03:31:26.83 27:55:54.6 | 8.4 | 03:31:27.1942 27:55:51.287 | 5.9 | 0.038 | |
| 076 | LESS J033332.7275957 | 03:33:32.67 27:59:57.2 | 8.4 | 03:33:32.3411 27:59:54.831 | 5.0 | 0.042 | |
| 077 | LESS J033157.2275633 | 03:31:57.23 27:56:33.2 | 8.8 | ||||
| 078 | LESS J033340.3273956 | 03:33:40.30 27:39:56.9 | 8.4 | 03:33:40.1122 27:39:49.684 | 7.6 | 0.044 | |
| 079 | LESS J033221.2275623 | 03:32:21.25 27:56:23.5 | 8.8 | 03:32:21.6159 27:56:23.755 | 4.9 | (0.087) | |
| 080 | LESS J033142.2274834 | 03:31:42.23 27:48:34.4 | 8.9 | 03:31:41.8328 27:48:36.131 | 5.5 | 0.148 | |
| 03:31:42.8359 27:48:36.936 | 8.4 | 0.110 | |||||
| 081 | LESS J033127.4274440 | 03:31:27.45 27:44:40.4 | 8.8 | 03:31:27.5722 27:44:39.651 | 1.8 | 0.002 | |
| 082 | LESS J033253.8273810 | 03:32:53.77 27:38:10.9 | 9.0 | ||||
| 083 | LESS J033308.9280522 | 03:33:08.92 28:05:22.0 | 8.3 | ||||
| 084 | LESS J033154.2275109 | 03:31:54.22 27:51:09.8 | 8.9 | 03:31:54.5185 27:51:05.700 | 5.7 | 0.119 | |
| 03:31:54.8325 27:51:10.973 | 8.2 | 0.272 | |||||
| 085 | LESS J033110.3274503∗ | 03:31:10.28 27:45:03.1 | 7.7 | ||||
| 086 | LESS J033114.9274844 | 03:31:14.90 27:48:44.3 | 8.5 | ||||
| 087 | LESS J033251.1273143 | 03:32:51.09 27:31:43.0 | 8.4 | 03:32:50.8711 27:31:41.762 | 3.2 | 0.008 | |
| 03:32:51.0736 27:31:45.730 | 2.7 | 0.014 | |||||
| 088 | LESS J033155.2275345 | 03:31:55.19 27:53:45.3 | 9.0 | 03:31:54.7502 27:53:41.012 | 7.2 | 0.167 | |
| 03:31:54.8959 27:53:41.303 | 5.6 | 0.042 | |||||
| 03:31:55.7818 27:53:48.183 | 8.4 | 0.182 | |||||
| 089 | LESS J033248.4280023 | 03:32:48.44 28:00:23.8 | 9.1 | ||||
| 090 | LESS J033243.7273554 | 03:32:43.65 27:35:54.1 | 9.1 | ||||
| 091 | LESS J033135.2274033 | 03:31:35.25 27:40:33.7 | 9.1 | ||||
| 092 | LESS J033138.4274336 | 03:31:38.36 27:43:36.0 | 9.2 | ||||
| 093 | LESS J033110.8275607 | 03:31:10.84 27:56:07.2 | 8.4 | ||||
| 094 | LESS J033307.3275805 | 03:33:07.27 27:58:05.0 | 9.1 | ||||
| 095 | LESS J033241.7275846 | 03:32:41.74 27:58:46.1 | 9.2 | 03:32:41.2324 27:58:41.752 | 8.0 | 0.152 | |
| 096 | LESS J033313.0275556 | 03:33:13.03 27:55:56.8 | 9.2 | 03:33:12.6380 27:55:51.515 | 7.4 | (0.058) | |
| 097 | LESS J033313.7273803 | 03:33:13.65 27:38:03.4 | 9.2 | ||||
| 098 | LESS J033130.2275726 | 03:31:30.22 27:57:26.0 | 9.3 | 03:31:29.8979 27:57:22.733 | 5.4 | 0.020 | |
| 099 | LESS J033251.4275536 | 03:32:51.45 27:55:36.0 | 9.2 | ||||
| 100 | LESS J033111.3280006 | 03:31:11.32 28:00:06.2 | 8.8 | ||||
| 101 | LESS J033151.5274552 | 03:31:51.47 27:45:52.1 | 9.3 | 03:31:51.6370 27:45:52.262 | 2.2 | 0.052 | |
| 102 | LESS J033335.6274020 | 03:33:35.61 27:40:20.1 | 9.2 | 03:33:36.1277 27:40:18.677 | 7.0 | 0.132 | |
| 103 | LESS J033325.3273400 | 03:33:25.35 27:34:00.4 | 9.2 | 03:33:25.8532 27:33:57.591 | 7.3 | 0.104 | |
| 104 | LESS J033258.5273803 | 03:32:58.46 27:38:03.0 | 9.4 | 03:32:57.8327 27:37:59.389 | 9.1 | 0.178 |
| ID | SMG name | Submm position | Radio position | Radio flux | Offset | ||
|---|---|---|---|---|---|---|---|
| () () | (arcsec) | () () | (Jy) | (arcsec) | |||
| 105 | LESS J033115.8275313 | 03:31:15.78 27:53:13.1 | 9.0 | ||||
| 106 | LESS J033140.1275631 | 03:31:40.09 27:56:31.4 | 9.4 | 03:31:40.1985 27:56:23.051 | 8.5 | (0.086) | |
| 107 | LESS J033130.8275150 | 03:31:30.85 27:51:50.9 | 9.4 | 03:31:30.5820 27:51:45.062 | 6.8 | 0.204 | |
| 03:31:31.3078 27:51:44.774 | 8.6 | 0.199 | |||||
| 108 | LESS J033316.4275033 | 03:33:16.42 27:50:33.1 | 9.5 | 03:33:16.5352 27:50:39.704 | 6.8 | 0.015 | |
| 109 | LESS J033328.1274157 | 03:33:28.08 27:41:57.0 | 9.5 | 03:33:28.0319 27:42:03.554 | 6.6 | 0.184 | |
| 110 | LESS J033122.6275417 | 03:31:22.64 27:54:17.2 | 9.4 | 03:31:22.7410 27:54:12.315 | 5.1 | (0.064) | |
| 111 | LESS J033325.6273423 | 03:33:25.58 27:34:23.0 | 9.4 | 03:33:25.1978 27:34:25.322 | 5.6 | 0.042 | |
| 112 | LESS J033249.3273112∗ | 03:32:49.28 27:31:12.3 | 9.0 | 03:32:48.8585 27:31:13.054 | 5.7 | (0.081) | |
| 03:32:49.4709 27:31:19.667 | 7.8 | (0.100) | |||||
| 113 | LESS J033236.4275845 | 03:32:36.42 27:58:45.9 | 9.5 | ||||
| 114 | LESS J033150.8274438 | 03:31:50.81 27:44:38.5 | 9.7 | 03:31:51.1106 27:44:37.552 | 4.1 | 0.022 | |
| 115 | LESS J033349.7274239∗ | 03:33:49.71 27:42:39.2 | 8.9 | ||||
| 116 | LESS J033154.4274525 | 03:31:54.42 27:45:25.5 | 9.7 | 03:31:54.2386 27:45:27.809 | 3.3 | 0.119 | |
| 03:31:54.4428 27:45:31.605 | 6.1 | (0.104) | |||||
| 117 | LESS J033128.0273925 | 03:31:28.02 27:39:25.2 | 9.7 | 03:31:27.5941 27:39:27.989 | 6.3 | 0.042 | |
| 118 | LESS J033121.8274936 | 03:31:21.81 27:49:36.8 | 9.7 | 03:31:21.9425 27:49:41.894 | 5.4 | (0.082) | |
| 03:31:21.8153 27:49:35.179 | 1.6 | [0.032] | |||||
| 119 | LESS J033256.5280319 | 03:32:56.51 28:03:19.1 | 9.7 | ||||
| 120 | LESS J033328.4275655 | 03:33:28.45 27:56:55.9 | 9.8 | 03:33:28.5832 27:56:54.376 | 2.3 | 0.015 | |
| 03:33:28.5885 27:56:58.901 | 3.5 | (0.075) | |||||
| 121 | LESS J033333.3273449 | 03:33:33.32 27:34:49.3 | 9.7 | 03:33:33.0528 27:34:51.686 | 4.3 | (0.062) | |
| 03:33:33.0900 27:34:42.616 | 7.4 | (0.086) | |||||
| 122 | LESS J033139.6274120 | 03:31:39.62 27:41:20.4 | 9.9 | 03:31:39.5493 27:41:19.658 | 1.2 | 0.001 | |
| 123 | LESS J033330.9275349 | 03:33:30.88 27:53:49.3 | 9.8 | ||||
| 124 | LESS J033203.6273605 | 03:32:03.59 27:36:05.0 | 10.0 | 03:32:03.1065 27:36:01.967 | 7.1 | (0.095) | |
| 03:32:03.4080 27:36:08.877 | 4.6 | 0.125 | |||||
| 125 | LESS J033146.0274621 | 03:31:46.02 27:46:21.2 | 9.9 | ||||
| 126 | LESS J033209.8274102 | 03:32:09.76 27:41:02.0 | 9.9 | 03:32:09.5918 27:41:07.368 | 5.8 | 0.230 |
| ID | SMG name | Submm position | 24-m position | 24-m flux | Offset | ||
|---|---|---|---|---|---|---|---|
| () () | (arcsec) | () () | (Jy) | (arcsec) | |||
| 001 | LESS J033314.3275611 | 03:33:14.26 27:56:11.2 | 3.1 | 03:33:14.4124 27:56:11.995 | 2.2 | 0.053 | |
| 002 | LESS J033302.5275643 | 03:33:02.50 27:56:43.6 | 3.8 | 03:33:02.5305 27:56:45.344 | 1.8 | 0.014 | |
| 003 | LESS J033321.5275520 | 03:33:21.51 27:55:20.2 | 3.8 | 03:33:21.5113 27:55:20.515 | 0.3 | 0.004 | |
| 004 | LESS J033136.0275439 | 03:31:36.01 27:54:39.2 | 4.1 | ||||
| 005 | LESS J033129.5275907 | 03:31:29.46 27:59:07.3 | 4.6 | ||||
| 006 | LESS J033257.1280102 | 03:32:57.14 28:01:02.1 | 4.8 | 03:32:57.0774 28:01:01.074 | 1.3 | 0.041 | |
| 007 | LESS J033315.6274523 | 03:33:15.55 27:45:23.6 | 5.1 | 03:33:15.3999 27:45:24.008 | 2.0 | 0.008 | |
| 008 | LESS J033205.1273108 | 03:32:05.07 27:31:08.8 | 4.0 | ||||
| 009 | LESS J033211.3275210 | 03:32:11.29 27:52:10.4 | 5.1 | 03:32:11.3060 27:52:13.235 | 2.8 | (0.063) | |
| 010 | LESS J033219.0275219 | 03:32:19.02 27:52:19.4 | 5.1 | 03:32:19.0566 27:52:14.801 | 4.6 | (0.090) | |
| 011 | LESS J033213.6275602 | 03:32:13.58 27:56:02.5 | 5.2 | 03:32:13.8449 27:55:59.965 | 4.3 | 0.113 | |
| 012 | LESS J033248.1275414 | 03:32:48.12 27:54:14.7 | 5.3 | 03:32:47.7383 27:54:13.569 | 5.2 | 0.178 | |
| 03:32:48.0689 27:54:16.266 | 1.7 | (0.058) | |||||
| 03:32:48.5059 27:54:15.795 | 5.2 | (0.095) | |||||
| 013 | LESS J033249.2274246 | 03:32:49.23 27:42:46.6 | 5.3 | ||||
| 014 | LESS J033152.6280320 | 03:31:52.64 28:03:20.4 | 5.1 | 03:31:52.4265 28:03:18.033 | 3.7 | (0.096) | |
| 015 | LESS J033333.4275930 | 03:33:33.36 27:59:30.1 | 5.3 | 03:33:33.3439 27:59:29.407 | 0.7 | 0.008 | |
| 016 | LESS J033218.9273738 | 03:32:18.89 27:37:38.7 | 5.8 | ||||
| 017 | LESS J033207.6275123 | 03:32:07.59 27:51:23.0 | 6.1 | 03:32:07.2947 27:51:20.431 | 4.7 | (0.071) | |
| 018 | LESS J033205.1274652 | 03:32:05.12 27:46:52.1 | 6.2 | 03:32:05.0405 27:46:55.728 | 3.8 | 0.174 | |
| 03:32:04.8558 27:46:47.248 | 6.0 | 0.029 | |||||
| 019 | LESS J033208.1275818 | 03:32:08.10 27:58:18.7 | 6.4 | 03:32:07.8975 27:58:23.595 | 5.6 | 0.239 | |
| 03:32:08.2306 27:58:14.218 | 4.8 | 0.172 | |||||
| 020 | LESS J033316.6280018 | 03:33:16.56 28:00:18.8 | 6.5 | 03:33:16.7545 28:00:15.608 | 4.1 | (0.078) | |
| 021 | LESS J033329.9273441 | 03:33:29.93 27:34:41.7 | 6.2 | 03:33:29.7579 27:34:46.266 | 5.1 | (0.067) | |
| 022 | LESS J033147.0273243 | 03:31:47.02 27:32:43.0 | 5.9 | 03:31:46.9134 27:32:38.841 | 4.4 | 0.025 | |
| 023 | LESS J033212.1280508 | 03:32:12.11 28:05:08.5 | 5.8 | 03:32:11.9457 28:05:06.229 | 3.1 | 0.135 | |
| 024 | LESS J033336.8274401 | 03:33:36.79 27:44:01.0 | 6.3 | 03:33:36.9853 27:43:58.522 | 3.6 | (0.086) | |
| 025 | LESS J033157.1275940 | 03:31:57.05 27:59:40.8 | 6.8 | 03:31:56.8419 27:59:38.856 | 3.4 | 0.043 | |
| 026 | LESS J033136.9275456 | 03:31:36.90 27:54:56.1 | 7.0 | ||||
| 027 | LESS J033149.7273432 | 03:31:49.73 27:34:32.7 | 6.5 | 03:31:49.8900 27:34:36.658 | 4.5 | (0.082) | |
| 03:31:50.2090 27:34:32.901 | 6.4 | (0.072) | |||||
| 028 | LESS J033302.9274432 | 03:33:02.92 27:44:32.6 | 6.9 | ||||
| 029 | LESS J033336.9275813 | 03:33:36.90 27:58:13.0 | 6.6 | 03:33:36.8692 27:58:08.874 | 4.1 | (0.103) | |
| 030 | LESS J033344.4280346 | 03:33:44.37 28:03:46.1 | 5.5 | ||||
| 031 | LESS J033150.0275743 | 03:31:49.96 27:57:43.9 | 7.2 | 03:31:49.7330 27:57:39.858 | 5.0 | 0.214 | |
| 032 | LESS J033243.6274644 | 03:32:43.57 27:46:44.0 | 7.2 | 03:32:43.5139 27:46:39.630 | 4.4 | 0.157 | |
| 033 | LESS J033149.8275332 | 03:31:49.78 27:53:32.9 | 7.2 | ||||
| 034 | LESS J033217.6275230 | 03:32:17.64 27:52:30.3 | 7.2 | 03:32:17.5943 27:52:28.656 | 1.8 | 0.016 | |
| 035 | LESS J033110.3273714 | 03:31:10.35 27:37:14.8 | 5.9 | 03:31:10.4778 27:37:15.134 | 1.7 | 0.046 | |
| 036 | LESS J033149.2280208 | 03:31:49.15 28:02:08.7 | 7.2 | 03:31:48.9432 28:02:13.486 | 5.5 | (0.071 + radio) | |
| 037 | LESS J033336.0275347 | 03:33:36.04 27:53:47.6 | 6.9 | 03:33:36.0581 27:53:49.812 | 2.2 | 0.025 | |
| 03:33:36.2881 27:53:47.112 | 3.3 | (0.092) | |||||
| 038 | LESS J033310.2275641 | 03:33:10.20 27:56:41.5 | 7.5 | 03:33:10.0986 27:56:45.026 | 3.8 | (0.086) | |
| 03:33:10.5182 27:56:44.627 | 5.2 | 0.216 | |||||
| 039 | LESS J033144.9273435 | 03:31:44.90 27:34:35.4 | 7.3 | 03:31:45.0100 27:34:36.567 | 1.9 | 0.036 | |
| 040 | LESS J033246.7275120 | 03:32:46.74 27:51:20.9 | 7.6 | 03:32:46.8016 27:51:20.648 | 0.9 | 0.011 | |
| 041 | LESS J033110.5275233 | 03:31:10.47 27:52:33.2 | 6.2 | ||||
| 042 | LESS J033231.0275858 | 03:32:31.02 27:58:58.1 | 7.7 | 03:32:30.9901 27:59:02.928 | 4.8 | 0.180 | |
| 043 | LESS J033307.0274801 | 03:33:07.00 27:48:01.0 | 7.6 | 03:33:06.6209 27:48:02.051 | 5.1 | (0.086) | |
| 03:33:07.4686 27:47:59.241 | 6.5 | 0.140 | |||||
| 03:33:07.1581 27:47:55.911 | 5.5 | 0.224 | |||||
| 044 | LESS J033131.0273238 | 03:31:30.96 27:32:38.5 | 6.9 | 03:31:31.2040 27:32:38.469 | 3.2 | 0.017 | |
| 045 | LESS J033225.7275228 | 03:32:25.71 27:52:28.5 | 7.7 | 03:32:25.2320 27:52:30.520 | 6.7 | 0.226 | |
| 046 | LESS J033336.8273247∗ | 03:33:36.80 27:32:47.0 | 6.5 | ||||
| 047 | LESS J033256.0273317 | 03:32:56.00 27:33:17.7 | 7.2 | 03:32:55.9048 27:33:19.557 | 2.2 | (0.089) | |
| 048 | LESS J033237.8273202 | 03:32:37.77 27:32:02.0 | 6.8 | 03:32:37.9882 27:31:59.611 | 3.8 | 0.021 | |
| 049 | LESS J033124.4275040 | 03:31:24.45 27:50:40.9 | 7.6 | 03:31:24.4752 27:50:37.619 | 3.3 | (0.090) | |
| 03:31:24.7116 27:50:46.277 | 6.4 | 0.198 | |||||
| 03:31:24.2346 27:50:43.663 | 4.0 | 0.118 |
| ID | SMG name | Submm position | 24-m position | 24-m flux | Offset | ||
|---|---|---|---|---|---|---|---|
| () () | (arcsec) | () () | (Jy) | (arcsec) | |||
| 050 | LESS J033141.2274441 | 03:31:41.15 27:44:41.5 | 7.9 | 03:31:41.3603 27:44:47.005 | 6.2 | 0.127 | |
| 03:31:41.1223 27:44:42.531 | 1.1 | 0.028 | |||||
| 03:31:41.5587 27:44:40.948 | 5.5 | 0.196 | |||||
| 03:31:40.6007 27:44:40.929 | 7.3 | 0.183 | |||||
| 03:31:40.9980 27:44:34.928 | 6.9 | (0.072) | |||||
| 051 | LESS J033144.8274425 | 03:31:44.81 27:44:25.1 | 7.9 | 03:31:45.0279 27:44:27.859 | 4.0 | 0.125 | |
| 03:31:44.4130 27:44:20.236 | 7.2 | 0.271 | |||||
| 052 | LESS J033128.5275601 | 03:31:28.51 27:56:01.3 | 7.9 | 03:31:28.3837 27:56:07.987 | 6.9 | 0.203 | |
| 053 | LESS J033159.1275435 | 03:31:59.12 27:54:35.5 | 8.0 | 03:31:58.9803 27:54:38.097 | 3.2 | (0.079) | |
| 054 | LESS J033243.6273353 | 03:32:43.61 27:33:53.6 | 7.6 | 03:32:43.6418 27:33:56.925 | 3.4 | 0.048 | |
| 055 | LESS J033302.2274033 | 03:33:02.20 27:40:33.6 | 8.0 | ||||
| 056 | LESS J033153.2273936 | 03:31:53.17 27:39:36.1 | 8.1 | 03:31:53.1272 27:39:37.490 | 1.5 | 0.010 | |
| 057 | LESS J033152.0275329 | 03:31:51.97 27:53:29.7 | 8.0 | 03:31:51.9121 27:53:26.733 | 3.1 | 0.027 | |
| 058 | LESS J033225.8273306 | 03:32:25.79 27:33:06.7 | 7.6 | ||||
| 059 | LESS J033303.9274412 | 03:33:03.87 27:44:12.2 | 8.2 | 03:33:03.6615 27:44:11.811 | 2.8 | 0.050 | |
| 060 | LESS J033317.5275121 | 03:33:17.47 27:51:21.5 | 8.3 | 03:33:17.4868 27:51:28.081 | 6.6 | (0.089 + radio) | |
| 061 | LESS J033245.6280025 | 03:32:45.63 28:00:25.3 | 8.3 | 03:32:45.9477 28:00:22.155 | 5.3 | 0.264 | |
| 062 | LESS J033236.4273452 | 03:32:36.41 27:34:52.5 | 8.2 | 03:32:36.5400 27:34:53.319 | 1.9 | 0.014 | |
| 03:32:36.1180 27:34:53.299 | 4.0 | 0.167 | |||||
| 063 | LESS J033308.5280044 | 03:33:08.46 28:00:44.3 | 8.3 | 03:33:08.4096 28:00:42.440 | 2.0 | (0.073) | |
| 064 | LESS J033201.0280025 | 03:32:01.00 28:00:25.6 | 8.4 | 03:32:00.5600 28:00:25.733 | 5.8 | 0.215 | |
| 03:32:00.9399 28:00:25.316 | 0.8 | 0.002 | |||||
| 065 | LESS J033252.4273527 | 03:32:52.40 27:35:27.7 | 8.3 | ||||
| 066 | LESS J033331.7275406 | 03:33:31.69 27:54:06.1 | 8.2 | 03:33:31.9057 27:54:10.024 | 4.9 | 0.023 | |
| 067 | LESS J033243.3275517 | 03:32:43.28 27:55:17.9 | 8.4 | 03:32:43.7519 27:55:16.397 | 6.4 | 0.240 | |
| 03:32:43.0426 27:55:24.757 | 7.5 | 0.167 | |||||
| 03:32:43.1879 27:55:14.295 | 3.8 | 0.017 | |||||
| 068 | LESS J033233.4273918 | 03:32:33.44 27:39:18.5 | 8.4 | 03:32:33.3296 27:39:13.479 | 5.2 | 0.291 | |
| 03:32:33.9234 27:39:14.713 | 7.5 | 0.180 | |||||
| 069 | LESS J033134.3275934 | 03:31:34.26 27:59:34.3 | 8.5 | 03:31:33.8107 27:59:32.287 | 6.3 | 0.241 | |
| 03:31:34.6801 27:59:34.629 | 5.6 | 0.155 | |||||
| 070 | LESS J033144.0273832 | 03:31:43.97 27:38:32.5 | 8.5 | 03:31:44.0299 27:38:35.076 | 2.7 | 0.015 | |
| 03:31:43.9688 27:38:30.430 | 2.1 | (0.058) | |||||
| 071 | LESS J033306.3273327 | 03:33:06.29 27:33:27.7 | 8.0 | ||||
| 072 | LESS J033240.4273802 | 03:32:40.40 27:38:02.5 | 8.5 | 03:32:40.0462 27:38:08.479 | 7.6 | 0.051 | |
| 073 | LESS J033229.3275619 | 03:32:29.33 27:56:19.3 | 8.5 | ||||
| 074 | LESS J033309.3274809 | 03:33:09.34 27:48:09.9 | 8.4 | 03:33:09.1309 27:48:16.747 | 7.4 | 0.135 | |
| 03:33:09.3973 27:48:14.431 | 4.6 | 0.234 | |||||
| 03:33:09.5602 27:48:03.494 | 7.0 | (0.082) | |||||
| 03:33:09.0479 27:48:07.069 | 4.8 | 0.278 | |||||
| 075 | LESS J033126.8275554 | 03:31:26.83 27:55:54.6 | 8.4 | 03:31:27.1769 27:55:50.848 | 5.9 | 0.011 | |
| 076 | LESS J033332.7275957 | 03:33:32.67 27:59:57.2 | 8.4 | ||||
| 077 | LESS J033157.2275633 | 03:31:57.23 27:56:33.2 | 8.8 | 03:31:56.7468 27:56:37.786 | 7.9 | 0.382 | |
| 03:31:56.8109 27:56:32.398 | 5.6 | 0.339 | |||||
| 03:31:57.2381 27:56:40.234 | 7.0 | 0.217 | |||||
| 03:31:57.6947 27:56:28.842 | 7.5 | 0.261 | |||||
| 078 | LESS J033340.3273956∗ | 03:33:40.30 27:39:56.9 | 8.4 | ||||
| 079 | LESS J033221.2275623 | 03:32:21.25 27:56:23.5 | 8.8 | 03:32:21.5939 27:56:23.782 | 4.6 | 0.023 | |
| 03:32:21.1259 27:56:26.704 | 3.6 | 0.171 | |||||
| 03:32:20.8843 27:56:18.455 | 7.0 | 0.381 | |||||
| 03:32:21.4284 27:56:16.710 | 7.2 | 0.234 | |||||
| 080 | LESS J033142.2274834 | 03:31:42.23 27:48:34.4 | 8.9 | 03:31:42.6032 27:48:41.050 | 8.3 | 0.277 | |
| 03:31:42.7846 27:48:36.479 | 7.6 | 0.344 | |||||
| 081 | LESS J033127.4274440 | 03:31:27.45 27:44:40.4 | 8.8 | 03:31:27.5539 27:44:39.264 | 1.8 | 0.005 | |
| 082 | LESS J033253.8273810 | 03:32:53.77 27:38:10.9 | 9.0 | 03:32:53.5601 27:38:14.872 | 4.9 | 0.241 | |
| 083 | LESS J033308.9280522 | 03:33:08.92 28:05:22.0 | 8.3 | 03:33:08.8774 28:05:14.298 | 7.7 | 0.352 | |
| 084 | LESS J033154.2275109 | 03:31:54.22 27:51:09.8 | 8.9 | 03:31:54.8059 27:51:10.132 | 7.8 | 0.318 | |
| 03:31:54.5080 27:51:05.155 | 6.0 | 0.200 | |||||
| 03:31:53.8175 27:51:03.834 | 8.0 | 0.263 | |||||
| 085 | LESS J033110.3274503 | 03:31:10.28 27:45:03.1 | 7.7 | ||||
| 086 | LESS J033114.9274844 | 03:31:14.90 27:48:44.3 | 8.5 | ||||
| 087 | LESS J033251.1273143 | 03:32:51.09 27:31:43.0 | 8.4 | 03:32:51.6586 27:31:40.858 | 7.9 | 0.349 | |
| 03:32:50.8267 27:31:41.290 | 3.9 | 0.023 |
| ID | SMG name | Submm position | 24-m position | 24-m flux | Offset | ||
|---|---|---|---|---|---|---|---|
| () () | (arcsec) | () () | (Jy) | (arcsec) | |||
| 088 | LESS J033155.2275345 | 03:31:55.19 27:53:45.3 | 9.0 | 03:31:55.7552 27:53:47.714 | 7.9 | 0.197 | |
| 03:31:54.7914 27:53:41.259 | 6.7 | (0.094) | |||||
| 089 | LESS J033248.4280023 | 03:32:48.44 28:00:23.8 | 9.1 | 03:32:48.6548 28:00:21.217 | 3.8 | 0.183 | |
| 090 | LESS J033243.7273554 | 03:32:43.65 27:35:54.1 | 9.1 | ||||
| 091 | LESS J033135.2274033 | 03:31:35.25 27:40:33.7 | 9.1 | 03:31:35.0211 27:40:38.070 | 5.3 | 0.309 | |
| 092 | LESS J033138.4274336 | 03:31:38.36 27:43:36.0 | 9.2 | 03:31:38.2703 27:43:39.387 | 3.6 | 0.130 | |
| 03:31:38.2101 27:43:28.525 | 7.7 | 0.342 | |||||
| 093 | LESS J033110.8275607 | 03:31:10.84 27:56:07.2 | 8.4 | ||||
| 094 | LESS J033307.3275805 | 03:33:07.27 27:58:05.0 | 9.1 | 03:33:07.6169 27:58:06.076 | 4.7 | 0.180 | |
| 03:33:06.6787 27:58:06.259 | 7.9 | 0.376 | |||||
| 095 | LESS J033241.7275846 | 03:32:41.74 27:58:46.1 | 9.2 | 03:32:41.2420 27:58:41.239 | 8.2 | 0.110 | |
| 096 | LESS J033313.0275556 | 03:33:13.03 27:55:56.8 | 9.2 | 03:33:12.6193 27:55:51.500 | 7.6 | 0.023 | |
| 03:33:13.0725 27:55:55.873 | 1.1 | 0.042 | |||||
| 097 | LESS J033313.7273803 | 03:33:13.65 27:38:03.4 | 9.2 | ||||
| 098 | LESS J033130.2275726 | 03:31:30.22 27:57:26.0 | 9.3 | 03:31:29.9230 27:57:22.432 | 5.3 | (0.073) | |
| 099 | LESS J033251.4275536 | 03:32:51.45 27:55:36.0 | 9.2 | 03:32:51.3366 27:55:43.489 | 7.6 | 0.287 | |
| 100 | LESS J033111.3280006 | 03:31:11.32 28:00:06.2 | 8.8 | ||||
| 101 | LESS J033151.5274552 | 03:31:51.47 27:45:52.1 | 9.3 | 03:31:51.3802 27:46:00.784 | 8.8 | 0.448 | |
| 102 | LESS J033335.6274020 | 03:33:35.61 27:40:20.1 | 9.2 | 03:33:35.5719 27:40:22.963 | 2.9 | 0.022 | |
| 103 | LESS J033325.3273400 | 03:33:25.35 27:34:00.4 | 9.2 | 03:33:25.3661 27:33:58.314 | 2.1 | 0.052 | |
| 104 | LESS J033258.5273803 | 03:32:58.46 27:38:03.0 | 9.4 | 03:32:57.8377 27:37:59.368 | 9.0 | 0.354 | |
| 105 | LESS J033115.8275313 | 03:31:15.78 27:53:13.1 | 9.0 | ||||
| 106 | LESS J033140.1275631 | 03:31:40.09 27:56:31.4 | 9.4 | 03:31:40.4427 27:56:34.335 | 5.5 | 0.282 | |
| 03:31:40.1806 27:56:22.325 | 9.2 | 0.113 | |||||
| 107 | LESS J033130.8275150 | 03:31:30.85 27:51:50.9 | 9.4 | 03:31:31.3083 27:51:53.866 | 6.8 | 0.301 | |
| 03:31:30.5400 27:51:58.629 | 8.8 | 0.365 | |||||
| 03:31:30.6286 27:51:45.285 | 6.3 | 0.208 | |||||
| 03:31:31.2827 27:51:43.895 | 9.1 | 0.131 | |||||
| 03:31:30.3348 27:51:48.424 | 7.3 | 0.295 | |||||
| 108 | LESS J033316.4275033 | 03:33:16.42 27:50:33.1 | 9.5 | 03:33:16.4864 27:50:39.550 | 6.5 | 0.002 | |
| 109 | LESS J033328.1274157 | 03:33:28.08 27:41:57.0 | 9.5 | 03:33:27.9952 27:42:02.797 | 5.9 | 0.151 | |
| 03:33:28.5385 27:41:51.142 | 8.4 | 0.289 | |||||
| 110 | LESS J033122.6275417 | 03:31:22.64 27:54:17.2 | 9.4 | 03:31:22.6458 27:54:21.881 | 4.7 | 0.165 | |
| 111 | LESS J033325.6273423 | 03:33:25.58 27:34:23.0 | 9.4 | 03:33:25.2095 27:34:23.302 | 4.9 | 0.031 | |
| 112 | LESS J033249.3273112 | 03:32:49.28 27:31:12.3 | 9.0 | 03:32:48.8281 27:31:12.959 | 6.0 | 0.136 | |
| 113 | LESS J033236.4275845 | 03:32:36.42 27:58:45.9 | 9.5 | ||||
| 114 | LESS J033150.8274438 | 03:31:50.81 27:44:38.5 | 9.7 | 03:31:50.7294 27:44:40.607 | 2.4 | (0.083) | |
| 03:31:51.0920 27:44:37.132 | 4.0 | 0.019 | |||||
| 03:31:50.9679 27:44:43.872 | 5.8 | 0.320 | |||||
| 115 | LESS J033349.7274239∗ | 03:33:49.71 27:42:39.2 | 8.9 | ||||
| 116 | LESS J033154.4274525 | 03:31:54.42 27:45:25.5 | 9.7 | ||||
| 117 | LESS J033128.0273925 | 03:31:28.02 27:39:25.2 | 9.7 | 03:31:27.5895 27:39:27.598 | 6.2 | 0.137 | |
| 118 | LESS J033121.8274936 | 03:31:21.81 27:49:36.8 | 9.7 | 03:31:21.7699 27:49:41.451 | 4.7 | 0.269 | |
| 119 | LESS J033256.5280319 | 03:32:56.51 28:03:19.1 | 9.7 | 03:32:56.5806 28:03:11.789 | 7.4 | 0.219 | |
| 120 | LESS J033328.4275655 | 03:33:28.45 27:56:55.9 | 9.8 | 03:33:29.0593 27:56:57.375 | 8.2 | 0.442 | |
| 03:33:28.5322 27:56:54.295 | 1.9 | 0.010 | |||||
| 121 | LESS J033333.3273449∗ | 03:33:33.32 27:34:49.3 | 9.7 | ||||
| 122 | LESS J033139.6274120 | 03:31:39.62 27:41:20.4 | 9.9 | 03:31:39.5353 27:41:19.449 | 1.5 | 0.001 | |
| 123 | LESS J033330.9275349 | 03:33:30.88 27:53:49.3 | 9.8 | ||||
| 124 | LESS J033203.6273605 | 03:32:03.59 27:36:05.0 | 10.0 | 03:32:03.8787 27:36:06.030 | 4.0 | 0.131 | |
| 03:32:03.0844 27:36:01.864 | 7.4 | 0.375 | |||||
| 125 | LESS J033146.0274621 | 03:31:46.02 27:46:21.2 | 9.9 | 03:31:46.3415 27:46:23.329 | 4.8 | 0.316 | |
| 03:31:45.5405 27:46:15.445 | 8.6 | 0.462 | |||||
| 126 | LESS J033209.8274102 | 03:32:09.76 27:41:02.0 | 9.9 | 03:32:09.5687 27:41:06.810 | 5.4 | (0.086) | |
| 03:32:10.1562 27:40:56.226 | 7.8 | 0.451 |
| ID | SMG name | Submm position | 5.8-m position | 5.8-m flux | Offset | ||
|---|---|---|---|---|---|---|---|
| () () | (arcsec) | () () | (Jy) | (arcsec) | |||
| 004 | LESS J033136.0275439 | 03:31:36.01 27:54:39.2 | 4.1 | ||||
| 005 | LESS J033129.5275907 | 03:31:29.46 27:59:07.3 | 4.6 | ||||
| 008 | LESS J033205.1273108 | 03:32:05.07 27:31:08.8 | 4.0 | ||||
| 013 | LESS J033249.2274246 | 03:32:49.23 27:42:46.6 | 5.3 | ||||
| 019 | LESS J033208.1275818 | 03:32:08.10 27:58:18.7 | 6.4 | 03:32:07.9138 27:58:23.279 | 5.2 | 0.053 | |
| 03:32:08.2382 27:58:13.717 | 5.3 | 0.053 | |||||
| 021 | LESS J033329.9273441 | 03:33:29.93 27:34:41.7 | 6.2 | ||||
| 023 | LESS J033212.1280508 | 03:32:12.11 28:05:08.5 | 5.8 | ||||
| 026 | LESS J033136.9275456 | 03:31:36.90 27:54:56.1 | 7.0 | ||||
| 027 | LESS J033149.7273432 | 03:31:49.73 27:34:32.7 | 6.5 | 03:31:49.9238 27:34:36.790 | 4.8 | 0.040 | |
| 03:31:49.8854 27:34:30.428 | 3.1 | 0.033 | |||||
| 028 | LESS J033302.9274432 | 03:33:02.92 27:44:32.6 | 6.9 | ||||
| 030 | LESS J033344.4280346 | 03:33:44.37 28:03:46.1 | 5.5 | ||||
| 031 | LESS J033150.0275743 | 03:31:49.96 27:57:43.9 | 7.2 | 03:31:49.7364 27:57:39.280 | 5.5 | (0.059) | |
| 03:31:49.7741 27:57:40.439 | 4.2 | 0.044 | |||||
| 032 | LESS J033243.6274644 | 03:32:43.57 27:46:44.0 | 7.2 | 03:32:43.5170 27:46:38.978 | 5.1 | (0.059) | |
| 033 | LESS J033149.8275332 | 03:31:49.78 27:53:32.9 | 7.2 | ||||
| 038 | LESS J033310.2275641 | 03:33:10.20 27:56:41.5 | 7.5 | ||||
| 041 | LESS J033110.5275233 | 03:31:10.47 27:52:33.2 | 6.2 | 03:31:10.0942 27:52:36.347 | 5.9 | 0.010 | |
| 042 | LESS J033231.0275858 | 03:32:31.02 27:58:58.1 | 7.7 | ||||
| 043 | LESS J033307.0274801 | 03:33:07.00 27:48:01.0 | 7.6 | 03:33:07.4822 27:47:59.172 | 6.7 | (0.065) | |
| 03:33:06.6365 27:48:01.919 | 4.9 | 0.035 | |||||
| 045 | LESS J033225.7275228 | 03:32:25.71 27:52:28.5 | 7.7 | 03:32:25.2458 27:52:30.162 | 6.4 | 0.042 | |
| 047 | LESS J033256.0273317 | 03:32:56.00 27:33:17.7 | 7.2 | 03:32:55.9356 27:33:19.678 | 2.2 | 0.019 | |
| 03:32:55.9910 27:33:18.900 | 1.2 | 0.008 | |||||
| 051 | LESS J033144.8274425 | 03:31:44.81 27:44:25.1 | 7.9 | ||||
| 052 | LESS J033128.5275601 | 03:31:28.51 27:56:01.3 | 7.9 | ||||
| 053 | LESS J033159.1275435 | 03:31:59.12 27:54:35.5 | 8.0 | ||||
| 055 | LESS J033302.2274033 | 03:33:02.20 27:40:33.6 | 8.0 | ||||
| 058 | LESS J033225.8273306 | 03:32:25.79 27:33:06.7 | 7.6 | ||||
| 061 | LESS J033245.6280025 | 03:32:45.63 28:00:25.3 | 8.3 | ||||
| 065 | LESS J033252.4273527 | 03:32:52.40 27:35:27.7 | 8.3 | ||||
| 068 | LESS J033233.4273918 | 03:32:33.44 27:39:18.5 | 8.4 | ||||
| 069 | LESS J033134.3275934 | 03:31:34.26 27:59:34.3 | 8.5 | 03:31:33.7745 27:59:32.150 | 6.8 | (0.057) | |
| 03:31:34.6841 27:59:33.029 | 5.8 | (0.074) | |||||
| 071 | LESS J033306.3273327 | 03:33:06.29 27:33:27.7 | 8.0 | ||||
| 074 | LESS J033309.3274809 | 03:33:09.34 27:48:09.9 | 8.4 | 03:33:09.1416 27:48:16.650 | 7.2 | (0.057 + radio) | |
| 03:33:09.3454 27:48:15.998 | 6.1 | 0.051 | |||||
| 077 | LESS J033157.2275633 | 03:31:57.23 27:56:33.2 | 8.8 | 03:31:57.2544 27:56:39.815 | 6.6 | (0.062) | |
| 080 | LESS J033142.2274834 | 03:31:42.23 27:48:34.4 | 8.9 | 03:31:42.5995 27:48:41.155 | 8.3 | 0.101 | |
| 03:31:42.8066 27:48:36.659 | 8.0 | (0.076) | |||||
| 03:31:41.6700 27:48:30.031 | 8.6 | (0.090) | |||||
| 082 | LESS J033253.8273810 | 03:32:53.77 27:38:10.9 | 9.0 | 03:32:53.9789 27:38:14.633 | 4.7 | (0.072) | |
| 083 | LESS J033308.9280522 | 03:33:08.92 28:05:22.0 | 8.3 | ||||
| 084 | LESS J033154.2275109 | 03:31:54.22 27:51:09.8 | 8.9 | 03:31:54.4937 27:51:05.382 | 5.7 | 0.039 | |
| 03:31:53.8248 27:51:03.805 | 8.0 | (0.073) | |||||
| 085 | LESS J033110.3274503∗ | 03:31:10.28 27:45:03.1 | 7.7 | ||||
| 086 | LESS J033114.9274844 | 03:31:14.90 27:48:44.3 | 8.5 | ||||
| 089 | LESS J033248.4280023 | 03:32:48.44 28:00:23.8 | 9.1 | ||||
| 090 | LESS J033243.7273554 | 03:32:43.65 27:35:54.1 | 9.1 | ||||
| 091 | LESS J033135.2274033 | 03:31:35.25 27:40:33.7 | 9.1 | ||||
| 092 | LESS J033138.4274336 | 03:31:38.36 27:43:36.0 | 9.2 | ||||
| 093 | LESS J033110.8275607∗ | 03:31:10.84 27:56:07.2 | 8.4 | ||||
| 094 | LESS J033307.3275805 | 03:33:07.27 27:58:05.0 | 9.1 | 03:33:07.5902 27:58:05.840 | 4.3 | 0.053 | |
| 095 | LESS J033241.7275846 | 03:32:41.74 27:58:46.1 | 9.2 | 03:32:41.2330 27:58:41.239 | 8.3 | (0.062) | |
| 097 | LESS J033313.7273803 | 03:33:13.65 27:38:03.4 | 9.2 | ||||
| 099 | LESS J033251.4275536 | 03:32:51.45 27:55:36.0 | 9.2 | ||||
| 100 | LESS J033111.3280006∗ | 03:31:11.32 28:00:06.2 | 8.8 |
| ID | SMG name | Submm position | 5.8-m position | 5.8-m flux | Offset | ||
|---|---|---|---|---|---|---|---|
| () () | (arcsec) | () () | (Jy) | (arcsec) | |||
| 104 | LESS J033258.5273803 | 03:32:58.46 27:38:03.0 | 9.4 | 03:32:58.2588 27:38:11.522 | 8.9 | 0.108 | |
| 03:32:57.8215 27:37:59.117 | 9.3 | 0.119 | |||||
| 105 | LESS J033115.8275313 | 03:31:15.78 27:53:13.1 | 9.0 | 03:31:15.4680 27:53:11.450 | 4.5 | 0.047 | |
| 106 | LESS J033140.1275631 | 03:31:40.09 27:56:31.4 | 9.4 | 03:31:40.1741 27:56:22.412 | 9.1 | 0.023 | |
| 107 | LESS J033130.8275150 | 03:31:30.85 27:51:50.9 | 9.4 | 03:31:30.5506 27:51:58.716 | 8.8 | (0.095) | |
| 109 | LESS J033328.1274157 | 03:33:28.08 27:41:57.0 | 9.5 | 03:33:28.0061 27:42:02.408 | 5.5 | 0.053 | |
| 03:33:28.5086 27:41:50.420 | 8.7 | 0.116 | |||||
| 110 | LESS J033122.6275417 | 03:31:22.64 27:54:17.2 | 9.4 | 03:31:22.6330 27:54:17.014 | 0.2 | 0.000 | |
| 112 | LESS J033249.3273112 | 03:32:49.28 27:31:12.3 | 9.0 | 03:32:48.8558 27:31:12.868 | 5.7 | 0.021 | |
| 113 | LESS J033236.4275845 | 03:32:36.42 27:58:45.9 | 9.5 | ||||
| 115 | LESS J033349.7274239 | 03:33:49.71 27:42:39.2 | 8.9 | 03:33:49.6663 27:42:34.067 | 5.2 | 0.053 | |
| 116 | LESS J033154.4274525 | 03:31:54.42 27:45:25.5 | 9.7 | ||||
| 119 | LESS J033256.5280319 | 03:32:56.51 28:03:19.1 | 9.7 | ||||
| 121 | LESS J033333.3273449 | 03:33:33.32 27:34:49.3 | 9.7 | ||||
| 123 | LESS J033330.9275349 | 03:33:30.88 27:53:49.3 | 9.8 | ||||
| 124 | LESS J033203.6273605 | 03:32:03.59 27:36:05.0 | 10.0 | 03:32:03.0814 27:36:01.278 | 7.7 | 0.109 | |
| 03:32:04.0070 27:36:05.810 | 5.6 | (0.090) | |||||
| 125 | LESS J033146.0274621 | 03:31:46.02 27:46:21.2 | 9.9 | ||||
| 126 | LESS J033209.8274102 | 03:32:09.76 27:41:02.0 | 9.9 | 03:32:09.6084 27:41:06.983 | 5.4 | 0.051 |
In the following we try and identify counterparts from the radio and MIPS catalogues. We then use the properties of these counterparts to select the parameter space in IRAC colour and flux to identify potential counterparts to the radio and MIPS-undetected sources.
The results of our counterpart search are given in Tables 1 (radio) and 4 (24 m) where we include the position and flux of the counterpart as well as its radial offset from the submm source and the value of the search radius. The first column also gives the ‘ID’ of each SMG, an integer describing the position of each in a ranked list of decreasing SNR (as they appear in each table). For brevity, we will often refer to an individual source using this integer, e.g. LESS001; the integers also refer to the SNR-ranked list in Weiß et al. (2009). Postage stamp maps with a size of arcsec2 centred on the submm position are shown in Fig. 11. We show radio contours superimposed on IRAC 3.6-m greyscales. The IRAC images are taken from the SIMPLE Legacy Program (P.I.: P. van Dokkum) and where the SMGs do not lie fully within the SIMPLE coverage we replace the images with ones from SWIRE; LESS046 also has its FIDEL image replaced with one from SWIRE. We also show the LESS contours, overplotted on 24-m greyscales, in a separate panel.
The criteria for considering a potential counterpart as a secure identification is that (Tables 1 and 4). These sources have their values of given in boldface in Tables 1 and 4, and their positions are marked in Fig. 11. Of the 126 submm sources, 47 have at least one radio and 39 at least one 24-m counterpart with ; together they produce 60 robust counterparts. Of these, two (LESS063 and LESS118) are extremely weak (30 Jy, deboosted), have low values of (by virtue of lying very close to the submm position), but do not appear to have associated MIPS or IRAC emission. It is impossible to rule them out as genuine counterparts, but we have highlighted them in Table 1 ( contained within square parentheses).
As we have both radio and 24-m data for most sources, the combination of the results for each SMG enables us to identify additional reliable counterparts. For weak sources, the presence of coincident emission in both wavebands makes it more likely that the source is real, but for any source the presence of emission at radio wavelengths and 24-m makes it more likely that the galaxy is the correct identification. Individual sources with (i.e. still low enough to indicate a likely counterpart) have their value of within parentheses, but where coincident radio and 24-m components have we consider this to be a secure identification and present the value of in parenthesised boldface. Two more SMGs gain robust counterparts in this way, LESS036 and LESS060.
In summary, we find statistically robust counterparts to 62 (49 per cent) of the SMGs using the radio and 24-m data (Table 9). We now go on to extend our sample of identified SMGs by exploiting the very deep IRAC observations of this field.
5 IRAC counterparts
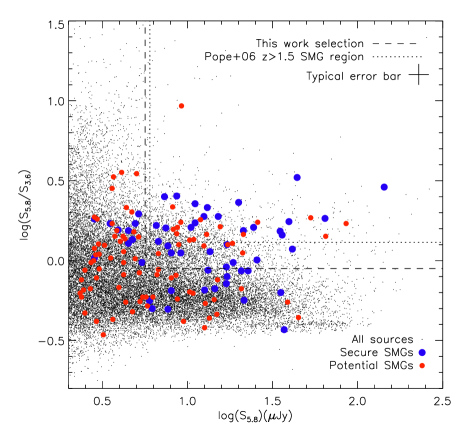
To identify counterparts to submillimetre sources without secure radio or MIPS identifications we employ 3.6- and 5.8-m Spitzer IRAC data. Fig. 3 shows the 3.6- and 5.8-m colour-flux diagram for sources in the ECDFS, with secure radio- or MIPS-identified SMG counterparts highlighted. An IRAC counterpart to every MIPS and radio robust identification was found by examining each by eye, taking into account any radio emission and optical sources in the region under consideration (from MUSYC imaging). It is apparent from Fig. 3 that SMGs are typically redder than the field population and it is this property we will exploit to identify counterparts to some unidentified SMGs.
To decide on our colour and flux selection limits we exploit the radio- and MIPS-identified SMGs to determine limits which balance completeness and purity. We arbitrarily chose a limit of 10 per cent contamination (within the 3- search radii of SMGs) and maximise the completeness of recovery. Based upon these requirements we select SMG counterparts with and , returning 78 per cent of the secure radio and MIPS SMG counterparts. Also shown on Fig. 3 are the colour-magnitude cuts of Pope et al. (2006), the colour division of which separates SMGs into low and high redshift samples (SMGs redder than the colour limit correspond to ).
We apply this colour selection to the 64 error circles of SMGs lacking secure radio or MIPS counterparts and calculate a value of in a similar way to the radio and 24-m sources described in Section 3 (Table 7) – Monte Carlo simulations again show that the values of are reliable. In total, we identify 17 additional SMGs with robust counterparts. Four have multiple robust identifications and in one case (LESS074) the second counterpart results from there being a probable () in both the IRAC and radio data. With the addition of the IRAC counterparts, a total of 79 (63 per cent) of the SMGs have at least one robust counterpart. The details of the 79 robust counterparts are shown in Table 9, including the deboosted submm, 24-m and deboosted radio flux densities.
6 Analysis and Discussion
Before the addition of the IRAC results, compared to some other studies (Ivison et al., 2002, 2005; Pope et al., 2006; Ivison et al., 2007) the fraction of SMGs with a secure identification (49 per cent) is a little low. For example, in the SCUBA HAlf-Degree Extragalactic Survey (SHADES; Coppin et al., 2006) 79 out of 120 SMGs (66 per cent) were found to have secure counterparts (Ivison et al., 2007) and in the Hubble Deep Field–North (HDF–N) Pope et al. (2006) claim secure counterparts for 60 per cent of their sample. However, the fraction of SMGs with robust counterparts is clearly a function of the sensitivity of the radio and mid-IR data and we note that in the case of the HDF–N (5.3 Jy beam-1 – Biggs & Ivison 2006) and the Lockman Hole portion of SHADES (4.2 Jy beam-1 – Biggs & Ivison 2006), the radio maps were more sensitive than that in the ECDFS (6.5 Jy beam-1 – Miller et al. 2008). Assuming no cosmic variance and an integral source count slope of , the increase in sensitivity of the Lockman Hole radio map compared to that of the ECDFS produces a density of sources that is higher by almost a factor of two at the parts of the map corresponding to that sensitivity. However, we also note that the radio map of the Subaru XMM-Newton Deep Field (SXDF) that was used to find counterparts to that portion of SHADES had a similar depth to the ECDFS map (6.3 Jy beam-1), but produced a significantly greater fraction of SMGs with robust IDs, 58 per cent (Ivison et al., 2007).
We now go on to consider other reasons why true counterparts might be missed, beginning by noting that a small number (5) of the SMG detections are likely to be spurious (Weiß et al., 2009), as is common in surveys of this kind. Other possible reasons include:
-
1.
The counterpart lies outside the search radius
-
2.
Multiple SMGs have become blended due to the low resolution of the submm data.
6.1 Search radius and radio astrometry
As it is necessary to impose a limit to how far you search from a SMG position, and because choosing too large a radius increases the chances of finding unrelated counterparts whilst reducing the significance of genuine associations – it is likely that a small number of SMGs will not have been searched out to a sufficient radius to locate their counterpart. We have estimated that this will amount to 1–2 counterparts, but if we have under-estimated the size of the submm positional errors then this number will be larger. Taking SHADES as an example, Ivison et al. (2007) estimated that 5 per cent of counterparts would be missed in this manner and recent Submillimeter Array (SMA) observations with sub-arcsec accuracy have identified one example of this, SXDF850.06 lying just outside the Ivison et al. (2007) 8-arcsec search radius (Hatsukade et al., 2010).

Errors in the absolute astrometric accuracy of the MIPS and radio catalogues will also affect our ability to reliably determine counterparts. In Fig. 4 we show the differences between the Right Ascension and Declination for each counterpart that has emission at both 24-m and 21 cm. There is a clear offset between the two which has a median value of arcsec in Right Ascension and arcsec in Declination (MIPS radio). In order to improve the determination of this offset, we have used topcat (Taylor, 2005) to measure the median offset between the radio and MIPS catalogues by finding all unique matches within 2 arcsec. These 2019 matches are also plotted in Fig. 4 and have similar median offsets of arcsec in Right Ascension and arcsec in Declination.
Applying these more accurate offsets during the -statistic procedure as if they purely originated from the MIPS data reduces the number of robust counterparts by one, whereas assuming that the origin lies with the radio data increases the number of robust counterparts by one. Hence, the effect of the offsets is actually rather small and the additional radio counterpart is found anyway without the offsets applied due to it having in both the MIPS and radio. As a result, we have not taken the offsets into account when calculating the values of and the radio positions given in Table 1 have not been corrected for them.
As a test of our search radius strategy, we have examined the distribution of the radial offsets between the radio and 24-m secure counterparts and their SMG. If these truly originate from random uncertainties in the positions of the SMGs then they should conform to a Rayleigh distribution. In addition, we note that this should only be the case if the offsets are calculated as a multiple of the 1- SMG position uncertainty. Fig. 5 shows the positional offsets for both the radio and MIPS data in bins of 0.5 , with a fitted Rayleigh distribution overplotted. Writing this as , the width parameter is equal to the one-dimensional standard deviation of the positional errors. As we are plotting these in units of standard deviations then by definition this parameter (which is also equal to the mode of the distribution) should be equal to unity.
In the case of the MIPS data, the fit to the data is excellent with a reduced chi-square of 0.7 and a value for the width parameter, of . This strongly suggests that we have correctly calculated the magnitude of the positional errors and that our assumption that the offsets originate predominantly in the submm source position is also correct. The fit in the case of the radio data is formally very similar, but has a larger value of , a 2.3- deviation from the expected value of 1.0. Given that the 24-m data give the expected answer, this points to something special about the radio positional offsets, separate from the astrometric error already identified (which has been removed when calculating the offsets displayed in Fig. 5). If the larger offset in the radio is not a statistical fluke, then it points to an additional, systematic offset between the radio and the MIPS/submm position, perhaps due to emission from more extended or structured radio emission e.g. radio jets.


6.2 Blending of SMGs
The second potential cause of the low identification rate is that the SMG, instead of being a single unresolved source, may actually be a blend of several sources. This is more likely to be the case here than many other submm surveys due to the slightly larger beamsize, 19 arcsec compared to the 14 arcsec of the JCMT/SCUBA and the 11 arcsec of the IRAM 30-m/MAMBO (we note, however, that the lack of chopping for LABOCA reduces the possibility of confusion from that source in these maps). The problem is that the -statistic implicitly assumes that the submm position corresponds to a single source; if multiple sources are responsible for the submm emission, the SMG centroid will be offset from the genuine counterparts which are less likely to fall within the search radius.
A visual inspection of the plots in Fig. 11 makes it clear that this is often the case. One noteworthy case is the chain of three MIPS galaxies visible under LESS004. This source is clearly elongated along the axis of the galaxy chain and as two of the galaxies are detected in the radio map they presumably both contribute to the submm emission. As the resolution of the submm map is not sufficient to separate the individual sources it has instead been classified as a single source with its centroid lying in between the two radio sources. This places it close, but not close enough, to the third galaxy which is also radio quiet. We further note that this chain of galaxies continues to the south where it blends into another submm source, LESS026.
The use of a SNR-dependent search radius makes it more likely that sources that are blended are not robustly identified as the summed submm flux density causes a smaller value of to be used than if a constant radius were adopted. This alternative approach often chooses a search radius that is large enough to maximise the probability of detecting counterparts to the weaker SMGs (of which the median submm flux density is often representative) that have larger positional errors. However, the cost of this is that higher values of are measured for unblended, brighter SMGs which results in potentially less counterparts being identified.
Finally, in forming the -statistic, we have only included radio and MIPS sources with (the IRAC sources were all much more significantly detected due to all sources being brighter than 5.6 Jy). Below these SNR thresholds the detections become less reliable (‘sources’ are increasingly likely to be noise spikes, residual sidelobes, map artefacts, etc.) and automated source-finding algorithms such as sad, used to form the catalogues, have greater difficulty in producing reliable fits to genuine sources, which are therefore rejected. A detailed examination of the radio and mid-IR sources shown in Fig. 11 can help to identify such cases, especially where there is coincident emission in both wavebands, and in Appendix A we give a brief description of any noteworthy SMGs. This includes likely blends of individual submm sources and possible counterparts that lie outside the search radius (along with their fluxes and positions).
Fainter SMGs should, broadly speaking, also be fainter in the radio and mid-IR (different spectral properties or their redshift dependency will of course weaken the correlation). Indeed, it is very apparent from Tables 1 and 4 that fewer SMGs have secure counterparts as you move to the bottom of the tables, i.e. towards decreasing SNR. This is illustrated in Fig. 6 where we plot the cumulative recovery fraction as a function of SNR (which, given the uniform noise in the LABOCA map, is strongly correlated with submm flux). At high SNR there are few sources and the trend is very noisy, but as the SNR declines below six there is a clear trend towards a declining fraction of SMGs with secure counterparts, as expected.

Of the five SMGs with the highest SNR, only one has a radio source within the search radius. One of these, LESS004, can be seen in Fig. 11 to clearly be a blend of multiple sources. For the other sources, no such blend is obvious. Most striking is the brightest SMG in the LESS sample, LESS001, for which there is no radio emission at all and only extremely faint mid-IR emission within the search radius (although this is classed as the counterpart to the SMG). Blends do, of course, contribute doubly to this effect – their flux density is over-estimated and the additional positional offsets render the identification of any counterpart more difficult. However, it is also possible that the reason for the lack of counterpart emission is due to the source lying at very high redshift (e.g. Ivison et al., 2002; Younger et al., 2007; Dannerbauer et al., 2008) or the dust in the galaxy being colder than average (Chapman et al., 2005).
6.3 Redshift distribution
Whilst the flux density of an SMG is essentially independent of redshift (up to ), both the radio and IR emission will fade with increasing distance. The median spectroscopic redshift of radio-identified SMGs is 2.2 (Chapman et al., 2005) although the requirement that an accurate radio position be available (in order to place the slit accurately for the spectroscopic observations – see Ivison et al. 2005) may skew the redshift distribution towards a lower range. An increasing number of SMGs have been identified at (Schinnerer et al., 2008; Daddi et al., 2009a, b; Knudsen et al., 2010), including one from this survey with a spectroscopically-determined redshift of 4.76 (Coppin et al., 2009; Coppin et al., 2010): LESS073 (with in Table 1).
We can investigate the redshift distribution of the radio-detected secure counterparts by utilising the radio-to-submm spectral index relation (1.4:350 GHz, ) of Carilli & Yun (2000, hereafter CY00) who characterise the variation of with using the average of 17 template SEDs. The resulting redshifts are therefore averaged over various source properties including radio spectral index, , submm spectral index, and dust temperature. In order to make our redshift estimates as reliable as possible, we have only included sources where the robust counterpart consists of only a single radio component. The resulting 55 redshifts are plotted in Fig. 7 and listed in Table 9; the 1- errors include the uncertainties in the fluxes and the spread in the submm spectral index.
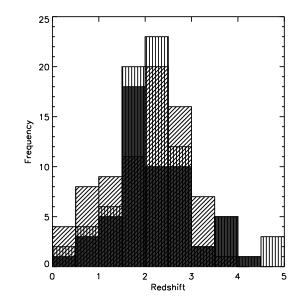

Our distribution is similar to those found by Chapman et al. (2005) and Wardlow et al. (2010) which are also plotted in Fig. 7. The median of our redshift distribution is (1- errors), identical to both the spectroscopically-derived median for the radio-identified SMGs of Chapman et al. (2005) and that measured by Wardlow et al. (2010) using 17-band optical to MIR photometry; Aretxaga et al. (2007) measure median redshifts of between 2.2 and 2.7 for the two SHADES fields. The Wardlow et al. (2010) study is particularly relevant as it uses the sample of robust counterparts identified in this work, although it is not confined to those with a radio detection. A comparison of the redshifts measured here and by Wardlow et al. (2010) is shown in Fig. 8.
There are a number of significant outliers, perhaps the most obvious of which is LESS020, for which the CY00 technique gives a much lower value of compared to 2.8 from the full photometric analysis. This is by far the brightest of the radio counterparts ( mJy) and its radio flux is most likely boosted by a radio-loud AGN for which the SED templates of CY00 do not apply. The other most prominent outlier is LESS006 for which there is a large offset between the 24-m and radio positions and where the radio emission lies predominantly between two peaks in the 3.6-m image (Fig. 11). Based on the large ( arcsec) positional offsets, Wardlow et al. (2010) suggest that this SMG is being gravitationally lensed by the low-redshift () optical/MIR galaxy and the much larger redshift () measured based on the radio/submm flux would support this conclusion. Excluding these two outliers results in a Spearman rank correlation coefficient of 0.43 which, for 48 common redshifts, easily exceeds the critical value (0.24) for 95 per cent significance and allows us to reject the hypothesis that there is no correlation.
The excellent agreement in the measurement of the median redshift of the SMG population, using three different techniques, is very encouraging and strongly argues that the peak in SMG activity was at or close to . However, in all three cases, the majority of the redshifts were made possible due to the presence of radio emission, in the Chapman et al. (2005) case as an indicator of where to place the spectroscopic slit. Because of the fading of radio emission with increased distance (positive -correction) this means that many of the SMGs in these samples which are not detected in the radio, the majority of which remain unidentified, are likely to be biased towards higher redshifts. Indeed, the majority of the LESS sample are undetected in the radio and although some of these will be undetected because they are unusually cold, overall we expect this radio-faint sub-sample to have a redshift distribution skewed to larger values than the radio-detected SMGs. It is thus possible that the overall median redshift of our SMG sample is higher than 2.2 although we note that there is an additional bias in the other direction – the IRAC counterparts are preferentially located at high redshift as they have weak radio emission and lie in the high-redshift quadrant of the Pope et al. (2006) diagram (Fig. 3).
The use of deboosted radio flux densities also has the effect of increasing the redshifts measured using the CY00 technique. This is demonstrated in Fig. 9 where we plot the CY00 redshifts measured using both deboosted and un-deboosted radio flux densities. The increase due to the deboosting is most pronounced at the highest redshifts which, for a given submm flux density, correspond to the weaker radio sources that are most affected by flux boosting. Whilst the majority of the SMGs have , the maximum increase is , this corresponding to the only source for which we have a spectroscopic redshift (LESS073 at ). The CY00 redshift is 3.7, a considerable improvement on the value of 3.2 that would otherwise have been measured without the use of deboosted radio fluxes. Overall, the combined effect is to increase the median redshift of the SMGs by 0.2 i.e. from 2.0 to 2.2.


In Fig. 10 we have plotted deboosted submm flux density as a function of Carilli–Yun redshift. Also shown are the median redshifts of the data in four separate flux-density bins. This reveals an increase in the average flux density with redshift, an effect previously noted by Ivison et al. (2002), Pope et al. (2005) and Younger et al. (2008). The 870-m flux density of Arp 220 is also plotted in Fig. 10, as a function of redshift, to illustrate that the apparent evolution of SMG luminosity with redshift (note that Wardlow et al. (2010) do not find evidence for such an effect) is unlikely to be caused by their spectral energy distributions, or by cosmology. The Spearman rank correlation coefficient, with LESS020 and LESS006 again excluded, is equal to 0.39 which allows us to reject the null hypothesis with 95 per cent confidence (the critical value for 53 pairs is equal to 0.23).
The exact form of the evolution of SMGs with redshift remains unclear (e.g. Chapin, Hughes & Aretxaga, 2009), particularly whether it is predominantly in luminosity, density or both, but there are signs that luminosity evolution plays a role. Wall et al. (2008) have even suggested that there are in fact two populations of SMGs, separated by luminosity, and that these evolve differently. It is therefore tempting to ascribe the lack of detections of the brightest SMGs as being due to their high redshifts. However, it is equally possible that the brightest galaxies arise due to confusion from clustering in the brightest sources, or from temperature and luminosity evolution which results in them being high-luminosity, low-temperature galaxies at low redshift.
| SMG | 870 m | 24 m | 21 cm | SMG | 870 m | 24 m | 21 cm | ||
|---|---|---|---|---|---|---|---|---|---|
| (mJy) | (Jy) | (Jy) | (mJy) | (Jy) | (Jy) | ||||
| 001 | 056 | ||||||||
| 002 | 057 | ||||||||
| 059 | |||||||||
| 003 | 060 | ||||||||
| 006 | 062 | ||||||||
| 007 | 063 | ||||||||
| 009 | 064 | ||||||||
| 010 | 066 | ||||||||
| 067 | |||||||||
| 070 | |||||||||
| 011 | 072 | ||||||||
| 012 | 073 | ||||||||
| 014 | 074 | ||||||||
| 015 | |||||||||
| 016 | 075 | ||||||||
| 017 | 076 | ||||||||
| 018 | 078 | ||||||||
| 019 | 079 | ||||||||
| 081 | |||||||||
| 020 | 084 | ||||||||
| 022 | 087 | ||||||||
| 024 | |||||||||
| 025 | 088 | ||||||||
| 027 | 094 | ||||||||
| 096 | |||||||||
| 029 | |||||||||
| 031 | 098 | ||||||||
| 034 | 101 | ||||||||
| 035 | 102 | ||||||||
| 036 | 103 | ||||||||
| 037 | 105 | ||||||||
| 039 | 106 | ||||||||
| 040 | 108 | ||||||||
| 041 | 109 | ||||||||
| 043 | 110 | ||||||||
| 044 | 111 | ||||||||
| 045 | 112 | ||||||||
| 046 | 114 | ||||||||
| 047 | 115 | ||||||||
| 048 | 117 | ||||||||
| 049 | 118 | ||||||||
| 120 | |||||||||
| 050 | 122 | ||||||||
| 126 | |||||||||
| 054 |
7 Conclusions
Using a probabilistic approach, we have attempted to identify reliable counterparts to the 126 SMGs recently discovered at a wavelength of 870 m in the LESS survey of the ECDFS using the LABOCA camera on the APEX telescope (Weiß et al., 2009). Taking values of the corrected Poissonian probability (the so-called -statistic, ) that are less than or equal to 0.05 to indicate a secure identification, i.e. a highly unlikely chance coincidence, we have found reliable radio and/or 24-m counterparts to 62 SMGs. A further 17 SMGs were identified using IRAC sources that fell within a colour-flux cut that was constructed from the results of the radio and MIPS analysis. In contrast to most previous work of a similar nature, we have based our identifications on rigorously constructed catalogues of 1.4-GHz and MIPS/IRAC sources.
In total we find that 79 out of the 126 SMGs have secure counterparts, an identification fraction of 63 per cent. This is not as high as some other studies, partly due to the relatively shallow radio map and somewhat larger submm beam. In several cases it is obvious that multiple submm emitters are blended and consequently difficult to identify.
Finally, in creating our radio catalogue we have performed simulations in order to correct the flux densities for ‘flux boosting’. This has particular relevance to the calculation of source redshifts based on the radio-submm spectral index, a technique which often uses de-boosted submm fluxes, but ignores the corresponding effect in the radio. With the systematic shift towards lower redshifts removed, the median redshift of the radio-detected SMGs in our sample is (1- errors). This is identical to that found by both Chapman et al. (2005) and Wardlow et al. (2010), the latter using the sample of SMGs identified in this paper, but using a different technique (optical to mid-IR multi-band photometry) for measuring the source redshifts. The median redshift of the full sample is likely to be rather higher as the unidentified SMGs by definition have weak radio emission.
The current generation of submm cameras produce maps with such poor resolution that a probabilistic approach to identifying submm galaxies is inevitable. Ideally, identification work such as that presented in this paper would be done with telescopes offering sub-arcsecond resolution, such as the IRAM Plateau de Bure Interferometer and the Submillimeter Array (SMA). However, due to their limited sensitivity (small numbers of antennas and relatively poor atmospheric transmission), many hours are required for a reliable detection of a typical submm galaxy. In the future, the Atacama Large Millimeter/Submillimeter Array (ALMA) will revolutionise the study of high-redshift star formation with its order of magnitude increase in sensitivity and imaging fidelity which will make pinpointing the origin of the submm emission in surveys such as LESS a relatively trivial exercise, requiring only minutes per source to achieve a high dynamic range image.
Acknowledgments
The authors would like to acknowledge the comments provided by the anonymous referee that significantly improved the manuscript. The National Radio Astronomy Observatory is a facility of the National Science Foundation operated under cooperative agreement by Associated Universities, Inc. This work is based in part on observations made with the Spitzer Space Telescope, which is operated by the Jet Propulsion Laboratory, California Institute of Technology under a contract with NASA. We thank Jacqueline Monkiewicz and the FIDEL team for the Spitzer 24-m data reductions. JLW acknowledges the receipt of a STFC studentship. IRS acknowledges support from the STFC. This research has made use of the NASA/IPAC Extragalactic Database (NED) which is operated by the Jet Propulsion Laboratory, California Institute of Technology, under contract with the National Aeronautics and Space Administration. ADB would like to thank Phillip Helbig for the use of his cosmology code.
References
- Aretxaga et al. (2007) Aretxaga I. et al., 2007, MNRAS, 379, 1571
- Austermann et al. (2009) Austermann J. E. et al., 2009, MNRAS, 393, 1573
- Barger et al. (1998) Barger A. J., Cowie L. L., Sanders D. B., Fulton E., Taniguchi Y., Sato Y., Kawara K., Okuda H., 1998, Nat, 394, 248
- Beckwith et al. (2006) Beckwith S. V. W. et al., 2006, AJ, 132, 1729
- Bertin & Arnouts (1996) Bertin E., Arnouts S., 1996, A&AS, 117, 393
- Bertoldi et al. (2007) Bertoldi F. et al., 2007, ApJS, 172, 132
- Biggs & Ivison (2006) Biggs A. D., Ivison R. J., 2006, MNRAS, 371, 963
- Bondi et al. (2003) Bondi M. et al., 2003, A&A, 403, 857
- Browne & Cohen (1978) Browne I. W. A., Cohen A. M., 1978, MNRAS, 182, 181
- Carilli & Yun (1999) Carilli C. L., Yun M. S., 1999, ApJ, 513, L13
- Carilli & Yun (2000) Carilli C. L., Yun M. S., 2000, ApJ, 530, 618
- Chapin et al. (2009) Chapin E. L., Hughes D. H., Aretxaga I., 2009, MNRAS, 393, 653
- Chapin et al. (2009) Chapin E. L. et al., 2009, MNRAS, 398, 1793
- Chapman et al. (2005) Chapman S. C., Blain A. W., Smail I., Ivison R. J., 2005, ApJ, 622, 772
- Chary et al. (2004) Chary R. et al., 2004, ApJS, 154, 80
- Condon (1992) Condon J. J., 1992, ARA&A, 30, 575
- Coppin et al. (2006) Coppin K. et al., 2006, MNRAS, 372, 1621
- Coppin et al. (2010) Coppin K. E. K. et al., 2010, ArXiv e-prints
- Coppin et al. (2009) Coppin K. E. K. et al., 2009, MNRAS, 395, 1905
- Cowie et al. (2009) Cowie L. L., Barger A. J., Wang W., Williams J. P., 2009, ApJ, 697, L122
- Daddi et al. (2009a) Daddi E., Dannerbauer H., Krips M., Walter F., Dickinson M., Elbaz D., Morrison G. E., 2009a, ApJ, 695, L176
- Daddi et al. (2009b) Daddi E. et al., 2009b, ApJ, 694, 1517
- Dannerbauer et al. (2004) Dannerbauer H., Lehnert M. D., Lutz D., Tacconi L., Bertoldi F., Carilli C., Genzel R., Menten K. M., 2004, Astrophysical Journal, 606, 664
- Dannerbauer et al. (2008) Dannerbauer H., Walter F., Morrison G., 2008, ApJ, 673, L127
- Downes et al. (1986) Downes A. J. B., Peacock J. A., Savage A., Carrie D. R., 1986, MNRAS, 218, 31
- Downes et al. (1999) Downes D. et al., 1999, A&A, 347, 809
- Eales et al. (1999) Eales S., Lilly S., Gear W., Dunne L., Bond J. R., Hammer F., Le Fèvre O., Crampton D., 1999, ApJ, 515, 518
- Elbaz et al. (2002) Elbaz D., Cesarsky C. J., Chanial P., Aussel H., Franceschini A., Fadda D., Chary R. R., 2002, A&A, 384, 848
- Fazio et al. (2004) Fazio G. G. et al., 2004, ApJS, 154, 10
- Fixsen et al. (1998) Fixsen D. J., Dwek E., Mather J. C., Bennett C. L., Shafer R. A., 1998, ApJ, 508, 123
- Frayer et al. (2006) Frayer D. T. et al., 2006, ApJ, 647, L9
- Frayer et al. (2009) Frayer D. T. et al., 2009, AJ, 138, 1261
- Gear et al. (2000) Gear W. K., Lilly S. J., Stevens J. A., Clements D. L., Webb T. M., Eales S. A., Dunne L., 2000, MNRAS, 316, L51
- Giacconi et al. (2001) Giacconi R. et al., 2001, ApJ, 551, 624
- Giavalisco et al. (2004) Giavalisco M. et al., 2004, ApJ, 600, L93
- Greve et al. (2008) Greve T. R., Pope A., Scott D., Ivison R. J., Borys C., Conselice C. J., Bertoldi F., 2008, MNRAS, 389, 1489
- Greve et al. (2010) Greve T. R. et al., 2010, ApJ, 719, 483
- Güsten et al. (2006) Güsten R., Nyman L. Å., Schilke P., Menten K., Cesarsky C., Booth R., 2006, A&A, 454, L13
- Hatsukade et al. (2010) Hatsukade B. et al., 2010, ApJ, 711, 974
- Hinshaw et al. (2009) Hinshaw G. et al., 2009, ApJS, 180, 225
- Holland et al. (1999) Holland W. S. et al., 1999, MNRAS, 303, 659
- Hughes et al. (1998) Hughes D. H. et al., 1998, Nat, 394, 241
- Ibar et al. (2009) Ibar E., Ivison R. J., Biggs A. D., Lal D. V., Best P. N., Green D. A., 2009, MNRAS, 397, 281
- Iono et al. (2006) Iono D. et al., 2006, ApJ, 640, L1
- Ivison et al. (2007) Ivison R. J. et al., 2007, MNRAS, 380, 199
- Ivison et al. (2002) Ivison R. J. et al., 2002, MNRAS, 337, 1
- Ivison et al. (2008) Ivison R. J. et al., 2008, MNRAS, 390, 1117
- Ivison et al. (2000) Ivison R. J., Smail I., Barger A. J., Kneib J.-P., Blain A. W., Owen F. N., Kerr T. H., Cowie L. L., 2000, MNRAS, 315, 209
- Ivison et al. (2005) Ivison R. J. et al., 2005, MNRAS, 364, 1025
- Ivison et al. (1998) Ivison R. J., Smail I., Le Borgne J.-F., Blain A. W., Kneib J.-P., Bezecourt J., Kerr T. H., Davies J. K., 1998, MNRAS, 298, 583
- Ivison et al. (2010) Ivison R. J. et al., 2010, A&A, 518, L35
- Knudsen et al. (2010) Knudsen K. K., Kneib J., Richard J., Petitpas G., Egami E., 2010, ApJ, 709, 210
- Lehmer et al. (2005) Lehmer B. D. et al., 2005, ApJS, 161, 21
- Lonsdale et al. (2003) Lonsdale C. J. et al., 2003, PASP, 115, 897
- Luo et al. (2008) Luo B. et al., 2008, ApJS, 179, 19
- Makovoz et al. (2002) Makovoz D., Moshir M., Laher R., Marsh K., 2002, in Astronomical Society of the Pacific Conference Series, Vol. 281, D. A. Bohlender, D. Durand, & T. H. Handley , ed, Astronomical Data Analysis Software and Systems XI, p. 417
- Miller et al. (2008) Miller N. A., Fomalont E. B., Kellermann K. I., Mainieri V., Norman C., Padovani P., Rosati P., Tozzi P., 2008, ApJS, 179, 114
- Owen & Morrison (2008) Owen F. N., Morrison G. E., 2008, AJ, 136, 1889
- Pope et al. (2005) Pope A., Borys C., Scott D., Conselice C., Dickinson M., Mobasher B., 2005, MNRAS, 358, 149
- Pope et al. (2006) Pope A. et al., 2006, MNRAS, 370, 1185
- Rieke et al. (2004) Rieke G. H. et al., 2004, ApJS, 154, 25
- Schinnerer et al. (2008) Schinnerer E. et al., 2008, ApJ, 689, L5
- Scott et al. (2008) Scott K. S. et al., 2008, MNRAS, 385, 2225
- Scott et al. (2010) Scott K. S. et al., 2010, MNRAS, 405, 2260
- Seymour et al. (2004) Seymour N., McHardy I. M., Gunn K. F., 2004, MNRAS, 352, 131
- Siringo et al. (2009) Siringo G. et al., 2009, A&A, 497, 945
- Smail et al. (1997) Smail I., Ivison R. J., Blain A. W., 1997, ApJ, 490, L5
- Smail et al. (2000) Smail I., Ivison R. J., Owen F. N., Blain A. W., Kneib J., 2000, ApJ, 528, 612
- Surace et al. (2005) Surace J. A. et al., 2005, The SWIRE Data Release 2: Image Atlases and Source Catalogs for ELAIS-N1, ELAIS-N2, XMM-LSS, and the Lockman Hole, Technical report, Spitzer Science Centre
- Taylor (2005) Taylor M. B., 2005, in Astronomical Society of the Pacific Conference Series, Vol. 347, P. Shopbell, M. Britton, & R. Ebert , ed, Astronomical Data Analysis Software and Systems XIV, p. 29
- Wall et al. (2008) Wall J. V., Pope A., Scott D., 2008, MNRAS, 383, 435
- Wang et al. (2007) Wang W., Cowie L. L., van Saders J., Barger A. J., Williams J. P., 2007, ApJ, 670, L89
- Wardlow et al. (2010) Wardlow J. L. et al., 2010, MNRAS, submitted, astro-ph/1006.2137
- Weiß et al. (2009) Weiß A. et al., 2009, ApJ, 707, 1201
- Werner et al. (2004) Werner M. W. et al., 2004, ApJS, 154, 1
- Wilson et al. (2008) Wilson G. W. et al., 2008, MNRAS, 386, 807
- Younger et al. (2008) Younger J. D. et al., 2008, MNRAS, 387, 707
- Younger et al. (2007) Younger J. D. et al., 2007, ApJ, 671, 1531
Appendix A Detailed description of SMGs
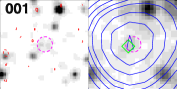
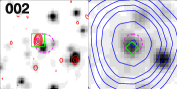
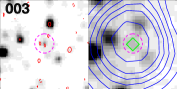

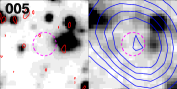
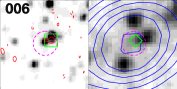
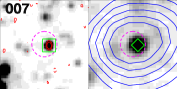
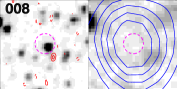
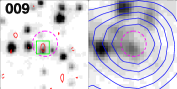
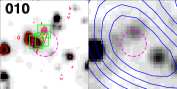
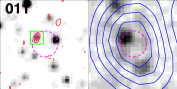
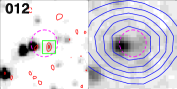
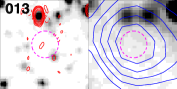
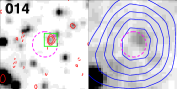
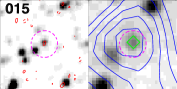
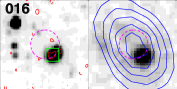
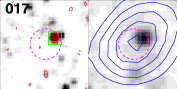
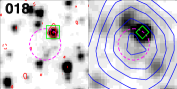
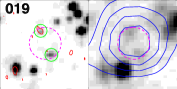
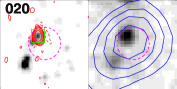
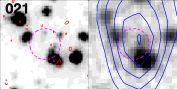
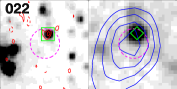
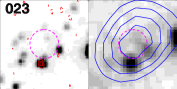
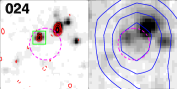
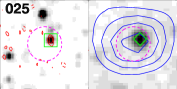
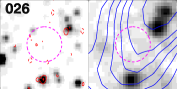
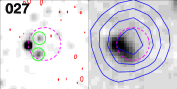
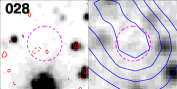
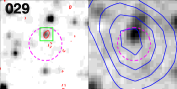
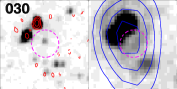
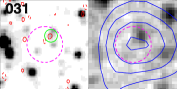
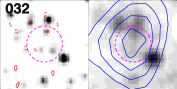
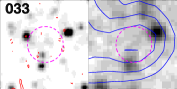
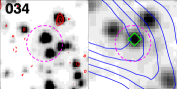

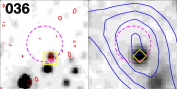
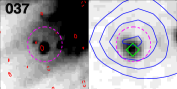
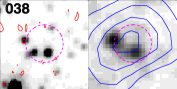
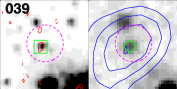
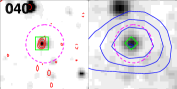
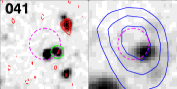
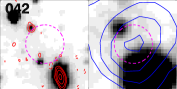
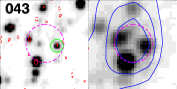
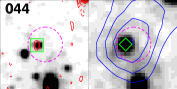
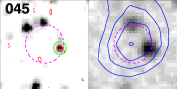
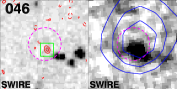
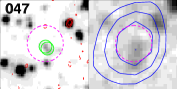
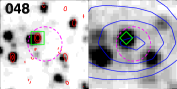
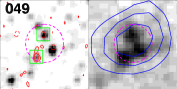
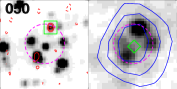
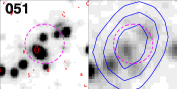
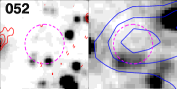
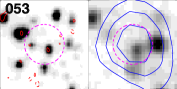
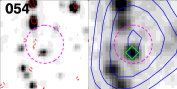
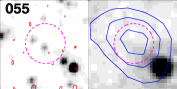
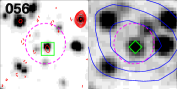
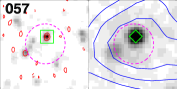

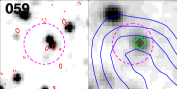
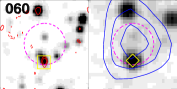
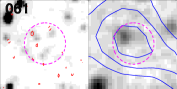
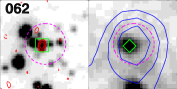
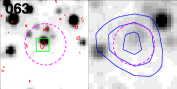

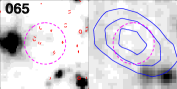
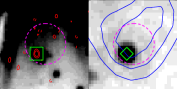
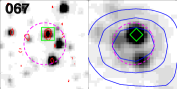
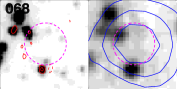
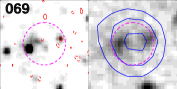

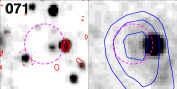
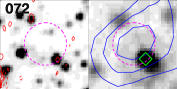
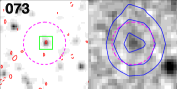
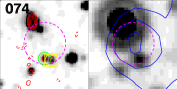
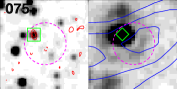
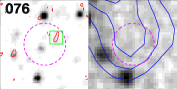
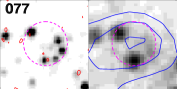
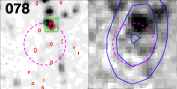
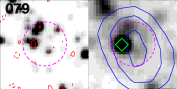
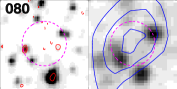
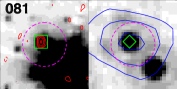
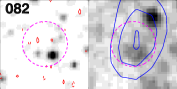
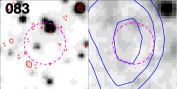
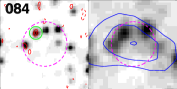
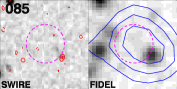
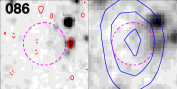
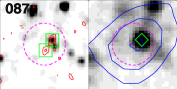
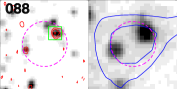
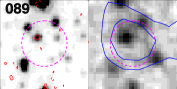
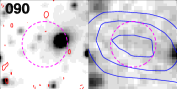
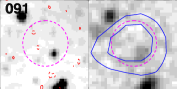
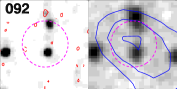
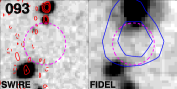
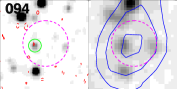
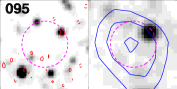
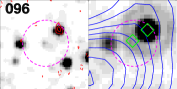
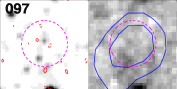
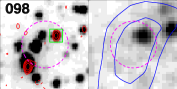

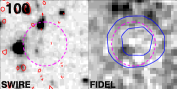
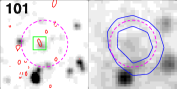
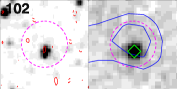
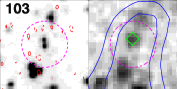
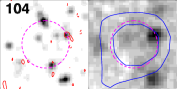
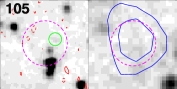
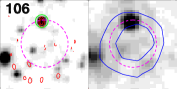
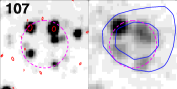
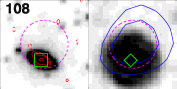
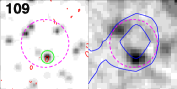
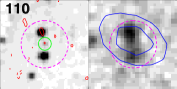
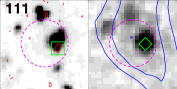
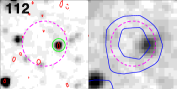
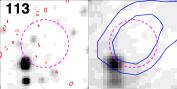
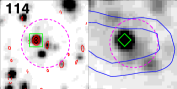
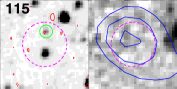
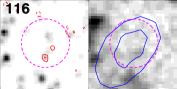
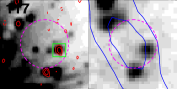
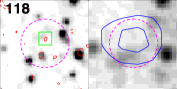
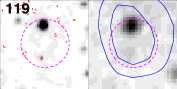
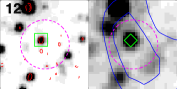
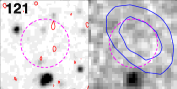
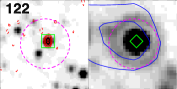
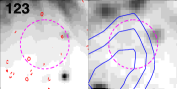
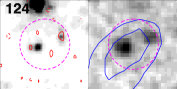
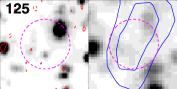
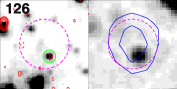
Here we give short descriptions of those SMGs that merit further discussion; postage stamp maps of each SMG are shown in Fig. 11.
-
(LESS001) LESS J033314.3275611 – the brightest of the SMGs has no nearby radio emission, but an extremely faint MIPS component (with associated IRAC emission) is classed as a robust counterpart.
-
(LESS002) LESS J033302.5275643 – high significance radio and 24-m counterparts, but their positions are not coincident. An extension of the 24-m emission passes under the radio source and the daophot catalogue has detected this as a weak source (SNR3.5); the redshift has been calculated assuming the weaker, but coincident, MIPS source is the correct counterpart to the radio. There is also an IRAC source at this position.
-
(LESS004) LESS J033136.0275439 – the -statistic finds nothing, but this is likely due to the catalogued SMG being a blend of up to four sources, three of which have similar brightnesses. The northernmost of these three is coincident with a 76 Jy radio source. To the south, this chain of galaxies continues into LESS026.
-
(LESS006) LESS J033257.1280102 – both the radio and MIPS robust counterparts are weak, but separated by 1 arcsec. The radio source appears to be extended, the eastern end of which lies closer to the MIPS position.
-
(LESS008) LESS J033205.1273108 – the nearest radio source beyond the search radius has a position of 03:32:04.8146, 27:31:14.143, a flux of 69 Jy and is offset by 6.3 arcsec from the nominal submm position.
-
(LESS010) LESS J033219.0275219 – the radio source gives the impression of having a bright core and a three-component jet. However, the end of the ‘jet’ corresponds to a 24-m source and another of the ‘jet’ components is coincident with an IRAC source; the ‘core’ also has 24-m emission. The SMG emission continues to the south-west where it merges into LESS034. This rather confusing source has not had a redshift calculated.
-
(LESS012) LESS J033248.1275414 – the bright MIPS source has a weak extension that daophot resolves into separate components; one of these lies less than 1 arcsec from the secure radio counterpart.
-
(LESS015) LESS J033333.4275930 – this SMG is a close neighbour of LESS076. The robust counterpart at 24-m has associated weak radio emission.
-
(LESS019) LESS J033208.1275818 – both IRAC identifications have faint emission at 24-m.
-
(LESS020) LESS J033316.6280018 – this has by far the brightest of the robust radio counterparts, 4 mJy, and therefore probably contains a radio-loud AGN component. For this reason, the CY00 redshift is greatly in error.
-
(LESS023) LESS J033212.1280508 – the nearest radio source beyond the search radius has a flux of 65 Jy at position 03:32:12.2230, 28:05:16.752 and is associated with an obvious 24-m source (245 Jy).
-
(LESS024) LESS J033336.8274401 – the secure radio counterpart is coincident with a 24-m source. A brighter radio source/24-m source lies outside the search area at radio position 03:33:36.4418, 27:43:55.671.
-
(LESS026) LESS J033136.9275456 – no radio or 24-m emission, but this source is a continuation of LESS004 and hence probably a blend. The radio/24-m source to the south (03:31:36.9524, 27:55:10.443) is a possible contributor to this submm complex.
-
(LESS027) LESS J033149.7273432 – of the two robust IRAC counterparts, only the southern one has emission at 24 m.
-
(LESS028) LESS J033302.9274432 – this source is a close neighbour of LESS059. There is no sign of any significant emission within the search radius. The nearest radio source beyond the search radius has a flux of 52 Jy at position 03:33:01.9865, 27:44:33.675 and is associated with an obvious 24-m source (102 Jy).
-
(LESS030) LESS J033344.4280346 – the radio sources to the north have positions 03:33:44.6396, 28:03:38.273 (240 Jy) and 03:33:44.9516, 28:03:43.435 (41 Jy).
-
(LESS031) LESS J033150.0275743 – this weak radio source has a only slightly in excess of 0.05, is nearly coincident with a 24-m source and has a robust counterpart from the IRAC analysis.
-
(LESS033) LESS J033149.8275332 – this SMG is a close neighbour of LESS057.
-
(LESS034) LESS J033217.6275230 – this SMG merges into LESS010 and three 24-m sources lie along the line between the two SMGs. The nearby radio/24-m source has a position of 03:32:17.1874, 27:52:21.074 (93 Jy).
-
(LESS035) LESS J033110.3273714 – the 24-m emission is complex and the counterpart is difficult to see, but as the IRAC image reveals a faint source at the same position the daophot extraction seems to have been successful.
-
(LESS036) LESS J033149.2280208 – both radio and 24-m potential counterparts are coincidential and have and therefore we consider this a secure identification.
-
(LESS041) LESS J033110.5275233 – a pair of sources dominate the IRAC image, but only the one that is a robust identification has a counterpart at 24-m.
-
(LESS042) LESS J033231.0275858 – a radio/24-m source lies just to the north of the search radius at 03:32:31.4500, 27:58:51.934.
-
(LESS043) LESS J033307.0274801 – three 24-m sources cluster towards the centre of the submm emission and all three have weak radio emission. Only one is classified as a robust counterpart, based on the IRAC data.
-
(LESS046) LESS J033336.8273247 – this source is not covered by the 24-m FIDEL or SIMPLE 3.6-m data. The plots therefore show the shallower SWIRE data at each wavelength; at 24-m there is a clear counterpart to the robust radio identification.
-
(LESS047) LESS J033256.0273317 – the two IRAC robust counterparts may be a single, extended source; 24-m emission is centered closer to the western component.
-
(LESS049) LESS J033124.4275040 – three 24-m sources cluster towards the centre of the submm emission and all three have weak radio emission.
-
(LESS050) LESS J033141.2274441 – as with the previous SMG, a cluster of several (at least four) 24-m sources dominates the postage-stamp image and lie almost equidistant from the submm centroid; one of them is a secure identification based on its radio emission. The secure 24-m identification at the very centre of the image is difficult to discern, but as a source is present at this position in the IRAC 3.6-m image we believe that it is real.
-
(LESS052) LESS J033128.5275601 – this SMG is a close neighbour of LESS075.
-
(LESS058) LESS J033225.8273306 – very weak 24-m emission that is not present in either the DAOPHOT or APEX catalogues is coincident with a radio source.
-
(LESS060) LESS J033317.5275121 – the radio source to the south is coincident with a 24-m source and we consider this a secure identification.
-
(LESS063) LESS J033308.5280044 – the extremely weak radio emission that has been classed as a secure identification by the -statistic is not seemingly associated with any 24-m emission and we warn that it may be spurious. We do not include it in the redshift analysis.
-
(LESS066) LESS J033331.7275406 – this is a close neighbour to LESS123.
-
(LESS067) LESS J033243.3275517 – three 24-m sources cluster towards the centre of the submm emission and all three have weak radio emission; one is a secure counterpart.
-
(LESS068) LESS J033233.4273918 – the nearest radio source beyond the search radius has a position of 03:32:33.5615, 27:39:28.892, a flux of 50 Jy and is offset by 10.5 arcsec from the nominal submm position.
-
(LESS071) LESS J033306.3273327 – increasing the search radius by a modest 0.4 arcsec would lead to the identification of a radio counterpart (200 Jy at 03:33:05.6632, 27:33:28.666) with a coincident 24-m source.
-
(LESS073) LESS J033229.3275619 – the radio identification is very weak, but is coincident with a very weak 15.2-Jy 24-m source that lies beneath the 3.5- catalogue threshold.
-
(LESS074) LESS J033309.3274809 – we find two IRAC robust counterparts separated by only a few arcsec. One is robust based on the IRAC -statistic alone whilst the other is robust due to for both the IRAC and the radio maps.
-
(LESS075) LESS J033126.8275554 – this is a close neighbour of LESS052.
-
(LESS076) LESS J033332.7275957 – the submm emission to the north of this source is LESS015.
-
(LESS082) LESS J033253.8273810 – a pair of 24-m sources align with the elongation of the submm emission.
-
(LESS085) LESS J033110.3274503 – the radio source just outside the search radius has a position of 03:31:09.7733, 27:45:08.625, a flux of 46 Jy and is offset by 8.7 arcsec from the nominal submm position.
-
(LESS086) LESS J033114.9274844 – the radio source just outside the search radius has a position of 03:31:14.1207, 27:48:44.229 (J2000), a flux of 102 Jy and is offset by 10.3 arcsec from the nominal submm position.
-
(LESS087) LESS J033251.1273143 – there are two radio counterparts, only one of which has 24-m emission. This may be a radio core and jet.
-
(LESS096) LESS J033313.0275556 – this SMG lies very close to LESS001. The secure 24-m identification at the very centre of the image is difficult to discern and appears to be part of the Airy ring, but an IRAC 3.6-m source at this position again confirms that the daophot extraction is reliable.
-
(LESS098) LESS J033130.2275726 – two radio sources align themselves closely with the submm elongation. The southern of the pair has a flux of 368 Jy and a position of 03:31:30.7540, 27:57:35.129 (J2000).
-
(LESS103) LESS J033325.3273400 – this SMG is a close neighbour of LESS111.
-
(LESS107) LESS J033130.8275150 – a group of five catalogued 24-m sources within the search radius form a ring around the submm position, two of which have associated weak radio emission.
-
(LESS110) LESS J033122.6275417 – the very faint IRAC identification also has a counterpart in a complex 24-m structure that daophot disentangles into three separate components.
-
(LESS111) LESS J033325.6273423 – this SMG is a close neighbour of LESS103. It has a robust counterpart in both the radio and the MIPS catalogues, but the weaker radio component is significantly offset (2 arcsec) from the much brighter MIPS detection. This perhaps suggests that the radio source is spurious, but its relatively high SNR (5) argues that it is unlikely to be a false detection.
-
(LESS117) LESS J033128.0273925 – there is a striking alignment of five 24-m sources with the elongation of the submm emission along 30°, several of which have associated radio emission.
-
(LESS118) LESS J033121.8274936 – the extremely weak radio emission that has been classed as a secure identification by the -statistic is not seemingly associated with any MIPS or IRAC emission and we warn that it may be spurious. We do not include it in the redshift analysis.
-
(LESS123) LESS J033330.9275349 – this is a close neighbour to LESS066.