PRIMUS: Obscured Star Formation on the Red Sequence
Abstract
We quantify the fraction of galaxies at moderate redshifts () that appear red-and-dead in the optical, but in fact contain obscured star formation detectable in the infrared (IR), with the PRIsm MUlti-object Survey (PRIMUS). PRIMUS has measured robust redshifts with a precision of over of the sky to the depth of (AB), up to redshift . We specifically targeted fields with existing deep IR imaging from the Spitzer Space Telescope from the SWIRE and S-COSMOS surveys. We select in these fields an band flux-limited sample ( mag in the SWIRE fields and mag in the S-COSMOS field) of red-sequence galaxies at for which we can reliably classify obscured star-forming and quiescent galaxies using IR color. Our sample constitutes the largest galaxy sample at intermediate redshift to study obscured star formation on the red sequence, and we present the first quantitative analysis of the fraction of obscured star-forming galaxies as a function of luminosity. We find that on average, at , about of red-sequence galaxies have IR colors consistent with star-forming galaxies. The percentage of obscured star-forming galaxies increases by per mag with decreasing luminosity from the highest luminosities to . Our results suggest that a significant fraction of red-sequence galaxies have ongoing star formation and that galaxy evolution studies based on optical color therefore need to account for this complication.
Subject headings:
galaxies: fundamental parameters (classification, colors, luminosities, masses, radii, etc.) — galaxies: distances and redshifts – galaxies: evolution – stars: formation – dust, extinction1. Introduction
Our understanding of the formation and evolution of galaxies has improved tremendously the last few decades as a result of multiple redshift surveys (e.g., Davis et al., 1982; York et al., 2000; Colless et al., 2001; Wolf et al., 2003; Davis et al., 2003; Lilly et al., 2007; Garilli et al., 2008). These surveys have demonstrated that the distribution of galaxy populations is bimodal in the optical color-magnitude space up to (e.g., Strateva et al., 2001; Blanton et al., 2003a; Baldry et al., 2004; Balogh et al., 2004; Bell et al., 2004b; Willmer et al., 2006; Wuyts et al., 2007; Williams et al., 2009; Brammer et al., 2009, among others). The underlying physical reason is the short lifetime of massive stars. Once star formation stops in a galaxy, hot massive stars quickly die, the integrated spectral energy distribution (SED) of the galaxy becomes dominated by cool giants, and its optical color turns from blue to red. The bimodality of blue cloud and red sequence in the color-magnitude diagram therefore approximately translates into that of star-forming (SF) and quiescent galaxies.
Recent studies of the mass and luminosity functions of red-sequence galaxies at different redshifts show that the stellar mass density on the red sequence has increased by a factor of overall since (e.g., Bell et al., 2004b; Faber et al., 2007). This build-up could result from some combination of migration from the blue cloud (due to mergers, feedback or other mechanisms for turning off star formation) and gas-poor, “dry” merging from smaller-mass red-sequence galaxies (e.g., Bell et al., 2004b, 2006a, 2006b). Other studies (e.g., Cimatti et al., 2006; Brown et al., 2007; Cool et al., 2008) find that the growth of the red-sequence populations depends strongly on luminosity: whereas many red-sequence galaxies assembled in the time since , at the massive end () the mass and luminosity functions are consistent with passive evolution. They therefore argue that merging (dry or wet) does not dominate the evolution of massive red galaxies since .
One complication that current studies of red-sequence galaxies ignore is that optically red galaxies can have in situ, but dust-obscured star formation. Because of this dust-obscuration, optical color can be a misleading proxy for star formation. Dust extinction reshapes the SED of a galaxy, absorbing photons at high energy (e.g., ultraviolet, UV) and re-emitting the energy at longer wavelengths (e.g., infrared, IR). Therefore the red sequence consists of both truly quiescent but also obscured SF galaxies; it is extremely important to quantify the composition of the red sequence to obtain an accurate understanding of galaxy evolution.
There are several ways to investigate the contribution of obscured SF galaxies on the red sequence. Assuming inclination is well-correlated with dust extinction along the line-of-sight, Maller et al. (2009, see also ) find the ratio of red-to-blue galaxies changes from 1:1 to 1:2 when moving from observed to inclination-corrected color, for local galaxies in the Sloan Digital Sky Survey (SDSS, York et al. 2000). Using deep imaging from the Hubble Space Telescope (HST) from the Galaxy Evolution from Morphology and SED project (GEMS, Rix et al., 2004) and photometric redshifts from the COMBO-17 survey (Wolf et al., 2003), Bell et al. (2004a) find that less than of red-sequence galaxies are edge-on dusty disk galaxies at . One can also correct dust extinction by fitting multi-wavelength data or SEDs with stellar population synthesis models and allowing dust extinction to be a free parameter. Using this method on COMBO-17 data, Wolf et al. (2005) find a rich component of dusty SF galaxies contaminating the red sequence in the cluster Abell at . The mid-IR (MIR) emission from dust offers another method for selecting obscured SF galaxies, though the emission can also originate from strong active galactic nuclei (AGNs). Brand et al. (2009, see also ) discover of red-sequence galaxies at exhibit strong MIR emission with Jy. We can also use IR color to separate SF and quiescent galaxies. At wavelengths m, warm dust emission and strong polycyclic aromatic hydrocarbon (PAH) features dominate the SED of SF galaxies, producing much redder IR colors than expected from quiescent galaxies. Brand et al. (2009) use this method and find that, among the of red-sequence galaxies with Jy in their sample, about have IR colors consistent with SF galaxies, with the rest consistent with quiescent galaxies () and AGNs ().
Quantitative studies of obscured star formation at intermediate and high redshifts are usually limited to small samples. For example, Wolf et al. (2005) select red-sequence galaxies in a specific environment, the Abell / super-cluster system. Even though deep multi-wavelength data including space-based IR imaging are now available across a large area of the sky, the lack of corresponding large redshift surveys hampers the systematic quantitative studies of the contribution of obscured SF galaxies on the red sequence. We have recently completed such a redshift survey, the PRIsm MUlti-object Survey (PRIMUS111http://cass.ucsd.edu/acoil/primus/), to provide the redshifts required to fully realize the science potential of the existing deep multi-wavelength imaging data.
PRIMUS has measured robust redshifts over of the sky to the depth of (AB) up to redshift . We specifically targeted areas where there exist deep multi-wavelength imaging data, including IR data from the Spitzer Space Telescope (Werner et al., 2004), making our dataset ideal for the study of the obscured star formation on the red sequence. Using the IR data, in conjunction with the redshifts from PRIMUS, we here present the first quantitative study of the fraction of obscured SF galaxies on the red sequence as a function of luminosity at redshifts .
This paper proceeds as follows. In Section 2, we briefly introduce PRIMUS and describe the Spitzer data we use. In Section 3, we describe in detail the classification scheme for AGNs, star-forming galaxies, and quiescent galaxies. We present the results in Section 4. In Section 5, we discuss the composition of the red sequence. We summarize our principal conclusions in Section 6.
Throughout this work, we adopt a CDM cosmological model with , and . If not specifically mentioned, all magnitudes are on the AB system.
2. Data
2.1. PRIMUS
PRIMUS is a unique low-resolution spectroscopic intermediate redshift survey. We conducted the survey using the IMACS instrument on the Magellan I (Baade) Telescope at Las Campanas Observatory. With a prism and slitmasks, we obtained low-resolution spectra for objects to the depth of out to redshift in nights, covering of the sky. The low-resolution of the prism () allows us to observe objects in one single mask with a field of view . By carefully fitting the low-resolution spectra with galaxy spectral templates, we have obtained robust redshifts, to the precision of . PRIMUS therefore is the largest faint galaxy redshift survey performed to date.
When designing the survey, we specifically targeted fields with existing deep multi-wavelength imaging, including optical imaging from various ground-based deep surveys, near-UV (NUV) and far-UV (FUV) from the Galaxy Evolution Explorer (GALEX, Martin et al. 2005), IR from the Spitzer Space Telescope, and -ray from Chandra and/or XMM telescopes.
We created homogeneous band-merged catalogs across all our fields. With the redshifts and the band-merged catalogs, we derived absolute magnitudes using the kcorrect package (v4.1.4 Blanton & Roweis, 2007). Because we focus on redshifts , here we use the absolute magnitudes at bands shifted blueward to (e.g., Blanton et al., 2003a). We denote these bands with a preceding superscript , e.g., . For a galaxy exactly at redshift with apparent magnitude , the -correction from to is simply independent of galaxy SED. This filter choice therefore minimizes the error in the -corrections.
When fitting for the redshift, we also fit the spectra with stellar and broad-line AGN spectral templates and classify objects into stars, AGNs, and galaxies based upon the of the best fits. In of the PRIMUS fields, we have -ray data from Chandra and/or XMM telescopes. Here we select our sample only from objects that are classified as galaxies and do not have matched -ray detections.
For more details on the PRIMUS survey, we refer the reader to the survey papers (Coil et al., 2010, Cool et al., in prep.).
2.2. Spitzer Space Telescope
In of the fields covered by PRIMUS we have IR imaging data from The Infrared Array Camera (IRAC, Fazio et al. 2004) and The Multi-band Imaging Photometer (MIPS, Rieke et al. 2004) onboard Spitzer. IRAC is a four-channel instrument that provides simultaneous broadband images at , , and with unprecedented sensitivity. MIPS provides images at longer wavelengths, , and m with rms depths of mJy, mJy and mJy, respectively. Here we use the that has coverage from all four channels of IRAC and m band of MIPS. For of the DEEP2 (Davis et al., 2003) field with the IRAC imaging, only the and imaging is available; we omit this field, because we require all four channels for this paper. The data we use consist of two Legacy Programs of Spitzer, in three fields of Spitzer Wide-area Infrared Extragalactic Survey (SWIRE222http://swire.ipac.caltech.edu/swire/swire.html; Lonsdale et al. 2003), and in the Spitzer Deep Survey of the HST COSMOS 2-Degree ACS Field (S-COSMOS333http://irsa.ipac.caltech.edu/data/SPITZER/S-COSMOS/; COSMOS represents the Cosmological Evolution Survey and ACS is the Advanced Camera for Surveys onboard HST.; Sanders et al. 2007). We use the data release and of the SWIRE survey, and the public catalog in the NASA/IPAC Infrared Science Archive for the S-COSMOS survey. In most of the SWIRE fields, to at least depths, the flux limits in the four IRAC channels are , , , and Jy (, , and AB mag444We use AB magnitudes throughout this work but also give Vega magnitudes when necessary. The conversion factors (ABVega) for IRAC , , , and are , , , and mag, respectively.). The flux limits in the S-COSMOS field are , , , and Jy (, , and AB mag), in the four IRAC channels, respectively.
At wavelengths m, warm dust emission and strong PAH features, e.g, , , and m, dominate the SED of a typical SF galaxy (Li & Draine, 2001; Smith et al., 2007). Moving to higher redshift, the , and m PAH emission bands shift through the IRAC channel, producing much redder IRAC colors than expected from a typical quiescent early-type galaxy. Red-sequence galaxies whose star formation is obscured by dust have IRAC colors consistent with normal SF galaxies. Strong AGNs, on the other hand, occupy a different locus from regular SF and quiescent galaxies in the IRAC color-color diagram (Eisenhardt et al., 2004; Lacy et al., 2004; Stern et al., 2005). The IRAC colors therefore are extremely convenient and powerful for classification of AGNs, SF galaxies, and quiescent galaxies. We discuss this in detail in Section 3.
3. Source Selection
3.1. Flux-limited sample in band
In order to use IR color to identify SF galaxies, we restrict our sample to the PRIMUS fields with IR coverage (). We also only select our sample from galaxies with the highest confidence (Q , see Cool et al. in prep. for details on the confidence level Q).
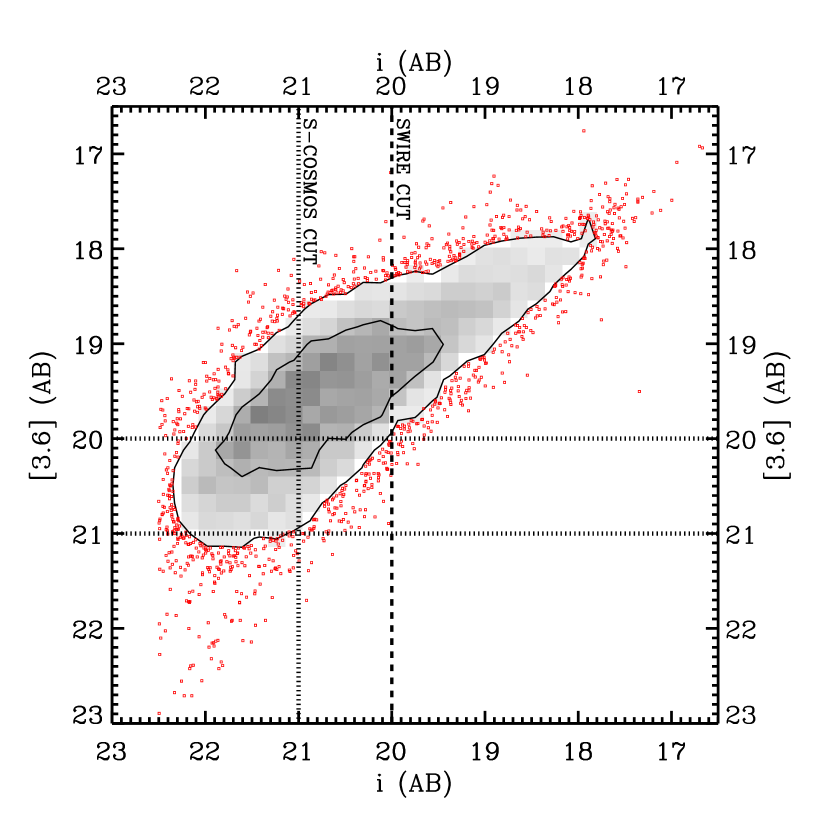
We also need to select appropriate flux limits in the band and the band, which are necessarily related to the depth of the coverage in the band. The flux limits used in the channel are mag in the SWIRE fields and mag in the S-COSMOS field, effectively much brighter than those in the channel ( and mag). Thus, in order to place interesting limits on the specific star-formation rate (SSFR) using the color, we must restrict our sample to bright enough galaxies. In Section 3.4, we will show that galaxies with SSFR of have colors and quiescent galaxies have . Our definition of “star-forming” will be loosely related to this SSFR, and this color cut defines how bright our sample needs to be. We thus require the upper limits of the colors of the non-detections to be so that we can reliably classify them into quiescent galaxies, or in other words that the magnitudes should be brighter than () mag in the SWIRE (S-COSMOS) fields.
We achieve this by applying appropriate limits in the band. In Figure 1, we present the versus for the red-sequence galaxies (defined in the next section), where we have shown and mag with two horizontal lines. We see that for most of the red-sequence galaxies with () mag, they have magnitudes (). We therefore define a flux-limited sample with and , in the SWIRE and S-COSMOS fields, respectively. We will further justify these cuts in Section 3.4, where we explicitly demonstrate that after these cuts, virtually all non-detections are quiescent galaxies.
Beyond redshift , the m PAH feature shifts out of the channel and we can not use the color to reliably separate SF and quiescent galaxies. We also do not have many galaxies below redshift in the PRIMUS fields due to the small volume. Therefore, we focus our analysis on the redshift range . We will come back to this in Section 3.4. In total, the flux-limited sample within includes galaxies.
3.2. Red sequence, blue cloud, and green valley
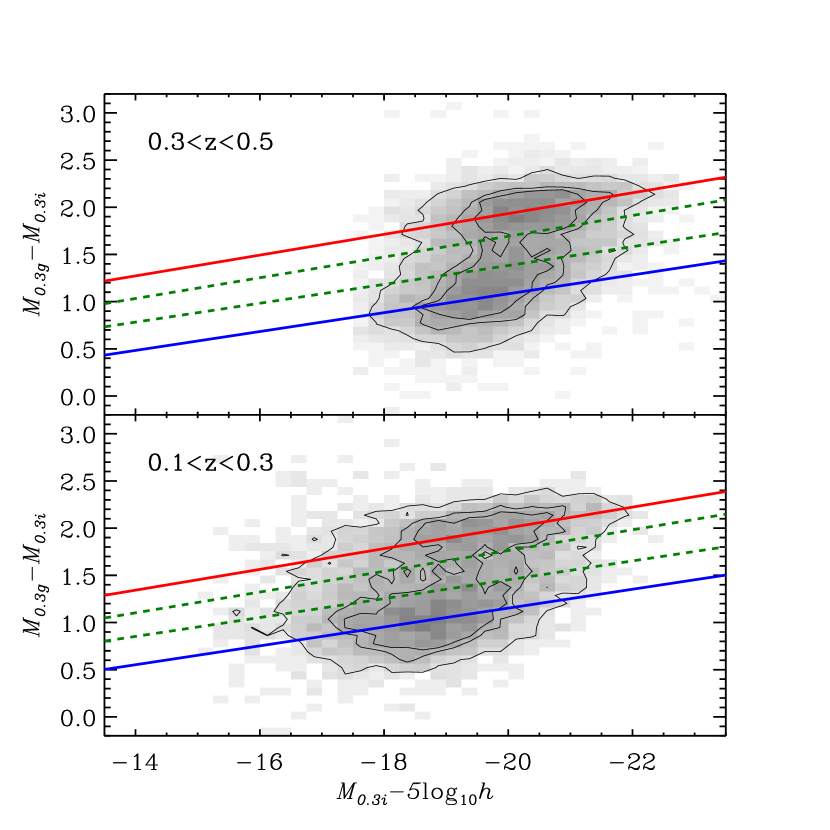
To define the red sequence, blue cloud, and green valley, we use all galaxies with with secure redshifts (Q ) in PRIMUS. PRIMUS targeted in band unless there is no band imaging available, in which case we used band. We thus choose to use the magnitude , and the color when defining samples based on optical color. At each luminosity, we fit the color distribution with a two-gaussian model. We then linearly fit the two sets of peaks to obtain the slopes and intercepts of the red sequence and the blue cloud. To define the edges of green valley, we move the fitted line for the red sequence (blue cloud) blueward (redward) until it includes more galaxies above (below) the line. This method allows us to conservatively select red-sequence and blue-cloud galaxies, without contamination from green-valley galaxies. Due to passive evolution, the colors of galaxies at lower redshift are redder than those at higher redshift. Therefore, we keep the slope fixed throughout the redshift range, but allow the intercept to evolve linearly in redshift. By fitting the color-magnitude diagram at different redshifts, we measure the color reddening is per unit redshift in .
Finally, the criteria we adopt are as follows. We require a red-sequence galaxy to have the color:
| (1) | |||||
and a blue-cloud galaxy to have the color:
| (2) | |||||
Between these two criteria, we identify objects as green-valley galaxies. As an example, in Figure 2, we show the color-magnitude diagram of all galaxies with at (upper panel) and at (lower panel). The two solid lines in each panel represent the positions of the red sequence and the blue cloud, and the dashed lines indicate the edges of the green valley, i.e., the criteria defined by Equation (1) and (2) at median redshift in each bin.
Finally, in the flux-limited sample, we have red-sequence galaxies, blue-cloud galaxies and green-valley galaxies.
3.3. AGN identification
For the purposes of this paper, we are primarily interested in star-forming galaxies, and attempt to identify and exclude the few AGNs in the sample. To do so, we use a combination of the PRIMUS spectra, matching -ray data, and IR colors of the galaxies.
As stated in Section 2.1, we only select objects classified as galaxies and did not include those classified as broad-line AGNs in the PRIMUS spectroscopy. For -ray AGNs, we exclude galaxies with matched -ray detections in the of -ray coverage from Chandra and/or XMM telescopes (out of our full ). However, neither technique can exclude heavily-obscured AGNs effectively.
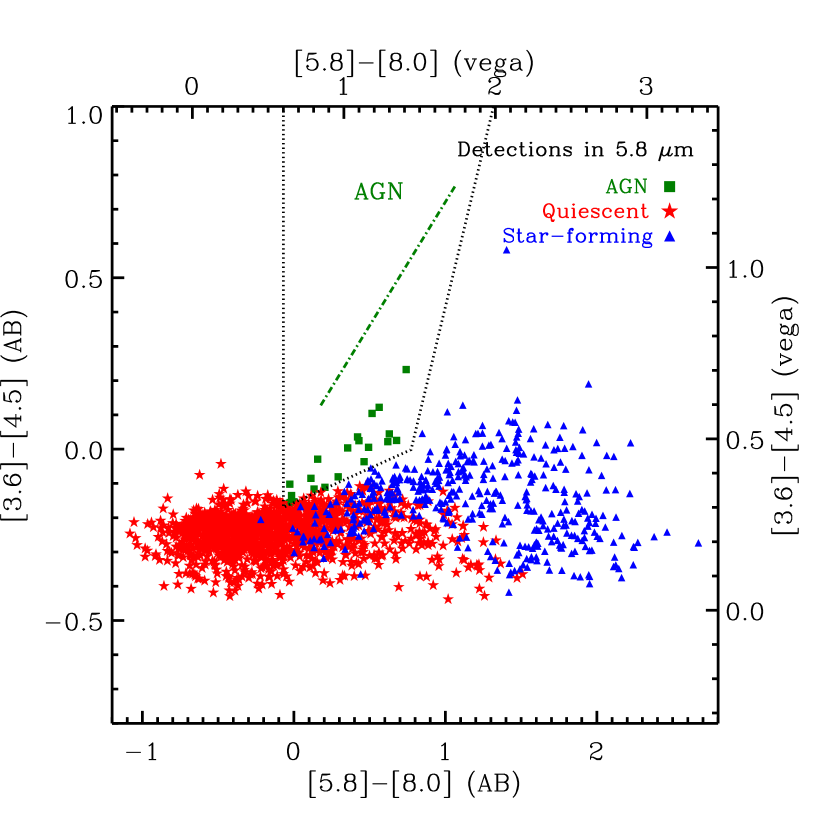
Finally, IR colors can be used to exclude strong AGNs. In the IRAC color-color diagram with versus , AGNs occupy a different locus from normal galaxies, either SF or quiescent (Lacy et al., 2004; Stern et al., 2005). This is because the SED of an AGN in the IR can be well-represented by a power law, while that of a quiescent galaxy approximately follows Rayleigh-Jeans law and that of a SF galaxy is dominated by warm dust and PAH emission. To identify AGNs, we adopt the empirical criteria suggested by Stern et al. (2005). These criteria may omit AGNs at high redshift, but are adequate for our purpose since our sample is at . In Figure 3, we show the IRAC color-color diagram for all the detections in both the and channels in the flux-limited red-sequence sample, with Stern et al. (2005) criteria as the dotted wedge. Objects within the wedge are classified as AGNs (green filled squares). We also show SF and quiescent galaxies among the non-AGNs, defined in the next section, with blue filled triangles and red filled stars, respectively. The green dot-dashed line represents the colors of AGNs with power-law spectra , with ranging from to .
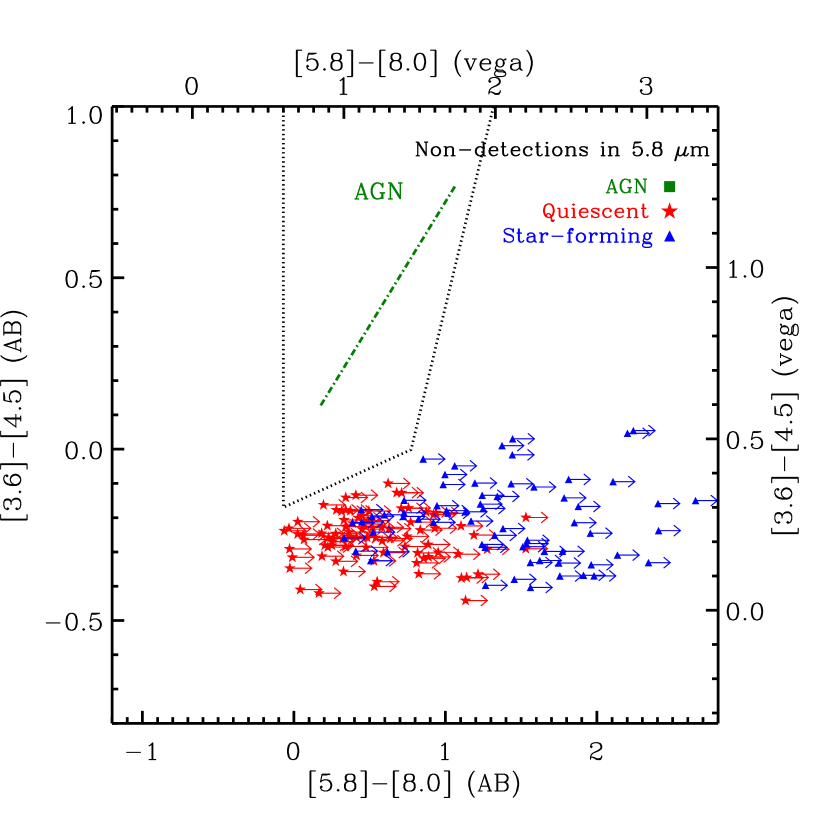
The Stern et al. (2005) method to identify AGNs requires detections in all four channels. In the flux-limited red-sequence sample, a large fraction ( of ) are not detected in the channel. Nevertheless, we will show in the next section that we can safely classify them as quiescent galaxies. Among those ( of ) detected in the channel, do not have matched detections in the channel due to the relatively bright flux limits. For these objects, we use the flux limits of () mag in the SWIRE (S-COSMOS) fields to calculate the lower limits of their colors. We show the results in Figure 4. The colors of all non-detections are unambiguously outside the AGN wedge and we therefore can safely classify them as non-AGNs and perform further SF and quiescent galaxy classification in the next section.
3.4. Classification of star-forming and quiescent galaxies
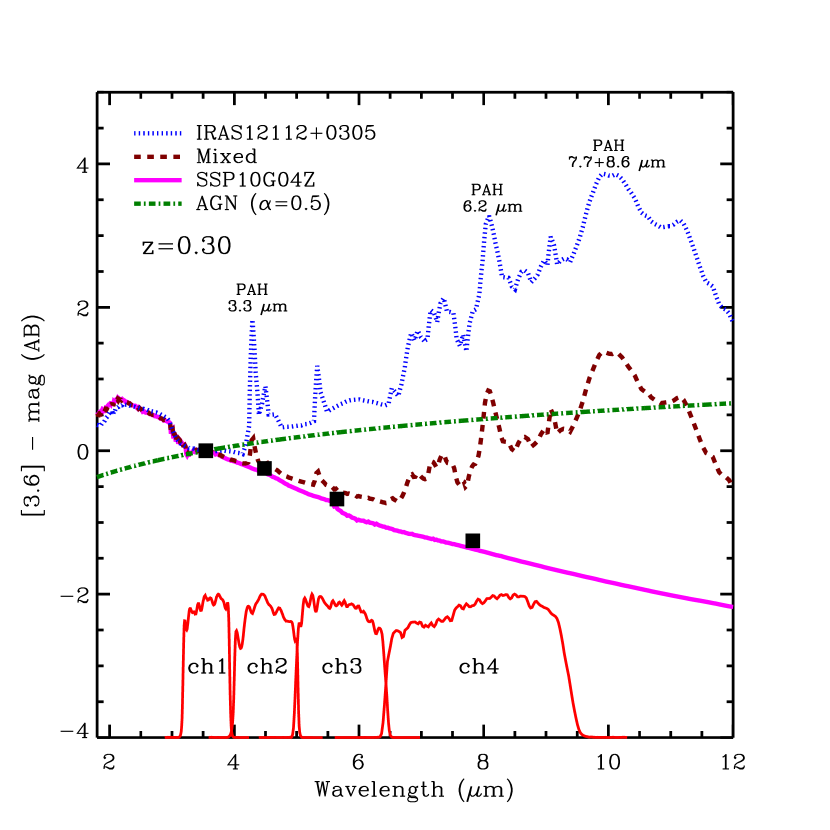
To separate SF and quiescent galaxies, we combine representative SED templates of strong SF galaxies and typical quiescent early-type galaxies. For strong SF galaxies, we choose the template of IRAS from Rieke et al. (2009), an ultra-luminous IR galaxy (ULIRG) with significant ongoing star formation (e.g., Armus et al., 2007). For typical quiescent early-type galaxies, we use a simple stellar population (SSP) with an age of Gyr and metallicity of from the Bruzual & Charlot (2003) models, with the Padova 1994 library of stellar evolution tracks and the Chabrier (2003) Initial Mass Function (IMF). We denote this template as SSP10G04Z. In Figure 5, we show these templates, shifted to , within the wavelength range to m. We also show a power-law spectrum with to represent a typical AGN. Note we have normalized all the SEDs to have the same magnitude zeropoint in the channel for clarity. The IRAS template is dominated by warm dust continuum and strong PAH features. Meanwhile, the SSP template roughly follows the Rayleigh-Jeans law . This template is similar to the average of a variety of SSPs with age ranging from Gyr to Gyr and metallicity of and . We show the average magnitudes of these SSPs in the IRAC channels in black filled squares.
To define a demarcation template separating SF and quiescent galaxies, we linearly combine the templates of IRAS and SSP10G04Z. We first normalize them to have the same flux at m (roughly -band), and then define the demarcation mixed template (Mixed hereafter) to be the sum of of IRAS and of SSP10G04Z. This Mixed template represents a galaxy with SSFR . We show the template with the brown dashed line in Figure 5.
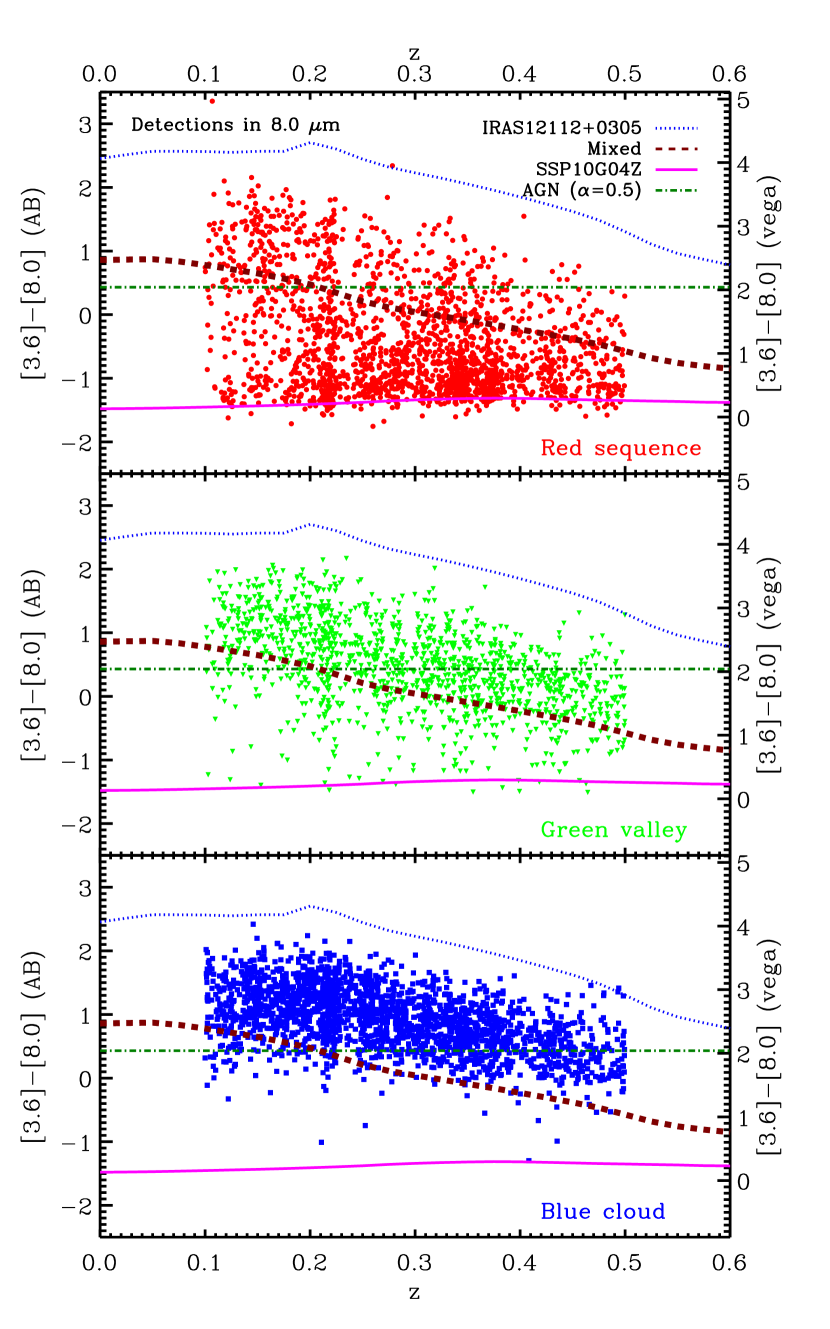
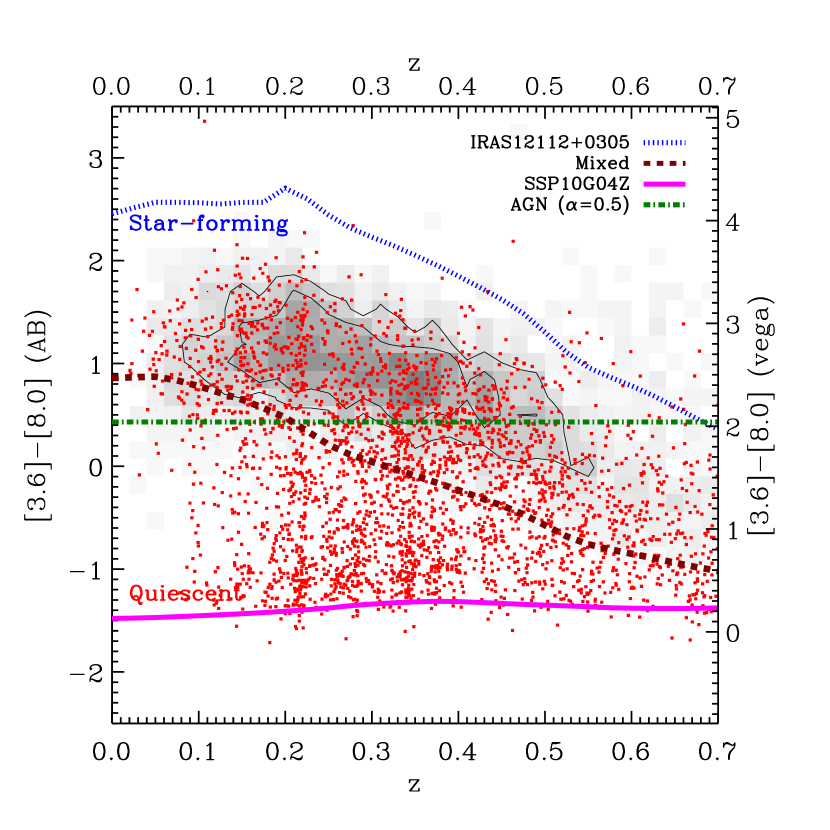
Figure 6 presents the colors of these templates as a function of redshift and compares them with those of the detections among the red-sequence (red dots) and blue-cloud galaxies (gray scale) with at . The IRAS template clearly defines the upper edge of the space of the blue-cloud galaxies. Meanwhile, the Mixed template follows the lower edge of the blue-cloud galaxies. Most of the red-sequence galaxies have redder colors than the typical SSP template, SSP10G04Z, which should not be surprising because very few galaxies are dust-free and can be accurately represented by SSPs. There are also many red-sequence galaxies scattered above the Mixed template, indicating they are in fact actively forming stars but their optical colors are reddened due to dust extinction. We also see that above , the colors of SF and quiescent galaxies start to blend into each other because the m PAH emission band shifts out of the channel and we can not use the color to identify SF galaxies any more. Also there are very few galaxies below because of the small volume in the observation cone. We therefore only focus our analysis on the redshift range .
In Figure 7, we present the colors of all detections in the flux-limited sample split by optical color. In the top panel, we show that a significant fraction of the red-sequence galaxies are scattered into the SF region. In the middle panel, we show that most of the green-valley galaxies are actually actively forming stars at roughly the same level as the blue-cloud galaxies. Therefore, that the green valley is redder than the blue cloud is likely not an indication of a much lower SSFR, but may be due to dust reddening. In the bottom panel, we show almost all of the blue-cloud galaxies appear in the SF region.
| z | aa corrected to , assuming mag per unit redshift. | bbNumber of red-sequence (RS) galaxies. | ccNumber of star-forming (SF) galaxies in the red-sequence subsample. | Fraction of SF galaxies | |
|---|---|---|---|---|---|
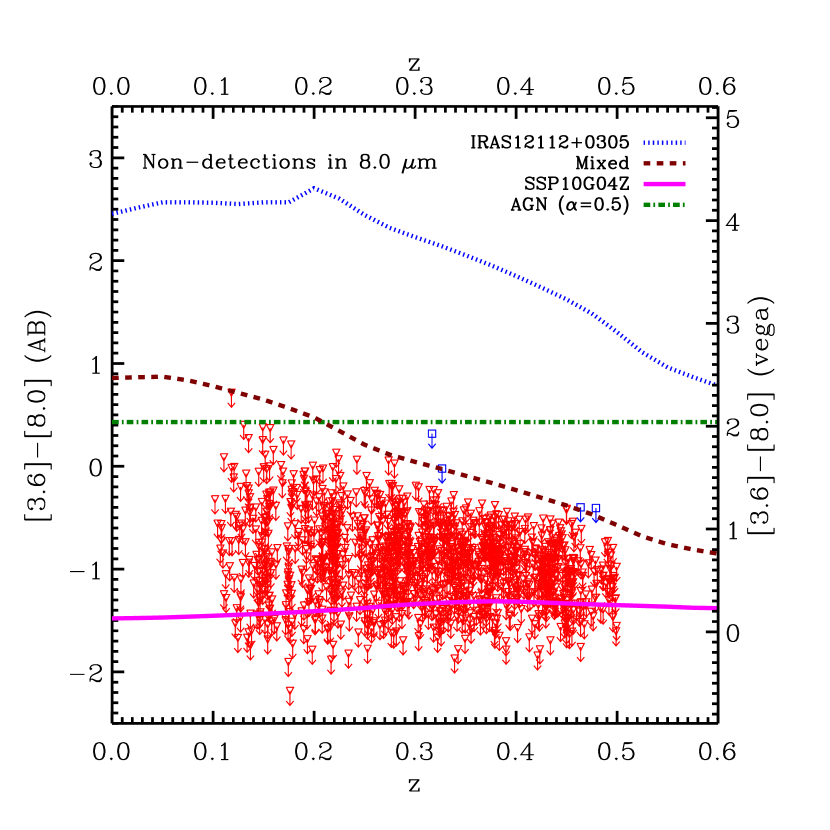
The classification of SF and quiescent galaxies requires detections in both the and channels. Among the red-sequence galaxies in the flux-limited sample, of them do not have matched detections. For these galaxies, we use the flux limits of () mag in the SWIRE (S-COSMOS) fields, to calculate the upper limits of their colors. We show the results in Figure 8. Only four of these objects may be identified as SF galaxies if their fluxes are close to the flux limits. Therefore the flux cuts in band we adopt in Section 3.1 have provided a sample with bright band fluxes (Figure 1) and enable us to reliably classify almost all of the non-detections as quiescent galaxies. Below we treat the ambiguous four objects as quiescent galaxies as well. However, we emphasize that treating them as SF galaxies does not have any noticeable effect in our analysis. We present the results in the next section.
4. Results: Obscured star formation on the red sequence
With the classification scheme of AGNs, SF galaxies, and quiescent galaxies defined in Section 3, we present a quantitative study of the fraction of obscured SF galaxies on the red sequence in this section.
4.1. Overall contribution
In total, we have red-sequence galaxies in the flux-limited sample at . Among these we identify () as SF galaxies, () as quiescent galaxies, and () as AGNs. Note if we did not exclude -ray detections in about two-thirds of the total fields, we would have AGNs instead. In this flux-limited red-sequence sample, we find that overall have IR colors consistent with star formation, indicating their optical colors are likely reddened due to dust extinction.
4.2. Luminosity dependence and redshift evolution
It is well-known that elliptical galaxies dominate the bright end of the red sequence while disk-dominated systems dominate the faint end (e.g., Marinoni et al., 1999; Bundy et al., 2010; Zhu et al., 2010). If the obscuration of the SF galaxies on the red sequence is due to high inclination, it is likely that the fraction of obscured SF galaxies also depends on luminosity. Additionally, the global star formation rate (SFR) has declined by roughly an order-of-magnitude since (e.g., Madau et al., 1996; Hopkins et al., 2006; Zhu et al., 2009; Rujopakarn et al., 2010), therefore we may expect that the fraction of obscured SF galaxies on the red sequence has declined with decreasing redshift. We investigate the luminosity dependence and redshift evolution in this section.
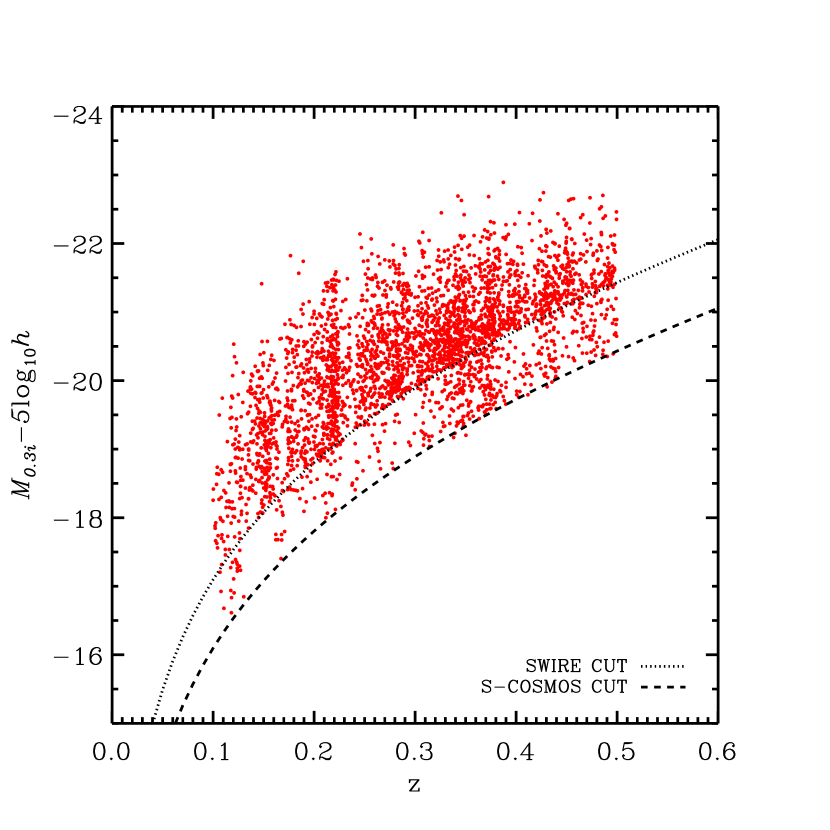
For a flux-limited sample, due to Malmquist bias, the average luminosity is higher at higher redshift. We show this in Figure 9, where we plot the absolute magnitude versus of the red-sequence galaxies. We also show the band flux cuts, mag in the SWIRE fields and mag in the S-COSMOS field, corrected with average -corrections of red-sequence galaxies, with the dotted and dashed lines, respectively.
To overcome the Malmquist bias and possible degeneracy between luminosity and redshift dependence, we therefore define four redshift bins with a small binsize . In each redshift bin, we divide the sample into two subsamples with equal number of red-sequence galaxies based on their magnitudes.
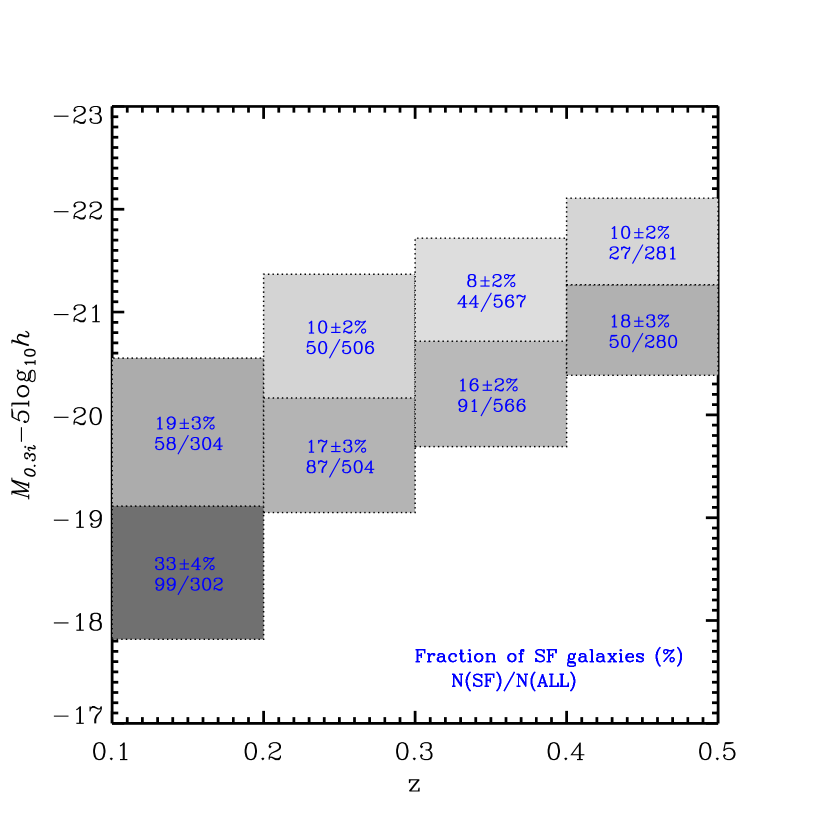
Figure 10 presents the fraction of SF galaxies with Poisson errors at the mean absolute magnitude and redshift of each subsample. We visualize the fraction with gray scale (darker colors indicate higher fractions). We also list the results in Table 1. The fraction appears to be higher at lower luminosity in all four redshift bins.
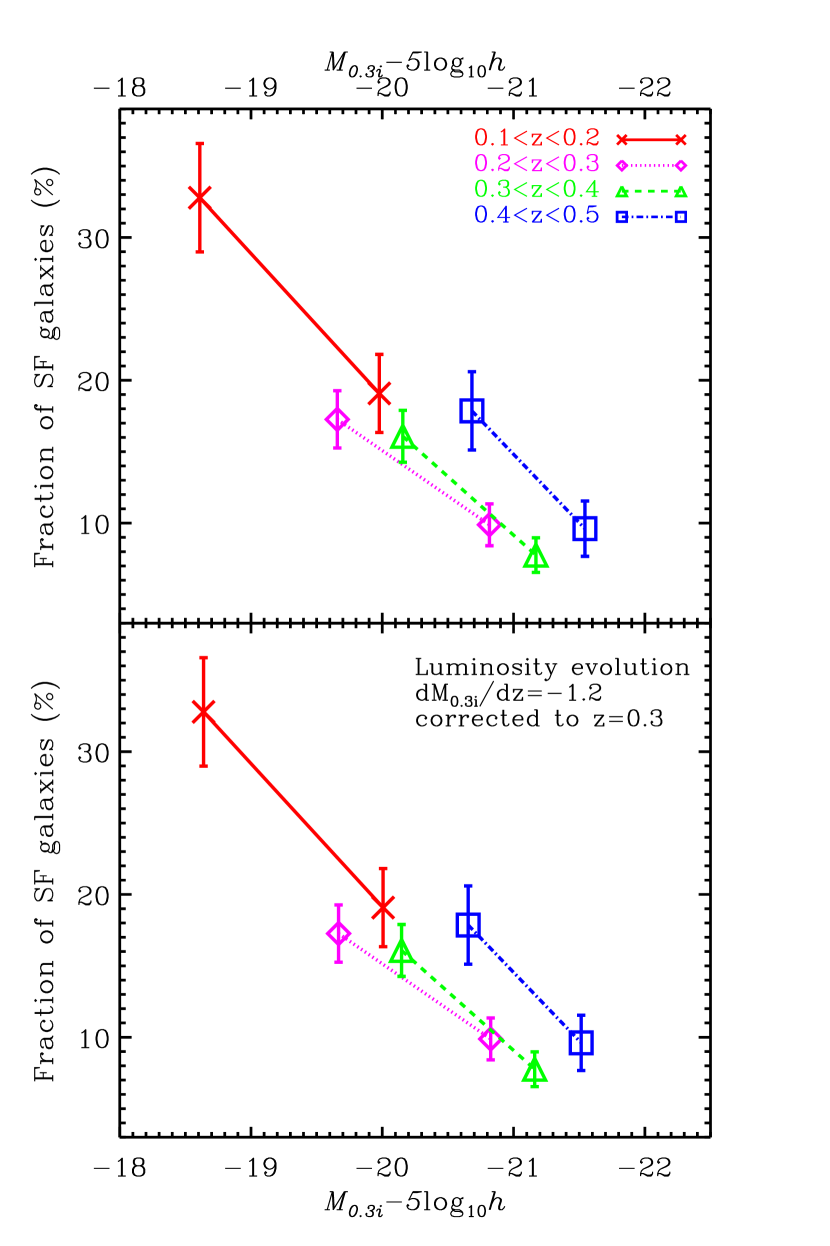
We show the luminosity dependence in Figure 11, where we plot the fraction as a function of the mean in each subsample in the top panel. In the bottom panel, we assume that the luminosity fades with decreasing redshift by mag per unit redshift, which is the luminosity evolution factor for an SSP with Salpeter (1955) IMF formed at (e.g., van Dokkum, 2008), and correct all luminosities to . We find that on average, at , the fraction of SF galaxies on the red sequence is about at (about 555At , the is in band (Blanton et al., 2003b) and band is very close to band.). And at all redshifts, the fraction (in percent) increases by per mag with decreasing luminosity to . For example, in the redshift range , the fraction increases from to as luminosity decreases from to .
Also due to Malmquist bias, at different luminosities we are investigating different redshift ranges. Bundy et al. (2010) find that at stellar mass , the abundance of red-sequence disk galaxies increases with decreasing redshift, but not as fast as red-sequence spheroidals. They also find that at higher stellar mass, the disk population has declined since . If the obscured SF population behaves as their selected disk population, we expect that the redshift evolution of the fraction also depends on luminosity. With our flux-limited sample, each luminosity range covers a different redshift range, complicating our attempt to investigate this question. Figure 11 does not reveal any strong trend of evolution strength with luminosity, but we cannot address this question substantially below with this sample. With our sample, assuming linear luminosity dependence, at (e.g., at ), the percentage of obscured SF galaxies on the red sequence has decreased by from to . At , the data from to are consistent with each other, within the errors. At fainter luminosity ( mag fainter than ), we do not have a wide enough redshift baseline to put interesting constraints on evolution.
4.3. The origin of m emission on the red sequence
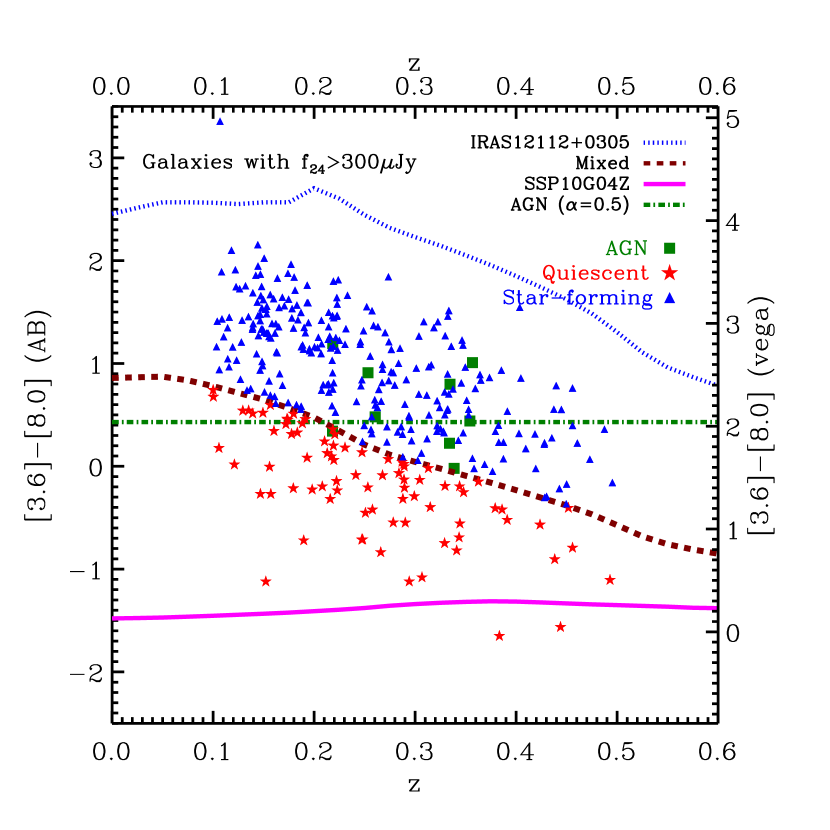
We have shown that a significant fraction () of red-sequence galaxies have IR colors consistent with star formation. Another approach to search for star formation is to use the band of MIPS, also onboard Spitzer. The emission is a close tracer of SFR of SF galaxies (e.g., Calzetti et al., 2007; Rieke et al., 2009). Previous studies (e.g., Davoodi et al., 2006; Rodighiero et al., 2007; Brand et al., 2009) find of red-sequence galaxies with emission Jy. With the imaging data, we also find that in our flux-limited red-sequence sample at , about () have flux Jy. At , this flux corresponds to a SFR (Rieke et al., 2009).
The emission, however, can also originate from AGNs (e.g., Farrah et al., 2003; Brand et al., 2006). It is interesting to investigate whether star formation or AGN or both activities are responsible for the emission of these red-sequence galaxies. Previous studies (e.g., Davoodi et al., 2006; Rodighiero et al., 2007; Brand et al., 2009) find that both star formation and AGN activities could be responsible. Brand et al. (2009) select () red-sequence galaxies with Jy from the AGN and Galaxy Evolution Survey (AGES) and employ both the emission-line diagnostic diagram (Baldwin et al., 1981, BPT) and the IRAC color-color diagram to investigate the origin of the emission. They find that in their sample, with the former method the majority () are identified as AGNs, while with the latter they identify as SF galaxies, as quiescent galaxies, and only as AGNs. Therefore both star formation and AGN activities take place in their sample, but in the optical the star formation is obscured by dust and in the IR the AGN emission is outshone by star formation emission.
The PRIMUS spectroscopy does not resolve the narrow lines required to construct the BPT diagram. However, we can perform the same AGN, SF galaxy, and quiescent galaxy classification as above using IRAC colors. Among the red-sequence galaxies with Jy, we identify () as SF galaxies, () as quiescent galaxies, and () as AGNs. In Figure 12, we plot the colors of these galaxies as a function of redshift. Our results are consistent with Brand et al. (2009) and suggest that star formation should account for at least part of the emission.
5. Discussion
5.1. The nature of galaxies on the red sequence
Although the red sequence is a well-defined locus with very small scatter in the color-magnitude diagram, it actually consists of both early-type and late-type galaxies: early-type spheroidal galaxies, late-type disk-dominated galaxies without ongoing star formation, and late-type dusty SF galaxies with their optical colors reddened due to dust extinction (e.g., edge-on Sb/Sc, etc.). When studying galaxy evolution based on optical color, it is therefore necessary to understand the contribution of different types of galaxies on the red sequence. Here we describe a number of methods of doing so, finding that broadly speaking they agree with our results here on the fraction of star-forming and/or disk galaxies on the red sequence.
There are many ways to study the composition of galaxies on the red sequence. A non-exhaustive list includes:
- (1)
- (2)
- (3)
- (4)
-
(5)
using IR color (e.g., Brand et al., 2009, this work);
- (6)
- (7)
It is difficult to carry out an exact comparison of these studies because of different sample selection methods, different luminosity and mass ranges investigated, and different redshift ranges investigated. However, all of these studies lead to the conclusion that a significant fraction of red-sequence galaxies are disk galaxies and/or obscured SF galaxies. Detailed studies conclude that the fraction depends strongly on luminosity and/or mass. In terms of morphology, in the local universe, various papers (e.g., Marinoni et al., 1999; Zhu et al., 2010) have shown that spheroidal galaxies dominate the bright end () and disk-dominated systems dominate at the faint end. At redshifts , Bundy et al. (2010) find that disk galaxies represent nearly one-half of all red-sequence population and dominate at low stellar mass . In terms of star formation, we find at redshifts , the fraction of obscured SF galaxies on the red sequence increases by per mag with decreasing luminosity to .
The redshift evolution of the relative fractions of different components on the red sequence, however, is less clear. Moustakas et al. (2004, see also ) find that the fraction of spheroidal galaxies in extremely red objects (EROs) is at redshift . Lotz et al. (2008) find that at luminosity brighter than , edge-on and dusty disk galaxies are almost one third of the red sequence at , while they only make up at . We also find that at , the fraction of obscured SF galaxies decreases by from to . However, other studies do not find a noticeable redshift dependence. Bell et al. (2004b) and Weiner et al. (2005) find that the fraction of edge-on disk galaxies is similar at and at . One possible reason for the disagreement is that the redshift evolution of relative fractions may depend on other properties such as stellar mass or luminosity. For example, Bundy et al. (2010) find that at stellar mass , the abundance of red-sequence disk galaxies increases with decreasing redshift, but not as fast as red-sequence spheroidals; meanwhile, at higher stellar mass, the disk population has declined since .
The relative fractions of different types of galaxies and their redshift evolution on the red sequence may also depend on environment. It is well-known that overall early-type galaxies are more frequently found in high-density environments while late-type galaxies tend to dominate in low-density regions (the Morphology-density relation, Dressler, 1980). There is also the SSFR-density relation such that the mean SSFR is higher at low density, an effect that is important in the local universe as well as at (e.g., Kauffmann et al., 2004; Cooper et al., 2008). Meanwhile, the mean SFR is higher at low density in the local universe but the SFR-density relation appears to be reversed at (e.g., Elbaz et al., 2007; Cooper et al., 2008). The fraction of obscured SF galaxies therefore may also depend on environment (e.g., Wolf et al., 2005; Gallazzi et al., 2008; Wolf et al., 2009; Feruglio et al., 2010). These studies suggest that in interpreting the optical color-magnitude diagram as a function of environment, the population of obscured SF galaxies may need to be accounted for.
An interesting suggestion by some papers is that the obscured SF galaxies on the red sequence are a third type other than red and blue galaxies (e.g., Wolf et al., 2005; Weinmann et al., 2006; Popesso et al., 2007; Bailin & Harris, 2008a; Verdugo et al., 2008; Wolf et al., 2009). For example, Wolf et al. (2005) and Wolf et al. (2009) find these galaxies are distributed differently in environment than both the red and the blue galaxy populations: unlike red galaxies they tend to avoid dense cluster regions, but in contrast to blue galaxies they are not common in low-density fields. With MIR data, Wolf et al. (2009) further show that the mean SSFR of these galaxies in clusters is lower than in the field, in contrast to that of blue galaxies alone, which appears similar in different environments. They also show using HST imaging that edge-on spirals form only a small fraction of spiral galaxies. These authors thus suggest that these obscured SF galaxies are a transitioning population between blue field galaxies and red cluster galaxies in cores.
Finally, an interesting question is how much these obscured SF galaxies account for in the overall SFR density in the universe (e.g., Bell et al., 2007). In the flux-limited sample, we have 506 obscured SF galaxies on the red sequence, 1451 green-valley and 2497 blue-cloud galaxies. Assuming that they have comparable average SSFR and stellar mass, we roughly estimate that of order of total cosmic star formation is contributed by obscured SF galaxies. An exact analysis requires precise SFR measurements, beyond the scope of this paper. We will address this issue in future papers measuring the global SFR density using UV and MIR luminosity.
5.2. IR color-magnitude diagram
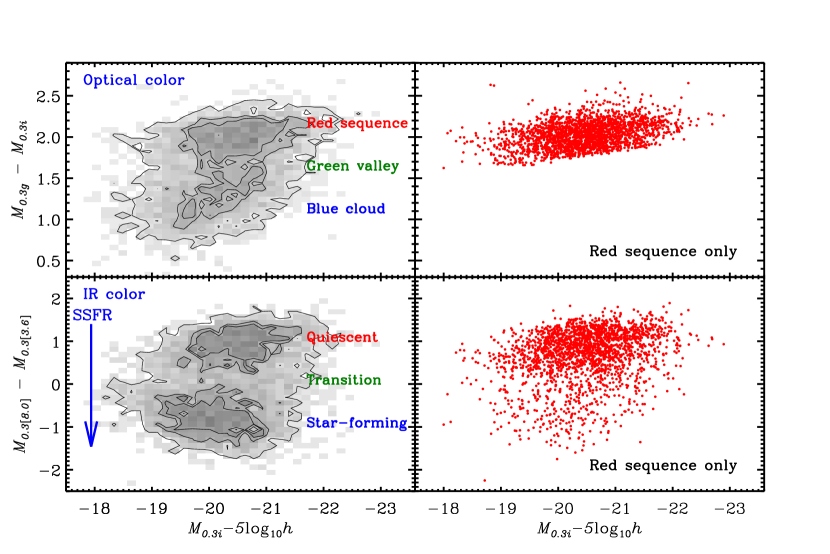
As a proxy for the SSFR-stellar mass relation, the optical color-magnitude diagram is a powerful tool in studying galaxy evolution; however, we argue here that IR color can be more effective in separating star-forming and quiescent galaxies when it is available. As shown above, optical color can be a misleading variable for SSFR and there is a significant fraction of obscured SF galaxies on the red sequence. The fraction depends on luminosity and redshift and may also depend on environment. This complication affects galaxy evolution studies based on optical color. Therefore, it is useful to find more suitable variables tracing SSFR. Examples of such variables are inclination-corrected color (e.g., Maller et al., 2009) and extinction-corrected color from SED fitting (e.g., Brammer et al., 2009). IR color is another, and better, variable than optical color to represent SSFR; therefore, replacing optical color with IR color when available is a better strategy when constructing the color-magnitude diagram.
As an example, in Figure 13 we show both the optical color-magnitude diagram (upper-left panel) and IR color-magnitude diagram (lower-left panel), where we have reversed the IR color to so that SF galaxies are on the bottom. We show all the galaxies in the flux-limited sample at . For non-detections in m channel, we use the lower limits by applying the flux limits () mag in the SWIRE (S-COSMOS) fields. We have also applied simple -corrections using the templates for IRAS and SSP10G04Z to correct the IR color so that it is the color in the channels shifted blueward to , i.e., . The bimodality in the IR color-magnitude diagram is more striking than in the optical color-magnitude diagram. This should not be surprising because the bimodality is caused by the short time-scale of transition from star formation to quiescence. In the right panels, we only plot the red-sequence galaxies and show that a significant fraction of them are in the SF region in the IR color-magnitude diagram, as we quantified in detail above.
6. Summary
With the recently completed PRIsm MUlti-object Survey (PRIMUS), we perform a quantitative study of the fraction of obscured star-forming galaxies on the red sequence at intermediate redshift. PRIMUS targeted fields with existing deep infrared (IR) imaging from the IRAC and MIPS instruments onboard the Spitzer Space Telescope, including fields from the SWIRE survey and a field from the S-COSMOS survey. With the precise redshifts from PRIMUS, we select in these fields an band flux-limited sample of red-sequence galaxies, with mag in the SWIRE fields and mag in the S-COSMOS field, at . With the IR imaging data, we classify the red-sequence galaxies into AGNs, star-forming galaxies, and quiescent galaxies. Our sample is the largest sample at intermediate redshift for such a study and we present for the first time a quantitative analysis of the fraction of obscured star-forming galaxies on the red sequence as a function of luminosity.
We find that on average, at , about of red-sequence galaxies have IR colors () consistent with star-forming galaxies at . The percentage of obscured star-forming galaxies increases by per mag with decreasing luminosity to . At , the fraction has declined by from to . At , the fraction is consistent with no redshift evolution between and .
Using the imaging from MIPS on board Spitzer, we find that of red-sequence galaxies exhibit emission with Jy at redshifts , in agreement with previous studies. With the IRAC imaging, we find that of these galaxies have IR colors consistent with star-forming galaxies, suggesting that star formation accounts for at least part of the emission.
Our analysis suggests that a significant fraction of red-sequence galaxies are actually actively forming stars, but their optical colors are reddened due to dust extinction. An accurate understanding of galaxy evolution using optical color therefore needs to account for this complication. We suggest that IR color, e.g., the IRAC color , should be a better color to use when constructing the color-magnitude diagram to represent the specific star-formation rate-stellar mass relation.
References
- Armus et al. (2007) Armus, L., et al. 2007, ApJ, 656, 148
- Bailin & Harris (2008a) Bailin, J., & Harris, W. E. 2008a, MNRAS, 385, 1835
- Bailin & Harris (2008b) —. 2008b, ApJ, 681, 225
- Baldry et al. (2004) Baldry, I. K., Glazebrook, K., Brinkmann, J., Ivezić, Ž., Lupton, R. H., Nichol, R. C., & Szalay, A. S. 2004, ApJ, 600, 681
- Baldwin et al. (1981) Baldwin, J. A., Phillips, M. M., & Terlevich, R. 1981, PASP, 93, 5
- Balogh et al. (2004) Balogh, M. L., Baldry, I. K., Nichol, R., Miller, C., Bower, R., & Glazebrook, K. 2004, ApJ, 615, L101
- Bell et al. (2006a) Bell, E. F., Phleps, S., Somerville, R. S., Wolf, C., Borch, A., & Meisenheimer, K. 2006a, ApJ, 652, 270
- Bell et al. (2007) Bell, E. F., Zheng, X. Z., Papovich, C., Borch, A., Wolf, C., & Meisenheimer, K. 2007, ApJ, 663, 834
- Bell et al. (2004a) Bell, E. F., et al. 2004a, ApJ, 600, L11
- Bell et al. (2004b) —. 2004b, ApJ, 608, 752
- Bell et al. (2006b) —. 2006b, ApJ, 640, 241
- Blanton & Moustakas (2009) Blanton, M. R., & Moustakas, J. 2009, ARA&A, 47, 159
- Blanton & Roweis (2007) Blanton, M. R., & Roweis, S. 2007, AJ, 133, 734
- Blanton et al. (2003a) Blanton, M. R., et al. 2003a, ApJ, 594, 186
- Blanton et al. (2003b) —. 2003b, ApJ, 592, 819
- Brammer et al. (2009) Brammer, G. B., et al. 2009, ApJ, 706, L173
- Brand et al. (2006) Brand, K., et al. 2006, ApJ, 644, 143
- Brand et al. (2009) —. 2009, ApJ, 693, 340
- Brown et al. (2007) Brown, M. J. I., Dey, A., Jannuzi, B. T., Brand, K., Benson, A. J., Brodwin, M., Croton, D. J., & Eisenhardt, P. R. 2007, ApJ, 654, 858
- Bruzual & Charlot (2003) Bruzual, G., & Charlot, S. 2003, MNRAS, 344, 1000
- Bundy et al. (2010) Bundy, K., et al. 2010, ApJ, 719, 1969
- Calzetti et al. (2007) Calzetti, D., et al. 2007, ApJ, 666, 870
- Chabrier (2003) Chabrier, G. 2003, PASP, 115, 763
- Cimatti et al. (2006) Cimatti, A., Daddi, E., & Renzini, A. 2006, A&A, 453, L29
- Coia et al. (2005) Coia, D., et al. 2005, A&A, 430, 59
- Colless et al. (2001) Colless, M., et al. 2001, MNRAS, 328, 1039
- Coil et al. (2010) Coil, A. L., et al. 2010, ApJ, submitted
- Cool et al. (2008) Cool, R. J., et al. 2008, ApJ, 682, 919
- Cooper et al. (2008) Cooper, M. C., et al. 2008, MNRAS, 383, 1058
- Davis et al. (1982) Davis, M., Huchra, J., Latham, D. W., & Tonry, J. 1982, ApJ, 253, 423
- Davis et al. (2003) Davis, M., et al. 2003, in Presented at the Society of Photo-Optical Instrumentation Engineers (SPIE) Conference, Vol. 4834, Society of Photo-Optical Instrumentation Engineers (SPIE) Conference Series, ed. P. Guhathakurta, 161–172
- Davoodi et al. (2006) Davoodi, P., et al. 2006, MNRAS, 371, 1113
- Demarco et al. (2005) Demarco, R., et al. 2005, A&A, 432, 381
- Dressler (1980) Dressler, A. 1980, ApJ, 236, 351
- Driver et al. (2007) Driver, S. P., Popescu, C. C., Tuffs, R. J., Liske, J., Graham, A. W., Allen, P. D., & de Propris, R. 2007, MNRAS, 379, 1022
- Eisenhardt et al. (2004) Eisenhardt, P. R., et al. 2004, ApJS, 154, 48
- Elbaz et al. (2007) Elbaz, D., et al. 2007, A&A, 468, 33
- Faber et al. (2007) Faber, S. M., et al. 2007, ApJ, 665, 265
- Farrah et al. (2003) Farrah, D., Afonso, J., Efstathiou, A., Rowan-Robinson, M., Fox, M., & Clements, D. 2003, MNRAS, 343, 585
- Fazio et al. (2004) Fazio, G. G., et al. 2004, ApJS, 154, 10
- Feruglio et al. (2010) Feruglio, C., et al. 2010, ApJ, 721, 607
- Gallazzi et al. (2008) Gallazzi, A., Brinchmann, J., Charlot, S., & White, S. D. M. 2008, MNRAS, 383, 1439
- Garilli et al. (2008) Garilli, B., et al. 2008, A&A, 486, 683
- Hammer et al. (1997) Hammer, F., et al. 1997, ApJ, 481, 49
- Hopkins et al. (2006) Hopkins, P. F., Hernquist, L., Cox, T. J., Di Matteo, T., Robertson, B., & Springel, V. 2006, ApJS, 163, 1
- Kauffmann et al. (2004) Kauffmann, G., White, S. D. M., Heckman, T. M., Ménard, B., Brinchmann, J., Charlot, S., Tremonti, C., & Brinkmann, J. 2004, MNRAS, 353, 713
- Kauffmann et al. (2003) Kauffmann, G., et al. 2003, MNRAS, 341, 33
- Labbé et al. (2005) Labbé, I., et al. 2005, ApJ, 624, L81
- Lacy et al. (2004) Lacy, M., et al. 2004, ApJS, 154, 166
- Li & Draine (2001) Li, A., & Draine, B. T. 2001, ApJ, 554, 778
- Lilly et al. (2007) Lilly, S. J., et al. 2007, ApJS, 172, 70
- Lonsdale et al. (2003) Lonsdale, C. J., et al. 2003, PASP, 115, 897
- Lotz et al. (2008) Lotz, J. M., et al. 2008, ApJ, 672, 177
- Madau et al. (1996) Madau, P., Ferguson, H. C., Dickinson, M. E., Giavalisco, M., Steidel, C. C., & Fruchter, A. 1996, MNRAS, 283, 1388
- Maller et al. (2009) Maller, A. H., Berlind, A. A., Blanton, M. R., & Hogg, D. W. 2009, ApJ, 691, 394
- Marinoni et al. (1999) Marinoni, C., Monaco, P., Giuricin, G., & Costantini, B. 1999, ApJ, 521, 50
- Martin et al. (2005) Martin, D. C., et al. 2005, ApJ, 619, L1
- Masters et al. (2003) Masters, K. L., Giovanelli, R., & Haynes, M. P. 2003, AJ, 126, 158
- Moustakas et al. (2004) Moustakas, L. A., et al. 2004, ApJ, 600, L131
- Popesso et al. (2007) Popesso, P., Biviano, A., Romaniello, M., & Böhringer, H. 2007, A&A, 461, 411
- Pozzetti & Mannucci (2000) Pozzetti, L., & Mannucci, F. 2000, MNRAS, 317, L17
- Rieke et al. (2009) Rieke, G. H., Alonso-Herrero, A., Weiner, B. J., Pérez-González, P. G., Blaylock, M., Donley, J. L., & Marcillac, D. 2009, ApJ, 692, 556
- Rieke et al. (2004) Rieke, G. H., et al. 2004, ApJS, 154, 25
- Rix et al. (2004) Rix, H., et al. 2004, ApJS, 152, 163
- Rodighiero et al. (2007) Rodighiero, G., Cimatti, A., Franceschini, A., Brusa, M., Fritz, J., & Bolzonella, M. 2007, A&A, 470, 21
- Rujopakarn et al. (2010) Rujopakarn, W., et al. 2010, ApJ, 718, 1171
- Saintonge et al. (2008) Saintonge, A., Tran, K., & Holden, B. P. 2008, ApJ, 685, L113
- Salpeter (1955) Salpeter, E. E. 1955, ApJ, 121, 161
- Sanders et al. (2007) Sanders, D. B., et al. 2007, ApJS, 172, 86
- Shao et al. (2007) Shao, Z., Xiao, Q., Shen, S., Mo, H. J., Xia, X., & Deng, Z. 2007, ApJ, 659, 1159
- Smith et al. (2007) Smith, J. D. T., et al. 2007, ApJ, 656, 770
- Stern et al. (2005) Stern, D., et al. 2005, ApJ, 631, 163
- Strateva et al. (2001) Strateva, I., et al. 2001, AJ, 122, 1861
- Tully et al. (1998) Tully, R. B., Pierce, M. J., Huang, J., Saunders, W., Verheijen, M. A. W., & Witchalls, P. L. 1998, AJ, 115, 2264
- Unterborn & Ryden (2008) Unterborn, C. T., & Ryden, B. S. 2008, ApJ, 687, 976
- van Dokkum (2008) van Dokkum, P. G. 2008, ApJ, 674, 29
- Verdugo et al. (2008) Verdugo, M., Ziegler, B. L., & Gerken, B. 2008, A&A, 486, 9
- Weiner et al. (2005) Weiner, B. J., et al. 2005, ApJ, 620, 595
- Weinmann et al. (2006) Weinmann, S. M., van den Bosch, F. C., Yang, X., & Mo, H. J. 2006, MNRAS, 366, 2
- Werner et al. (2004) Werner, M. W., et al. 2004, ApJS, 154, 1
- Williams et al. (2009) Williams, R. J., Quadri, R. F., Franx, M., van Dokkum, P., & Labbé, I. 2009, ApJ, 691, 1879
- Willmer et al. (2006) Willmer, C. N. A., et al. 2006, ApJ, 647, 853
- Wolf et al. (2005) Wolf, C., Gray, M. E., & Meisenheimer, K. 2005, A&A, 443, 435
- Wolf et al. (2003) Wolf, C., Meisenheimer, K., Rix, H., Borch, A., Dye, S., & Kleinheinrich, M. 2003, A&A, 401, 73
- Wolf et al. (2004) Wolf, C., et al. 2004, A&A, 421, 913
- Wolf et al. (2009) —. 2009, MNRAS, 393, 1302
- Wuyts et al. (2007) Wuyts, S., et al. 2007, ApJ, 655, 51
- Yan & Thompson (2003) Yan, L., & Thompson, D. 2003, ApJ, 586, 765
- York et al. (2000) York, D. G., et al. 2000, AJ, 120, 1579
- Zhu et al. (2010) Zhu, G., Blanton, M. R., & Moustakas, J. 2010, ApJ, 722, 491
- Zhu et al. (2009) Zhu, G., Moustakas, J., & Blanton, M. R. 2009, ApJ, 701, 86