The thermodynamic and kinetic properties of hydrogen dimers on graphene
Abstract
The thermodynamic and kinetic properties of hydrogen adatoms on graphene are important to the materials and devices based on hydrogenated graphene. Hydrogen dimers on graphene with coverages varying from 0.040 to 0.111 ML (1.0 ML cm-2) were considered in this report. The thermodynamic and kinetic properties of H, D and T dimers were studied by ab initio simulations. The vibrational zero-point energy corrections were found to be not negligible in kinetics, varying from 0.038 (0.028, 0.017) to 0.257 (0.187, 0.157) eV for H (D, T) dimers. The isotope effect exhibits as that the kinetic mobility of a hydrogen dimer decreases with increasing the hydrogen mass. The simulated thermal desorption spectra with the heating rate K/s were quite close to experimental measurements. The effect of the interaction between hydrogen dimers on their thermodynamic and kinetic properties were analyzed in detail.
pacs:
68.65.Pq, 67.63.-r, 68.43.BcI INTRODUCTION
The thermodynamic and kinetic properties of hydrogen (isotopes) on graphene can help us understand the interaction between hydrogen and graphitic materials in outer spacecoey ; hornekaer96 ; hornekaer97 ; ferro368 and fusion devices.ferro368 ; morris Such properties also determine the realizability of the graphene(graphite)-based hydrogen storageanthony and the graphene-based electronic devices.shytov ; ryu ; elias ; sofo75 ; balog131 ; bostwick103 ; guisinger9 ; luo3 ; lebegue79 And the hydrogenated graphene (graphite) has been one focus of scientific researches in recent years.
Thermal desorption (TD) spectroscopy, which is also called temperature-programmed desorption (TPD) spectroscopy, has been used in experiments to study the kinetic properties of hydrogen on the graphite surface.hornekaer96 ; zecho42 ; zecho117 ; andree425 T. Zecho et al.zecho42 ; zecho117 found that the saturation coverages () of H and D on graphite surface are about 0.3 and 0.4 ML, respectively. The TD spectra of H and D (heating rate K/s) both exhibit two-peak shapes when the coverage , and the increase in just results in some minor modification of the two-peak shapes. L. Horkekær et al. found that there are mainly two kinds of hydrogen dimers responsible for the two-peak shapes of the TD spectra at low hydrogen coverage, which are the ortho-dimer and para-dimer. In the two-peak shaped TD spectra, the two desorption peaks are at 445 (490) K and 560 (580) K for H (D) adatoms, respectively,zecho42 ; zecho117 where the positions of the desorption peaks increase with the hydrogen mass. F. Dumont et al. have simulated the TD spectra of hydrogen dimers on graphene by using the kinetic Monte Carlo method,dumont77 and reproduced the two-peak shaped TD spectra. And E. Gavardi et al. also have simulated the two-peak shaped TD spectra by the same method but taken hydrogen trimers and tetramers into consideration.gavardi477 These experimental and theoretical results indicate that the hydrogen ortho-dimer and para-dimer should be still the most important dimers responsible for the near-two-peak shapes of the TD spectra at high coverages. This is consistent with that the configurations of the ortho-dimer and para-dimer always tend to be preserved in hydrogen trimers and tetramers.gavardi477 ; roman78
However, the kinetic properties of hydrogen dimers still need more accurate simulations, especially the vibrations should be taken into consideration. Because the mass of hydrogen isotopes are so small that the vibrational zero-point energy corrections may not be negligible in kinetics. The thermodynamic and kinetic properties of hydrogen dimers are expected to be sensitively dependent on their microscopic structures, on which systematic and accurate investigations are still lacking.
In this report, the thermodynamic and kinetic properties of H, D and T dimers on graphene are simulated with a composite method consisting of density functional theory (DFT),kohn140 density functional perturbation theory (DFPT),baroni73 harmonic transition state theory (hTST),eyring3 ; vineyard3 ; hanggi62 ; pollak15 ; toyoura78 and reaction rate theory.hanggi62 The effect of the interaction between hydrogen dimers on the thermodynamic and kinetic properties of hydrogen dimers on graphene are studied. The isotope effects in the kinetic properties are observed due to the inclusion of the vibrations in the simulations. The simulated TD spectra of H and D dimers with the heating rate K/s are very close to experimental measurements, and the TD spectra of T (radioactive) dimers are also predicted.
II METHODOLOGY
The adsorption energy of a hydrogen dimer is defined to be the energy difference before and after the adsorption of two hydrogen atoms on graphene, which is expressed as
| (1) |
where , and are the total electronic energies of an isolated hydrogen atom, an isolated graphene layer and a graphene layer with a chemisorbed hydrogen dimer on it, respectively.
The frequency () of an over-barrier jump from one local minimum state (initial state) to another local minimum state (final state) can be calculated using the quantum-mechanically modified harmonic transition state theory (hTST), which is expressed aseyring3 ; toyoura78
| (2) | |||||
where is the quantum-modified exponential prefactor; is the activation energy; N is the number of atoms; and are the frequencies of the ith vibrational mode in the initial and saddle-point states in the reaction path, respectively. The numbers and denote that the initial state has real vibrational modes and the saddle-point state has real modes with 1 imaginary mode excluded in the calculation. The activation energy here is defined to be the vibrational zero-point energy corrected potential barrier, which is expressed as
| (3) | |||||
where is the potential barrier in the reaction path; is the vibrational zero-point energy correction. When the temperature approaches to be infinite, the classical limit of the prefactor is expressed as
| (4) |
This classical-limit form is also the Vineyard's form,vineyard3 where all of the vibrational modes are assumed to be completely thermo-activated.
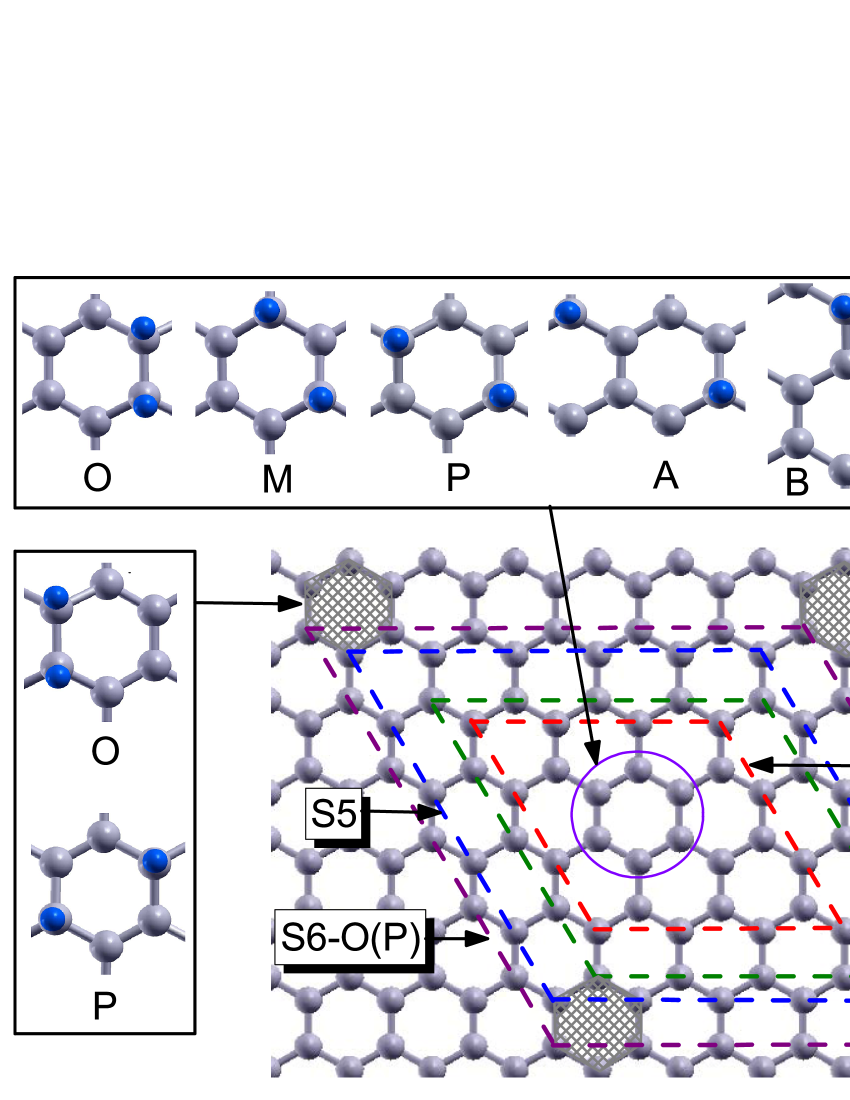
In this report, a mono-layer graphene is used as a structural model, which is also a safe model for graphite surface because the weak Van de Waals interaction between neighboring graphene layers has negligible effect on the chemisorption properties of hydrogen.hornekaer96 ; hornekaer97 ; lfhuang1 ; sljivancanin131 The vacuum between two neighboring layers is 10 Å. And s of 0.111, 0.063 and 0.040 ML (1.0 ML cm-2) are computationally achieved by chemisorbing a hydrogen dimer at the center of periodic graphene supercells with sizes of (S3), (S4), and (S5) times of the graphene unit cell, respectively (Fig. 1). Besides, a para-dimer decorated supercell (S6-P) and an ortho-dimer decorated supercell (S6-O), as shown in Fig. 1, are designed to allow a hydrogen dimer chemisorbed at the supercell center ( ML). The choice of the para- and ortho-dimer for decoration is due to that the two dimers were found to be the most stable hydrogen dimers on graphene.sljivancanin131 In experimental observations, hydrogen adatoms (including dimers) tend to cluster on graphite surface,hornekaer96 ; hornekaer97 making some spots covered by hydrogen while some not. This un-uniform distribution of hydrogen indicates that the in simulation should correspond to the effective hydrogen coverage of the hydrogen-covering spots. There are 5 configurations of hydrogen dimers on graphene considered here, which are ortho-dimer (O), meta-dimer (M), para-dimer (P), A-dimer (A) and B-dimer (B) as shown in Fig. 1, as well as the desorbed hydrogen molecule (H2). Other more extended hydrogen dimerssljivancanin131 are not considered.
The structures and potential barriers are calculated using DFT and the vibrational frequencies using DFPT. The DFT and DFPT calculations are carried out using the Quantum Espresso code package,giannozzi21 in which the ultrasoftvanderbilt41 pseudopotentials with the BLYPbecke38 ; lee37 exchange-correlation functional are used. The energy cutoffs for the wave function and charge density are 35 and 350 Ry, respectively. Uniform k-point grids are chosen to be , , and for the S3, S4, S5 and S6-P(O) cases, respectively. The Methfessel-Paxton smearing techniquemethfessel40 with an energy width of 0.03 Ry is employed to speed the convergence of the numerical calculations. The electronic density of states (DOS) for the chemisorption states in the S5 case is calculated with a k-point grid and the tetrahedron interpolation scheme.blochl49 The reaction paths are described by the minimum energy paths (MEPs) between two local minimum states, which are calculated using the climbing-image nudged elastic band method.henkelman113 For the calculation of the vibrational frequencies, only the point at the Brillouin zone center is chosen.
III RESULTS AND DISCUSSION
III.1 DFT and hTST calculations
The calculated adsorption energies for the P-dimer () and O-dimer () on the S3, S4, S5, S6-P and S6-O graphene supercells are listed in Tab. 1. In the S3, S4 and S5 cases, generally increases with , with the only exception that the in the S3 case is a little (9 meV) less than that in the S4 case. This indicates the attractive interaction between the neighboring dimers, which is consistent with the clustering of hydrogen adatoms on graphite surface observed in experiments.hornekaer96 ; hornekaer97 This is because one chemisorbed dimer can cause the carbon lattice around wrinkled, and partly destroy the orbital hybridization of the carbon atoms nearby, which can increase the affinity of those carbon atoms to bond with another hydrogen dimer. However, the in the S6-P(O) case is larger than those both in the S4 and S5 cases, and the in the S6-P(O) case is larger than those in all the S3, S4 and S5 cases, although the of the S6-P(O) case is lower than those of the S3 and S4 cases. This is due to the effect of the periodic boundary conditions (PBC) we take for the DFT calculations here. In the S3, S4 and S5 cases, two interacting dimers are the periodic images of each other. While in the S6-P and S6-O cases, a dimer can interact with the decoration dimer at the corner of the same supercell. Thus, in the S3, S4 and S5 cases, the PBC will partly suppress the wrinkling of the carbon lattice caused by the adsorption of a dimer, while in the S6-P and S6-O cases, a dimer feels more wrinkling caused by the decoration dimer in the same supercell. Thus, this PBC effect on the thermodynamic stability of hydrogen dimers on graphene also approves that the wrinkling of the carbon lattice will result in the attractive interaction between dimers on graphene.
The calculated potential barriers () for various transitions of the hydrogen dimers on the S3, S4, S5, S6-P and S6-O supercells are listed in Tab. 2. It can be seen that is dependent on both and the structural configuration, the same as and described in the previous paragraph. In all cases, the optimal reaction path for an O-dimer to be desorbed is O-M-P-H2, and that for the P-dimer is P-H2, which is consistent with Hornekær's results.hornekaer96 ; sljivancanin131 Other transitions out of the O-M-P-H2 reaction path should overcome higher potential barriers, e.g. (M-B) is 0.189 eV larger than (M-P) in the S6-P case (much larger in other four cases). This magnitude of difference will result in that the possibility of the M-P transition is about 3 orders larger than that of the M-B transition at 300 K (estimated by Equ. 2). Thus, the M-B transition could be safely neglected when compared with the M-P transition. In addition, according to the calculations by Hornekær and Šljivančanin,hornekaer96 ; hornekaer97 ; sljivancanin131 the evaporation of hydrogen monomers from dimers also needs overcome much higher potential barriers. Therefore, only the transitions in the optimal path O-M-P-H2 are considered in the simulation of the TD spectra in the following. For an isolated dimer on graphene, there may be more than one paths that are equivalent for one kind of transition, e.g. there are 4 equivalent paths for the O-M transition. The number of equivalent paths for a transition is defined as the degeneracy of the reaction path (). The values of the s for the transitions of an isolated dimer on graphene are listed in Tab. 2, where the s for the adsorbing transitions (H2-M, H2-P and H2-O) are absent, because they are hardly and unnecessarily defined in the simulations here. However, when is high enough, the interaction between dimers will tend to make two different paths of the same kind transition have different s, namely the is reduced. Among the transitions in the optimal path, the P-H2 and O-M transitions are the most important ones (the rate-limiting steps) for the TD spectra, which will be shown in the following. The (O-M) and (P-H2) generally increase with in the S3, S4 and S5 cases, which indicates that it is harder for hydrogen dimers to be desorbed from graphene at higher s. This is the same as the effect of on the thermodynamic stability of hydrogen dimers on graphene, as discussed in the previous paragraph. However, the (O-M) in the S6-O case and the (P-H2) in the S6-O(P) case are larger than those in the S3, S4 and S5 cases. This is because the PBC effect tend to make the dimers on a S6-P(O) supercell more stable than those on the S3, S4 and S5 supercells. Thus, it costs more energy for a dimer in the S6-P(O) case to escape from one state to transit to another state.
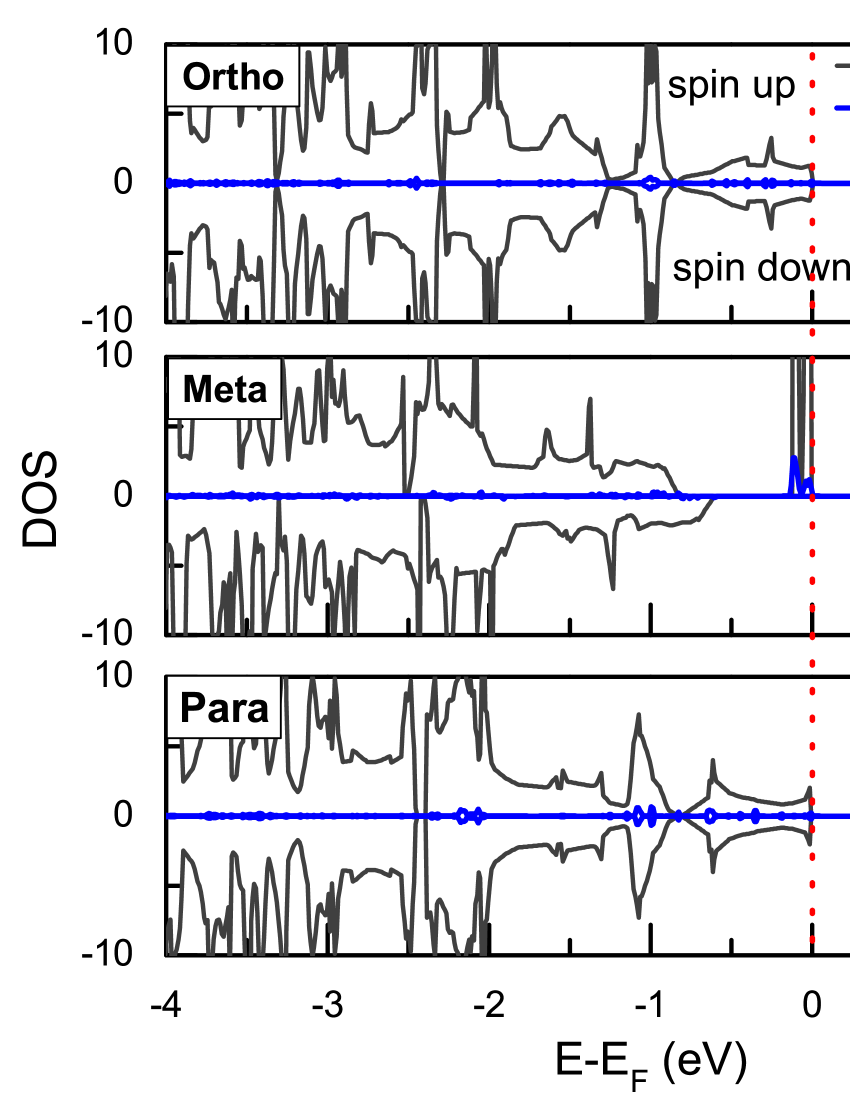
The adsorption of a hydrogen dimer onto two C atoms in graphene will change these C atoms from to hybridized. Seen from the DOS spectra for the systems of S5+O-dimer, S5+M-dimer and S5+P-dimer (Fig. 2), the hybridization between hydrogen dimers and graphene makes graphene be semiconducting. The band gap are 0.43, 0.36 and 0.38 eV for S5+O-dimer, S5+M-dimer and S5+P-dimer, respectively. However, the DOS spectra for S5+M-dimer are different from those for S5+O-dimer and S5+P-dimer. Only in the DOS spectra of S5+M-dimer, there are four narrow peaks around the Fermi level, two spin-up (occupied) and two spin-down (unoccupied). And S5+M-dimer is magnetic with a spin moment of 2.0 , while the other two are nonmagnetic. The two C atoms bonded with M-dimer are equivalent in graphene, a bipartite system, while those C atoms bonded with O(P)-dimer are inequivalent. The difference in magnetism is due to this difference in the hydrogen-bonded sites, which can be understood from the Lieb's theorem for the bipartite system.lieb62 The adsorption of a M-dimer leaves two unsaturated orbitals, which then form two quasilocal states around the M-dimer, with each state holding one electron and a spin moment of 1.0 . This is the same as the adsorption of the hydrogen monomer on graphene.lfhuang1 ; casolo130 ; casolo81 The contributions of the H() orbitals to these quasilocal states are very small. However, the two unsaturated orbitals in S5+O-dimer or S5+P-dimer bond with each other, thus, there are no quasilocal states and magnetic moment in these two systems. This bonding between these two orbitals makes the O-dimer and P-dimer be more stable than the M-dimer (Tab. 2). Although the transition of a hydrogen dimer changes the magnetism of the hydrogenated graphene, the system is dominated by nonmagnetic states. Because the M-dimer is metastable (seen from the s in Tab. 2), and its lifetime at 300 K is less than 1.0 s, as simulated below. The two hydrogen atoms of a dimer prefer to adsorb on two inequivalent C atoms in graphene. Likewise, from the energetic calculations for more extended dimerssljivancanin131 and trimersroman78 on graphene, a configuration is also much more stable when two nearest-neighboring hydrogen atoms are bonded with inequivalent C atoms in graphene.
The calculated s for the transitions of H, D and T dimers in the optimal path O-M-P-H2 are listed in Tab. 3, where the results for the S3 and S5 cases are compared. The differences between these two groups are very small, especially for the s of the two rate-limiting transitions, O-M and P-H2 (within 6 meV). This implies that the vibrational properties of the hydrogen dimers on graphene are mainly determined by the localized vibrational modes, which is the same as those of the hydrogen monomer on graphene.lfhuang1 It also can be seen that decreases with increasing the hydrogen mass. This isotope effect is also the same as that of the hydrogen monomer on graphene in Ref. lfhuang1, , where the relationship between the isotope effects in phonon spectra and was analyzed in detail. The s for the diffusing transitions (O-M, M-O, M-P, P-M) are less than those for the desorbing transition (P-H2), which is also the same as that of the hydrogen monomer on graphene.lfhuang1 The values of the s for H (D, T) dimer vary from 0.038 (0.028, 0.017) to 0.257 (0.187, 0.157) eV, which are large enough that can not be omitted in kinetics.
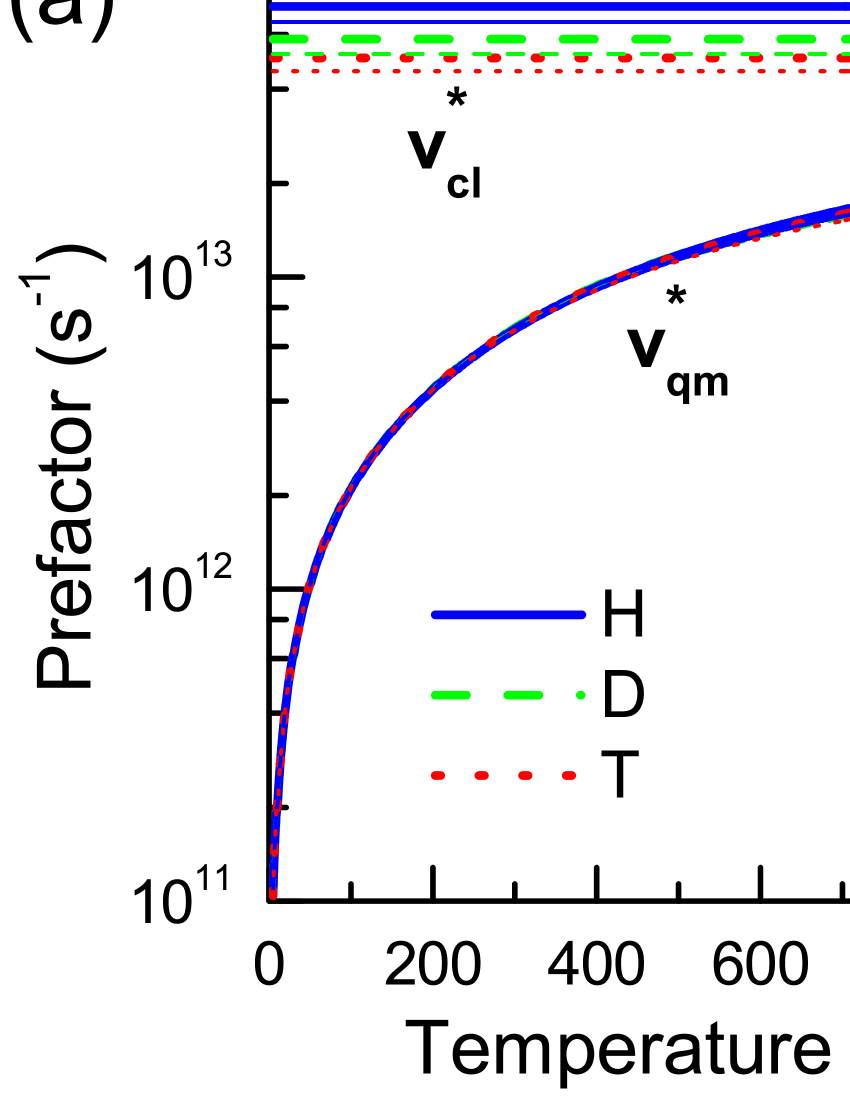
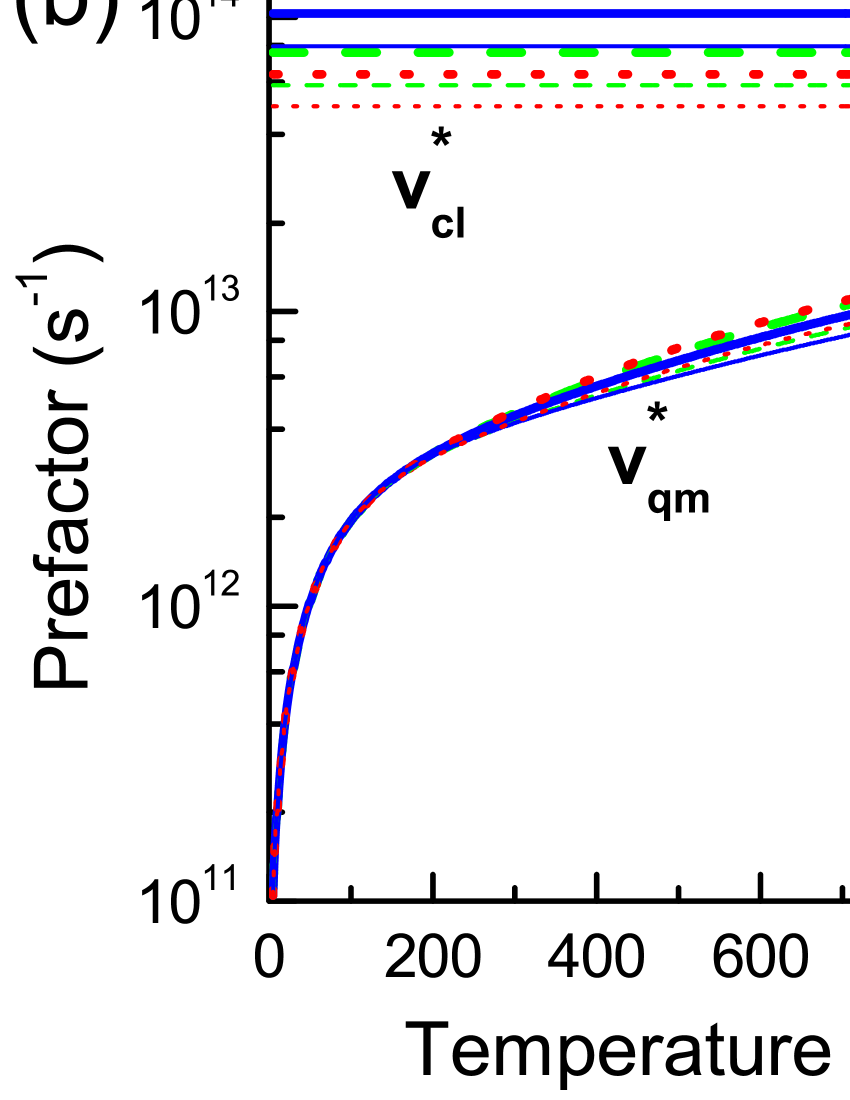
The small difference between the vibrational properties of hydrogen dimers in the S3 and S5 cases has also been found by comparing the prefactors for the O-M and P-H2 transitions of H, D and T dimers in these two cases (Fig. 3). In the plotted temperature range, the differences between these two cases are within 20%, and the differences within 15%. Since is just linearly dependent on (Equ. 2), a small difference () in the value of will not result in any significant deviation in the kinetic properties, e. g. the TD spectra. Consequently, the vibrational frequencies from the S3 case are used in the simulations of the kinetic properties of hydrogen dimers in all cases, which is a quite accurate treatment and brings much convenience to the numerical simulations. Seen from Fig. 3, decreases with increasing the hydrogen mass, while the variation of with the hydrogen mass is different. The for the O-M transition is nearly invariant with the hydrogen mass in the plotted temperature range, while that for the P-H2 transition increases with the hydrogen mass. These isotope effects in and of the hydrogen dimer are the same as those for the desorption and diffusion of the hydrogen monomer on graphene,lfhuang1 which has been understood from the isotope effect of the spectra of the localized vibrational modes of hydrogen and analyzed in detail in Ref. lfhuang1, . The hydrogen dimers are kinetically active in the temperature range from 350 to 650 K, above which the dimers have been completely desorbed (shown below). In this temperature range, the s for the O-M transition vary from 8 to s-1, and those for the P-H2 transition vary from 5 to s-1.
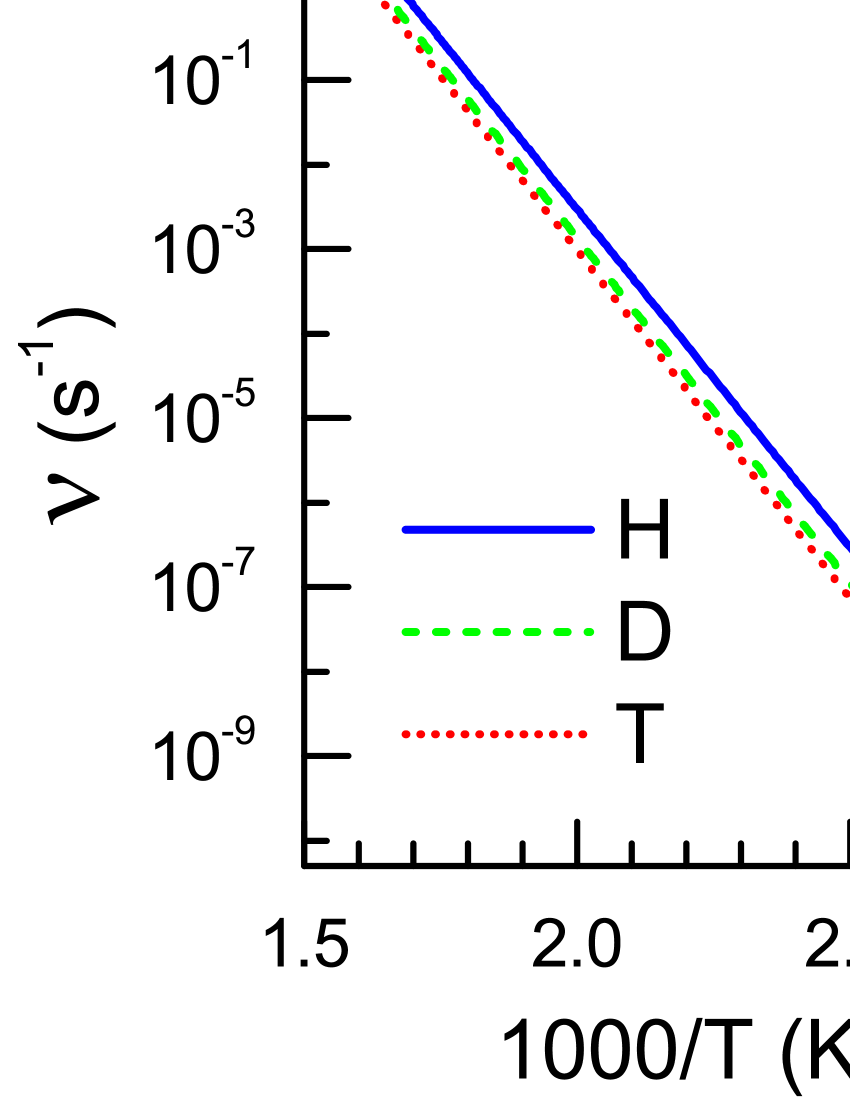
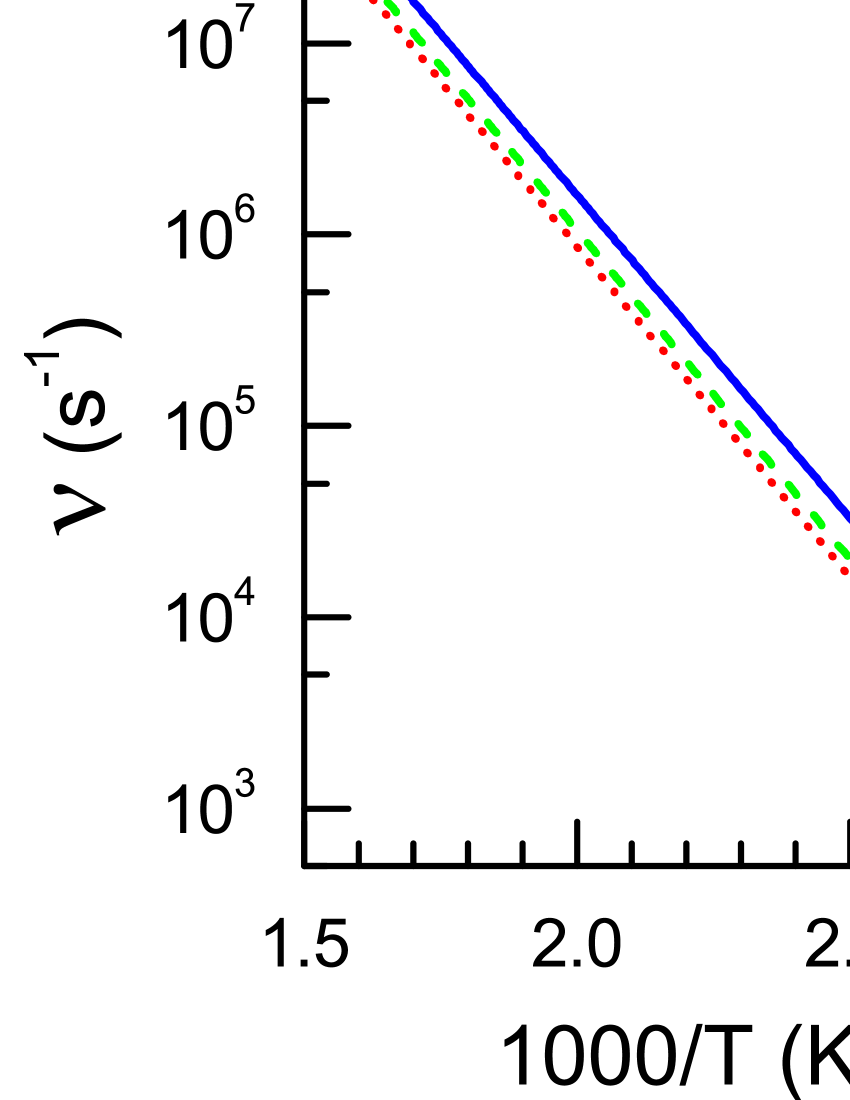
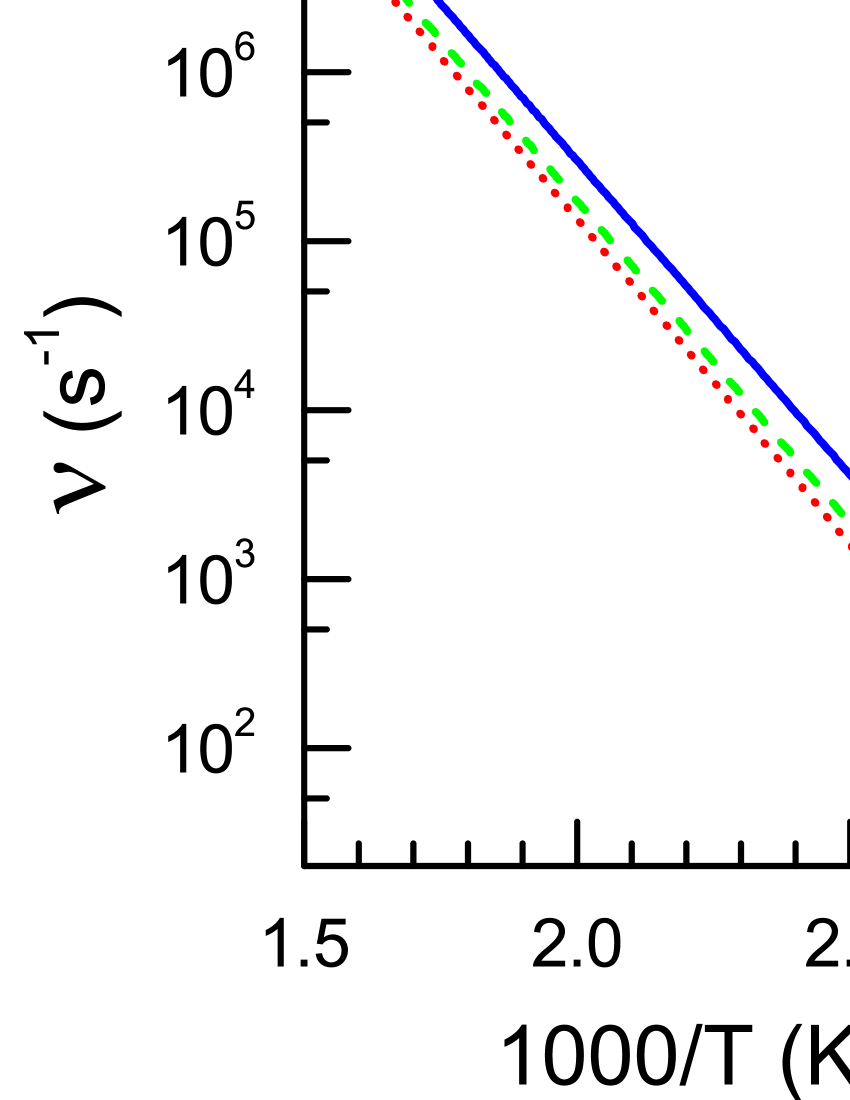
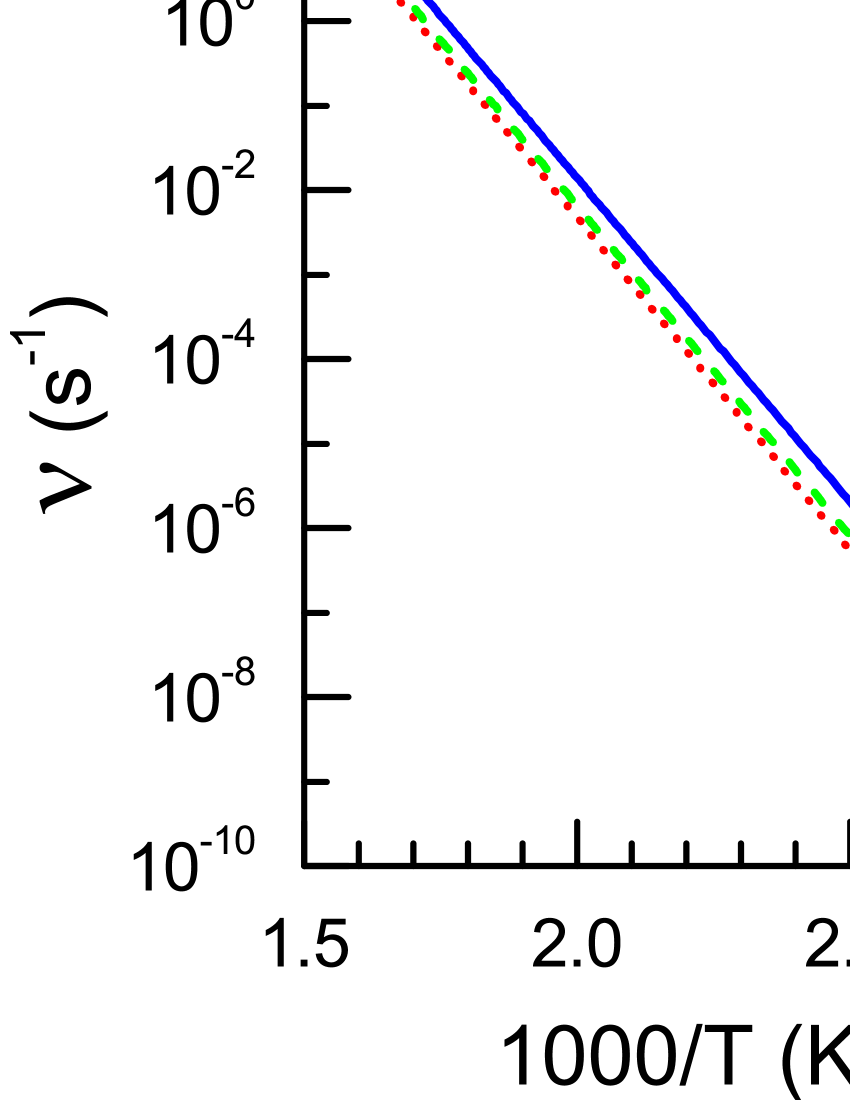
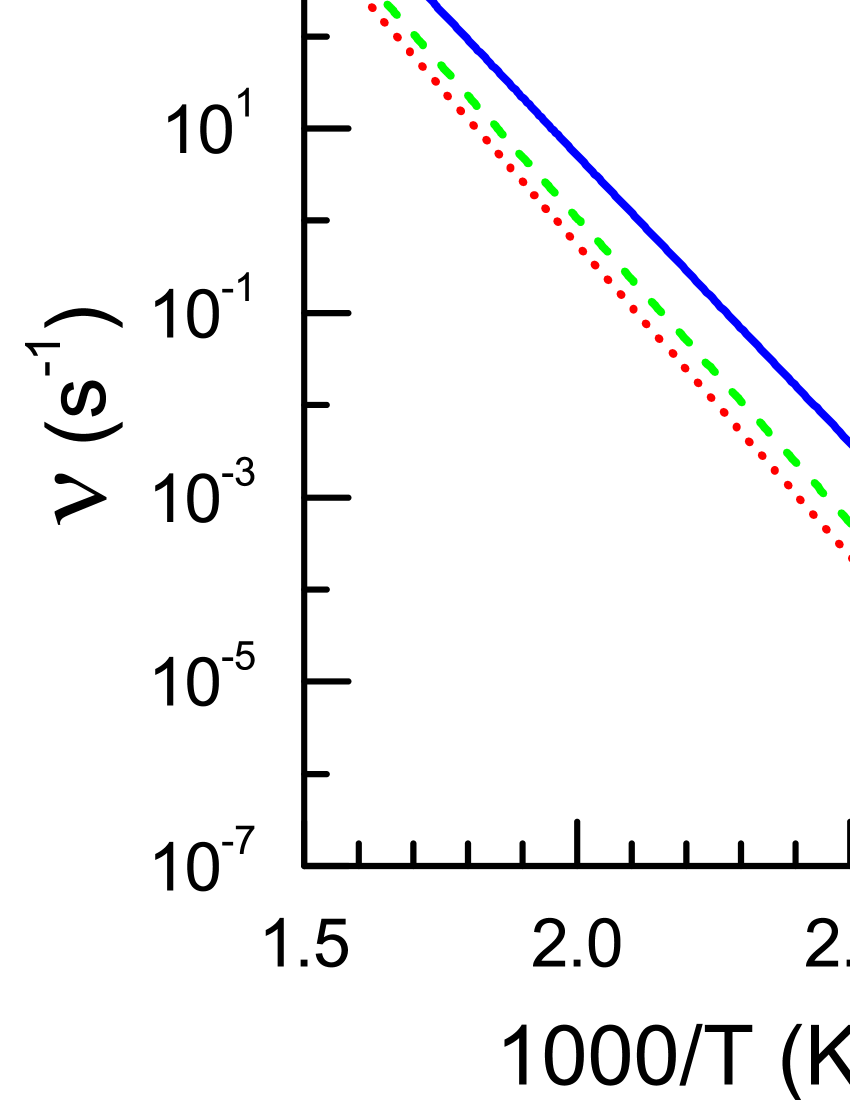
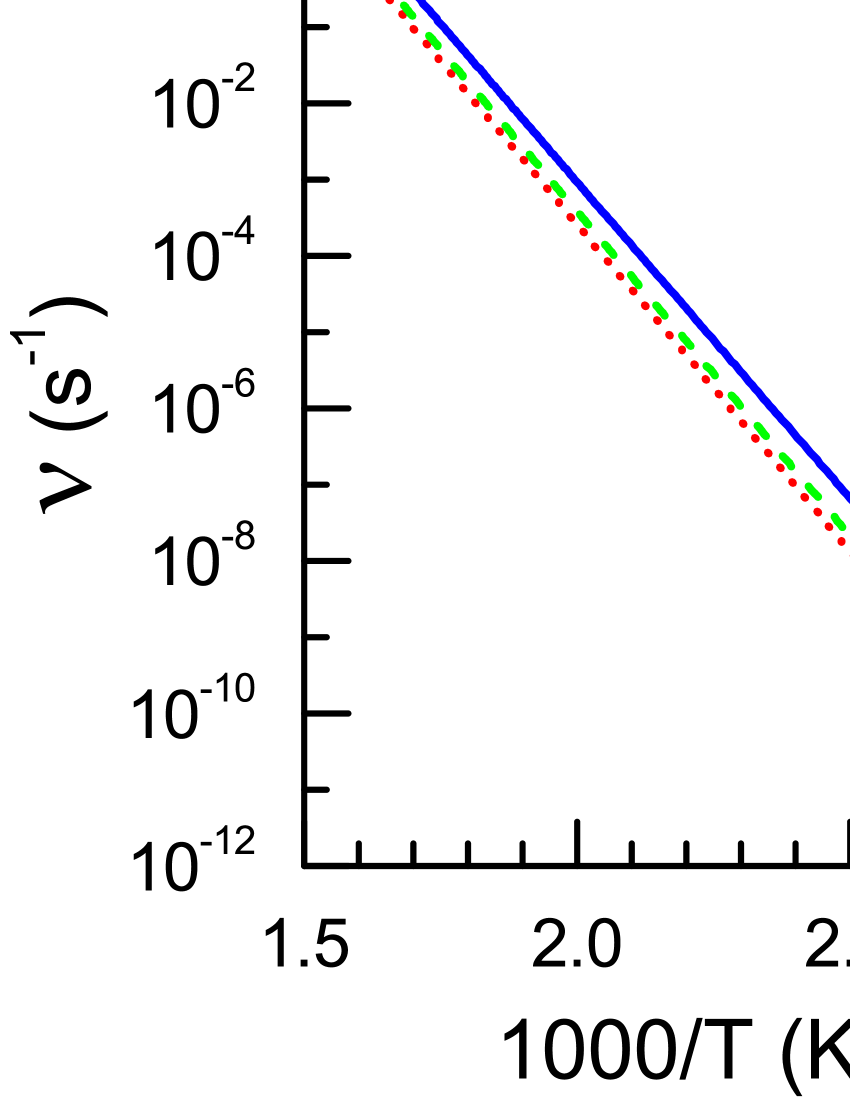
The calculated jump frequencies for the transitions of H, D and T dimers on the S6-P supercell are shown in Fig. 4 (a - e). The jump frequency of a transition in other cases (, X = S3, S4, S5, S6-O) can be deduced from the corresponding in the S6-P case by the equation
| (5) |
where is the difference of the for a transition in the X case and the S6-P case. The values of the s for all the transitions in all the cases are listed in Tab. 2. The isotope effect in is that it decreases with increasing the hydrogen mass, which is due to the isotope effect in (Tab. 3) and is the same as that of the hydrogen monomer on graphenelfhuang1 . In the temperature range from 350 to 650 K, the jump frequencies for the M-O and M-P transitions are at least 4 orders larger than those for the O-M, P-M and P-H2 transitions. Because is exponentially dependent on or (Equ. 2 and 4) and the s for the M-O and M-P transitions are much less than those for the O-M, P-M and P-H2 transitions. The life time of the M-dimer () in the S6-P case is less than 1.0 s at 300 K, and decreases exponentially with temperature. And is much less in other cases due to their lower s for the M-P and M-O transitions (Tab. 2). Thus, although the M-dimer is an important configuration in the kinetic transitions of a hydrogen dimer on graphene, it has not been observed in experimentshornekaer96 ; andree425 and theoretical simulations.dumont77 Furthermore, transition is at lest 2 orders larger than , which indicates that the O-dimer is kinetically more stable than the P-dimer on graphene.
III.2 The simulation of the TD spectra
In the optimal path of O-M-P-H2, the jump frequencies for the M-O () and M-P () transitions are at least 4 orders of magnitude larger than those for other transitions in the temperature range from 350 to 650 K. Thus, it is reasonable to assume that when a dimer succeeds in jumping from O-dimer state to M-dimer state, it will immediately turn to be O-dimer or P-dimer state. Following the treatment by Toyoura in Ref. toyoura78, for the diffusion of lithium in the intercalated graphite, the mean time of the total jump is the sum of those of the individual jump steps, , where and , with the of each transition path being accounted. An O-P transition is accomplished if the M-dimer finally succeeds in jumping to be a P-dimer. Then the jump frequency for this O-P transition is given by
| (6) | |||||
| (7) |
where Equ. 7 is exact only for the isolated dimers on graphene and () equals 4 there; or is the success probability of the M-P jump from a M-dimer. is regarded as the path degeneracy of the O-P transition, and Equ. 7 is used for non-isolated dimers on graphene where is treated as a variable. Likewise, the jump frequency for the P-O transition is given by
| (8) |
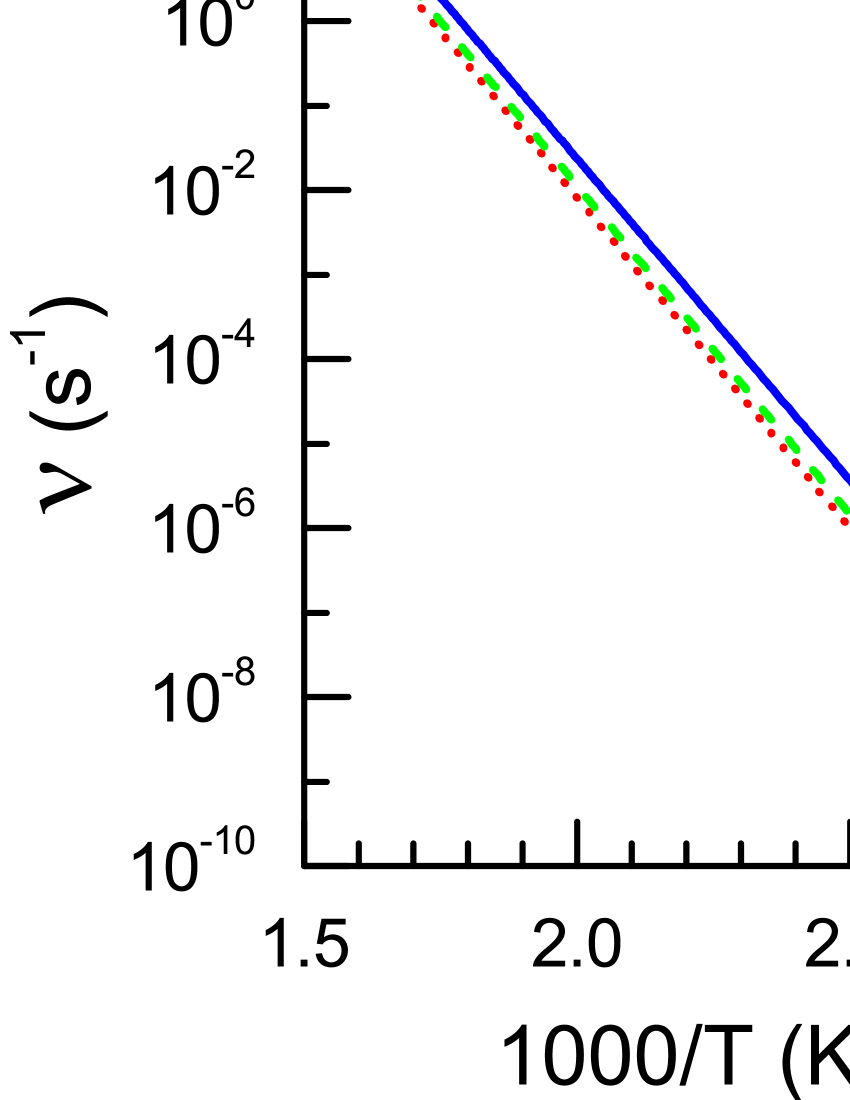
The interaction between neighboring hydrogen dimers tends to lower the values of and from 4. Both of and are taken to be equal in the simulation of the TD spectra for convenience. In Fig. 4 (f) and (g), the calculated s and s for H, D and T dimers are shown, with and both being taken an intermediate value of 2. and are mainly determined by and , respectively, with the multiplying factors in Equ. 7 and 8 just varying from 0.5 to 1.0 in the temperature range from 350 to 650 K. and decrease with increasing the hydrogen mass, the same isotope effect as other transition frequencies in the optimal path of O-M-P-H2 (Fig. 4).
The ratio of O-dimer and P-dimer () at the starting moment (t=0) was reported as 0.15hornekaer96 , 0.2gavardi477 and 0.47dumont77 , respectively. In this report, we take this ratio as 0.2 ( and ). If the interaction between hydrogen dimers approximately acts as an average background effect, the reaction of the hydrogen dimers on graphene is first-order, which is consistent with experimental observations.zecho42 ; zecho117 The reaction-rate equations for the TD spectroscopy of hydrogen dimers on graphene can be expressed as
| (9) | |||||
| (10) | |||||
| (11) | |||||
| (12) |
where is a time interval. The desorption rate of hydrogen dimers, or the hydrogen-gas yield per unit time, is defined as
| (13) |
where T and the heating rate () is set as 1.0 K/s in accordance with experiments.hornekaer96 ; zecho42 ; zecho117
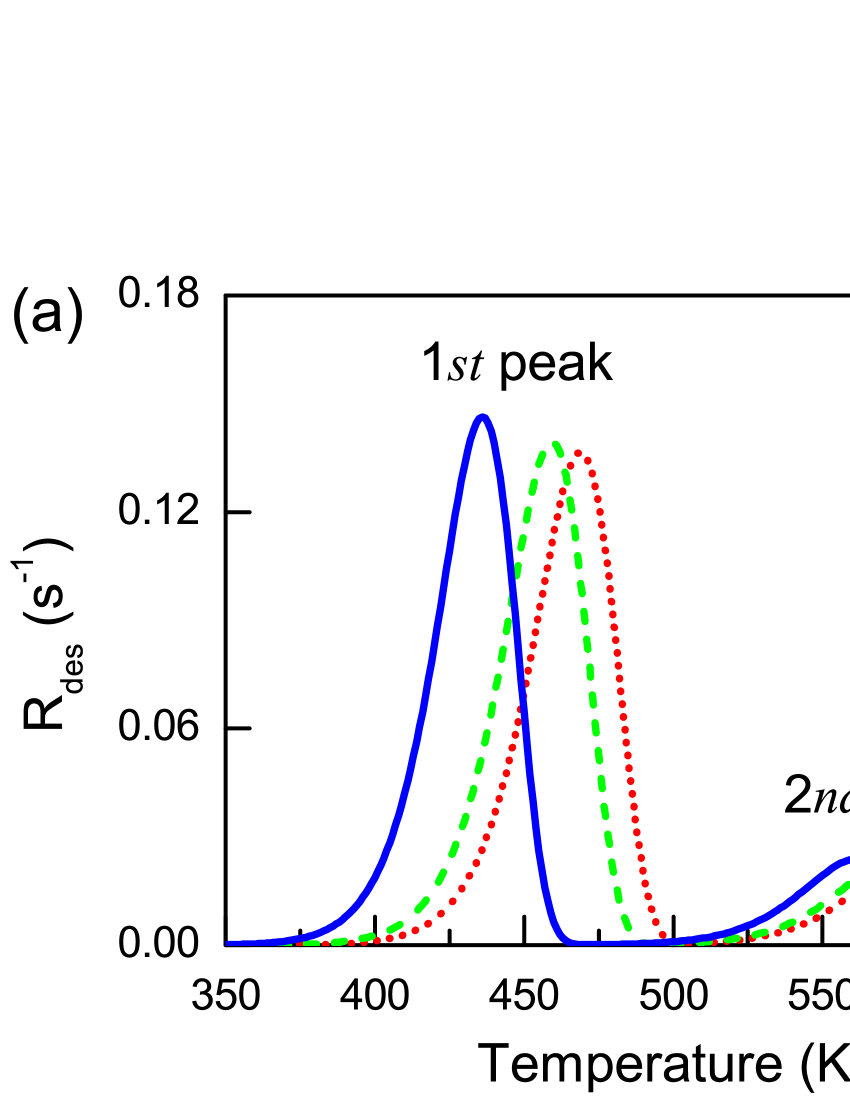
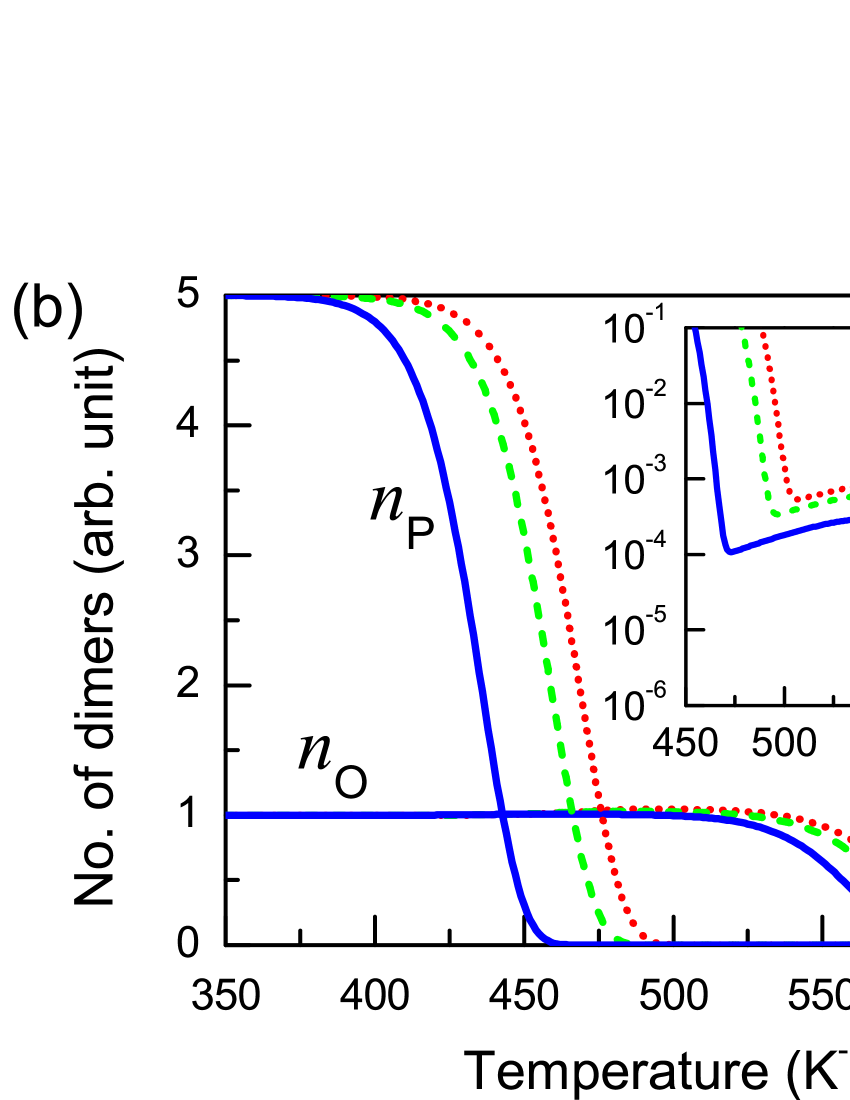
The simulated TD spectra for H, D and T dimers in the S6-P case are shown in Fig. 5 (a). The two-peak shaped TD spectra have been reproduced, with the desorption peaks being at 436 (460, 469) and 562 (574, 581) K for H (D, T) dimers, respectively. These simulation results are very close to experimental measurements.hornekaer96 ; zecho42 ; zecho117 The kinetic processes behind the TD spectra are described in the following. As the temperature increases (T), the P-dimers are first desorbed through the P-H2 transition above 350 K. At this time, there are negligible amount of P-dimers transiting to be O-dimers, because () is at lest 2 orders less than . Afterwards, the O-dimers are reduced at higher temperatures ( K) through the O-M-P-H2 transition. The variations of and are shown in Fig. 5 (b). When a dimer succeeds in transiting from an O-dimer through a M-dimer to a P-dimer, it stays as a P-dimer for a short time of about seconds before being desorbed, which is reflected by the small occupation number of the P-dimers () at the temperatures around the 2nd desorption peak (the inset in Fig. 5 (b)). The mobilities of the hydrogen dimer in diffusion and desorption decrease with increasing the hydrogen mass, which is due to the isotope effect in or . In experimental measurements,hornekaer96 ; zecho42 ; zecho117 the positions of the two desorption peaks in the TD spectra for H (D) dimers are at 445 (490) K and 560 (580) K (the average ML), while those in the simulated spectra are 436 (460) K and 562 (574) K (the effective ML). The simulated isotopic differences of the desorption peaks of H and D dimers are 24 and 12 K for the 1st and 2nd peaks, respectively, in comparison with the experimental measurements of 45 and 20 K, respectively. These little deviation between our theoretical simulations and experimental results maybe come from that a small amount of uncertainty has been introduced in experiments when estimating the desorption-peak positions from the somewhat chaotic TD spectra of H,zecho117 or from the isotope effect in the effective of the hydrogen-covered spots on graphene in experiments. The latter possibility is understandable since that the thermodynamic stability of the hydrogen dimer on graphene should be hydrogen-mass dependent, thus, the distribution of hydrogen dimers on graphene should be hydrogen-mass dependent. This is like the isotope effect of , which are about 0.3 and 0.4 ML for H and D on graphene, respectively.zecho117 The difference in the effective for H and D dimers results in the difference in the interaction between dimers and then the difference in . Based on this point, the isotope effect in the experimental TD spectra of hydrogen dimers consists of the contributions from the isotope effects in and . The simulations here, however, just consider the isotope effect in .
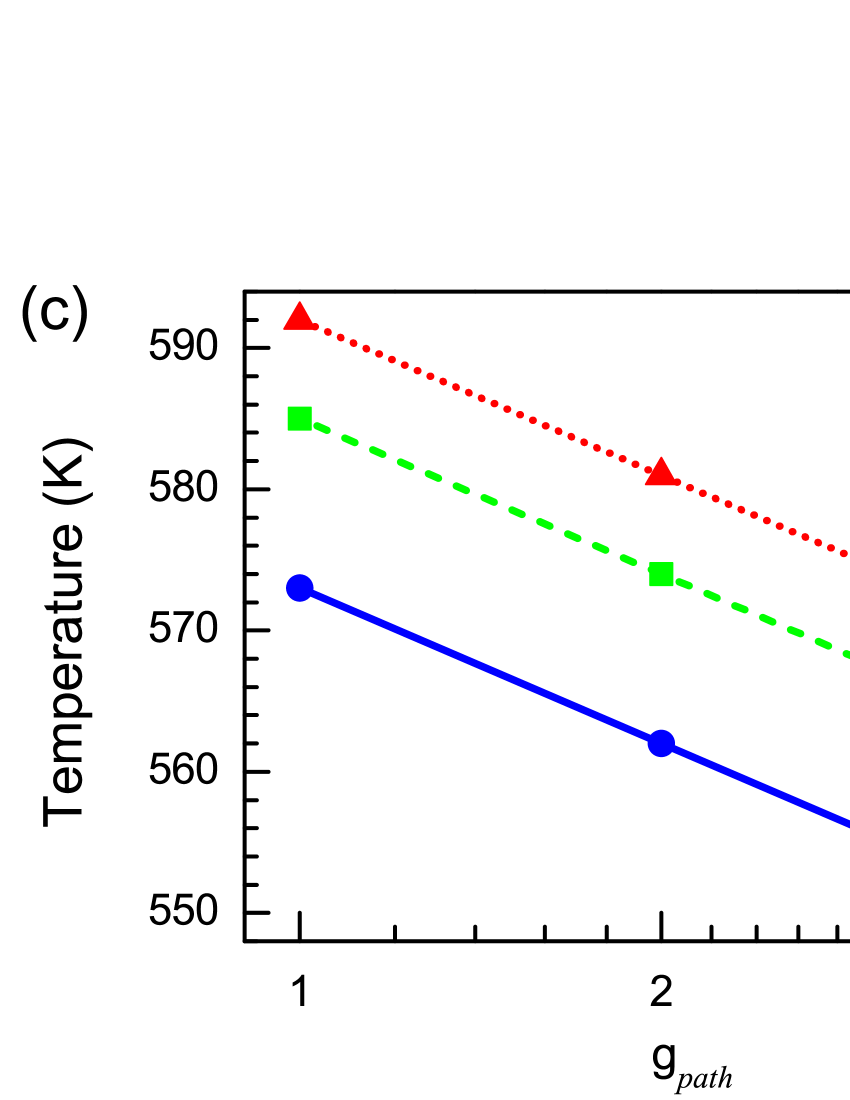
In order to observe the effects of and the structural configuration on the TD spectra, the s for the transitions of O-M, M-O, M-P, P-M and P-H2 in all the cases considered here (Tab. 2) are used to simulate the TD spectra. The positions of the two desorption peaks in each case are listed in Tab. 4. The 1st desorption peak shifts nearly linearly with the of the P-H2 transition by 34 K/0.1 eV, while the 2nd peak does not have a simple monotonic variation due to the complex transitions of hydrogen dimer behind but still generally increases with . Additionally, the interaction between dimers also tends to lower the degeneracy of the diffusing reaction paths, and , which are taken equally here and together denoted as below. The position of the 1st desorption peak is obviously not dependent on the diffusing . Seen from Fig. 5 (c) whereas, the positions of the 2nd desorption peaks for H, D and T dimers are nearly logarithmically dependent on , which is approximately expressed as
| (14) |
where T(1) is the peak position when . And T() increases by about 11 K with decreasing by a half.
From the analysis above, the interaction between hydrogen dimers on graphene is coordinated with the effective hydrogen coverage and the structural configuration. Such interaction affects the potential barriers and the reaction-path degeneracies of the hydrogen-dimer transitions on graphene. As a result, the jump frequencies and TD spectra vary with the hydrogen coverage and the structural configuration. However, the localized vibrational properties of hydrogen dimers are not significantly influenced by the hydrogen coverage.
IV CONCLUSIONS
The thermodynamic and kinetic properties of H, D and T dimers on graphene have been simulated with a composite ab initio method consisting of density functional theory, density functional perturbation theory, harmonic transition state theory, and reaction rate theory. The effects of the hydrogen coverage and the structural configuration on the thermodynamic and kinetic properties have been revealed by varying the coverage from 0.040 to 0.111 ML (1.0 ML cm-2). It has been found that the interaction between hydrogen dimers influences the effective hydrogen coverage and the configuration of hydrogen dimers deposited on graphene and affect the thermodynamic and kinetic properties (, , and ) of those dimers. The vibrational zero-point energy correction ((0)) and the jump frequency () both decrease with increasing the hydrogen mass. However, the isotope effect in the positions of the desorption peaks in the TD spectra is inverted. In a word, the mobility of the hydrogen dimer in desorption and diffusion decreases with increasing the hydrogen mass. The simulated TD spectra (heating rate K/s) are quite close to experimental measurements, and the effect of the dimer interaction has been clarified in detail via the potential barrier in various cases and the reaction-path degeneracy .
Acknowledgements.
The first author (Huang) wish to thank Liv Horkekær for helpful email exchanges. This work was supported by the special Funds for Major State Basic Research Project of China (973) under grant No. 2007CB925004, Knowledge Innovation Program of Chinese Academy of Sciences under grant No. KJCX2-YW-N35, and Director Grants of CASHIPS. Part of the calculations were performed in Center of Computational Science of CASHIPS and the Shanghai Supercomputer Center.References
- (1) J. M. D. Coey, M. Venkatesan, C. B. Fitzgerald, A. P. Douvalis, and I. S. Sanders, Nature 420, 156 (2002).
- (2) L. Hornekær, Ž. Šljivančanin, W. Xu, R. Otero, E. Rauls, I. Stensgaard, E. Lægsgaard, B. Hammer, and F. Besenbacher, Phys. Rev. Lett. 96, 156104 (2006).
- (3) L. Hornekær, E. Rauls, W. Xu, Ž. Šljivančanin, R. Otero, I. Stensgaard, E. Lægsgaard, B. Hammer, and F. Besenbacher, Phys. Rev. Lett. 97, 186102 (2006).
- (4) Y. Ferro, F. Marinelli, and A. Allouche, Chem. Phys. Lett. 368, 609 (2003).
- (5) J. Morris, Nature 422, 674 (2003).
- (6) A. J. Lachawiec, Jr., G. Qi, and R. T. Yang, Langmuir 21, 11418 (2005).
- (7) A. V. Shytov, D. A. Abanin, and L. S. Levitov, Phys. Rev. Lett. 103, 016806 (2009).
- (8) S. Ryu, M. Y. Han, J. Maultzsch, T. F. Heinz, P. Kim, M. L. Steigerwald, and L. E. Brus, Nano Lett. 8, 4597 (2008).
- (9) D. C. Elias, R. R. Nair, T. M. G. Mohiuddin, S. V. Morozov, P. Blake, M. P. Halsall, A. C. Ferrari, D. W. Boukhvalov, M. I. Katsnelson, A. K. Geim, and K. S. Novoselov, Science 323, 610 (2009).
- (10) J. O. Sofo, A. S. Chaudhari, and G. D. Barber, Phys. Rev. B 75, 153401 (2007).
- (11) R. Balog, B. Jorgensen, J. Wells, E. Lægsgaard, P. Hofmann, F. Besenbacher, and L. Hornekær, J. Am. Chem. Soc. 131, 8744 (2009).
- (12) A. Bostwick, J. McChesney, K. V. Emtsev, T. Seyller, K. Horn, S. D. Kevan, and E. Rotenberg, Phys. Rev. Lett. 103, 056404 (2009).
- (13) N. P. Guisinger, G. M. Rutter, J. N. Crain, P. N. First, and J. A. Stroscio, Nano Lett. 9, 1462 (2009).
- (14) Z. Luo, T. Yu, K. Kim, Z. Ni, Y. You, S. Lim, and Z. Shen, ACS Nano 3, 1781 (2009).
- (15) S. Lebégue, M. Klintenberg, O. Eriksson, and M. I. Katsnelson, Phys. Rev. B 79, 245117 (2009).
- (16) T. Zecho, A. Güttler, and J. Küppers, Carbon 42, 609 (2004).
- (17) T. Zecho, A. Güttler, X. Sha, B. Jackson, and J. Küppers, J. Chem. Phys. 117, 8486 (2002).
- (18) A. Andree, M. Le Lay, T. Zecho, J. Küpper, Chem. Phys. Lett. 425, 99 (2006).
- (19) F. Dumont, F. Picaud, C. Ramseyer and C. Girardet, Phys. Rev. B 77, 233401 (2008).
- (20) E. Gavardi, H. M. Cuppen and L. Hornekær, Chem. Phys. Lett. 477, 285 (2009).
- (21) T. Roman, H. Nakanishi, H. Kasai, K. Nobuhara, T. Sugimoto, and K. Tange, J. Phys. Soc. Japan 78, 035002 (2009).
- (22) W. Kohn and L. J. Sham, Phys. Rev. 140, A1133 (1965).
- (23) S. Baroni, S. de Gironcoli, A. Dal Corso, and P. Giannozzi, Rev. Mod. Phys. 73, 515 (2001).
- (24) H. Eyring, J. Chem. Phys. 3, 107 (1935).
- (25) G. H. Vineyard, J. Phys. Chem. Solids 3, 121 (1957).
- (26) P. Hänggi, P. Talkner, and M. Borkovec, Rev. Mod. Phys. 62, 251 (1990).
- (27) E. Pollak and P. Talkner, Chaos 15, 026116 (2005).
- (28) K. Toyoura, Y. Koyama, A. Kuwabara, F. Oba, and I. Tanaka, Phys. Rev. B 78, 214303 (2008).
- (29) L. F. Huang, M. Y. Ni, X. H. Zheng, W. H. Zhou, Y. G. Li and Z. Zeng, arXiv:1007.1109 (revised by J. Phys. Chem. C) (2010).
- (30) Ž. Šljivančanin, E. Rauls, L. Hornekær, W. Xu, F. Besenbacher and B. Hammer, J. Chem. Phys. 131, 084706 (2009).
- (31) P. Giannozzi et. al., J. Phys.: Condens. Matter 21, 395502 (2009).
- (32) D. Vanderbilt, Phys. Rev. B 41, R7892 (1990).
- (33) A. D. Becke, Phys. Rev. A 38, 3098 (1988).
- (34) C. Lee, W. Yang and R. G. Parr, Phys. Rev. B 37, 785 (1988).
- (35) M. Methfessel and A. T. Paxton, Phys. Rev. B 40, 3616 (1989).
- (36) P. E. Blöchl, O. Jepsen and O. K. Anderson, Phys. Rev. B 49, 16223 (1994).
- (37) G. Henkelman, B. P. Uberuage, and H. Jónsson, J. Chem. Phys. 113, 9901 (2000).
- (38) E. H. Lieb, Phys. Rev. Lett. 62, 1201 (1989).
- (39) S. Casolo, O. M. Løvvik, R. Martinazzo, and G. F. Tantardini, J. Chem. Phys. 130, 054704 (2009).
- (40) S. Casolo, E. F. Larsen, O. M. Løvvik, G. R. Darling, and G. F. Tantardini, Phys. Rev. B 81, 205412 (2010).
| Supercell | (ML) | (eV) | (eV) |
|---|---|---|---|
| S3 | 0.111 | 2.714 | 2.555 |
| S4 | 0.063 | 2.562 | 2.564 |
| S5 | 0.040 | 2.538 | 2.518 |
| S6-P | 0.056 | 2.604 | 2.758 |
| S6-O | 0.056 | 2.578 | 2.652 |
| (eV) | ||||||
|---|---|---|---|---|---|---|
| Path | S3 | S4 | S5 | S6-P | S6-O | |
| O-M | 4 | 1.679 | 1.699 | 1.664 | 1.690 | 1.713 |
| M-O | 2 | 0.405 | 0.510 | 0.596 | 0.689 | 0.609 |
| M-P | 2 | 0.351 | 0.538 | 0.607 | 0.773 | 0.660 |
| P-M | 4 | 1.792 | 1.711 | 1.674 | 1.620 | 1.690 |
| P-A | 2 | 1.821 | 1.637 | 1.602 | 1.605 | 1.636 |
| A-P | 1 | 0.223 | 0.449 | 0.525 | 0.558 | 0.587 |
| M-B | 2 | 0.605 | 0.806 | 0.836 | 0.962 | 0.912 |
| B-M | 2 | 1.106 | 1.139 | 1.110 | 1.121 | 1.113 |
| O-H2 | 1 | 2.280 | 2.228 | 2.360 | 2.214 | 2.262 |
| H2-O | - | 4.414 | 4.298 | 4.470 | 4.191 | 4.345 |
| M-H2 | 1 | 0.801 | 0.934 | 0.994 | 1.149 | 1.039 |
| H2-M | - | 4.191 | 4.187 | 4.143 | 4.126 | 4.227 |
| P-H2 | 1 | 1.456 | 1.358 | 1.336 | 1.461 | 1.414 |
| H2-P | - | 3.398 | 3.448 | 3.461 | 3.593 | 3.573 |
| S3 | S5 | |||||
|---|---|---|---|---|---|---|
| Path | H | D | T | H | D | T |
| O-M | 0.141 | 0.107 | 0.093 | 0.135 | 0.102 | 0.088 |
| M-O | 0.038 | 0.028 | 0.017 | 0.051 | 0.034 | 0.027 |
| M-P | 0.053 | 0.032 | 0.023 | 0.079 | 0.053 | 0.042 |
| P-M | 0.138 | 0.106 | 0.093 | 0.144 | 0.111 | 0.075 |
| P-H2 | 0.257 | 0.187 | 0.157 | 0.251 | 0.184 | 0.156 |
| 1st desorption peak | 2nd desorption peak | |||||
| Supercell | H | D | T | H | D | T |
| S3 | 434 | 458 | 468 | 534 | 536 | 551 |
| S4 | 401 | 424 | 434 | 551 | 563 | 569 |
| S5 | 393 | 417 | 427 | 537 | 548 | 554 |
| S6-P | 436 | 460 | 469 | 562 | 574 | 581 |
| S6-O | 420 | 443 | 453 | 562 | 573 | 579 |