Surveying the Dynamic Radio Sky with the Long Wavelength Demonstrator Array
Abstract
This paper presents a search for radio transients at a frequency of 73.8 MHz (4 m wavelength) using the all-sky imaging capabilities of the Long Wavelength Demonstrator Array (LWDA). The LWDA was a 16-dipole phased array telescope, located on the site of the Very Large Array in New Mexico. The field of view of the individual dipoles was essentially the entire sky, and the number of dipoles was sufficiently small that a simple software correlator could be used to make all-sky images. From 2006 October to 2007 February, we conducted an all-sky transient search program, acquiring a total of 106 hr of data; the time sampling varied, being 5 minutes at the start of the program and improving to 2 minutes by the end of the program. We were able to detect solar flares, and in a special-purpose mode, radio reflections from ionized meteor trails during the 2006 Leonid meteor shower. We detected no transients originating outside of the solar system above a flux density limit of 500 Jy, equivalent to a limit of no more than about events yr-1 deg-2, having a pulse energy density J m Hz-1 at 73.8 MHz for pulse widths of about 300 s. This event rate is comparable to that determined from previous all-sky transient searches, but at a lower frequency than most previous all-sky searches. We believe that the LWDA illustrates how an all-sky imaging mode could be a useful operational model for low-frequency instruments such as the Low Frequency Array, the Long Wavelength Array station, the low-frequency component of the Square Kilometre Array, and potentially the Lunar Radio Array.
1 Introduction
Transient emissions—in the form of bursts, flares, and pulses from compact sources—are the signposts for explosive or dynamic events. As such, transient sources offer insight into a variety of fundamental aspects of physics and astronomy, ranging from studying the mechanisms of particle acceleration on the Sun (catalog ) and nearby stars to tracking stellar evolution and death across the Universe to probing the intervening medium(a).
At radio wavelengths, there are well-known classes of transients, such as the Sun (catalog ) and radio pulsars, as well as a long history of observing transients from triggers at other wavelengths, such as -ray burst (GRB) afterglows (e.g., Pooley et al., 1997; Taylor et al., 1998; Frail et al., 2000), or the monitoring of known transient sources such as X-ray binaries and microquasars (e.g., Waltman & Ghigo, 1998; Klein-Wolt et al., 2002; Martí et al., 2002; Rupen et al., 2002). Further, a series of observations and discoveries over the past decade have emphasized that the radio sky may be quite dynamic. Known sources have been discovered to behave in new ways and what may be entirely new classes of sources have been discovered—pulsed radio emission has been observed from brown dwarfs (Hallinan et al., 2007) and formerly radio-quiet magnetars (Camilo et al., 2006); single or highly intermittent pulses have been detected from neutron stars, also known as rotating radio transients (RRATs, McLaughlin et al., 2006; Keane et al., 2010; Burke-Spolaor & Bailes, 2010); intense giant pulses have been detected from the Crab (catalog ) pulsar (Hankins et al., 2003); and several as-yet unidentified radio transients have been found (Hyman et al., 2005; Bower et al., 2007; Lorimer et al., 2007).
There are also numerous classes of objects that, by extension of known physics, have been hypothesized to be radio emitting, and which might appear as radio transients. These include extrasolar planets (Farrell et al., 1999), magnetar flares or giant pulses from pulsars in other galaxies (e.g., McLaughlin & Cordes, 2003), prompt emission from GRBs (Usov & Katz, 2000; Sagiv & Waxman, 2002), evaporating black holes (Rees, 1977), and extraterrestrial transmitters (Cordes et al., 1997).
Meter-wavelength observations have a long history of being used for studying the time domain. For example, solar radio emissions have long been known to be dynamic, and pulsars were first discovered in 81 MHz observations (Hewish et al., 1968). Advantages of low-frequency instruments for surveying the transient sky include naturally large instantaneous fields of view and sensitivity to steep spectral index sources such as might result from coherent emission processes, while disadvantages include radio-wave propagation effects such as dispersion and multi-path propagation, absorption either within the source or along the line of sight, ionospheric disturbances, and radio frequency interference (RFI). A number of new telescopes with meter-wavelength capabilities are under construction, including the Murchison Wide-field Array (MWA, Lonsdale et al., 2009), the Low Frequency Array (LOFAR), the Precision Array to Probe the Epoch of Reionization (PAPER, Parsons et al., 2010), and the Long Wavelength Array (LWA, Ellingson et al., 2009)—many of the science cases for these telescopes explicitly include searches for radio wavelength transients. It is anticipated that the success of these telescopes will motivate the low-frequency component of the Square Kilometre Array (SKA, Dewdney et al., 2009) and the Lunar Radio Array (LRA, Lazio et al., 2009).
This paper presents an all-sky monitoring campaign for radio wavelength transients conducted on the Long Wavelength Demonstrator Array (LWDA). The objective is two-fold, both to detect or constrain radio transients from the observations and to illustrate how future instruments could be used for all-sky searching and monitoring observations. The plan of this paper is as follows. In §2 we describe the LWDA itself and its data acquisition path, in §3 we describe the LWDA data acquisition and imaging pipeline specific to the formation of essentially all-sky images and radio transient searching, in §4 we present our results and analysis, in §5 we discuss possibilities for future instruments, and in §6 we summarize our conclusions.
2 The Long Wavelength Demonstrator Array
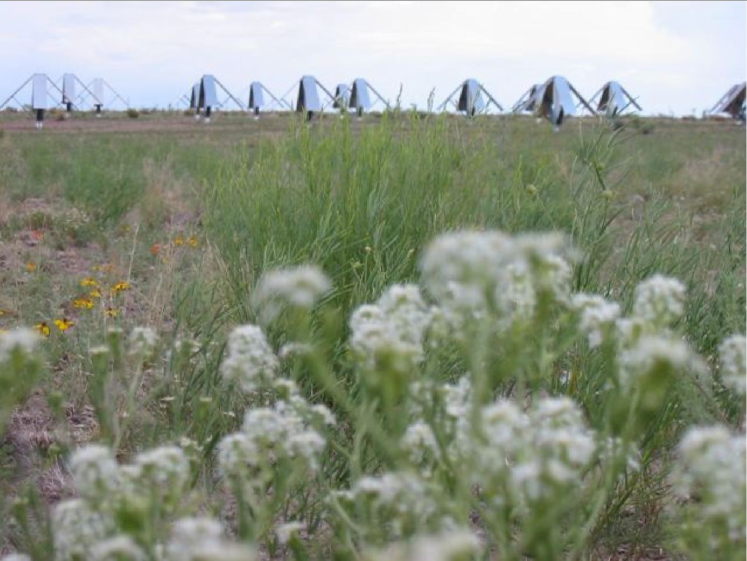
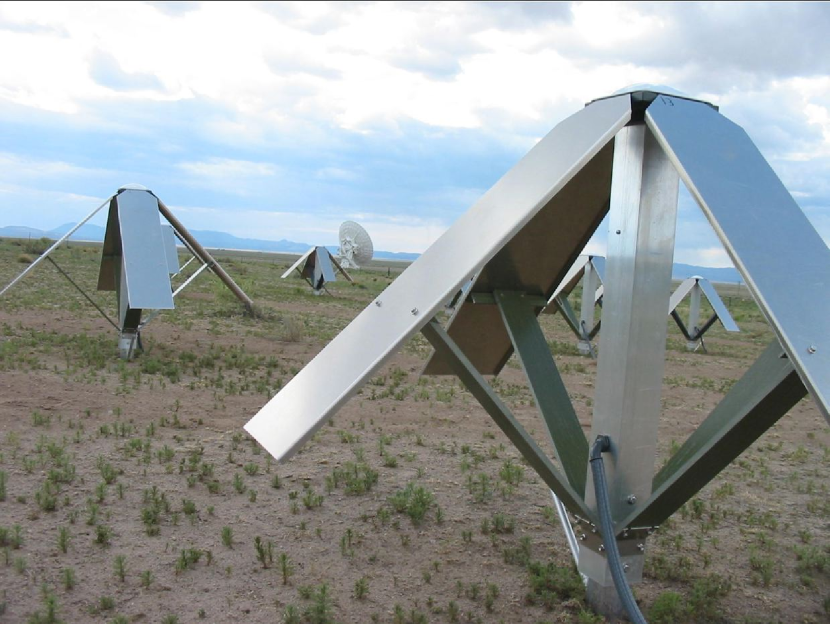
The Long Wavelength Demonstrator Array (LWDA) was a testing platform developed by the Naval Research Laboratory prior to construction of the LWA. The LWDA site work included fielding prototype hardware for the LWA, development of site preparation techniques, continual monitoring of the RFI environment, software development, and initial science. Located on the Plains of San Agustin in New Mexico near the center of the National Radio Astronomy Observatory’s Very Large Array (VLA), the LWDA consisted of 16 dual-polarization dipole stands operating as a phased dipole array with a frequency range of 60–80 MHz (York et al., 2007, Figure 1; ). The element locations represented a compact subset of a larger 256 stand pseudo-random distribution that was developed for the LWA (Kogan & Cohen, 2009). The maximum baseline for the LWDA was approximately 20 m (Figure 2), providing an angular resolution at the zenith of about 12° at 74 MHz.

Each of the 16 LWDA dipole stands consisted of 2 “droopy,” fat dipoles, one per polarization, with the dipoles mounted at a 45° droop angle to a central post (Figure 3). Each dipole consisted of two “blades,” each 28 cm wide by 1.05 m long. This design was chosen to increase the symmetry in the - and -planes (Kerkhoff & Ellingson, 2005), broaden the antenna beam pattern (i.e., increase antenna sky coverage), and obtain a larger operational bandwidth.
The radio frequency (RF) signals from each dipole were amplified by an active balun (24 dB of fixed gain) before being passed to the LWDA electronics, located within a central, shielded shelter. Inside the shelter, the incoming RF data stream entered the digital receiver signal processing chain. The signals were digitized by a dual-channel 10-bit analog-to-digital converter (ADC) at 100 megasamples per second.
The LWDA electronics had the capability to provide digital delay beamforming of two fully independent beams of bandwidth 1.6 MHz each as well as the capability for all-sky monitoring. This capability was implemented through two identical signal processing chains that had independent control parameters to allow for two frequencies, two spatial beams, or two polarizations. The first stage of digital processing was a first-in–first-out (FIFO) pipe that provided an integer sample delay from 0 ns to 150 ns in steps of 10 ns. This delay provided partial compensation of geometric path and system time delays at this stage. Following the FIFO was a complex mixer where the in-phase (I) and quadrature (Q) components for each signal chain were generated using a CORDIC rotator. The signals then passed through a low-pass filtering stage using a Cascaded Integrator Comb (CIC) filter and were decimated by a factor of 14. Next, the signals passed through another FIFO, which provided coarse sample delays in excess of 2 s in 140 ns increments. The final 1.6 MHz bandpass for each data stream was set in a finite impulse response (FIR) filter that also reduced the data rate by another factor of 3. Following this stage, the data were interleaved and passed to an adder board at the final data rate of approximately 4.8 MSPS. The adder board was used to either sum (beamform) or interleave (all-sky image) the incoming coherent signals.
The LWDA frequency range was chosen, in large part, because early plans for the array included the goal of operating it as one of the elements of the VLA 74 MHz system (Kassim et al., 2007), which in turn was centered on the (primary) frequency allocation for radio astronomy at 73.0–74.6 MHz in the U.S. The operational frequency range was much broader and includes frequency allocations for a number of different services, primarily TV broadcasting, at the time of the LWDA operation.111 Since the time of these experiments, the U.S. has converted from analog to digital TV broadcasts, and much of the LWDA operating frequency range is no longer used for TV broadcasts at the time of writing (Crane, 2009). Tests with the LWDA and the prototype LWA equipment have shown the presence of TV signals, but few other strong emissions in this band (Duffin & Ray, 2007; Hicks et al., 2007; Paravastu et al., 2007; Ray et al., 2007; Craig, 2008; Jaeger & Mutel, not dated). Further, experience with the VLA 74 MHz system indicated that, for that system, the most significant source of interference was the VLA itself. Indeed, in comparison with the VLA, for which the 74 MHz feeds were mounted near prime focus (several meters above the ground), the LWDA should be less susceptible to RFI. Our experience with the LWDA was consistent with the experience from the VLA, in that no significant amount of observing time was lost due to RFI. (See also §4.1.)
The LWDA system was sky-noise dominated by at least 6 dB over its full operating range. The LWDA construction was completed and first-light images were obtained on 2006 October 23.
Our focus here is on the all-sky observations obtained by the LWDA, but it also had a two-element interferometer mode. In this mode, an outlier dipole could be utilized to monitor the flux densities of isolated point sources, contributing to a study of the secular flux density decrease of Cas A (catalog ) (Helmboldt & Kassim, 2009).
3 All-Sky Observations
The observations presented here consist of operating the LWDA in its “all-sky” imaging mode observing at zenith. In this operational mode, the all-sky data acquisition system cycles serially through all 120 pairs of dipoles in the array and correlates the data from each pair. Each baseline is measured for 51 ms with a total cycle time of 13 s for both polarizations of all baselines (including auto-correlations). As a result of various processing overheads, the on-sky cadence of imaging described herein is slower. Our observations began with a 5 minute cadence (i.e., 13 s to acquire the full set of cross correlations to form an image with images repeated every 5 minutes), which was later improved to a 2 minute cadence for most of the data reported here.
Our focus on an (all-sky) imaging transient search stems from the fact that the number of dipoles in the LWDA was relatively small so that cross-correlation of all of them was computationally tractable. The alternative to an imaging search, in which transients are identified by comparing images of the sky at different epochs, is a non-imaging search, in which transients are identified in time series of the voltages or intensities from a telescope(s). Traditionally, the tradeoffs between the two kinds of searches have been that imaging searches obtain higher angular resolution at the cost of time resolution with the converse being true for non-imaging searches. The choice between the kind of transient search to employ depends not only on the instrument available, but also upon what is known about the transient population(s) of interest (Nemiroff, 2003).
The observations were centered at a frequency of 73.8 MHz with 80 spectral sub-bands over a total bandwidth of 1.6 MHz (20 kHz per sub-band). During the course of the array installation, the amplitude and phase of the signal path from each dipole were determined. These values were applied in real time as the cross-correlations (visibilities) were formed. The normalized bandpass shapes were applied to correct for individual telescope variations. The visibilities were then recorded on disk for later processing.
Post-processing consisted of the following steps:
-
1.
The raw visibilities were converted into the FITS-IDI format (Clarke et al., 2007).
-
2.
The visibility files were ingested by the Astronomical Image Processing System (AIPS).222 version 31DEC08
-
3.
Standard coplanar imaging procedures were used to convert the visibilities to images.
-
4.
Strong sources in the images were blanked (see below), and, because the images formally extend beyond the horizon, they were clipped at the horizon.
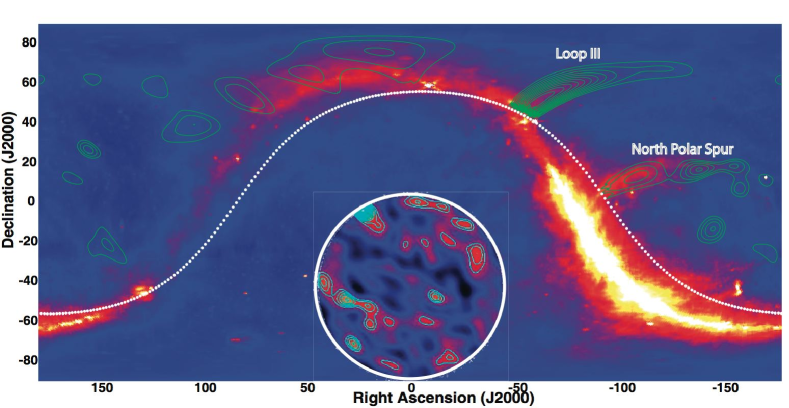
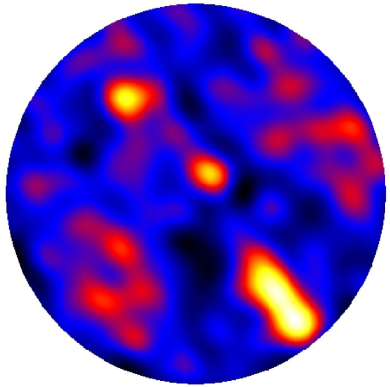
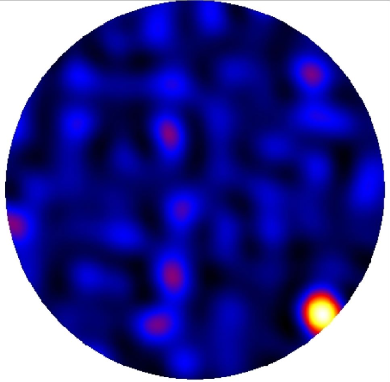
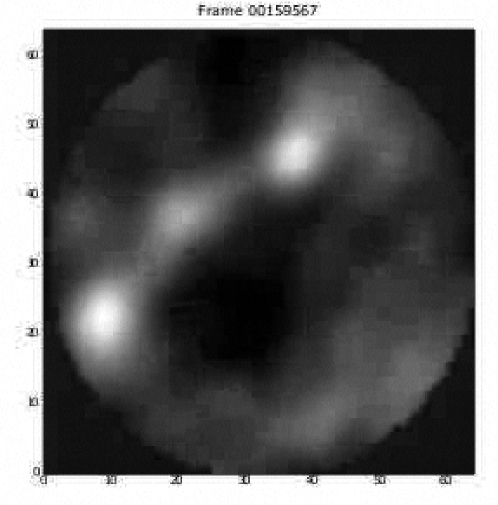
Figure 4 presents a typical all-sky image. Sources easily detected in the LWDA all-sky maps include Cas A (catalog ), Cyg A (catalog ), the inner Galactic plane, North Polar Spur (catalog ), Loop III (catalog ), and the Sun (catalog ).
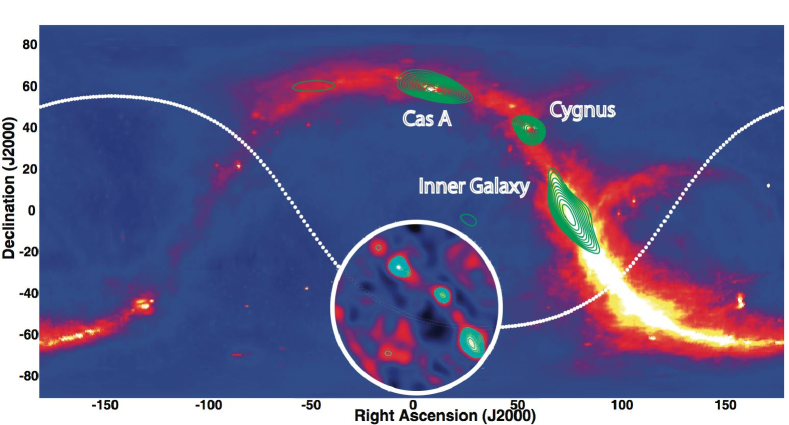
We used the apparent brightness of both Cas A (catalog ) and Cyg A (catalog ) to obtain a crude estimate of the power pattern of the LWDA. Simulations of the power pattern of the individual dipoles (York et al., 2007) suggest that the gain decreases toward the horizon (as would be expected from a dipole) as well as toward the zenith. The latter is caused by the design goal of operating the dipoles over a relatively large frequency range. The brightness measurements of Cas A (catalog ) and Cyg A (catalog ) do show these large-scale gain variations as well as smaller variations, which we estimate to be approximately a factor of 2 (3 dB) in amplitude.
The all-sky transient data were passed into an analysis pipeline written within the AIPS software system. The pipeline first clipped high phase-center amplitudes that are known to be generated by sporodic monitor and control (M&C) software issues. The data were then Fourier transformed into dirty images of the entire sky visible at the LWDA site. Even though the LWDA can observe essentially the entire sky, “wide-field” imaging techniques (Cornwell & Perley, 1992) are not required given the size of the LWDA, its operational frequency, and our use of snapshot imaging.
Images were blanked around the positions of the strong sources that could be detected easily (i.e., Cyg A (catalog ), Cas A (catalog ), the Sun (catalog ), the inner Galactic plane, Loop III (catalog ), and the North Polar Spur (catalog )). This strategy of blanking the images allowed us to use a relatively simple threshold test to search for the presence of transients, at the cost of reducing somewhat our sky coverage. Near the end of the LWDA’s operation, we did attempt to change the array so that the time sampling was in sidereal time. Had this been successful, it would then have been possible to subtract images acquired on different days and construct “difference” images for which this blanking scheme probably would not have been necessary.
As a measure of our ability to detect a transient, particularly in light of our non-simultaneous sampling of the baselines, we conducted a number of simulations in which transients of different strengths and positions within the image were inserted into the data. Table 1 summarizes the results: Column 1 indicates what fraction of the baselines are illuminated by the simulated transient, Column 2 shows the implied duration of the transient, and Column 3 shows the approximate signal-to-noise ratio (S/N) that the transient would have to have in order to be detected. One important aspect of these simulations is that the simulated transients were inserted into the visibility data. As such, these simulations do not take into account the antenna power pattern. The trend in Table 1 of increasing S/N required in order to detect the transient is perhaps not surprising, but we find it reassuring that we could detect transients, even those whose durations are only a minor fraction of the time it took the LWDA to acquire a full sample of visibility data.
| Baseline Fraction | Time | S/N |
|---|---|---|
| Illuminated | (s) | |
| 100% | 6 | 5 |
| 90% | 5.4 | 7 |
| 75% | 4.5 | 10 |
| 50% | 3 | 13 |
| 30% | 1.8 | 30 |
Note. — The results of injecting simulated transients into the LWDA data. Column 1 indicates what fraction of the baselines are illuminated by the simulated transient. Because the LWDA acquired all-sky imaging data by sampling baselines sequentially, Column 2 shows the implied duration of the transient. Column 3 shows the approximate signal-to-noise ratio (S/N) that the transient would have to have in order to be detected.
Using our simulations and visual inspection of the images as a guide, each all-sky snapshot image was searched for events above the 5 level. Any image containing a potential transient event was saved for further analysis.
4 Results
We begin this section by both motivating and illustrating the capability of the LWDA to detect radio transients, and we then turn to the detection of astronomical radio transients.
4.1 Detected Radio Transients: The Sun and Meteor Trails
The Sun (catalog ) is a well-known variable radio source at tens of MHz (e.g., Wild & McCready, 1950). While the Sun (catalog ) is currently in a state of exceptionally low radio emission, during the course of the LWDA observations reported here, a number of solar radio bursts were detected, including a series of intense radio bursts on 2006 December 14 (Figure 5), probably associated with the X-class flares that occurred then.
The focus of our monitoring program was primarily on possible extrasolar system transients, and, as such, we made no effort to track the solar flux density (§3). However, a similar monitoring program could be used to track the flux density of the Sun at these frequencies. Such a program would be more valuable if the array monitoring the Sun (catalog ) had both a larger bandwidth and a higher time resolution. With these improved characteristics, not only would such an array be capable of detecting solar radio bursts, it might be able to image their evolution in frequency.
Conversely, as Figure 5 illustrates, the Sun (catalog ) can become a source of “interference.” During these intense solar radio bursts, the dynamic range of the LWDA and imaging pipeline were sufficiently limited that only the Sun (catalog ) was visible. Whether other observations can be conducted during solar radio bursts will depend upon the imaging dynamic range of future systems, however, exceeding an imaging dynamic range of order 100 seems difficult for rapid, all-sky imaging pipelines.
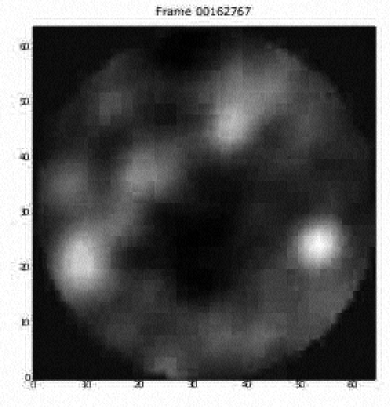
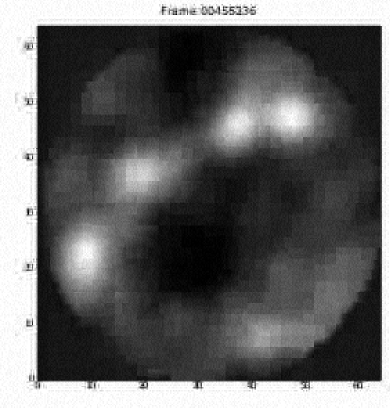
Another well-known class of radio transients is reflections from ionized meteor trails. As a meteor enters Earth’s atmosphere, its velocity is high enough that it can produce an ionized trail, which in turn can reflect a radio transmission (e.g., Millman et al., 1948).
In 2006 November, during the Leonid meteor shower, data were acquired with the LWDA tuned to a frequency of 61 MHz. At the time of these observations, this frequency was within the band allocated for television broadcasting, and there were a number of TV stations in New Mexico and the southwest U.S. that used this allocation. It is a simple matter to show that even a TV transmitter of relatively modest power located more than 1000 km distant would still produce a strong reflection. For the purposes of this observation, the process for data acquisition was modified to reduce the number of bits and allow simultaneous sampling of all 16 dipoles. Figure 6 illustrates two examples of a meteor reflection imaged by the LWDA.
4.2 Astronomical Radio Transients
The observing campaign lasted from 2006 October 27 to 2007 February 17, during which there were 59 days on which some useful data were acquired. On 2006 December 13, we were able to improve the cadence at which images were formed from 5 minutes to 2 minutes. The resulting total observing time for the transient campaign was 106 hr. During these observations, no transients were detected above the 5 level in any image. Based on comparative analysis of the brightnesses of Cas A (catalog ) and the Sun (catalog ), we estimate the (1) noise level in the LWDA all-sky snapshots to be roughly 500 Jy. We also assume that the effective sky coverage of the LWDA is roughly 10,000 deg2 ( sr). Although, we show essentially images of the entire hemisphere, the gain of the LWDA was unlikely to be constant across the sky, an assumption partially supported by modeling. Consequently, we assume that the effective sky coverage is somewhat less than a full hemisphere.
A total of 29,437 data sets were processed through the imaging pipeline. Of these, 1764 produced potential transient candidates. Visual inspection of these showed that they could be explained as non-astronomical transients: slight errors in our calculations of the extents of strong sources resulted in one pixel of a strong source not being blanked appropriately.
Combining these results, we place a limit of events yr-1 deg-2, having a pulse energy density J m Hz-1 at 73.8 MHz for pulse widths of about 300 s. We now consider multiple characterizations of this result for easy comparison with existing results in the literature. Our focus is on comparison with MOTOR (Amy et al., 1989) and STARE (Katz et al., 2003), as both represent nearly all-sky surveys at frequencies below 1 GHz.
Following Katz et al. (2003), the LWDA flux density limit can be recast in terms of the brightness temperature that an object would have to have in order to be detectable. Using parameters appropriate for the LWDA, and assuming a quite conservative 5000 Jy flux density limit (10), we find
| (1) |
for an object of linear size located at a distance . Figure 7 shows the resulting brightness temperature limits for transients detectable by the LWDA. Sufficiently strong bursts from a neutron star or a “super-flare” from a nearby star are among the possible sources that might have been detectable by the LWDA (or an instrument like the LWDA). We consider these possibilities further in §5.

Table 2 compares our rate with those of other “all-sky” surveys at other wavelengths from the literature. In constructing Table 2, we have restricted our focus to other, largely similar search programs, namely those at frequencies below 1 GHz using dipole-based arrays. We have also restricted Table 2 to programs that conducted blind surveys, as opposed to those that targeted known sources (e.g., pulsars, GRBs).
| Pulse | Scaled | |||||
|---|---|---|---|---|---|---|
| Program | Rate Limit | Energy Density | Timescale | Frequency | Pulse Energy Density | Reference |
| (events yr-1 deg-2) | (J m Hz-1) | (s) | (MHz) | (J m Hz-1) | ||
| LWDA | 300 | 73.8 | … | this work | ||
| HM74 | 0.05 | 270 | 1 | |||
| K+77 | 370–550 | 2 | ||||
| 38–60 | 2 | |||||
| MOTOR | 163 | 0.025 | 843 | 3 | ||
| STARE | 0.125 | 611 | 4 |
In general, our LWDA search program produces an upper limit to the event rate that is comparable to or competitive with other search programs, typically at higher frequencies. However, our serial data acquisition scheme results in a somewhat poorer limit on the pulse energy density. If the LWDA data acquisition system had had a more rapid sampling time, e.g., on a scale of order 0.1 s (the time scale for the acquisition of a signal from an individual dipole), our pulse energy density limit would have been comparable to many of the other search programs.
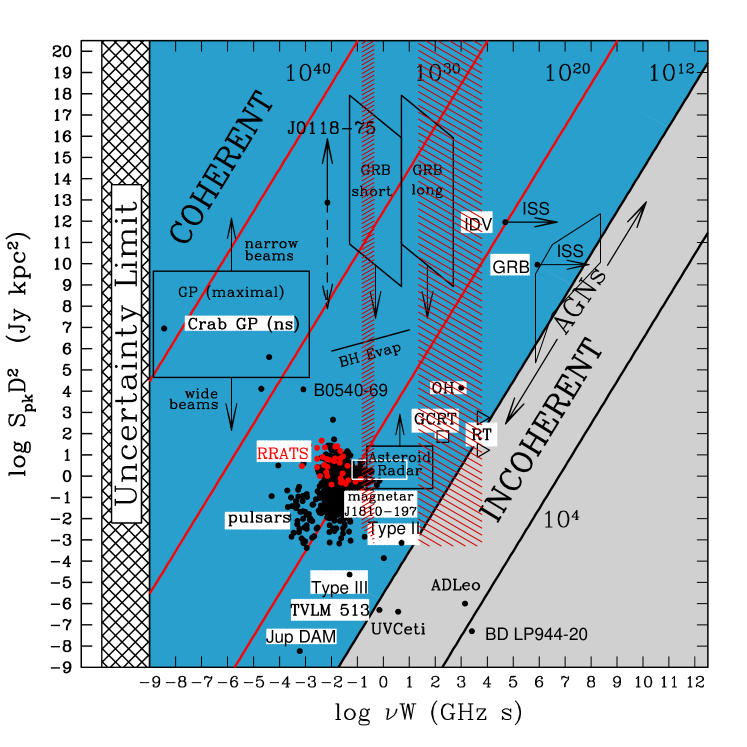
An alternate means of characterizing radio transient searches is in terms of a “phase space” diagram (Cordes et al., 2004b), which can be cast in terms of the brightness temperature of a radio transient in the Rayleigh-Jeans limit (Equation 1). Figure 8 shows the region of phase space probed by the LWDA in comparison with the range defined by various known and hypothesized phenomena. In producing this plot, we have assumed a lower distance limit to any celestial radio transient to be 1 pc, such as might be expected from a nearby low-mass star, brown dwarf, or planet (§5). In practice, the local density of sources may be sufficiently low that there are no transients within 1 pc, which would have the effect of increasing the minimum value of that the LWDA could have probed. Clearly the upper distance limit could be the edge of the observable Universe, which would imply correspondingly higher brightness temperatures.
As a final approach to constraining the event rate for transients, we consider a probabilistic one. The typical determination of an event rate (such as those in Table 2) is derived from the total observing duration and the solid angle observed. Instead, we ask what is the probability of detecting a transient in a given observation, given that no transients were detected in our series of observations.
We conducted 29,437 trial observations during the course of this observational program. As DeGroot (1986) discusses, the probability of obtaining detections in trials, given that the detection probability in any individual trial is , can be related to the beta distribution
| (2) |
where is the gamma function, , and for a detection or 0 for a non-detection. That is, is simply the count of the total number of detections.
With , and integrating Equation (2) to form the incomplete beta function, we can determine the maximum detection probability for a specified confidence level. For the LWDA or an array with LWDA-like parameters ( 10,000 deg2 sky coverage, 73.8 MHz frequency, s duration), we find that the probability of detecting a transient in a single LWDA observation cannot exceed lest the probability that we should have detected a transient in the full LWDA transient campaign exceeds 99.7%.
Given the relatively large solid angle accessed by the LWDA, only a modest improvement in the probability of detecting transients would result from increasing the sky coverage for future instruments (or would have resulted from increasing the sky coverage of the LWDA itself). Rather, an increased probability is likely to result only from improved sensitivity, developing a search method that does not require blanking the Galactic plane, or both.
5 Future Possibilities
In the near future, the first station of the Long Wavelength Array (LWA-1), the LOFAR, and the International LOFAR Telescope (ILT) will become operational, with LOFAR being a subset of the ILT. All will consist of dipole stations having an operational frequency range overlapping or comparable to that of the LWDA.
The individual dipole stations of LOFAR and the ILT will have a factor of a few more dipoles than the LWDA while LWA-1 will 256 dipoles (16 as many), but they may not be able to improve upon our flux density limits substantially because the diameters of the LWDA, LWA-1, and LOFAR stations are sufficiently small that they are confusion limited on short time scales. However, with multiple LOFAR stations, the identification and excision of RFI may be improved substantially (Bhat et al., 2005). In the case of the LWA-1, all-sky imaging will be carried out by passing a narrow bandwidth ( kHz) signal from each of the 256 stands to a dedicated cluster for correlation and imaging. This observing mode operates in tandem with the beamforming modes so that it will be possible to image the visible hemisphere full time.
The MWA will also conduct transient searches, at a somewhat higher frequency range than the LWDA, but it will likely not include an all-sky imaging capability. Building upon these next-generation low-frequency arrays will be the SKA and the LRA. Their designs will be influenced by the work on LOFAR, MWA, and similar low radio frequency interferometers, but, in both cases, we anticipate that transient searches, and potentially all-sky imaging, will be a capability. As Figure 8 illustrates, and as we now discuss below, in principle, an imaging dipole station, similar to the LWDA, could probe a variety of known or hypothesized classes of transients.
5.1 Radio Pulses from Ultra-high Energy Cosmic Rays or Neutrinos
Intense, short-duration pulses ( MJy in ns) at decimeter and meter wavelengths have been detected from the impact of ultra-high energy cosmic rays on Earth’s atmosphere (e.g., Jelley et al., 1965; Weekes, 2001; Falcke & Gorham, 2003), and in at least one case even imaged by a radio array not dissimilar to the LWDA (Falcke et al., 2005). High-energy neutrinos impacting the lunar regolith should also produce radio pulses via the Askar’yan effect (Dagkesamanskij & Zheleznykh, 1989; Falcke & Gorham, 2003), though no such pulses have been detected333 No pulses from the Moon have been detected, but the Askar’yan effect has been demonstrated in terrestrial accelerators (Gorham et al., 2005, 2007). from the Moon (catalog ) to date (Hankins et al., 1996; Gorham et al., 2004; Beresnyak et al., 2005; Langston et al., 2009; Scholten et al., 2009; Buitink et al., 2010; James et al., 2010; Jaeger et al., 2010). In the case of the lunar neutrino radio pulses, the expected pulse amplitude is more poorly constrained because it depends, in part, upon properties (primarily surface roughness) of the lunar surface (Alvarez-Muñiz et al., 2006; Scholten et al., 2006; James & Protheroe, 2009). Nonetheless, if sufficiently energetic neutrinos exist, it is plausible that radio pulses would be emitted at frequencies relevant for an LWDA-like instrument.
The intrinsic width of these radio pulses is extremely short, far shorter than the 51 ms data acquisition time for an individual baseline of the LWDA; as an example, Falcke et al. (2005) measure a width narrower than 30 ns. As noted above (§3), during the commissioning of the LWDA, a sporadic M&C issue was recognized in that occasionally a baseline would produce an anomalously large amplitude. Upon inspection, we found that baselines with anomalously large amplitudes also had a phase of 0° (which is one of the reasons that we explain these anomalous amplitudes as being due to an M&C issue). Further, unlike the LOFAR Prototype Station (LOPES, Falcke et al., 2005), we had no co-located particle detector to use as a trigger for cosmic ray detection. Subsequently, we employed a simple threshold test, in which baselines with anomalous amplitudes and phases near zero were excised. A consequence of this flagging methodology is that radio pulses from high-energy particles at the zenith would not be recognized by our analysis of LWDA data.
5.2 Stars and Substellar Objects
The Sun (catalog ) generates intense emission at LWDA frequencies, notably Type III and IV radio bursts, but even the strongest such radio bursts are far too faint to be detected over interstellar distances with the current most sensitive meter- or decameter-wavelength telescopes. Gergely (1986) considered the detection of solar-type stars at low radio frequencies and finds that millijansky sensitivities would likely be required to detect the equivalent of the most intense solar radio bursts from nearby stars. There are approximately 20 solar-type stars in the solar neighborhood ( pc, Holmberg et al., 2009). The absence of any transients that could be identified with these stars puts only modest constraints on their levels of activity. Not only is the LWDA sensitivity likely to be insufficient, if these stars have solar-like cycles over decadal time scales, the absence of any flaring could merely reflect that a star is currently in a quiescent phase of the cycle (much like the Sun (catalog ) is in the current solar cycle).
Late-type stars (M dwarfs) and brown dwarfs also exhibit flaring activity, particularly at centimeter- and meter wavelengths ( MHz, e.g., Güdel, 2002; Hallinan et al., 2007). Little is known about the emission from brown dwarfs at LWDA frequencies. However, the most sensitive searches for decameter-wavelength emission from late-type stars have, at best, marginal detections, even when those stars were observed to be flaring at shorter wavelengths Jackson et al. (1990). Even these marginally detected flares have flux densities of order 1 Jy. While more numerous and likely to be closer than solar-type stars, the LWDA sensitivity also means that we can place only modest limits on the likelihood of strong flares from nearby M dwarfs.
Finally, within the solar system, in addition to solar radio bursts, Jupiter (catalog ) also produces intense radio bursts due to an electron cyclotron maser within its magnetosphere (Melrose, 2005). This emission cuts off above around 40 MHz, a frequency determined by the ratio between the cyclotron and plasma frequencies as a function of altitude within the Jovian magnetosphere.
The magnetospheric emissions from solar system planets and the discovery of extrasolar planets have motivated a number of both theoretical (Zarka et al., 1997; Farrell et al., 1999; Zarka et al., 2001; Farrell et al., 2004; Lazio et al., 2004; Stevens, 2005; Griessmeier et al., 2005; Zarka, 2006, 2007; Griessmeier et al., 2007b, a) and observational work (Yantis et al., 1977; Winglee et al., 1986; Bastian et al., 2000; Lazio et al., 2004; Ryabov et al., 2004; George & Stevens, 2007; Lazio & Farrell, 2007; Smith et al., 2009) on magnetospheric emissions from extrasolar planets, including some before the confirmed discovery of any extrasolar planets. Unfortunately, even the most optimistic predictions for extrasolar planetary radio emission do not predict flux densities in excess of 1 Jy at frequencies near 100 MHz. Moreover, the most sensitive searches for extrasolar planetary radio emission near 74 MHz place sub-Jansky constraints on this emission (Lazio & Farrell, 2007; Lazio et al., 2009).
5.3 Pulsar Giant Pulses
We consider giant pulses from radio pulsars as an exemplar of a short-duration, intense radio transient that, in principle, could be detected throughout the Local Group by the LWDA (Cordes et al., 2004a). For the specific case of the Crab pulsar (catalog ), giant pulses have been seen at frequencies as low as 74 MHz (Comella et al., 1969; Rankin et al., 1970), and Sallmen et al. (1999) showed that the pulses are indeed broadband, at least over the frequency range 610–4900 MHz.
The spectral index for Crab pulsar (catalog ) giant pulses is steep (, ), and current observations find no upper limit to the amplitude of giant pulses (Sallmen et al., 1999; Lundgren et al., 1995). However, by comparison to lower frequency observations, Lundgren et al. (1995) also find that the rate of giant pulses decreases with decreasing observational frequency, such that giant pulses at 800 MHz are 400 times more frequent than at 146 MHz. Scaling both the rate of giant pulses and the pulse amplitudes to the LWDA frequency of 73.8 MHz, we estimate that, on average, the Crab pulsar (catalog ) will produce a giant pulse once every 50 hr with a flux density exceeding 1 MJy (i.e., for the LWDA, Table 1).
At higher frequencies, Crab pulsar (catalog ) giant pulses have extremely narrow widths, often being unresolved in time. With a pulse period of approximately 33 ms, even if the Crab pulsar (catalog ) or a pulsar like it produced a sufficiently strong pulse to be detected, only a single baseline would appear to be illuminated by our data acquisition procedure (51 ms per baseline, §3). However, at LWDA frequencies, pulse broadening becomes significant. Pulse broadening increases the duration of the pulse, at the cost of decreasing its amplitude.
In addition to being frequency dependent, pulse broadening also depends upon direction through the Galaxy. Using the NE2001 model (Cordes & Lazio, 2002), we estimate that the magnitude of pulse broadening can exceed 500 ms ( LWDA baselines being illuminated) for distances of order 5 kpc through the Galactic disk, implying Galactic latitudes . Unfortunately, these low Galactic latitudes constitute only a small fraction of the total sky (), and we also blanked the Galactic plane as part of our efforts to remove strong sources from the images before conducting the statistical tests. Thus, we conclude that while giant-pulse emitting pulsars seem capable of producing sufficiently strong pulses to be detectable, either our serial data acquisition procedure would have not been sensitive to such pulses or significant pulse broadening would have rendered them too faint to be detectable.
5.4 Gamma-ray Bursts (GRBs)
We conclude this section by considering radio pulses from GRBs, as an exemplar of possible radio pulses of extragalactic origin. Usov & Katz (2000) and Sagiv & Waxman (2002) both have predicted that GRBs should have associated prompt emission, most likely below 100 MHz. Predicted flux densities are highly model dependent and range from essentially undetectable to in excess of 1 MJy.
Observationally, there have been a number of searches for radio pulses associated with GRBs. Cortiglioni et al. (1981), Inzani et al. (1982), and Amy et al. (1989) all detected some dispersed radio pulses, but found no convincing associations with GRBs. Balsano (1999) found a dispersed radio pulse apparently coincident with GRB 980329 (catalog ), but it was narrowband, which has led to it being interpreted as due to terrestrial interference. Various searches for radio pulses associated with GRBs (including precursor pulses) have been conducted at 151 MHz Koranyi et al. (1994, 1995); Dessenne et al. (1996). Typical upper limits have been approximately 100 Jy.
5.5 Exotica
One of the motivations for this, and similar, searches is simply that previously unknown classes of sources may be discovered. While it is difficult to assess the probability of an unknown class of sources, we can consider extraterrestrial transmitters (Cocconi & Morrison, 1959) as an example of an exotic population of sources.444 Doing so is also appropriate given that this year is the anniversary of the first search for radio transmissions, F. Drake’s Project OZMA.
As Loeb & Zaldarriaga (2007) discuss, much of the human-generated radio radiation from the Earth (catalog ) is emitted in the range 50–400 MHz. Indeed, the upper end of the LWDA’s operational frequency range was chosen to avoid FM radio broadcasts, and §4.1 illustrates the detection of TV signals with the LWDA. In contrast to Loeb & Zaldarriaga (2007), however, we consider short duration pulses, such as might originate from a transmitter on a planet rotating into or out of view, whereas they consider detecting signals in long integrations ( month).
The LWDA’s frequency sub-bands of 20 kHz are well matched to the typical bandwidths, at least for terrestrial transmitters in this frequency range. There is an increasing usage of so-called spread spectrum transmitters, with bandwidths (much) larger than 20 kHz. However, these are often at higher frequencies, and an LWDA-like instrument would still receive all of the power within its received bandwidth.
Unfortunately, with a 500 Jy sensitivity, it is a relatively simple matter to show that a transmitter at a distance of 10 pc would have to have an effective isotropic radiated power (EIRP) of about W (170 dBW) to have been detectable with the LWDA. By contrast, the EIRP of even powerful military radars, such as the Air Force Space Surveillance System (AFSSS), only approach W (137 dBW). Further, given that all (or most) of the stars within 10 pc are cataloged, it is not clear that an all-sky search, such as the one pursued here, is the most effective search strategy, unless one postulates a set of freely floating “beacons.”
5.6 General Considerations
Examination of Figure 8 shows that an LWDA-like instrument might be able to probe a significant region in this phase space, and previous sections have discussed a range of source classes that the LWDA might have been able to detect, in principle, even though the implementation of the data acquisition system resulted in no detections. In addition to the aforementioned issue that a more rapid time sampling would likely be required, are there other considerations for a dipole phased array?
Much of the phase space accessible, or potentially accessible, to an LWDA-like instrument is for coherent transients, nominally taken to be those with brightness temperatures in excess of K. Such transients will necessarily evolve rapidly. Cordes & McLaughlin (2003) have discussed searches for fast radio transients. A key consideration for such searches is the effective time resolution, which is determined not only by the instrumental characteristics (receiver bandpass) but also by dispersion smearing and radio-wave scattering.
Following Cordes & McLaughlin (2003), we consider two time scales related to the time resolution, and implied processing, for searches with an LWDA-like instrument. The highest time resolution that the instrument would be able to obtain is simply
| (3) |
for a receiver frequency channelization or sub-band of , which for the LWDA ( kHz) was 50 s. Because of the dispersion relation of the interstellar medium, probing to any distance for fast pulses requires de-dispersion. As an illustration, we consider how far one could probe, ignoring dispersion. We take as a criterion that the dispersion across the receiver sub-band produces a smearing comparable to time resolution implied by Equation (3). Then, from Cordes & McLaughlin (2003),
| (4) |
where is the receiver sub-band in units of kHz, and is the central frequency in units of MHz, and the error in the dispersion measure is in the canonical units of pc cm-3. Alternately, can be considered the increment in dispersion measure (DM) for searches that incorporate searching through dispersion. For the LWDA, pc cm-3, implying that a search for fast transients with the LWDA that did not incorporate de-dispersion could only probe to an effective DM of this value. For reference, PSR J01081431 (catalog ) has the lowest known DM, 2.38 pc cm-3, at a distance of 240 pc (Manchester et al., 2005; Deller et al., 2009).
Conducting a search that incorporated compensation for dispersion smearing would effectively mean conducting a de-dispersion search on each resolution element (beam) within the field of view (Cordes, 2009). In contrast to proposed searches at higher frequencies ( GHz), the much lower resolution at LWDA frequencies makes this a less onerous task. For instance, with the LWDA’s resolution of 12°, there are only about 150 independent resolution elements in the entire sky. Further, searching each is of course an embarrassingly parallel problem.
6 Conclusions
We have described the Long Wavelength Demonstrator Array (LWDA) and its operation as an all-sky transient monitor. A 16-element dipole phased array, operating over the frequency range 60–80 MHz, the LWDA was used as a technical test bed for the LWA. We have described the signal flow from the antennas to the receivers and to a simple software correlator as well as the configuration of the dipoles.
The individual dipoles of the LWDA had a field of view comparable to the entire sky. In late 2006 and early 2007, we used the LWDA as a transient search instrument by making a series of all-sky images at frequencies of 61 and 73.8 MHz. The 61 MHz observations were designed explicitly to search for reflections from ionized meteor trail during the Leonid meteor shower in 2006. The 73.8 MHz observations were designed to search for astronomical transients, and we acquired a total of 106 hr of data, with a time sampling ranging from 2 to 5 minutes between images. We were able to detect solar flares and, by utilizing a special-purpose mode, TV reflections off ionized meteor trails during the 2006 Leonid meteor shower. We detected no radio transients outside of the solar system above a flux density limit of 500 Jy, equivalent to a limit of no more than about events yr-1 deg-2, having a pulse energy density J m Hz-1 at 73.8 MHz for pulse widths of about 300 s. This event rate is comparable to many existing limits from previous all-sky surveys, but at a lower frequency than most previous all-sky searches.
There are a number of emerging arrays (e.g., MWA, LOFAR, LWA) for which all-sky, or at least very wide-field, imaging will be a capability. All of these arrays will offer at least two advantages with respect to the LWDA. First, all are anticipated to be operational for a far longer time than was the LWDA, which should improve upon the event rates substantially. Second, all of these arrays will have a higher angular resolution imaging capability, so that if a transient were to be detected, much higher precision astrometric information could be obtained.
References
- Alvarez-Muñiz et al. (2006) Alvarez-Muñiz, J., Marqués, E., Vázquez, R. A., & Zas, E. 2006, Phys. Rev. D, 74, 023007
- Amy et al. (1989) Amy, S. W., Large, M. I., & Vaughan, A. E. 1989, PASA, 8, 172
- Balsano (1999) Balsano, R. J. 1999, Ph.D. thesis, Princeton Univ.
- Bastian et al. (2000) Bastian, T. S., Dulk, G. A., & Leblanc, Y. 2000, ApJ, 545, 1058
- Beresnyak et al. (2005) Beresnyak, A. R., Dagkesamanskii, R. D., Zheleznykh, I. M., Kovalenko, A. V., & Oreshko, V. V. 2005, Astron. Rep., 49, 127
- Bhat et al. (2005) Bhat, N. D. R., Cordes, J. M., Chatterjee, S., & Lazio, T. J. W. 2005, Radio Sci., 40S, 5S14
- Bower et al. (2007) Bower, G. C., Saul, D., Bloom, J. S., Bolatto, A., Filippenko, A. V., Foley, R. J., & Perley, D. 2007, ApJ, 666, 346
- Buitink et al. (2010) Buitink, S., Scholten, O., Bacelar, J., et al. 2010, A&A, in press
- Burke-Spolaor & Bailes (2010) Burke-Spolaor, S., & Bailes, M. 2010, MNRAS, 402, 855
- Camilo et al. (2006) Camilo, F., Ransom, S. M., Halpern, J. P., Reynolds, J., Helfand, D. J., Zimmerman, N., & Sarkissian, J. 2006, Nature, 442, 892
- Clarke et al. (2007) Clarke, T., Lane, W., Lazio, J., & Wood, D. L. 2007, LWA Memorandum 105; http://www.ece.vt.edu/swe/lwa/lwa0105.pdf
- Cocconi & Morrison (1959) Cocconi, G., & Morrison, P. 1959, Nature, 184, 844
- Crane (2009) Crane, P. 2009, LWA Memorandum 164; http://www.ece.vt.edu/swe/lwa/lwa0164a.pdf
- Comella et al. (1969) Comella, J. M., Craft, H. D., Jr., Lovelace, R. V. E., Sutton, J. M., & Tyler, G. L. 1969, Nature, 221, 453
- Cordes (2009) Cordes, J. M. 2009, SKA Memorandum 97; http://www.skatelescope.org/
- Cordes et al. (2004a) Cordes, J. M., Bhat, N. D. R., Hankins, T. H., McLaughlin, M. A., & Kern, J. 2004a, ApJ, 612, 375
- Cordes & Lazio (2002) Cordes, J. M., & Lazio, T. J. W. 2002, arXiv:astro-ph/0207156
- Cordes et al. (2004b) Cordes, J. M., Lazio, T. J. W., & McLaughlin, M. A. 2004b, New Astron. Rev., 48, 1459
- Cordes et al. (1997) Cordes, J. M., Lazio, T. J. W., & Sagan, C. 1997, ApJ, 487, 782
- Cordes & McLaughlin (2003) Cordes, J. M., & McLaughlin, M. A. 2003, ApJ, 596, 1142
- Cornwell & Perley (1992) Cornwell, T. J., & Perley, R. A. 1992, A&A, 261, 353
- Cortiglioni et al. (1981) Cortiglioni, S., Mandolesi, N., Morigi, G., Ciapi, A., Inzani, P., & Sironi, G. 1981, Ap&SS, 75, 153
- Craig (2008) Craig, J. 2008, LWA Memorandum 145; http://www.ece.vt.edu/swe/lwa/lwa0145.pdf
- Dagkesamanskij & Zheleznykh (1989) Dagkesamanskij, R. D., & Zheleznykh, I. M. 1989, JETP Lett., 50, 259 (translated from Russian)
- DeGroot (1986) DeGroot, M. H. 1986, Probability and Statistics ( ed.; Reading, MA: Addison-Wesley)
- Deller et al. (2009) Deller, A. T., Tingay, S. J., Bailes, M., & Reynolds, J. E. 2009, ApJ, 701, 1243
- Dessenne et al. (1996) Dessenne, C. A.-C., Green, D. A., Warner, P. J., et al. 1996, MNRAS, 281, 977
- Dewdney et al. (2009) Dewdney, P. E., Hall, P. J., Schilizzi, R. T., & Lazio, T. J. W. 2009, Proc. IEEE, 97, 1482
- Duffin & Ray (2007) Duffin, R., & Ray, P. S. 2007, LWA Memorandum 84; http://www.ece.vt.edu/swe/lwa/lwa0084.pdf
- Ellingson et al. (2009) Ellingson, S., Clarke, T. E., Cohen, A., Craig, J., Kassim, N. E., Pihlstrom, Y., Rickard, L. J, & Taylor, G. B. 2009, Proc. IEEE, 97, 1421
- Falcke et al. (2005) Falcke, H., Apel, W. D, Badea, A. F., et al. 2005, Nature, 435, 313
- Falcke & Gorham (2003) Falcke, H., & Gorham, P. 2003, Astropart. Phys., 19, 477
- Farrell et al. (1999) Farrell, W. M., Desch, M. D., & Zarka, P. 1999, J. Geophys. Res., 104, 14025
- Farrell et al. (2004) Farrell, W. M., Lazio, T. J. W., Zarka, P., Bastian, T. J., Desch, M. D., & Ryabov, B. P. 2004, Plan. Space Sci., 52, 1469
- Frail et al. (2000) Frail, D. A., Kulkarni, S. R., Sari, R., et al. 2000, ApJ, 534, 559
- George & Stevens (2007) George, S. J., & Stevens, I. R. 2007, MNRAS, 382, 455
- Gergely (1986) Gergely, T. E. 1986, in Low Frequency Radio Astronomy, eds. W. C. Erickson & H. V. Cane (Green Bank, WV: NRAO), 97
- Gorham et al. (2004) Gorham, P. W., Hebert, C. L., Liewer, K. M., Naudet, C. J., Saltzberg, D., & Williams, D. 2004, Phys. Rev. Lett., 93, 041101
- Gorham et al. (2005) Gorham, P. W., Saltzberg, D., Field, R. C., et al. 2005, Phys. Rev. D, 72, 023002
- Gorham et al. (2007) Gorham, P. W., Barwick, S. W., Beatty, J. J., et al. 2007, Phys. Rev. Lett., 99, 171101
- Griessmeier et al. (2005) Griessmeier, J.-M., Motschmann, U., Mann, G., & Rucker, H. O. 2005, A&A, 437, 717
- Griessmeier et al. (2007a) Griessmeier, J.-M., Preusse, S., Khodachenko, M., Motschmann, U., Mann, G., & Rucker, H. O. 2007a, Planet. Space Sci., 55, 618
- Griessmeier et al. (2007b) Griessmeier, J.-M., Zarka, P., & Spreeuw, H. 2007b, A&A, 475, 359
- Güdel (2002) Güdell, M. 2002, ARA&A, 40, 217
- Hallinan et al. (2007) Hallinan, G., Bourke, S., Lane, C., et al. 2007, ApJ, 663, L25
- Hankins et al. (1996) Hankins, T. H., Ekers, R. D., & O’Sullivan, J. D. 1996, MNRAS, 283, 1027
- Hankins et al. (2003) Hankins, T. H., Kern, J. S., Weatherall, J. C., & Eilek, J. A. 2003, Nature, 422, 141
- Haslam et al. (1982) Haslam, C. G. T., Salter, C. J., Stoffel, H., & Wilson, W. E. 1982, A&AS, 47, 1
- Helmboldt & Kassim (2009) Helmboldt, J. F., & Kassim, N. E. 2009, AJ, 138, 838
- Hewish et al. (1968) Hewish, A., Bell, S. J., Pilkington, J. D. H., Scott, P. F., & Collins, R. A. 1968, Nature, 217, 709
- Hicks et al. (2007) Hicks, B., Ray, P., Paravastu, N., Duffin, R., & Ellingson, S. 2007, LWA Memorandum 74; http://www.ece.vt.edu/swe/lwa/lwa0074a.pdf
- Holmberg et al. (2009) Holmberg, J., Nordström, B., & Andersen, J. 2009, A&A, 501, 941
- Huguenin & Moore (1974) Huguenin, G. R., & Moore, E. L. 1974, ApJ, 187, L57
- Hyman et al. (2005) Hyman, S. D., Lazio, T. J. W., Kassim, N. E., Ray, P. S., Markwardt, C. B., & Yusef-Zadeh, F. 2005, Nature, 434, 50
- Inzani et al. (1982) Inzani, P., Sironi, G., Mandolesi, N., & Morigi, G. 1982, in Gamma Ray Transients and Related Astrophysical Phenomena, ed. R. E. Lingenfelter, H. S. Hudson, & D. M. Worrall (New York: American Institute of Physics), 79
- Jackson et al. (1990) Jackson, P. D., Kundu, M. R., & Kassim, N. 1990, Sol. Phys., 130, 391
- Jaeger et al. (2010) Jaeger, T.R., Mutel, R. L., & Gayleya, K. G. 2010, Astropart. Phys., doi:10.1016/j.astropartphys.2010.08.008
- Jaeger & Mutel (not dated) Jaeger, T., & Mutel, R. not dated, LWA Memorandum 76; http://www.ece.vt.edu/swe/lwa/lwa0076.pdf
- James & Protheroe (2009) James, C. W., & Protheroe, R. J. 2009, Astropart. Phys., 30, 318
- James et al. (2010) James, C. W., Ekers, R. D., Álvarez-Muñiz, J., et al. 2010, Phys. Rev. D, 81, 2003
- Jelley et al. (1965) Jelley, J. V., Fruin, J. H., Porter, N. A., Weekes, T. C., Smith, F. G., & Porter, R. A. 1965, Nature, 205, 327
- Kardashev et al. (1977) Kardashev, N. S., Soglasnov, V. A., Saveleva, N. A., et al. 1977, SvA, 21, 1
- Kassim et al. (2007) Kassim, N. E., Lazio, T. J. W., Erickson, W. C., et al. 2007, ApJS, 172, 686
- Katz et al. (2003) Katz, C. A., Hewitt, J. N., Corey, B. E., & Moore, C. B. 2003, PASP, 115, 675
- Keane et al. (2010) Keane, E. F., Ludovici, D. A., Eatough, R. P., et al. 2010, MNRAS, 401, 1057
- Kerkhoff & Ellingson (2005) Kerkhoff, A., & Ellingson, S. 2005, LWA Memorandum 18, 2005 IEEE International Ant. Prop. Symp., Washington, DC, 2005 July (1B: 553-6)
- Klein-Wolt et al. (2002) Klein-Wolt, M., Fender, R. P., Pooley, G. G., Belloni, T., Migliari, S., Morgan, E. H., & van der Klis, M. 2002, MNRAS, 331, 745
- Kogan & Cohen (2009) Kogan, L., & Cohen, A. 2009, LWA Memorandum 150; http://www.ece.vt.edu/swe/lwa/lwa0150.pdf
- Koranyi et al. (1994) Koranyi, D. M., Green, D. A., Warner, P. J., Waldram, E. M., & Palmer, D. M. 1994, MNRAS, 271, 51
- Koranyi et al. (1995) Koranyi, D. M., Green, D. A., Warner, P. J., Waldram, E. M., & Palmer, D. M. 1995, MNRAS, 276, L13
- Langston et al. (2009) Langston, G. I., Bradley, R., Hankins, T., & Mutel, B. 2009, Nucl. Instrum. Methods Phys. Res. A, 604, S116
- Lazio et al. (2009) Lazio, J., Carilli, C., Hewitt, J., Furlanetto, S., & Burns, J. 2009, Proc. SPIE, 7436, 74360I
- Lazio & Farrell (2007) Lazio, T. J. W., & Farrell, W. M. 2007, ApJ, 668, 1182
- Lazio et al. (2004) Lazio, T. J. W., Farrell, W. M., Dietrick, J., Greenlees, E., Hogan, E., Jones, C., & Hennig, L. A. 2004, ApJ, 612, 511
- Lazio et al. (2009) Lazio, T. J. W., Carmichael, S., Clark, J., et al. 2009, AJ, 139, 96
- Loeb & Zaldarriaga (2007) Loeb, A., & Zaldarriaga, M. 2007, J. CosmoL. Astropart. Phys., JCAP01(2007)020
- Lonsdale et al. (2009) Lonsdale, C. J., Cappallo, R. J., Morales, M. F., et al. 2009, Proc. IEEE, 97, 1497
- Lorimer et al. (2007) Lorimer, D. R., Bailes, M., McLaughlin, M. A., Narkevic, D. J., & Crawford, F. 2007, Science, 318, 777
- Lundgren et al. (1995) Lundgren, S. C., Cordes, J. M., Ulmer, M., Matz, S. M., Lomatch, S., & Foster, R. S. 1995, ApJ, 453, 433
- Manchester et al. (2005) Manchester, R. N., Hobbs, G. B., Teoh, A., & Hobbs, M. 2005, AJ, 129, 1993; http://www.atnf.csiro.au/research/pulsar/psrcat/
- Martí et al. (2002) Martí, J., Mirabel, I. F., Rodríguez, L. F., & Smith, I. A. 2002, A&A, 386, 571
- McLaughlin & Cordes (2003) McLaughlin, M. A., & Cordes, J. M. 2003, ApJ, 596, 982
- McLaughlin et al. (2006) McLaughlin, M. A., Lyne, A. G., Lorimer, D. R., et al. 2006, Nature, 439, 817
- Melrose (2005) Melrose, D. 2005, PASA, 22, 144
- Millman et al. (1948) Millman, P. M., McKinley, D. W. R., & Burland, M. S. 1948, Nature, 161, 278
- Nemiroff (2003) Nemiroff, R. J. 2003, AJ, 125, 2740
- Paravastu et al. (2007) Paravastu, N., Hicks, B., Ray, P., & Erickson, W. 2007, LWA Memorandum 88; http://www.ece.vt.edu/swe/lwa/lwa0088.pdf
- Parsons et al. (2010) Parsons, A. R., Backer, D. C., Foster, G. S., et al. 2010, AJ, 139, 1468
- Pooley et al. (1997) Pooley, G., Green, D., Taylor, G. B., Beasley, A. J., Frail, D. A., & Kulkarni, S. R. 1997, IAU Circ., 6670
- Rankin et al. (1970) Rankin, J. M., Comella, J. M., Craft, H. D., Jr., Richards, D. W., Campbell, D. B., & Counselman, C. C., III 1970 ApJ, 162, 707
- Ray et al. (2007) Ray, P. S., York, J., Kerkhoff, A., et al. 2007, LWA Memorandum 68; http://www.ece.vt.edu/swe/lwa/lwa0068.pdf
- Rees (1977) Rees, M. J. 1977, Nature, 266, 333
- Rupen et al. (2002) Rupen, M. P., Dhawan, V., & Mioduszewski, A. J. 2002, IAU Circ., 7968
- Ryabov et al. (2004) Ryabov, V. B., Zarka, P., & Ryabov, B. P. 2004 Planet. Space Sci., 52, 1479
- Sagiv & Waxman (2002) Sagiv, A., & Waxman, E. 2002, ApJ, 574, 861
- Sallmen et al. (1999) Sallmen, S., Backer, D. C., Hankins, T. H., Moffett, D., & Lundgren, S. 1999, ApJ, 517, 460
- Scholten et al. (2006) Scholten, O., Bacelar, J., Braun, R., de Bruyn, A. G., Falcke, H., Stappers, B., & Strom, R. G. 2006, Astropart. Phys., 26, 219
- Scholten et al. (2009) Scholten, O., Buitink, S., Bacelar, J., et al. 2009, Phys. Rev. Lett., 103, 191301
- Smith et al. (2009) Smith, A. M. S., Collier Cameron, A., Greaves, J., Jardine, M., Langston, G., & Backer, D. 2009, MNRAS, 395, 335
- Stevens (2005) Stevens, I. R. 2005, MNRAS, 356, 1053
- Taylor et al. (1998) Taylor, G. B., Frail, D. A., Kulkarni, S. R., Shepherd, D. S., Feroci, M., & Frontera, F. 1998, ApJ, 502, L115
- Usov & Katz (2000) Usov, V. V., & Katz, J. I. 2000, A&A, 364, 655
- Waltman & Ghigo (1998) Waltman, E. B., & Ghigo, F. D. 1998, IAU Circ., 6930
- Weekes (2001) Weekes, T. 2001, in Radio Detection of High Energy Particles, First International Workshop RADHEP 2000, ed. D. Saltzberg & P. Gorham (Melville, NY: AIP), 3
- Wild & McCready (1950) Wild, J. P., & McCready, L. L. 1950, Aust. J. Sci. Res. A, 3, 387
- Winglee et al. (1986) Winglee, R. M., Dulk, G. A., & Bastian, T. S. 1986, ApJ, 309, L59
- Yantis et al. (1977) Yantis, W. F., Sullivan, W. T., III, & Erickson, W. C. 1977, BAAS, 9, 453
- York et al. (2007) York, J., et al. 2007, LWA Memorandum 93, http://www.ece.vt.edu/swe/lwa/memo/lwa0093.pdf
- Zarka (2006) Zarka, P. 2006, in Planetary Radio Emissions VI, ed. H. O. Rucker et al. (Vienna: Austrian Acad.), 543
- Zarka (2007) Zarka, P. 2007, Planet. Space Sci., 55, 598
- Zarka et al. (2001) Zarka, P., Treumann, R. A., Ryabov, B. P., & Ryabov, V. B. 2001, Ap&SS, 277, 293
- Zarka et al. (1997) Zarka, P., Queinnec, J., Ryabov, B. P., et al. 1997, in Planetary Radio Emissions IV, ed. H. O. Rucker et al. (Vienna: Austrian Acad.), 101