The Initial Mass Function and Young Brown Dwarf Candidates in NGC 2264.
IV. The Initial Mass Function and Star Formation History
Abstract
We have studied the star formation history and the initial mass function (IMF) using the age and mass derived from spectral energy distribution (SED) fitting and from color-magnitude diagrams. We also examined the physical and structural parameters of more than 1,000 pre-main sequence stars in NGC 2264 using the on-line SED fitting tool (SED fitter) of Robitaille et al.
We have compared the physical parameters of central stars from SED fitter and other methods. The temperature of the central star is, in many cases, much higher than that expected from its spectral type. The mass and age from SED fitter are not well matched with those from color-magnitude diagrams. We have made some suggestions to improve the accuracy of temperature estimates in SED fitter.
In most cases these parameters of individual stars from SED fitter in a star forming region (SFR) or in the whole cluster showed nearly no systematic variation with age or with any other relevant parameter. On the other hand, the median properties of stars in NGC 2264 SFRs showed an evident evolutionary effect and were interrelated to each other. Such differences are caused by a larger age spread within an SFR than between them.
The cumulative distribution of stellar ages showed a distinct difference among SFRs. A Kolmogorov-Smirnov test gave a very low probability of them being from the same population. The results indicate that star formation in NGC 2264 started at the surface region (Halo and Field regions) about 6 – 7 Myr ago, propagated into the molecular cloud and finally triggered the recent star formation in the Spokes cluster. The kind of sequential star formation that started in the low-density surface region (Halo and Field regions) implies that star formation in NGC 2264 was triggered by an external source.
The IMF of NGC 2264 was determined in two different ways. One method used the stellar mass from the SED fitting tool, the other used the stellar mass from color-magnitude diagrams. The first IMF showed a distinct peak at m 2M⊙, but the second did not. We attribute the peak as an artifact of the SED fitting tool because there is no such IMF with a peak at m 2M⊙. The slope of the IMF of NGC 2264 for massive stars () is -1.7 0.1, which is somewhat steeper than the so-called standard “Salpeter-Kroupa” IMF. We also present data for 79 young brown dwarf candidates.
1 INTRODUCTION
The initial mass function (IMF) is one of the core topics in stellar astronomical research. The universality of the IMF has been debated for a long time (see Scalo (2005) for example). In many cases the slope of the IMF of open clusters is well consistent with the so-called standard “Salpeter-Kroupa” IMF within the observational uncertainties, eg. for NGC 6231 (Sung et al., 1998), Tr 14 and Tr 16 in the Carina nebula (Hur et al., 2010), or the Arches cluster in the Galactic center (Espinoza et al., 2009). But in some cases, a top-heavy IMF is reported for massive young open clusters such as Westerlund 1 ( - Chun et al. (2010)) or for young stars in the Galactic center stellar disk (Bartko et al., 2010). On the other hand, a deficit of massive stars has also been reported for Taurus (Luhman et al., 2003) and the Cone nebula region of NGC 2264 ( - Park et al. (2000)). In chemical evolution models of bulges of our Galaxy and M31, a non-standard IMF has been favored (Ballero et al., 2007); however, recent precise abundance analyses of bulge and disk stars favors a universal IMF (G. Gilmore - private communication). The universality of the IMF remains an intriguing problem to be solved in the near future. Another outstanding issue in IMF research concerns the companion mass function in binary systems (Lada, 2006; Metchev & Hillenbrand, 2009).
The origin of the IMF is a hot topic of research. The similarity between the dense core clump mass function and the stellar IMF has led many investigators to implicitly assume that the clump mass function is the origin of the stellar mass function (Motto et al., 1998; Alves et al., 2007). But Smith et al. (2009) show the non-existence of such a correlation between clump mass and stellar mass. Owing to the rapid development of computing power and techniques many attempts have been made to understand the origin of the IMF through numerical modeling. Nowadays various physical processes such as gravitational fragmentation (Zinnecker, 1984), turbulence (Padoan & Nordlund, 2002), accretion (Bonnell et al., 2001), coalescence (Elmegreen & Shadmehri, 2003), and magnetic fields (Shu et al., 2004) are taken into account in the simulations. Recently Dib et al. (2010) were able to reproduce IMF or clump mass functions nearly identical to observations.
Star formation history remains one of the most interesting topics of current research. It is also related to triggering mechanisms of star formation. Most Milky Way OB associations extend over a few degrees (linear size of about 100 pc). It is very difficult to imagine that star formation on such a large scale occurred at a single instant. We can therefore expect to see age differences within an OB association. Classical examples of this are the sequential star formation in the OB associations - Sco-Cen association (= Upper Scorpius + Upper Centaurus and Lupus + Lower Centaurus and Crux) (Preibisch & Zinnecker, 1999), Ori OB1 (Blaauw, 1964) or the W3-W4-W5 regions in Cassiopeia (Lada et al., 1978). Recently, Wright et al. (2010) identified two different age groups in the massive OB association Cyg OB2, while Billot et al. (2010) could not find any signature of propagating star formation in the Vulpecula OB association. On the other hand, Povich & Whitney (2010) suggested a possible relation between star formation history and the IMF. They claimed evidence for delayed massive star formation in the M17 SWex region from deviations in the young stellar object (YSO) mass function from the Salpeter-Kroupa IMF. Another issue relating to the IMF and star formation history is the IMF of field stars such as the stars in the solar neighborhood. Without detailed knowledge of the star formation history in a region it is nearly impossible to trace the underlying IMF from the present day mass function (see Elmegreen & Scalo (2006) for example).
This is the final paper based on extensive optical photometry of NGC 2264. The IMF around S Monocerotis and for low-mass stars in NGC 2264 was derived in Sung et al. (2004, 2005) (Paper I & II). Sung et al. (2008) (Paper III) published an extensive photometric catalogue of NGC 2264. They identified two active star forming regions (SFRs - S MON & CONE) and a less active surrounding halo region (HALO). More recently, Sung et al. (2009) studied the spatial and spectral distributions of young pre-main sequence stars in NGC 2264 based on Spitzer IRAC (Infrared Array Camera - (Fazio et al., 2004)) and MIPS (Multiband Imaging Photometer for Spitzer - (Rieke et al., 2004)) 24 observations. From the spatial distribution of Class I and II YSOs, Sung et al. (2009) divided the CONE nebula region of Sung et al. (2008) into three SFRs - the Spokes cluster, Cone(C) and Cone(H).
This paper is organized as follows. In §2 we describe input data and some results from the SED fitting model (hereafter SED fitter). The star formation history and the IMF of NGC 2264 are presented in §3 and §4, respectively. We estimated the age and mass of stars in NGC 2264 in two ways, one from SED fitter, the other from color-magnitude diagrams (CMDs). In §5 we present a catalogue of young brown dwarf candidates (YBDCs) and their selection criteria. The effect of binarity on the IMF and the IMF of M17 SWex by Povich & Whitney (2010) are discussed in §6. The summary and conclusions are in §7.
2 SPECTRAL ENERGY DISTRIBUTION MODEL FITTING
In order to characterize the physical properties and the evolutionary status of disks and envelopes around pre-main sequence (PMS) stars in NGC 2264, we fitted the SED of stars detected in the mid-IR Spitzer observations to the model grid of Robitaille et al. (2006, 2007) (we call this web page the SED fitter.)111http://caravan.astro.wisc.edu/protostars/sedfitter.pho. To obtain better results we compiled and used all the available optical (Sung et al., 1997; Park et al., 2000; Sung et al., 2008; Dahm & Simon, 2005), near-IR 2MASS (Skrutskie et al., 2006), and mid-IR Spitzer data (Sung et al., 2009). We limited our attention to objects which were detected in all IRAC bands and whose total photometric error in the four IRAC bands was smaller than 0.25 mag. The number of targets was 1,173 (381 stars in S Mon, 185 stars in the Spokes cluster, 157 stars in Cone(C), 206 stars in Cone(H), 178 stars in Halo, and 66 stars in Field regions - see Sung et al. (2009) for the region names). Among them, 853 objects were known members (X-ray, H emission, IR excess from Spitzer IRAC, or early type stars) of NGC 2264. In addition, 33 embedded objects in S Mon, Spokes cluster, Cone(C) and Cone(H) were also included. Among the above 886 objects, 336 objects (38 %) were detected in MIPS 24 which gives an important constraint in SED fitting especially for the YSOs with transition disks or with pre-transition disks. The total number of known members in NGC 2264 is 1,162 stars, and therefore the fraction of stars used in SED fitting was 73.4 % (= 853 / 1162) of the total known members. In addition we also examined physical properties of 40 BMS (below pre-main sequence) stars.
SED fitter gives a wide range of models for a given SED. In such cases we should have model selection criteria. If several models give similar SEDs for a target, it is best to select a model that gives the smallest mass for the central star because (1) low-mass stars have a higher probability of having disks or envelopes, and (2) low-mass stars occur more frequently than massive stars. In addition, in many cases, SED fitter gives a higher temperature than the temperature derived from the spectral type of the star (see §2.1.1). In most cases the temperature of the model is equal to or higher than that of the mass-minimum model. The best model selection criterion is therefore, the model which gives the smallest mass for the central star among the 10 best models from SED fitter if or for the case of . But the best model for a BMS star is, on the other hand, the model whose is the minimum among the candidate models because if BMS stars are really PMS stars with edge-on disks, the criterion used for normal stars above may give a biased result.
In SED fitting we applied constraints on the distance and reddening, (kpc) = -0.15 – 0.0 and = 0 – 100 mag. The parameters from SED fitter are those for the aperture of 2762 AU (about 3.′′5 at 760 pc).
2.1 Comparison of Stellar Parameters
The physical or structural properties of PMS stars evolve as the central star ages. We therefore expect an evolution or variation of such properties. Young open clusters are ideal targets for this kind of study and it is important to check these properties with the SED fitting tool. The results can give some insights into an understanding of the structural evolution of PMS stars as well as the evolution of the cluster itself. In addition, it also provides evidence on the reliability of the SED fitting tool, and thereby contributes to improving SED fitter.
In this section we compare several parameters relating to the central star from SED fitter with those from other methods.
2.1.1 Effective Temperature
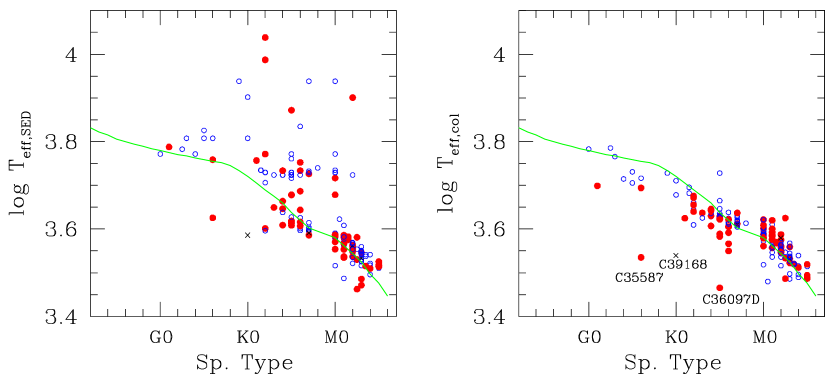
Spectral type is the primary indicator of stellar temperature. Rebull et al. (2002) published the spectral type of 360 stars in NGC 2264. Among them 174 stars are targets for SED fitting. Figure 1 shows the relation between spectral type and temperature. The left panel shows the relation between spectral type and the temperature from SED fitting, while the right panel shows the same relation but with temperature from the color versus temperature relation of Bessell (1995). As there is no known way to determine the reddening of late type PMS stars using photometric data alone, we applied the same reddening = 0.07 for all stars (Sung et al., 1997; Park et al., 2000)222We also applied a different reddening for a different SFR (the median value of reddening from SED fitter in Table 1), the result was very similar.. The solid line in the figure is the spectral type versus temperature relation of MS stars (Schmidt-Kaler, 1982).
Normally the expected error in spectral classification is 1 – 2 subclasses, but as many of our targets are Class II objects we can expect an error of 2 or more subclasses in spectral type due to the intrinsic variability. In the left panel of Figure 1 there are many stars with much higher temperatures from SED fitter than that from the spectral type. Although we take the error in spectral type into account, the difference in temperature is excessive. The reddening of these stars would be more than 2.4 mag (mean 3.32 mag). This value is much larger than the median of all SFRs except Spokes cluster in Table 1. This means that the reddening from SED fitter is less reliable, and may cause a problem in the temperature estimate.
On the other hand the temperature derived from color indices is relatively well matched with that expected from its spectral type. There are three exceptions - C35587, C39168, and C36097D (= C36097 + C36109). Two of them are due to a large error in spectral type (G6: for C35587 and K0: for C39168). C36097D may be due to duplicity or reddening correction (SED fitter estimates the of C36097D as 6.26 mag).
The physical properties of the central source, such as effective temperature and luminosity, are the most important parameters in understanding the evolutionary status of the central source, and play a crucial role in the physical properties of disks and envelopes because dust in the disks and envelopes are heated by irradiation from the star and from accretion shocks at the stellar surface. A large difference in temperature of some stars in Figure 1 implies that SED fitter seems not to use optical color as a temperature indicator. As the optical color is a good temperature indicator, it is better for SED fitter to estimate the temperature of the central source using optical color, such as which is least affected by UV excess from accretion shocks or IR excess from dust in the disks. In addition, color is, in most cases, obtained from semi-simultaneous observations, and therefore is less affected by the variability. As optical data, near-IR 2MASS data, and Spitzer mid-IR data are obtained at different epochs, there are many cases showing a systematic difference in fluxes among photometric bands due to variability.
First determine the temperature of the central star from color indices, estimate the reddening from SED fitting, and then estimate the temperature again using reddening-corrected optical colors. This iterative process seems to be required to get better results.
2.1.2 Mass and Age
Unlike stars in the main sequence (MS) stage, the mass, as well as the age of PMS stars can be determined from the CMD with the aid of theoretical evolution models of PMS stars. As there is no reliable method of estimating the reddening for low-mass PMS stars without prior knowledge of spectral type, we have applied the mean reddening = 0.07 mag determined by Sung et al. (1997); Park et al. (2000) using early type MS stars in NGC 2264. This value is somewhat smaller than the median from SED fitter or E() from spectral type versus intrinsic color relation (Rebull et al., 2002). But optically observable stars are relatively less embedded and the difference in age or mass resulting from a smaller value of reddening should be minor (Sung et al., 2004).
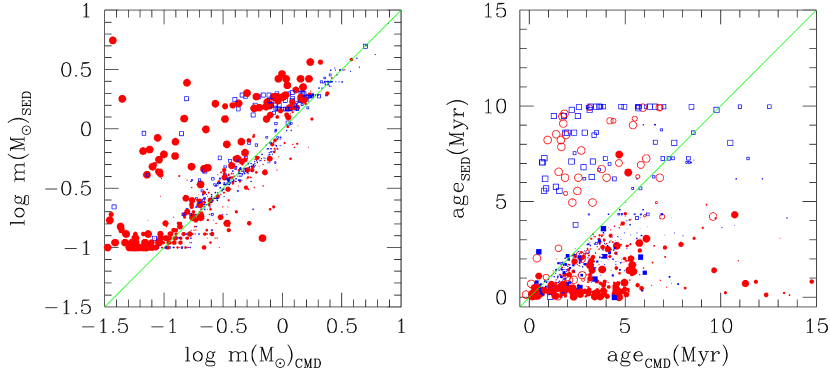
The PMS evolution models used are those by Siess et al. (2000) for M⊙ and by Baraffe et al. (1998) for M⊙ (see Figure 9 of this paper or Figure 4 of Sung et al. (2004)). We compared the mass and age from CMDs with those from SED fitter in Figure 2. The size of symbols is proportional to the amount of reddening from SED fitter. Circles and squares represent Class II YSOs and stars with normal photosphere (or Class III), respectively. In the right panel open symbols denote massive stars ( 1 M⊙), while filled symbols stand for low-mass stars ( 1 M⊙).
Masses of less reddened stars (small symbols) are well consistent with each other, but masses from SED fitter for high objects are in general larger than those from CMDs. And we easily see the lower mass limit ( 0.1 M⊙) of SED fitter which is the mass limit of PMS evolution models of Siess et al. (2000). In addition, there are two clumps in the distribution of masses from SED fitter - a distinct clump at 0.2 – 0.3 and a less prominent at -0.2 – -0.4. These two clumps are directly related to the peaks in the IMF of Figure 7.
The ages from SED fitter and from CMDs do not show any correlation (see the right panel of Figure 2). For low mass stars (m 1 M⊙), ages from SED fitter are in general smaller than those from CMDs, but for massive stars, ages from SED fitter are, on the other hand, larger than those from CMDs. The ages of massive stars from SED fitter are mostly larger than 5 Myr with an upper limit of 10 Myr, but those from CMDs are distributed widely from 0 to 13 Myr. For low-mass stars there is a strong concentration of ages from SED fitter between 0 – 3 Myr. But the ages from CMDs are distributed evenly between 0 – 6 Myr. Many Class II objects have relatively smaller ages from SED fitter. This fact implies that the age difference may be partly related with the reddening correction. But even when we applied the median value of reddening for a given SFR the correlation does not improve noticeably. It is very difficult to surmise the source of such differences.
2.2 SED Fitting Results for Individual Stars
As we are dealing with many PMS stars in the young open cluster NGC 2264 and expect that many parameters relating to the structure or evolution of PMS stars are interrelated, it is therefore of interest to check whether there are any systematic variations of one parameter against another.
2.2.1 General Properties
The mean value of the distance (, in kpc) from SED fitting was -0.089 0.051 ( = 815 95 pc) for all PMS stars and the median value was between -0.09 and -0.11 (see Table 1). This value is consistent with other determinations - 760 90 pc from the zero age main sequence relation (Sung et al., 1997) and 913 40 (sampling) 110 (systematic) pc from the assumption that the distribution of inclination angles determined from the projected rotational velocity and rotation period is random (Baxter et al., 2009).
We could not find any correlation between age and reddening. This means that the interstellar material in NGC 2264 may be very inhomogeneous. The total luminosity did not show any systematic variation with age. This is a result of a combination of the mass spectrum and different evolutionary stages. If we limited our attention to the stars with masses less than 1 M⊙, we could find a weak evolutionary trend between age and luminosity. The total luminosity of low-mass stars decreased with age with the power of -0.28 0.02. Other parameters did not show any systematic variation with age or mass.
2.2.2 Disks
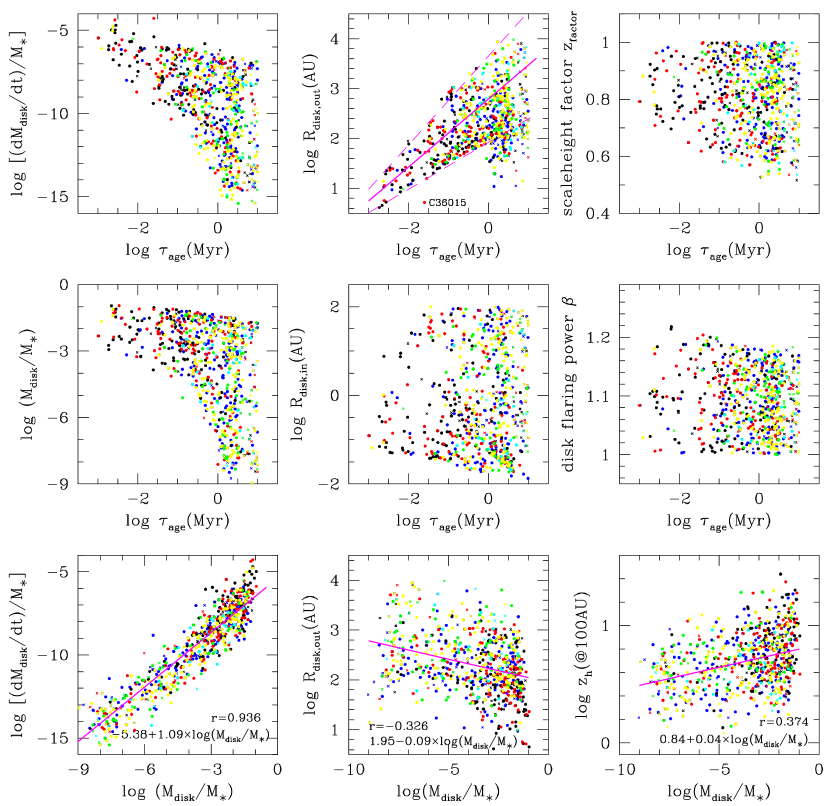
We present several figures relating to the disk properties in Figure 3. We show the relation between stellar age and disk accretion rate in the first panel of Figure 3. There seems to be virtually no variation in the upper limit of the disk accretion rate, but the lower limit decreases with time. The scatter in the disk accretion rate of is about 3 orders of magnitude, rising to about 8 orders of magnitude at . The relation between disk mass and stellar age shows a similar variation with time and a similar scatter. As a result, we see a rather tight correlation between disk mass and disk accretion rate.
There is an order of magnitude scatter around the relation at a given disk mass. In addition, the relation shows a slight curvature - higher accretion rates for massive disks. Stars in the younger SFRs - Spokes cluster and Cone(C) - are more concentrated in the upper right of the figure, i.e. higher accretion rates and more massive disks.
The of individual stars increases with age. The power of the lower boundary is about 0.47 and that of upper boundary is about 0.89. The initial scatter ranges over about an order of magnitude, but it increases with age and reaches about two orders of magnitude near . And there are several outliers between 0 – 1 as in Figure 6 of Robitaille et al. (2006). Some of these outliers are double stars, which is reminiscent of disk truncation due to the existence of companion, but it is uncertain why they have smaller than the other YSOs. There is an exception which cannot be found in Figure 6 of Robitaille et al. (2006). C36015 has very small . C36015 is a Class I object close to the brightest IR source in NGC 2264 IRS 1 ( = 0.08 pc at 760 pc).
If disk evolution occurred in a gradual manner, we could expect an increase in the disk inner radius with age. But the inner disk radius ( in units of or AU) for individual stars shows no systematic variation with age. The disk scale height at 100AU, on the other hand, is greater for younger stars with massive disks (). Other parameters, such as scale height factor zfactor, flaring factor and disk accretion power show no appreciable systematic variation with time. There is a very small variation of zfactor and with time, and Robitaille et al. (2006) interpreted such variations as the settling of dust to the disk mid-plane.
2.2.3 Envelopes
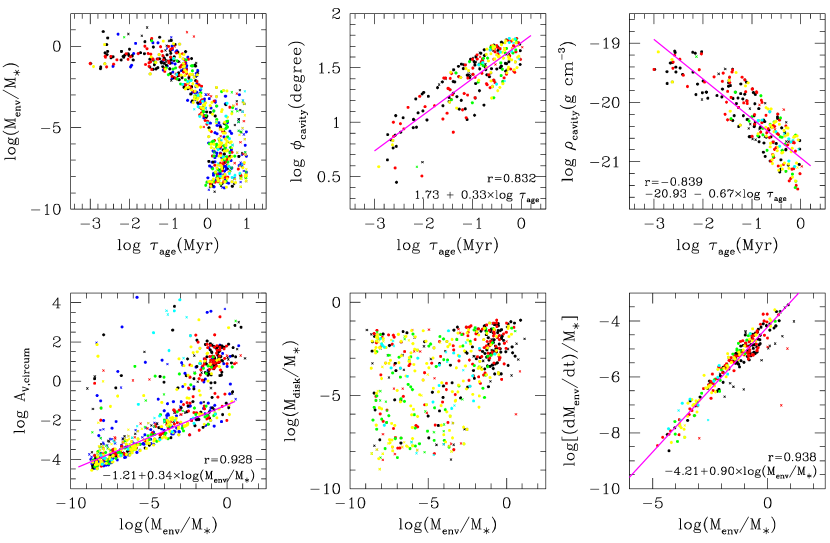
We present several figures relating to the envelope parameters in Figure 4. The mass in the envelope is about 10-1±1 M⊙ at the initial stage and decreases gradually with time reaching about 10-4±1 M⊙ at about 1 Myr. After that, the envelope masses show a large scatter. The mass in the envelope disperses rapidly and accretion from the envelope is halted at this stage (see the last figure of Figure 4). However, the large scatter in the envelope mass at 1Myr could simply be an artifact of the SED fitting.
Although there is a large scatter, older stars have a larger cavity opening angle (). The cavity opening angle is about 10∘ at 0.01 Myr, and increases up to about 55∘ at 1 Myr. The cavity density, on the other hand, decreases as age increases (). The initial value of the cavity density is about 10-19.5±0.5 g cm-3, and decreases with age to the power of -2/3, i.e. . At an age of 1 Myr, the cavity density approaches about 10-21.0±0.5 g cm-3. This fact implies that the sweeping up of envelope material occurs at a very early stage.
The circumstellar extinction (the extinction from the edge of the circumstellar envelope to the surface of the central star) decreases with stellar age as . There are three distinct groups in the diagram of envelope mass and circumstellar extinction. The first is the highly extincted objects with massive envelopes, the second group is less extincted with less massive envelopes. The second group show a good correlation between envelope mass and circumstellar extinction (). The first group comprises PMS stars with active accretion from the envelope. The third group comprises relatively highly extincted objects regardless of envelope mass. These are BMS stars with nearly edge-on disks (see Table 1).
It is natural to expect a correlation between envelope mass and disk mass, but the results show no such correlation between these quantities. There is a strong concentration at and and there is a scattered population with . The stars in the concentrated group are mostly stars in Spokes cluster or Cone(C). Their envelope mass of the scatter population may be an artifact of SED fitting as mentioned before.
The envelope accretion rate is a strong function of envelope mass (). Many active stars in the Spokes cluster or the Cone(C) region show an envelope accretion rate of M. The time evolution of the envelope accretion rate obtained here is very similar to that in Figure 4 of Robitaille et al. (2006). The outer radius of the envelopes does not show any correlation with age or mass. And there are only a handful of stars with 1000 AU.
2.3 Median Properties
We present the median values from SED fitter in Table 1. Although the membership selection is far from complete in the Field region, we list the data for completeness. As the scatter of a given parameter is very large due partly to the age spread in a given SFR and partly to the difference in environments, the values in the table are (logarithmic value of) median, 10 and 90 percentiles except the first two rows which give the fraction of objects in a given evolution stage. As shown in the 5th row of Table 1 the median age changes from 0.35 Myr to 2.02 Myr. But if we define the age spread of a given SFR as the age difference between the 10 and 90 percentiles in the cumulative age distribution (Park et al., 2000), the age spread of SFRs in NGC 2264 is between 2.5 Myr and 3.4 Myr, which is larger than the difference in median ages among SFRs. This means that most properties of YSOs in a given SFR in parameter space overlap with those in other SFRs. Although we have such a limitation, we adopt the median age as the representative age of a given SFR. In this section we examine the variation of parameters among SFRs against their median ages. This picture can give an approximate view of several young open clusters with different ages.
2.3.1 General Properties
The first two rows of Table 1 list the fraction of objects at a given evolutionary stage. The definitions used in Robitaille et al. (2006) for the evolutionary stages are adopted and used here. The fraction of stars in Stages 0/1 or 2 is much higher than that of stars in Class I or II stages in Sung et al. (2009). Such a difference is due mostly to the fact that only members or probable members (i.e. embedded objects in the three active SFRs) are taken into account. The difference in the definition of “class” and “stage” of YSOs also contributes to the difference. As already mentioned in Sung et al. (2009), the evolutionary stage of SFRs in NGC 2264 differs from one region to another, so we can expect difference in the age of each SFR. The age in Table 1 is the median, 10 and 90 percentile age of stars whose mass is between 0.2 – 1.0 M⊙ because most PMS evolutionary models give an abnormally large age for massive PMS stars (Sung et al., 1997, 2000, 2004) (see also Hartmann (2003)). The Spokes cluster is the youngest ( Myr), S Mon, Cone(H), and Halo are slightly older ( 1.6 – 2.0 Myr), and Cone(C) is intermediate between them ( Myr). More discussions on the age of stars and star formation history in NGC 2264 are made in §3.
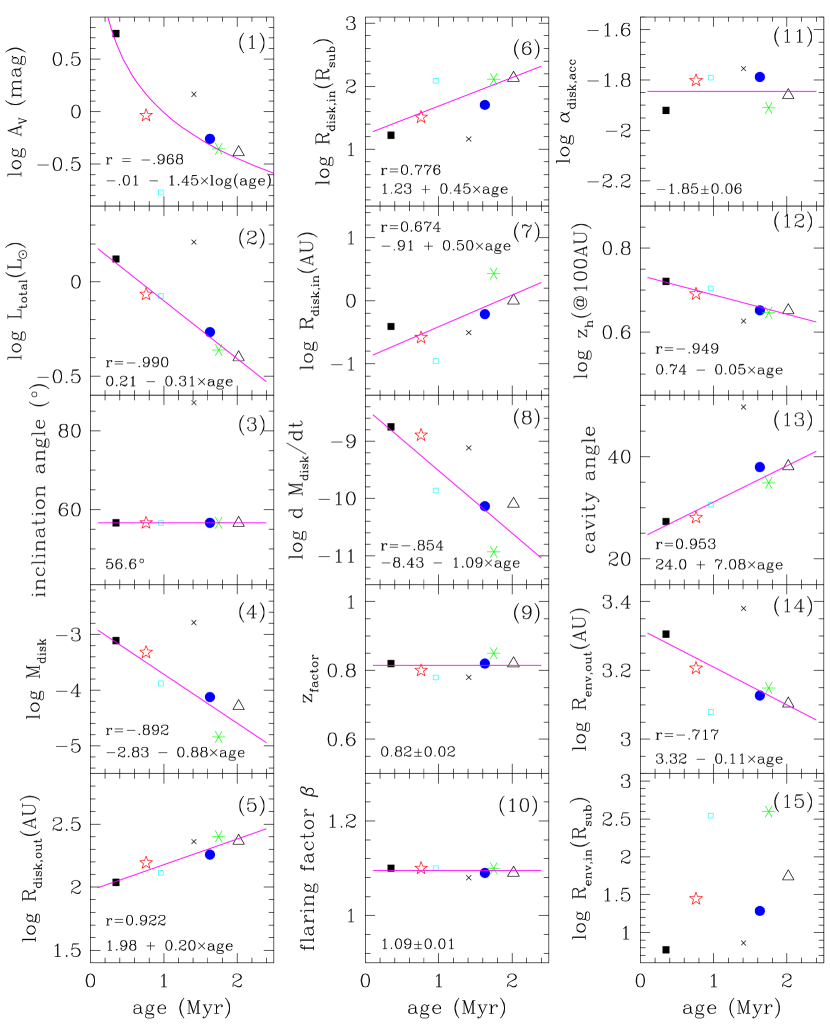
To see whether there are any systematic variation in physical parameters among SFRs, we plot several parameters against the median age of a given SFR in Figure 5. The median value of interstellar extinction against median age is shown in Figure 5 (1). Although we cannot find a noticeable trend for individual stars in a given SFR, the median relation shows a clear evolutionary trend between extinction AV and age. Despite the small samples, young stars in the Field region or BMS stars deviate largely from the trend. Field members are far away from the active SFRs in NGC 2264 and so are more likely to be in relatively transparent regions. The median AV of BMS stars are slightly larger than the others. It is reasonable that BMS stars have a larger value of A as they are thought to have nearly edge-on disks. But the larger AV of BMS stars may be just a result of small sample statistics or result from difficulties in fitting the SED of BMS stars.
The median value of the total luminosity shows a strong correlation with age. As there is no correlation between age and mass, the correlation between age and total luminosity reflects the average evolutionary stage of a given SFR. A similar figure for individual stars in a given SFR shows a similar trend with a large scatter. Such a scatter is due to the diversity of stellar masses as well as to a difference in evolutionary stage. BMS stars show higher luminosity at a given age. That is probably due to the higher dust emission from disks around BMS stars as the median value of the disk masses of BMS stars is higher than for other stars.
2.3.2 Disks
Several of the next figures show the behavior of parameters relating to disk properties. The median value of the inclination angle of disks is the same for all SFRs and the distribution of inclination angle of individual stars for a given SFR does not show any preferential angle, i.e. a random distribution of inclination angles. On the contrary, the median value of the inclination angle of BMS stars is very high (the highest inclination angle from the SED fitter). This result is partly due to the difference in the best model selection criterion. If we use the same criterion for the best model for BMS stars, the median value of the inclination angle is 69.5∘ . A Kolmogorov-Smirnov (K-S) test between the cumulative distribution of inclination angles of PMS stars in the S Mon region and that of BMS stars gives 6.5 % probability of a subset drawn from the same underlying distribution. This value is far lower than the probability between the S Mon region and the Spokes cluster (89.7 %) or the S Mon and Cone(C) regions (29.7 %). This result also implies that BMS stars are PMS stars with nearly edge-on disks.
The mass in the disks as well as the mass accretion rate are strong functions of age, i.e. PMS stars in younger SFRs have larger disk masses and higher disk accretion rates as expected. The median value of the disk inner or outer radii is, on the other hand, smaller for younger SFRs and larger for older SFRs. The of individual stars in an SFR show a similar trend as shown in Figure 3, but there is about two orders of magnitude difference between minimum and maximum value of at a given age. The inner radius ( in unit of or AU) of individual stars in an SFR does not show any trend as mentioned in §2.2.2. Other parameters, such as scale height factor zfactor, flaring factor , and disk accretion power do not show any appreciable systematic difference or variation among SFRs. But the disk scale height at 100AU decreases as age increases.
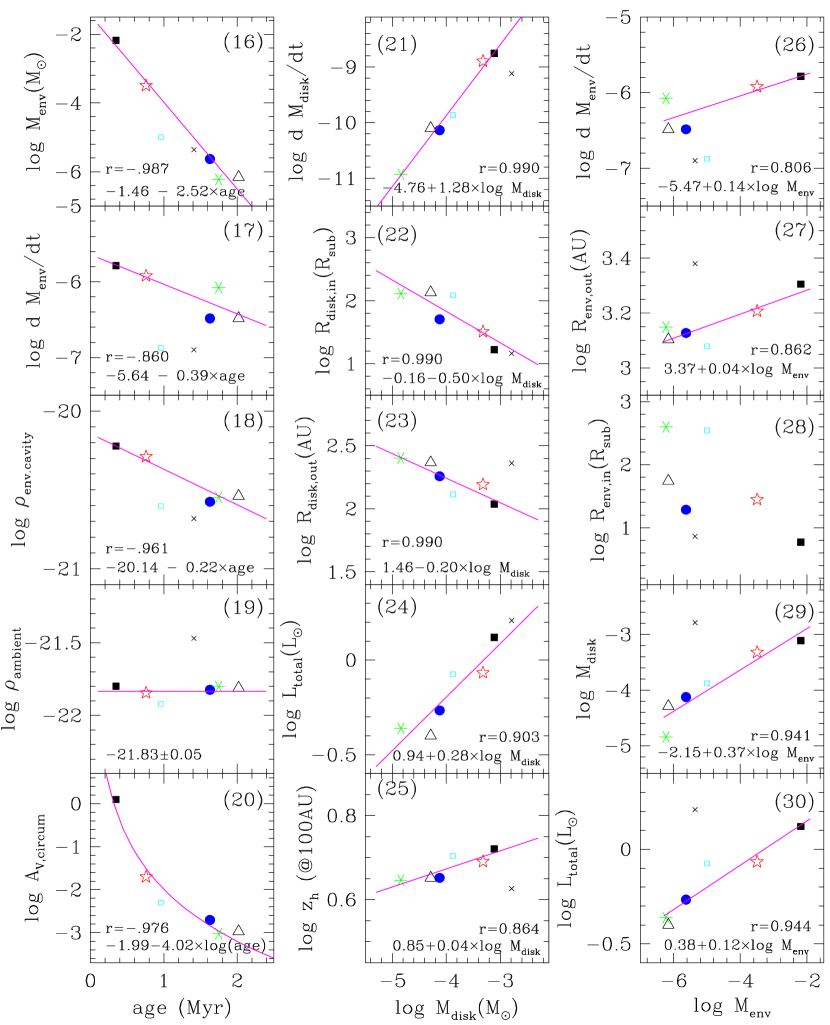
We also show the relation between disk mass and other parameters in Figure 5 (21) – (25). The disk accretion rate is a strong function of disk mass. The relation between the median value of the disk masses and the median value of the disk accretion rate is
Disk mass and inner or outer radii are anti-correlated in the sense of median values. The intercept and exponent powers differ from the same relations for individual stars. The median value of the total luminosity is proportional to the median value of disk mass even for BMS stars, as seen in Figure 5 (24). But due to the variety of disk masses and evolutionary stages there is no correlation between disk mass and total luminosity for individual stars. The median value of the disk scale height at 100 AU is well correlated with the median value of the disk mass (Figure 5 (25)). This result means that although there is nearly no change in scale height factor , the disk scale height at 100 AU is larger for massive disks, in other words it is larger at earlier stages.
2.3.3 Envelopes
The next figures (Figure 5 (13) – (18), (26) – (30)) show the time evolution of parameters relating to the envelopes of PMS stars in NGC 2264. It should be noted that in most cases the envelope could be observed for those stars with age 1 Myr, therefore the median age of a given SFR cannot represent the age of individual stars with envelopes.
The cavity opening angle increases as the median age increases. The decrease in median value of envelope mass with age is more dramatic being on average, a four orders of magnitude decrease in envelope mass from the youngest SFR Spokes cluster to the 2 Myr SFRs S Mon, Cone(H) and Halo regions. The difference in envelope accretion rate among SFRs is small - only an approximate 5 times difference between the Spokes cluster and the S Mon or Halo regions. The envelope accretion rate with envelope mass of individual stars changes in a similar manner. The exponent of the power in the median relation (Figure 5(26)) is 0.14, but that of individual stars is 0.85
The median value of the envelope outer radii is well correlated with the median age of the SFR as shown in Figure 5 (14). This may be due to the infall of material to the disk. For individual stars there is almost no correlation between the envelope outer radius and stellar age as mentioned in §2.2.3. The median value of the inner radius of the envelope increases as the median age increases as shown in Figure 5 (15). But any correlation between them is not so clear, because SED fitter gives the smaller, default value of the inner radius of the envelope ( = 1 ) for many cases.
The median value of the density in the cavity decreases with median age of the SFRs. But the median value of the ambient density is nearly constant regardless of the age of the SFRs. BMS stars in Figure 5(19) show a larger . As there is no reason to expect higher for BMS stars, this may be the result of difficulties of SED fitting for BMS stars. The circumstellar extinction (AV from the outside edge of the YSO to the stellar surface along the line of sight) is a decreasing function of age as is the interstellar extinction in Figure 5(1). The median value of the circumstellar reddening AV,circum decreases as the median age increases with about the -4th power of the age. The AV,circum of BMS stars is very high due to extinction in the circumstellar disk, and does not appear in Figure 5(20).
Although there are strong correlations between the median value of envelope mass and the median value of disk mass or total luminosity as shown in Figures 5 (29) and (30), there is no correlation between the same quantities for individual stars.
3 STAR FORMATION HISTORY
The star formation history in an SFR can give valuable information on star formation processes. From the age difference between massive stars near the MS turn-off and low-mass PMS stars near the MS turn-on, Herbig (1962) proposed a sequential star formation scenario in an open cluster. But Sung et al. (1997) claimed that the mass-age relation of PMS stars in young open clusters may be an artifact of PMS evolution models, and suggested that such a discrepancy in age could be solved by reducing the PMS lifetime (Helmholtz -Kelvin contraction time scale). Later Sung et al. (2000); Park et al. (2000); Sung et al. (2004) supplied additional supporting results. However Palla & Stahler (2000) proposed prolonged star formation which is nearly the same scenario as suggested by Herbig (1962).
Fürész, G. et al. (2006) identified three groups in NGC 2264 according to their radial velocity from high resolution multi-object spectroscopic observation. Later Sung et al. (2008) confirmed the existence of two of them and found one more SFR, Halo, surrounding these SFRs. Teixeira et al. (2006) first identified the Spokes cluster as being dominated by Class I sources. Using Spitzer mid-IR data Sung et al. (2009) also identified two SFRs (Spokes cluster and Cone(C)) dominated by Class I objects and one SFR (S Mon) dominated by Class II objects. Throughout this paper we use the name of the SFRs used by Sung et al. (2009). It is very interesting to now compare the age distribution among SFRs. It should also give some important information relating to the star formation processes within NGC 2264.
3.1 Age Distribution
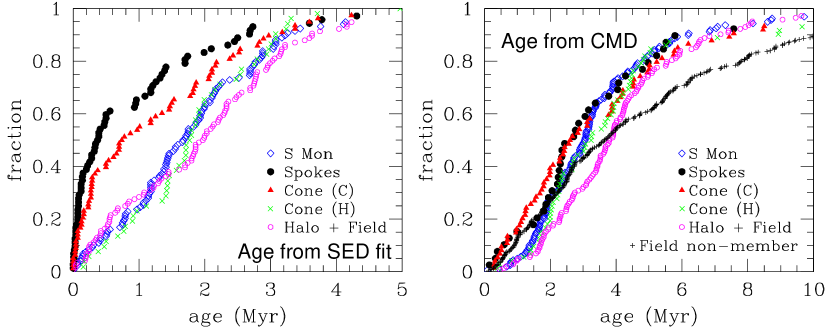
The age of PMS stars is determined in two ways. One is the age from the SED fitter, and the other is the age from the CMDs (see §2.1.2). We present the cumulative age distribution of low-mass PMS stars in a given SFR in Figure 6. To avoid unrealistic ages from PMS evolution models, we limit the PMS stars with m = 1.0 – 0.2 M⊙ (see Sung et al. (1997, 2004)).
We also present the median age, 10 and 90 percentile in the cumulative age distribution, and the results from K-S tests in Table 2. If we assume that the median age is the representative age of an SFR and the difference between the 10 and 90 percentile in the age distribution is the age spread of the SFR, the median age from SED fitter is about 1 – 2 Myr younger than that from CMDs for a given SFR. In addition, the age spread is about 3 Myr from SED fitter, while that from CMDs is about 5 – 6 Myr. The smaller value of age spread is due to the fact that the stars used in SED fitter are relatively younger and easier to detect with Spitzer observations. On the other hand, the somewhat larger age spread from CMDs may be due to the effect of reddening. In addition, the reddening law in young SFRs may differ from that in the general interstellar medium. Therefore, the age spread, or in other words the cluster formation time scale, may be about 5 Myr.
The left panel of Figure 6 shows the cumulative age distribution of PMS stars from SED fitter. Although the median age of stars in Field is much younger than that in Halo, this seems to be due to the small number of member stars in Field. As the age distribution of stars in Field is very similar to that of Halo and the number of known members with H emission or X-ray emission in Field is very small, we merge the stars in Field and Halo. The age distribution of stars in a given SFR is far different from each other. The stars in the Spokes cluster are the youngest among the SFRs in NGC 2264. The stars in S Mon and Cone(H) have a similar distribution, while the age of stars in Cone(C) is intermediate between the Spokes cluster and S Mon. The age of stars in Halo is slightly older than that in S Mon, but the difference is marginal. To check whether the age distribution among SFRs in NGC 2264 arise from the same distribution or not, we have performed a K-S test. The results are listed in Table 2. The probability of the subsets being drawn from a common population is very low between S Mon and the Spokes cluster or S Mon and Cone(C), but is very high between S Mon and Cone(H). The probability between S Mon and Halo (and Field) is marginal.
The cumulative distribution of ages from the CMDs is presented in the right panel of Figure 6. The pattern of age distributions is far different to that from SED fitter. The age distributions of all active SFRs (S Mon, Spokes cluster, Cone(C), and Cone(H)) in NGC 2264 are very similar. As many young PMS stars in the Spokes cluster or Cone(C) are deeply embedded, they are not in the PMS locus of NGC 2264. In addition, the PMS stars in the PMS locus are situated in the outside surface region of NGC 2264, and therefore the contamination of Halo or Field members is unavoidable. This is the reason why the age distribution of these active SFRs is similar to each other. On the other hand the difference in age distribution between stars in S Mon and Halo (including Field) is rather clear. The probability from a common population is very low (). Somewhat larger probabilities relative to the age distribution of stars in the Spokes cluster are obtained from the K-S test. The results are due to the small number of member stars in the PMS locus of NGC 2264 because most of the members of the Spokes cluster are an embedded population. In order to check the reliability of this comparison, although there is no way to estimate the age of non-member stars, we estimated the age of non-member stars in the PMS locus of NGC 2264 by assuming they were members of NGC 2264. The age distribution of non-member stars is far different from that of Halo or other member stars in active SFRs. The very low probabilities from a K-S test between the age distribution of non-member stars in Field and other SFRs indicate that this kind of test is valid for the study of star formation history.
3.2 Triggered Star Formation in NGC 2264
The age distributions obtained above give a clear picture of sequential star formation in NGC 2264. The stars in Halo (and Field) region are formed first, followed by stars in S Mon and Cone(H). The stars in Cone(C) formed later and finally star formation took place in the Spokes cluster. We can find several Class I objects in Cone(C), and many Class I objects (Sung et al., 2009) and Class 0 objects (Teixeira et al., 2007) in the Spokes cluster. In other words, star formation activity in NGC 2264 started at the surface of the giant Monocerotis molecular cloud and propagated inside the cloud. As already noted in Sung et al. (2008) there are several small SFRs spread over Field region. The median age of Field is very similar to that of Halo. It is very difficult to imagine that spontaneous star formation started first in a low density region (Halo or Field) of NGC 2264. If the star formation history derived in §3.1 is true, we should accept that star formation in NGC 2264 was triggered by an external source, such as a supernova (SN) explosion that occurred about 6 – 7 Myr ago.
An extensive review of triggered star formation has been published by Elmegreen (1998). He classified triggered star formation into three types according to the scale of star formation. Tauber et al. (1993) conducted a high resolution CO observation in the bright nebular region of NGC 2264 and found three bright clumps. This is an example of small scale triggered star formation in NGC 2264. The age difference between S Mon and Cone(C) is 0.4 – 0.8 Myr, and the projected distance between S Monocerotis and HD 47887 is about 26′ (= 5.7 pc at 760 pc). If star formation in Cone(C) were triggered by the influence of S Monocerotis, the minimum propagation velocity of star formation activity would have been 7 – 14 km s-1, which is far faster than sound speed in a general molecular cloud ( 1 km s-1). Therefore intermediate scale triggering - “collect and collapse” - may not have taken place in NGC 2264.
The first mention of large scale triggered star formation happening in and around NGC 2264 is the paper by Heiles (1979) who found an HI shell in the Monocerotis region. Later Schwartz (1987) found a half circle stellar loop in Mon OB1 region using IRAS images. He listed several young objects along the semicircle - IC 446, IC 2169, NGC 2264 IRS1 and IRS2, and NGC 2261 (= R Mon). The diameter of the half circle was about 2.5 degree (about 33 pc at 760 pc). Oliver et al. (1996) studied the large scale structure in Mon OB1 from an extensive CO survey. They identified many molecular clouds and listed candidate optical objects possibly associated with them. The center of the shell is (, ) = ( , ) from Figure 1 and 2b of Oliver et al. (1996).
3.3 Objects of Common Origin with NGC 2264
We showed in the previous section that the star formation in NGC 2264 was triggered externally, and the triggering source may have been an SN that exploded about 6 – 7 Myr ago. Schwartz (1987); Oliver et al. (1996) listed many possible optical counterparts. We have checked these objects and a few should be excluded. All data were obtained from the Simbad database 333 http://simbad.u-strasbg.fr and the open cluster database WEBDA 444http://www.univie.ac.at/webda. There are no optical counterparts for approaching clouds 4, 12, and 19 in Figure 2a of Oliver et al. (1996). Although the large extent in velocity of cloud 4 in Figure 1 of Oliver et al. (1996) implies the possibility of it being an ejected cloud from the imputed SN explosion, the cloud is located far from the center of the CO hole (, ). Cloud 4 may therefore not have the common origin. Cloud 19 may also not be related to the SN explosion for the same reason. Cloud 9 shows a large velocity gradient and is very close to cloud 10. There are two reflection nebulae (IC 2167 = IC 446; GN 06.28.4) in cloud 9, and several young variable stars in and around these reflection nebulae. These young stars are 2MASS J06310611+1027340 (Sp: B2.5V) in GN 06.28.4, VY Mon (Sp: B8, H emission star) in IC 2167, V540 Mon (= HBC 521, Sp: M6, H emission star) and V687 Mon (= LkH 274, Sp: K4IVe) around IC 2167.
Cloud 10 is very close to the CO hole and is an approaching cloud. Within it are an HII region IC 2169 and 4 early type stars - HIP 31038 (= vdB 76, Sp: B7IIIp), V727 Mon (Sp: B8V, eclipsing binary), HD 258749 (= vdB 77, Sp: B5III), and HD 258853 (= vdB 78, Sp: B3). There are two reflection nebulae in cloud 11 - NGC 2245 and NGC 2247. An H emission star V699 Mon (= LkH 215, Sp: B6) is at the center of NGC 2245, and a B6pec star V700 Mon is in NGC 2247. Although cloud 11 is a very massive cloud, only two reflection nebulae indicate current star formation activity. This may be due to its small cross section facing the CO hole.
Cloud 13 is related to IRAS 06337+1051, many radio sources and a thin nebula around the mid-IR source. Several young or massive star candidates can also be found. Among them Kiso H 39 may be related to the cloud, but the relation of GSC 00737-01170 (Sp: O5:) and Tycho 737-898-1555 = 10.18, = 1.22, = 0.42 by Drilling (1975). The color is too red for a B type star. If the star were a low-mass PMS star and its blue color caused by UV excess, the star would be somewhat brighter than the low-mass members of NGC 2264. (Sp: B) to cloud 13 is uncertain. Schwartz (1987); Oliver et al. (1996) proposed a possible relation between cloud 13 and the open cluster NGC 2259. However, NGC 2259 is an intermediate-age open cluster that cannot be related to the cloud. The most massive molecular cloud in Table 1 of Oliver et al. (1996) is the giant molecular cloud which is associated with NGC 2264. A small cloud - cloud 17 - harbors a reflection nebula NGC 2261 and the young star R Mon (Sp: B0).
Oliver et al. (1996) proposed a possible relationship between the open cluster NGC 2254 and clouds 18 through 20. NGC 2254, as well as Basel 7 and Basel 8, have been observed only in the photographic system and so their nature is somewhat uncertain. They appear to be intermediate-age open clusters from their CMDs. Another open cluster NGC 2251 is marked in Figure 2b of Oliver et al. (1996). The cluster’s distance in WEBDA is more distant than NGC 2264, and although the data were derived mostly from photographic photometry the cluster seems to be a Pleiades-age open cluster. Therefore the relationship between the clusters and the clouds is quite uncertain. New homogeneous data are required for a comprehensive view of the star formation history in the Mon OB1 association.
4 THE INITIAL MASS FUNCTION
In this section we derive the IMF of NGC 2264 in two ways - using masses derived from SED fitter and masses derived from fitting CMDs. The membership selection is nearly complete down to about 0.25 M⊙ (Sung et al., 2004) for two Chandra fields - one around S Monocerotis (Ramírez et al., 2004) and the other around the Cone nebula (Flaccomio et al., 2006). These two fields fully cover the four active SFRs (S Mon, Cone(C), Cone(H), and Spokes cluster) in NGC 2264. We designated these four regions as the reference region for the combined IMF. The IMF is defined as the number of stars per unit projected area per unit logarithmic mass interval, i.e. area, where area is in kpc2. We adopted the distance of NGC 2264 as 760 pc (Sung et al., 1997). We used the logarithmic mass interval = 0.1 for the reference region, and = 0.2 for the IMF of an individual SFR. We also calculated the IMF for each SFR in the same bin size, but shifted by 0.1 in to reduce the binning effect. For massive stars () there were many cases with no star in a given mass bin. In those cases, we enlarged the mass interval so that there was at least one star in each mass bin. The upper mass limit was assumed to be 100 M⊙ - the most massive star ever measured was 116 31 M⊙ (Schnurr et al., 2008) - and we calculated the mean value of in the mass bins. One thing to be noted is that although some stars were known to be in a binary system, such as S Mon (Gies et al., 1996; Sung et al., 1997), we assumed all stars to be single as we have only limited information on multiplicity (see §6.1 for the effect of binarity).
4.1 The IMF from SED Fitter
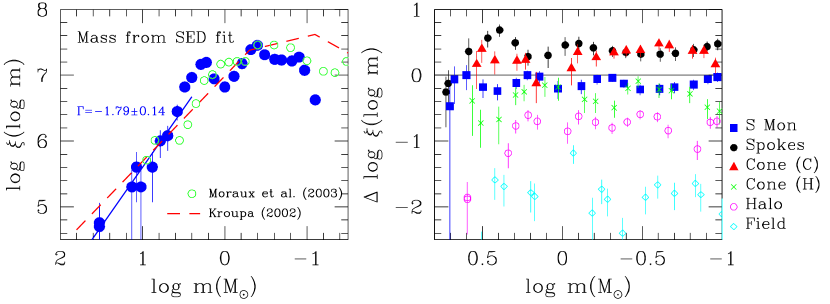
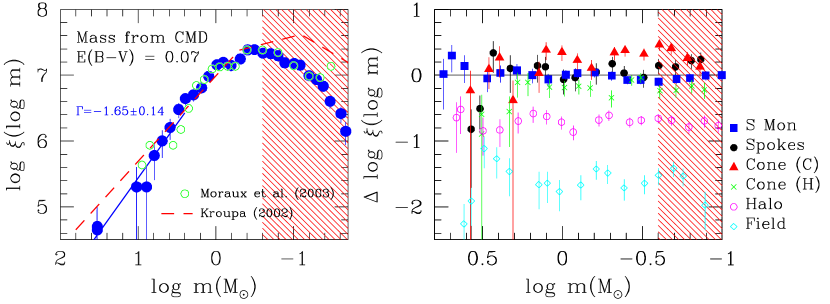
We determined the IMF for each SFR, but show the IMF of the reference region in the left panel of Figure 7 because a) membership selection is nearly complete; b) we could determine the slope of the IMF in the massive regime (M 3 M⊙) reliably as only a few massive stars were in a given SFR. The right panel of Figure 7 shows the relative IMF of each region relative to the reference IMF. The abrupt decrease in the IMF at -1.0 is due to the limited exposure time of the Spitzer observations of NGC 2264. There are some stars with -1.0 although the lowest mass from SED fitter is 0.1 M⊙; the mass of these stars is derived from CMDs only.
The IMFs by Kroupa (2002) and by Moraux et al. (2003) are superimposed for comparison. Their IMF were adjusted roughly at -0.3 – -0.4. There is a distinct peak in the combined IMF of NGC 2264 at about 2 M⊙ and another less distinct peak at about 0.4 M⊙ as already mentioned in §2.1.2. We could not find similar peaks in the IMF of field stars in the Solar neighborhood (Scalo, 1986; Lee & Sung, 1995; Chabrier, 2001; Kroupa, 2002) or in young open clusters (Sung et al., 2004; Muench et al., 2002). In many cases there was a local maximum at about 1 M⊙ in the IMF of field stars or open clusters, therefore the prominent peak at M in Figure 7 may be an artifact induced by the minimizing routine in SED fitter. Such a peak can be seen the YSO mass function of M17 SWex (see §6.2 for the discussion on this issue) (Povich & Whitney, 2010). Normally the IMF can be characterized by its slope . The slope for massive stars () is -1.79 0.14, which is very similar to the slope obtained by Park et al. (2000) for NGC 2264 or by Scalo (1986) for the Solar neighborhood.
Figure 7 (right panel) shows the difference in the IMF for each SFR relative to the combined IMF in the left panel. The IMF itself, by definition, represents the surface density. The surface density of stars in the Spokes cluster or the Cone(C) region is higher ( in Spokes cluster and in Cone(C) in the mass interval of +0.5 – -0.5) than the average value of four active SFRs. And Cone(H) is slightly lower ( in the same mass interval). The IMF of the Spokes cluster shows a slight enhancement at about 2.5 M⊙ above the mean (about 2 level). The surface density of the Halo region is very low () and lacks massive stars. The low surface density may be due partly to the incompleteness of the membership selection in the Halo region. The IMF of the Field region is far lower. This is due partly to the incompleteness of membership selection but largely to the huge area observed relative to the small SFRs spreading over the Field region.
4.2 The IMF from Color-Magnitude Diagrams
The IMF of open clusters is derived from their CMDs. But for young open clusters where the distribution of reddening material is very inhomogeneous, there are many limitations, especially for low-mass PMS stars, because there is practically no ways to determine the reddening of individual stars from photometric data alone. In addition, there is the uncertainty in PMS evolution models. We derived the IMF of stars in the PMS locus of NGC 2264 (Sung et al., 2008) by applying the mean reddening. In this case we could not take the heavily embedded stars and BMS stars into account. We derived the IMF of NGC 2264 for two values of reddening - the mean reddening (E() = 0.07 mag - Sung et al. (1997); Park et al. (2000)) determined from early type stars in NGC 2264, and the median AV from SED fitter for each region. As already checked in Sung et al. (2004) a small difference in reddening does not greatly affect the shape of the IMF, i.e. the more important factor is the inclusion or exclusion of embedded stars and BMS stars. As PMS stars in the PMS locus are mostly less reddened, a small value of E() is more appropriate. The IMF determined from the stars in the PMS locus is shown in Figure 8. The IMF presented here is the combined IMF of the reference region. The only massive star (M 10 M⊙) missed in the derived IMF is NGC 2264 IRS1, an embedded flat SED object with 13.5 M⊙ from SED fitter. The shaded area represents the mass range where membership selection is largely incomplete as mentioned before.
The IMF of NGC 2264 is very similar to that of the Pleiades (Moraux et al., 2003) down to where the membership selection is incomplete even in the reference region of NGC 2264. But there is some scatter for massive stars (m 2 M⊙). This is related to the fluctuations due to the small number of massive stars in the cluster. The IMF of NGC 2264 shows a slight deficiency in massive stars relative to the IMF of Kroupa (2002). We could not find a similar peak in the IMF at about 2 M⊙. The slope of the IMF is for . This slope is much steeper than that of Salpeter (1955) or Kroupa (2002), but is very similar to that of Scalo (1986); Hambly et al. (1999). In this case the surface density in the Spokes cluster is very similar to that of S Mon because many members of the Spokes cluster are heavily embedded. The surface density of Cone(C) is slightly elevated, and that of Cone(H) is slightly lower.
5 YOUNG BROWN DWARF CANDIDATES
One of main purposes of this study was to select the YBDCs in NGC 2264. NGC 2264 is one of the nearest young open clusters and the foreground extinction is practically zero. The YBDCs in NGC 2264 are therefore still very bright and their photometric characteristics are very similar to those of young low-mass stars. Kendall et al. (2005) tried to find the YBDCs in NGC 2264 using deep photometry with CFH12K. Although they tried to find YBDCs in various color-color diagrams and CMDs and through the help of recent model atmospheres, they were unable to find YBDCs confidently due to a lack of reliable membership selection criteria. They presented eight probable YBDCs and two additional candidates.
We selected YBDCs with the following criteria.
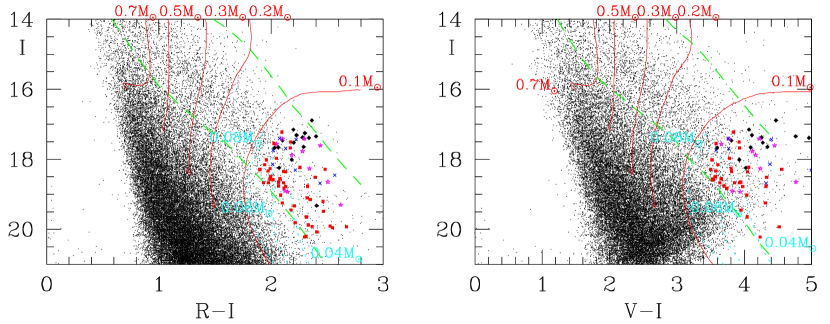
(1) the mass from CMDs is smaller than 0.075 M⊙. As Siess et al. (2000) published PMS evolution models only for m 0.1 M⊙, we have to use the PMS evolution models by Baraffe et al. (1998) for the selection of YBDCs. But as it is well known that the theoretical colors of Baraffe et al. (1998) are not well matched for low-mass stars, we have transformed their model parameters (Teff and LBol) to or using the empirical color-temperature and color-BC relations by Bessell (1991). Still the theoretical evolutionary tracks by Baraffe et al. (1998) do not match well with those of Siess et al. (2000), but it is now possible to extrapolate the tracks to the red color regime by following the 0.1 M⊙ track of Siess et al. (2000).
(2) Stars with one or more membership criteria such as H emission, X-ray emission, or IR excess (Class I, II, or III objects).
(3) The mass from SED fitter if the star is detected with the Spitzer should be 0.1 M⊙ which is the lowest mass from SED fitter.
Using these criteria, we have selected the 79 YBDCs presented in Table 3. The CMDs of these YBCDs are shown in Figure 9. The PMS evolutionary tracks are superimposed in the figure. IR excess YBDCs are relatively bright due to the limited exposure time used in the Spitzer observations. In addition, X-ray emission cannot identify YBDCs fainter than and while H photometry reaches down to fainter limits, the selection probability is somewhat low (about 30% - see Sung et al. (2004)).
Three of the YBDCs in Table 3 (C33215 = 2MASS J06405674+0938101, C35463 = J06410604+0949232, and C20186 = J06401789+0941546) are in common with the YBDCs listed by Kendall et al. (2005). Another object (2MASS J06402759+0945464) could be a YBCD because the star is within the PMS locus of both CMDs and H is very similar to that of weak line T Tauri stars with X-ray emission. The other 6 YBDCs in Kendall et al. (2005) may not be members of NGC 2264 - Three objects (2MASS J06395722+0941011, J06400642+0944197, J06411281+0945529) are fainter than the lower boundary of PMS locus of NGC 2264 (Sung et al., 2008). Two (J06401053+0939557, J06413132+0935120) are within the PMS locus in the (, ) diagram, but are below the lower boundary of the PMS locus in the (, ) diagram. In addition the H colors of these two objects are very similar to those of reddened background stars. And 2MASS J06404873+0939017 is detected only in .
6 Discussion
6.1 The Effect of Binarity on the IMF
The fraction of binary or multiple systems and their characteristics are important constraints for the studies of stellar formation and evolution (Burgasser et al., 2007). Several studies on the frequency of multiple systems and their properties were made especially for very low-mass stars (see Sterzik & Durisen (2003) and references therein), but their initial values are still not well known. The frequency and mass ratio in multiple systems may affect the actual shape of the IMF.
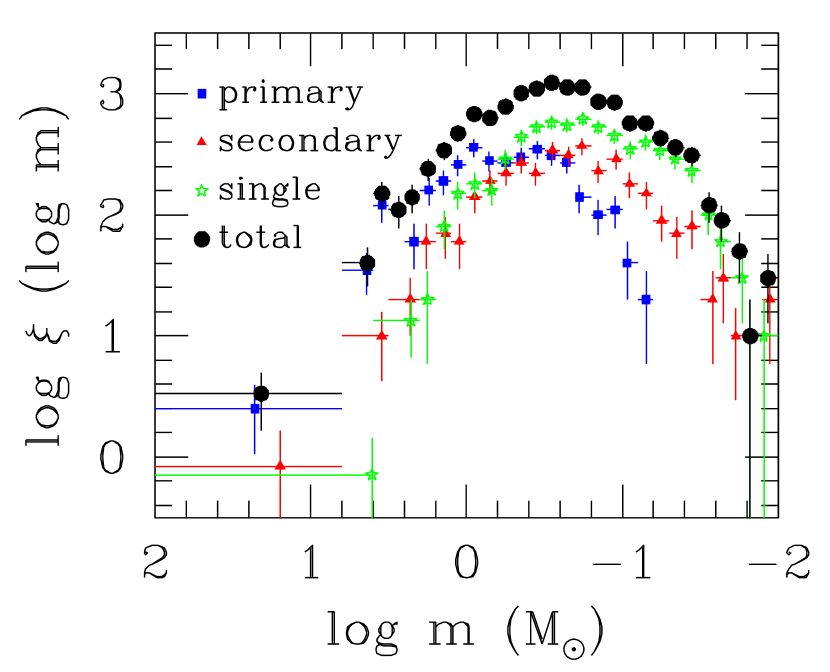
In general the IMF derived from young open clusters is just the IMF of single stars and primaries of multiple systems. It is very important to check the effect of multiple systems on the IMF. We constructed a model cluster of 1,000 primaries plus single stars with a Monte Carlo method. The IMF of NGC 2264 in Figure 8 is adopted as an input IMF. The frequency of binary as a function of primary mass was adopted from the results of two-step dynamical model of Sterzik & Durisen (2003) which reproduce well the observations. In addition the secondary to primary mass ratio as a function of spectral type in Figure 4 of Sterzik & Durisen (2003) was converted to a function of primary mass and used in the simulation. We assume that the binary fraction of massive stars (m 10 M⊙) was 90%. As there is nearly no information on the fraction and mass ratio in multiple systems of triple or more, only single stars and binary systems were taken into account.
A total of 355 binary systems and 645 single stars were generated (see Figure 10). The massive part of the mass function is dominated by the primaries in binary systems, while the low-mass part is due to single stars. The mass function of secondaries is very similar to the IMF of all stars. The shape and slope at the massive part of the IMF of all stars is very similar to those of the input IMF. In addition, the peak of the IMF occurs at -0.6, which is the same value as the input IMF. Such similarities are due to the facts that the binary fraction of very low-mass stars and BDs is nearly zero and that of massive stars is very high. In addition the mass ratio of very low-mass stars and BDs is relatively high, but that of massive stars is preferentially a smaller value.
If we change the fraction of binary systems of very low-mass stars and BDs from 0% to 10 %, the fraction of binary systems increases from 35.5 % to 37.1 % (371 binary systems were generated in this case). Although the mass of the IMF peak does not change, the slope of the IMF of the massive part becomes steeper and the IMF of very low-mass and BD regime stars increases.
We can conclude that if the binary fraction and mass ratio distribution are very similar to those adopted here, the shape and peak of the IMF do not change very much. But the fraction of multiple systems and the mass ratio distribution can affect strongly the IMF of all stars. And therefore it is very important to investigate the frequency and mass ratio distribution of multiple systems for several open clusters with different ages.
6.2 YSO Mass Function of M17 SWex
Recently Povich & Whitney (2010) studied the YSO mass function (YMF) of the embedded massive star forming region M17 SWex. They used SED fitter to estimate the mass of YSOs in M17 SWex and found the YMF to be much steeper than that of Salpeter (1955). Their YMF showed a peak at m . The location of the YMF peak is very similar to the peak in the IMF in Figure 7. The prominent peak in the YMF of M17 SWex may be due to the combination of two effects - the completeness of the PMS membership selection in M17 SWex and the effect mentioned in §4.1.
If we attribute this peak to an artifact from SED fitter, then the slope of the YMF of M17 SWex may be somewhat shallower. In addition, if we take account of the fact that there are no known very massive young stars (e.g. M ) with disks, the most massive stars in the region may have been missed and the slope of the YMF of M17 SWex could be normal.
7 SUMMARY AND CONCLUSION
We have studied the young open cluster NGC 2264 using all available photometric data from optical to mid-IR. We performed SED fitting using the minimizing SED fitting tool by Robitaille et al. (2007) for more than 1,000 stars detected in all Spitzer IRAC channels with high quality ( mag) mid-IR data. We estimated the mass and age of member stars in NGC 2264 and constructed the star formation history and IMF of the cluster. The results obtained are summarized as follows.
(1) The parameters relating to the central stars from SED fitter and other methods are compared. The temperature from SED fitter is, in many cases, higher than that expected from the spectral type of the star. And the mass of central stars shows a conspicuous clump at 0.2 – 0.3 and -0.2 – -0.4, which causes anomalous peaks in the IMF from SED fitter. The age of central stars is, on the other hand, smaller for sub-solar mass stars, but is larger for massive stars ( 1 M⊙).
(2) The parameters relating to disks or envelopes of individual stars in NGC 2264 were examined and found to be very similar to those in Robitaille et al. (2006). The properties of individual stars showed no significant differences among the SFRs in NGC 2264. As the maximum difference in median age among SFRs is smaller than the age spread in an SFR, the large scatter of parameters is due mainly to their age spread.
(3) The median values of the physical and structural parameters showed an evident difference among SFRs in NGC 2264 that was strongly related to the median age of the SFRs. Such a difference among SFRs gives an approximated view of several young open clusters with different ages.
(4) The cumulative age distribution of stars showed distinct differences among SFRs. The median age of SFRs implies that star formation in NGC 2264 occurred sequentially - star formation started at the surface of the Monocerotis giant molecular cloud and propagated into the cloud, i.e. the stars in the Halo and Field region are the oldest, the stars in S Mon and Cone(H) are intermediate while those in Cone(C) are younger, and those in the Spokes cluster are the youngest. The star formation history seen in NGC 2264 and the fact that the first star formation occurred in the low density region (Halo and Field) of NGC 2264 imply that star formation in NGC 2264 was triggered externally.
(5) The IMF using the stellar mass from SED fitter shows a prominent peak at m 2M⊙. As such a peak cannot be found in the IMF of other open clusters or field stars in the Solar neighborhood, the peak in the IMF from SED fitter may be an artifact of the SED fitting tool. The IMF from CMDs is well consistent with the IMF of the Pleiades.
(6) The slope of the IMF of massive stars () is -1.7 0.1. This value is somewhat steeper than the standard Salpeter-Kroupa IMF (Kroupa, 2002), but is consistent with that of Scalo (1986).
(7) We selected 79 young brown dwarf candidates from the PMS loci in the CMDs of NGC 2264 that showed either H emission, X-ray emission, or IR excess emission, and with implied masses smaller than 0.075 M⊙.
References
- Alves et al. (2007) Alves, J., Lombardi, M., & Lada, C. J. 2007, A&A, 462, L17
- Ballero et al. (2007) Ballero, S. K., Kroupa, P., & Matteucci, F. 2007, A&A, 467, 117
- Baraffe et al. (1998) Baraffe, I., Chabrier, G., Allard, F., & Hauschildt, P. H. 1998, A&A, 337, 403
- Bartko et al. (2010) Bartko, H. et al. 2010, ApJ, 708, 834
- Baxter et al. (2009) Baxter, E. J., Covey, K. R., Muench, A. A., Fürész, G., Rebull, L., & Szentgyorgyi, A. H. 2009, AJ, 138, 963
- Bessell (1991) Bessell, M. S. 1991, AJ, 101, 662
- Bessell (1995) Bessell, M. S. 1995, in The Bottom of the Main Sequence and Beyond, ed. by C. Tinney, (Springer, Berlin) p123
- Billot et al. (2010) Billot, N., Noriega-Crespo, A., Carey, S., Guieu, S., Shenoy, S., Paladini, R., & W. Latter 2010, arXiv:1003.0866
- Blaauw (1964) Blaauw, A. 1964, ARA&A, 2, 213
- Bonnell et al. (2001) Bonnell, I. A., Bate, M. R., Clarke, C. J., & Pringle, J. E. 2001, MNRAS, 323, 785
- Burgasser et al. (2007) Burgasser, A. J., Reid, I. N., Siegler, N., Close, L., Allen, P., Lowrance, P., & Gizis, J. 2007, Protostars and Planets V, eds by B. Reipurthm D. Jewitt, and K. Keil, (Univ of Arizona Press, Tucson), p951
- Chabrier (2001) Chabrier, G. 2001, ApJ, 554, 1274
- Chun et al. (2010) Chun, M.-Y., Lim, B., Sung, H., Besell, M. S., & Sohn, T. 2010, in preparation
- Dahm & Simon (2005) Dahm, S. E., & Simon, T. 2005, AJ, 129, 829
- Dib et al. (2010) Dib, S., Shadmehri, M., Padoan, P., Maheswar, G., Ojha, D. K., & Khajenabi, F. 2010, MNRAS, in press
- Drilling (1975) Drilling, J. S. 1975, AJ, 80, 128
- Elmegreen (1998) Elmegreen, B. G. 1998, ASP Conf. Ser., 148, 150
- Elmegreen & Scalo (2006) Elmegreen, B. G., & Scalo, J. 2006, ApJ, 636, 149
- Elmegreen & Shadmehri (2003) Elmegreen, B. G., & Shadmehri, M. 2003, MNRAS, 338, 817
- Espinoza et al. (2009) Espinoza, P., Selman, F. J., Melnick, J. 2009, A&A, 501, 563
- Fazio et al. (2004) Fazio, G. G. et al. 2004, ApJS, 154, 10
- Flaccomio et al. (2006) Flaccomio, E., Micela, G., & Sciortino, S. 2006, A&A, 455, 903
- Fürész, G. et al. (2006) Fürész, G. et al. 2006, AJ, 648, 1090
- Gies et al. (1996) Gies, D. R. et al. 1997, ApJ, 475, L49
- Hambly et al. (1999) Hambly, N. C., Hodgkin, S. T., Cossburn, M. R., & Jameson, R. F. 1999, MNRAS, 303, 835
- Hartmann (2003) Hartmann, L. 2003, ApJ, 585, 398
- Heiles (1979) Heiles, C. 1979, ApJ, 229, 533
- Herbig (1962) Herbig, G. 1962, ApJ, 135, 736
- Hur et al. (2010) Hur, H., Sung, H., & Bessell, M. S. 2010, in preparation
- Kendall et al. (2005) Kendall, T. R., Bouvier, J., Moraux, E., James, D. J., & Ménard, F. 2005, A&A, 434, 939
- Kroupa (2002) Kroupa, P. 2002, Science, 295, 82
- Lada (2006) Lada, C. J. 2006, ApJ, 640, L63
- Lada et al. (1978) Lada, C. J., Elmegreen, B. G., Cong, H.-I., & Thaddeus, P. 1978, ApJ, 226, L39
- Lee & Sung (1995) Lee, S.-W., & Sung, H. 1995, JKAS, 28, 45
- Luhman et al. (2003) Luhman, K. L., Briceño, C., Stauffer, J. R., & Hartmann, L. 2003, ApJ, 590, 348
- Metchev & Hillenbrand (2009) Metchev, S. A., & Hillenbrand, L. A. 2009, ApJS, 181, 62
- Moraux et al. (2003) Moraux, E., Bouvier, J., Stauffer, J. R., & Cuillandre, J.-C. 2003, A&A, 400, 891
- Motto et al. (1998) Motto, F., Andre, P., & Neri, R. 1998, A&A, 336, 150
- Muench et al. (2002) Muench, A. A., Lada, E. A., Lada, C. J., & Alves, J. 2002, ApJ, 573, 366
- Oliver et al. (1996) Oliver, R. J., Masheder, M. R. W., & Thaddeus, P. 1996, A&A, 315, 578
- Padoan & Nordlund (2002) Padoan, P., & Nordlund, A. 2002, ApJ, 576, 870
- Palla & Stahler (2000) Palla, F., & Stahler, S. W. 2000, ApJ, 525, 772
- Park et al. (2000) Park, B.-G., Sung, H., Bessell, M. S., & Kang, Y. H. 2000, AJ, 120, 894
- Povich & Whitney (2010) Povich, M. S., & Whitney, B. A. 2010, ApJ, in press (arXiv1004.1712)
- Preibisch & Zinnecker (1999) Preibisch, T., & Zinnecker, H. 1999, AJ, 117, 2381
- Ramírez et al. (2004) Ramírez, S. V. et al. 2004, AJ, 127, 2659
- Rebull et al. (2002) Rebull, L. M. et al. 2002, AJ, 123, 1528
- Rieke et al. (2004) Rieke et al. 2004, ApJS, 154, 25
- Robitaille et al. (2006) Robitaille, T. P., Whitney, B. A., Indebetouw, R., Wood, K., & Denzmore, P. 2006, ApJS, 167, 256
- Robitaille et al. (2007) Robitaille, T. P., Whitney, B. A., Indebetouw, R., & Wood, K. 2007, ApJS, 169, 328
- Salpeter (1955) Salpeter, E. E. 1955, ApJ, 121, 161
- Scalo (1986) Scalo, J. M. 1986, Fundam. Cosmic Phys., 11, 1
- Scalo (2005) Scalo, J. M. 2005, in The Initial Mass Function 50 Years Later, ed. E. Corbelli, F. Palla, & H. Zinnecker (Dordrecht: Springer), p.23
- Schmidt-Kaler (1982) Schmidt-Kaler, K. in Landolt-Börenstein, Vol. 2b, p19, p453
- Schnurr et al. (2008) Schnurr, O., Casoli, J., Chené, A.-N., Moffat, A. F. J., & St-Louis, N. 2008, MNRAS, 389, L38
- Schwartz (1987) Schwartz, P. R. 1987, ApJ, 320, 258
- Shu et al. (2004) Shu, F., Li, Z.-Y., & Allen, A. 2004, ApJ, 601, 930
- Siess et al. (2000) Siess, L., Dufour, E., & Forestini, M. 2000, A&A, 358, 593
- Skrutskie et al. (2006) Skrutskie, M. F. et al. 2006, AJ, 131, 1163
- Smith et al. (2009) Smith, R. J., Clark, P. C., & Bonnell, I. A. 2009, MNRAS, 396, 830
- Sterzik & Durisen (2003) Sterzik, M. F. & Durisen, R. H. 2003, A&A, 400, 1031
- Sung et al. (2004) Sung, H., Bessell, M. S., & Chun, M.-Y. 2004, AJ, 128, 1684 (Paper I)
- Sung et al. (2005) Sung, H., Bessell, M. S., & Chun, M.-Y. 2005, in (ASP Conf. Ser. 362, The seventh Pacific Rim Conference on Stellar Astrophysics, eds. Y. W. Kang, H.-W. Lee, and K.-C. Leung (San Francisco, CA; ASP) 275 (Paper II)
- Sung et al. (2008) Sung, H., Bessell, M. S., Chun, M.-Y., Karimov, R., & Ibrahimov, M. 2008, AJ, 135, 441 (Paper III)
- Sung et al. (1997) Sung, H., Bessell, M. S., & Lee, S.-W. 1997, AJ, 114, 2644 (SBL97)
- Sung et al. (1998) Sung, H., Bessell, M. S., & Lee, S.-W. 1998, AJ, 115, 734
- Sung et al. (2000) Sung, H., Chun, M.-Y., & Bessell, M. S. 2000, AJ, 120, 333
- Sung et al. (2009) Sung, H., Stauffer, J. R., & Bessell, M. S. 2009, AJ, 138, 1116
- Tauber et al. (1993) Tauber, J. A., Lis, D. C., & Goldsmith, P. F. 1993, ApJ, 403, 202
- Teixeira et al. (2006) Teixeira, P. S. et al. 2006, ApJ, 636, L45
- Teixeira et al. (2007) Teixeira, P. S., Zapata, L. A., & Lada, C. J. 2007, ApJ, 667, L179
- Wright et al. (2010) Wright, N. J., Drake, J. J., Drew, J. E., & Vink, J. S. 2010, arXiv:1003.2463
- Zinnecker (1984) Zinnecker, H. 1984, MNRAS, 210, 43
| parameter | S Mon | Spokes cluster | Cone(C) | Cone(H) | Halo | Field | BMS starsbbWe choose the model as the best model for BMS stars. |
|---|---|---|---|---|---|---|---|
| f | 0.19 | 0.52 | 0.39 | 0.15 | 0.18 | 0.18 | 0.10 |
| f | 0.54 | 0.34 | 0.42 | 0.52 | 0.53 | 0.58 | 0.85 |
| age (Myr)ccfootnotemark: | 1.63 (120) | 0.35 (78) | 0.76 (82) | 1.75 (58) | 2.02 (102) | 0.96 (14) | 1.41 (19) |
| AV | 0.52 (257) | 5.74 (176) | 0.92 (145) | 0.44 (100) | 0.41 (177) | 0.17 (33) | 1.46 |
| -0.09 (257) | -0.11 (176) | -0.11 (145) | -0.09 (100) | -0.09 (177) | -0.11 (33) | -0.10 (40) | |
| (L⊙) | -0.27 (257) | 0.12 (176) | -0.07 (145) | -0.36 (100) | -0.40 (177) | -0.07 (33) | 0.21 (40) |
| disk | |||||||
| inclination (∘) | 56.6 (257) | 56.6 (176) | 56.6 (145) | 56.6 (100) | 56.6 (177) | 56.6 (33) | 87.1 (40) |
| Md (M⊙) | -4.12 (257) | -3.11 (176) | -3.32 (145) | -4.84 (100) | -4.29 (177) | -3.88 (33) | -2.79 (40) |
| (AU) | 2.26 (257) | 2.04 (176) | 2.19 (145) | 2.40 (100) | 2.37 (177) | 2.11 (33) | 2.36 (40) |
| (Rsub)ddDue to the uncertainty in the age of massive PMS stars, the mass limit used here is m = 0.2 – 1.0 M⊙. | 1.71 (181) | 1.23 (111) | 1.51 (82) | 2.11 (72) | 2.13 (126) | 2.09 (14) | 1.16 (22) |
| (AU) | -0.21 (257) | -0.41 (176) | -0.58 (145) | 0.43 (100) | 0.00 (177) | -0.96 (33) | -0.51 (40) |
| (M yr) | -10.13 (257) | -8.75 (176) | -8.89 (145) | -10.93 (100) | -10.10 (177) | -9.86 (33) | -9.12 (40) |
| scale height factor | 0.82 (257) | 0.82 (176) | 0.80 (145) | 0.85 (100) | 0.82 (177) | 0.78 (33) | 0.78 (40) |
| flaring power | 1.09 (257) | 1.10 (176) | 1.10 (145) | 1.10 (100) | 1.09 (177) | 1.10 (33) | 1.08 (40) |
| disk accetion | -1.79 (257) | -1.92 (176) | -1.80 (145) | -1.91 (100) | -1.86 (177) | -1.79 (33) | -1.76 (40) |
| (at 100AU) | 4.49 (257) | 5.26 (176) | 4.91 (145) | 4.43 (100) | 4.49 (177) | 5.06 (33) | 4.23 (40) |
| envelope | |||||||
| cavity angle () | 37.9 (90) | 27.3 (117) | 28.1 (81) | 34.8 (26) | 38.1 (56) | 30.6 (14) | 49.7 (16) |
| (AU) | 3.13 (90) | 3.31 (117) | 3.21 (81) | 3.15 (26) | 3.10 (56) | 3.08 (14) | 3.38 (16) |
| (Rsub)ddDue to the uncertainty in the age of massive PMS stars, the mass limit used here is m = 0.2 – 1.0 M⊙. | 1.29 (63) | 0.77 (79) | 1.45 (48) | 2.60 (19) | 1.74 (37) | 2.54 (5) | 0.86 (10) |
| Menv (M⊙) | -5.63 (257) | -2.18 (176) | -3.50 (145) | -6.23 (100) | -6.16 (177) | -5.00 (33) | -5.36 (40) |
| (M yr) | -6.48 (90) | -5.79 (117) | -5.92 (81) | -6.08 (26) | -6.48 (56) | -6.87 (14) | -6.90 (16) |
| (g cm-3) | -20.6 (90) | -20.2 (117) | -20.3 (81) | -20.5 (56) | -20.6 (14) | -20.7 (16) | |
| ambient | |||||||
| (g cm-3) | -21.8 (257) | -21.8 (176) | -21.8 (145) | -21.8 (100) | -21.8 (177) | -21.9 (33) | -21.5 (40) |
| -2.70 (257) | 0.10 (176) | -1.70 (145) | -3.03 (100) | -2.97 (177) | -2.30 (33) | 2.19 (40) |
| method | SFR | NstaraaDue to the uncertainty in the age of massive PMS stars, the mass limit used here is m = 0.2 – 1.0 M⊙. | (Myr)aaDue to the uncertainty in the age of massive PMS stars, the mass limit used here is m = 0.2 – 1.0 M⊙. | (Myr)aaDue to the uncertainty in the age of massive PMS stars, the mass limit used here is m = 0.2 – 1.0 M⊙. | (Myr)aaDue to the uncertainty in the age of massive PMS stars, the mass limit used here is m = 0.2 – 1.0 M⊙. | Probability from Kolmogorov-Smirnov Test | ||||
|---|---|---|---|---|---|---|---|---|---|---|
| reference | S Mon | Spokes cluster | Cone(C) | Cone(H) | Halo | |||||
| S Mon | 120 | 1.63 | 0.27 | 3.27 | ||||||
| Spokes cluster | 78 | 0.35 | 0.02 | 2.55 | 1.65 | |||||
| SED | Cone(C) | 82 | 0.76 | 0.04 | 3.16 | 9.54 | 0.148 | |||
| Cone(H) | 58 | 1.75 | 0.40 | 3.13 | 0.858 | 1.04 | 5.97 | |||
| Halo | 102 | 2.02 | 0.32 | 3.73 | 0.066 | 3.40 | 1.99 | 0.281 | ||
| Field | 14 | 0.96 | 0.29 | 3.41 | 0.091 | 6.60 | 0.065 | 0.090 | 0.263 | |
| S Mon | 159 | 3.05 | 1.41 | 6.20 | ||||||
| Spokes cluster | 39 | 2.71 | 0.72 | 6.15 | 0.776 | |||||
| Cone(C) | 74 | 2.64 | 0.69 | 7.54 | 0.140 | 0.786 | ||||
| CMD | Cone(H) | 72 | 3.24 | 1.67 | 8.75 | 0.372 | 0.824 | 0.110 | ||
| Halo | 110 | 3.80 | 1.67 | 7.45 | 4.05 | 0.266 | 1.51 | 0.202 | ||
| Field | 33 | 3.91 | 2.00 | 6.50 | 2.34 | 0.060 | 2.82 | 0.285 | 0.922 | |
| Field nmbb“Field nm” represents the stars in the Field region. They are in the PMS locus of NGC 2264 CMD, but do not show any appreciable H emission or IR excess. And therefore their “age” has meaningless because they are not the member of NGC 2264. But to check the reliability of Kolmogorov-Smirnov test, we estimate the age of these non-members from the position in CMDs. | 307 | 3.66bb“Field nm” represents the stars in the Field region. They are in the PMS locus of NGC 2264 CMD, but do not show any appreciable H emission or IR excess. And therefore their “age” has meaningless because they are not the member of NGC 2264. But to check the reliability of Kolmogorov-Smirnov test, we estimate the age of these non-members from the position in CMDs. | 0.91bb“Field nm” represents the stars in the Field region. They are in the PMS locus of NGC 2264 CMD, but do not show any appreciable H emission or IR excess. And therefore their “age” has meaningless because they are not the member of NGC 2264. But to check the reliability of Kolmogorov-Smirnov test, we estimate the age of these non-members from the position in CMDs. | 10.14bb“Field nm” represents the stars in the Field region. They are in the PMS locus of NGC 2264 CMD, but do not show any appreciable H emission or IR excess. And therefore their “age” has meaningless because they are not the member of NGC 2264. But to check the reliability of Kolmogorov-Smirnov test, we estimate the age of these non-members from the position in CMDs. | 1.04 | 0.117 | 5.88 | 3.05 | 2.54 | |
| Sung et al. (2008) | H or X-ray | 2MASS | YSO Class | |||
|---|---|---|---|---|---|---|
| C3200 | 18.290 | 1.901 | 3.500 | H | 06393962+0940442 | |
| C18770 | 18.669 | 1.977 | 3.636 | H | 06401412+0934091 | |
| C20186 | 18.651 | 2.067 | 3.946 | H | 06401789+0941546 | |
| C21372 | 17.508 | 2.176 | 3.925 | 06402107+0935247 | II | |
| C21459 | 19.205 | 2.462 | H | |||
| C21605 | 18.516 | 2.394 | 4.333 | H | ||
| C22265 | 18.581 | 2.016 | 3.540 | H | 06402354+0948330 | |
| C23335 | 19.023 | 2.085 | 4.037 | H | ||
| C24265 | 19.914 | 2.365 | H | |||
| C24405 | 18.554 | 2.079 | 3.659 | H | 06402937+0941035 | |
| C24851 | 18.011 | 2.184 | 3.926 | H | 06403063+0954365 | II |
| C24999 | 17.224 | 2.096 | 3.840 | H | 06403106+0935401 | |
| C25017 | 17.525 | 2.202 | 4.275 | X+H | 06403110+0949319 | II |
| C28287 | 19.907 | 2.527 | H | 06404043+0911372 | ||
| C28403 | 17.739 | 2.019 | 3.579 | X | 06404078+0934269 | |
| C28559 | 18.685 | 2.438 | 4.326 | X | 06404119+0931287 | |
| C28717 | 17.566 | 2.050 | 3.659 | X+H(Sp) | 06404164+0931431 | |
| C28798 | 19.147 | 2.349 | H(Sp) | |||
| C29818 | 17.606 | 2.439 | 4.452 | X+HC | 06404494+0938497 | |
| C30192 | 17.671 | 2.171 | 3.931 | H(Sp) | 06404610+0947142 | |
| C31370 | 20.197 | 2.311 | H | |||
| C31392 | 17.876 | 2.186 | 4.169 | X+H(Sp) | ||
| C31403 | 17.693 | 2.129 | 3.768 | X | 06405006+0947064 | |
| C31736 | 17.549 | 2.025 | 3.581 | x+H | 06405104+0949061 | |
| C31751 | 18.152 | 1.943 | 3.608 | H | ||
| C31863 | 18.140 | 2.013 | 4.381 | X | 06405139+0945576 | |
| C32294 | 18.829 | 2.116 | 3.741 | HC | 06405300+0947377 | |
| C32976 | 19.323 | 2.407 | X | 06405579+0936061 | II | |
| C33131 | 18.330 | 1.973 | 3.579 | H | 06405641+0934442 | |
| C33215 | 19.098 | 2.323 | H | 06405674+0938101 | ||
| C33403 | 18.285 | 2.481 | 4.557 | x+H | 06405747+0935147 | |
| C33533 | 17.462 | 2.102 | 3.809 | HC | 06405798+1002163 | II |
| C33590 | 17.766 | 2.280 | 4.122 | X+HC | ||
| C33624 | 17.374 | 2.280 | 4.256 | X+H | 06405834+0937567 | II |
| C33627 | 20.070 | 2.409 | H | |||
| C33648 | 16.886 | 2.363 | 4.471 | x | 06405843+0937445 | II |
| C33894 | 17.675 | 2.030 | 3.596 | HC | 06405941+0945516 | II |
| C33920 | 19.328 | 2.207 | H | |||
| C33939 | 17.641 | 2.291 | 4.344 | X+HC | 06405962+0936575 | II |
| C34020 | 19.809 | 2.214 | H | |||
| C34101 | 18.344 | 2.112 | 3.813 | HC | 06410032+0930169 | |
| C34164 | 17.430 | 2.224 | 4.404 | X | ||
| C34674 | 18.456 | 2.569 | X | 06410258+0936156 | ||
| C34695 | 17.415 | 2.104 | 3.774 | X+H(Sp) | 06410266+0950329 | |
| C34875 | 18.497 | 1.995 | 3.571 | HC | 06410350+0935248 | |
| C34965 | 18.900 | 2.124 | 3.820 | X+H | ||
| C34989 | 17.661 | 2.065 | 4.094 | H | 06410389+0919352 | II |
| C35065 | 17.406 | 2.296 | 4.223 | X+H | 06410417+0934572 | |
| C35418 | 17.311 | 2.227 | 4.115 | X+H | 06410579+0931072 | II |
| C35463 | 18.263 | 2.343 | 4.241 | X+H | 06410604+0949232 | |
| C35544 | 20.220 | 2.301 | 4.236 | H | ||
| C35632 | 18.929 | 2.147 | 3.939 | X+HC | 06410696+0935557 | |
| C35763 | 18.311 | 2.216 | 4.994 | X | 06410755+0930004 | |
| C35876 | 17.344 | 2.401 | 4.765 | H | 06410812+0918151 | II |
| C36048 | 17.386 | 2.337 | 4.963 | X | II | |
| C36258 | 19.928 | 2.673 | 4.519 | H | 06411016+0931223 | |
| C36580 | 18.646 | 2.508 | 4.767 | X+H | 06411180+0931123 | |
| C36630 | 18.242 | 2.071 | 4.024 | HC | 06411208+0945281 | II |
| C36702 | 17.151 | 2.199 | 4.069 | 06411242+0913247 | II | |
| C36868 | 17.253 | 2.302 | 06411326+0935473 | II/III | ||
| C36941 | 18.357 | 2.130 | 4.047 | H | 06411365+0955370 | |
| C37325 | 19.955 | 2.548 | H | 06411578+0915357 | ||
| C37393 | 18.666 | 2.111 | 3.929 | HC | 06411613+0938166 | |
| C37601 | 19.449 | 2.178 | 3.953 | HC | ||
| C37602 | 18.017 | 1.958 | 3.523 | H | 06411714+0943378 | |
| C37611 | 18.672 | 1.931 | 3.854 | H | 06411714+0929048 | |
| C37654 | 18.232 | 2.257 | 4.066 | H | 06411736+0931519 | |
| C37667 | 19.301 | 2.621 | X+H | 06411737+0937151 | ||
| C37980 | 18.770 | 2.325 | 4.325 | HC | 06411862+0954074 | |
| C38020 | 19.648 | 2.315 | 4.042 | H | ||
| C38517 | 19.247 | 2.100 | 4.313 | H | ||
| C38598 | 17.402 | 2.076 | 3.762 | X | 06412104+0932417 | |
| C38760 | 18.262 | 1.992 | 3.806 | H | 06412177+1017003 | |
| C39183 | 18.760 | 2.067 | 3.700 | H | ||
| C39897 | 17.970 | 2.047 | 3.780 | H | 06412593+0930260 | |
| C40179 | 18.567 | 1.988 | 3.528 | H | 06412695+0946003 | |
| C42417 | 19.487 | 2.466 | HC | |||
| C43063 | 18.778 | 2.130 | 3.976 | H | 06413618+1010481 | |
| C44891 | 19.875 | 2.333 | H |