Sky subtraction at the Poisson limit with fibre-optic multi-object spectroscopy
Abstract
We report on the limitations of sky subtraction accuracy for long duration fibre-optic multi-object spectroscopy of faint astronomical sources during long duration exposures. We show that while standard sky subtraction techniques yield accuracies consistent with the Poisson noise limit for exposures of 1 hour duration, there are large scale systematic defects that inhibit the sensitivity gains expected on the summation of longer duration exposures. For the AAOmega system at the Anglo-Australian Telescope we identify a limiting systematic sky subtraction accuracy which is reached after integration times of 4-10 hours. We show that these systematic defects can be avoided through the use of the fibre nod-and-shuffle observing mode, but with potential cost in observing efficiency. Finally we demonstrate that these disadvantages can be overcome through the application of a Principle Components Analysis sky subtraction routine. Such an approach minimise systematic residuals across long duration exposures allowing deep integrations.
We apply the PCA approach to over 200 hours of on-sky observations and conclude that for the AAOmega system the residual error in long duration observations falls at a rate proportional to in contrast to the rate expected from theoretical considerations. With this modest rate of decline, the PCA approach represents a more efficient mode of observation than the nod-and-shuffle technique for observations in the sky limited regime with durations of 10-100 hours (even before accounting for the additional signal-to-noise and targeting efficiency losses often associated with the N+S technique).
This conclusion has important implications for the observing strategies of the next generation of fibre-optics redshift surveys with existing facilities as well as design implications for fibre-optic systems destined for new facilities. It argues against the use of the inherently inefficient nod-and-shuffle technique for faint object fibre-optic survey spectroscopy.
keywords:
methods: data analysis, methods: observational, techniques: image processing, instrumentation: spectrographs1 Introduction
High multiplex multi-object spectrographs have been key to many core astronomical investigations since their routine operation began over three decades ago. However, even with the great advances made in our understanding of the Universe via large scale spectroscopic surveys (such as those previously under taken at the AAT with the 2dF instrument: 2dFGRS - Colless (1999), 2QZ - Boyle, Shanks, Croom et al. (2000), WiggleZ - Drinkwater et al. (2009), GAMA - Driver et al. (2009)), or closer to home with stellar surveys (such as the UKST RAVE project - Steinmetz, Zwitter, Siebert et al. (2006)), there remains an ever increasing desire for more powerful survey machines. As astronomy enters the era of the Extremely Large Telescopes (ELT) it is appropriate to pause and assess the techniques and methodologies available to modern instrumentation in order to fully utilise the valuable photons gathered by these gargantuan machines.
In the same vein, older facilities strive to identify new modes of operation. These stalwarts of the past two decades of research must find the best modes of operation to support the ambitions of the new generation of facilities, whose availability will be restricted at best. It is critical that we take time to review the options and identify the roles each instrument must play to maximise the overall return on our significant investments, both material and intellectual.
There are many subtleties to the process of spectrograph design and
that discipline is not considered here (for an introduction see
Hearnshaw (2009)) but the problem of MOS system design is in
essence that of identifying the most expedient reformatting of the
telescope focal plan in order to deliver dispersed light to the
detector system. Historically three methods have been employed,
objective prism surveys, focal plane slit-mask slit-spectroscopy and
fibre-optic systems. In any high multiplex spectroscopic system the
correct mode of observations is governed by a number of competing
survey demands:
Target Multiplex - Maximising the total number of
science targets which can be simultaneously observed.
Signal-to-noise - Minimising the required integration
time to reach a predefined signal-to-noise level within the elements
of each spectrum.
Spectral quality - Minimising the systematic errors
within each spectrum.
Systematic defects can of course be considered as an additional noise source. However while noise associated with a Poisson process, such as the rate of photon arrival at the detector, can be suppressed as the square root of the observation time, systematic defects are typically removed at a slower rate.
In this paper we focus on the use of fibre-optic systems and specifically on an optimal strategy for the accurate subtraction of the OH air-glow lines which plague optical spectroscopy in the wavelength region above 6000Å. Inaccurate subtraction of the OH lines is the dominant source of systematic error in sky limited fibre spectroscopy at the red end of the optical spectrum. There are many discussions of the OH problem in the literature and we refer the reader to the recent review of Ellis & Bland-Hawthorn (2008). In this work we consider the merits of two novel techniques alongside the traditional dedicated sky fibre method. We investigate the use of the nod-and-shuffle mode of observation (Glazebrook & Bland-Hawthorn, 2001) coupled with the use of a high multiplex fibre-optic multi-object spectroscopy system. We also investigate the application of a Principle Components Analysis (PCA) to improve sky subtraction, following the techniques of Kurtz & Mink (2000) and Wild & Hewett (2005) as implemented by Parkinson et al. (in prep.) and outlined in §2.3. We use data sets from the AAOmega facility at the 3.9m Anglo-Australian Telescope (AAT) to demonstrate the results.
2 Observational data sets
The example spectra throughout this work where taken with the the AAOmega spectrograph (Saunders et al. (2004), Sharp et al. (2006)) at the Anglo-Australia Telescope (AAT). The fibre feed from the 2dF robotic positioner to the AAOmega spectrograph uses 1402 m core optical fibre 111Polymicro FBP140168196 - Broadband Polyimide coated 1402 m core, 1682 m, cladding 1963 m buffer. which project to 2 arcsec at the focal plane of the 2dF prime focus corrector.
Observations are shown from the red arm of the dual beam AAOmega system, using the 385R Volume Phase Holographic (VPH) grating. Three data sets from two programs are used for the purposes of illustration. Details are given in Table 1. In the first instance moderate signal spectra from the GAMA project (Driver et al., 2009) are used. Secondly, in order to track long term systematic error trends 200 hours of low signal, essentially sky limited, observations from the WiggleZ dark energy project (Drinkwater et al., 2009) are used. Finally to demonstrate the nod-and-shuffle technique, a series of deep N+S frames, taken as part of the completeness estimation process for the WiggleZ project, are used. Data were taken using both the 5700Å and 6700Å dichroic beam splitters. Example spectra are shown in units of CCD counts converted to electrons via the measured gain parameter.
2.1 Data processing
The data used in the following analysis has been processed using the
2dfdr data analysis package. All data was processed using
the standard settings for low resolution extra-galactic data. Sky
subtraction has been performed using three techniques.
Dedicated sky fibres - Twenty-five fibres where
allocated to known blank sky positions. The spectra from these fibres
are median combined to create a master sky spectrum. This master sky
spectrum is then scaled for subtraction from each science spectrum
using the OH lines.
Nod-and-shuffle (N+S) - Observations where performed in
this mode (Glazebrook & Bland-Hawthorn, 2001) using a pair of fibres allocated to
each science target (Cross Beam Switching, CBS). These observation
are processed in a manner similar to standard AAOmega data with the
exception that sky subtraction is achieved by direct subtraction of
the raw CCD pixel intensities for the A and B telescope nod positions
prior to spectral extraction.
Principle components analysis (PCA) - The final method
used has been to perform the standard dedicated sky fibres
reduction but once complete the data was processed using the a
Principle Components Analysis sky subtraction routine as implemented
for the GAMA survey by Parkinson et al. (in prep.).
The sky spectrum recorded during each integration is used as the normalisation when considering the residual sky subtraction error in any given data set.
2.2 Overview of nod-and-shuffle
The nod-and-shuffle technique has been shown to provide Poisson limited performance in slit spectroscopy (Glazebrook & Bland-Hawthorn, 2001) with perhaps the best known example of the results achievable being the deep spectroscopy of high redshift early-type galaxies from the Gemini Deep Deep Survey (Abraham et al., 2004). A nod-and-shuffle observing mode for fibre-optic MOS had been provided with the 2dF system at the AAT but the significant practical inefficiencies of the implementation hampered observations. However, the AAOmega spectrograph was commissioned with 200 and 400 fibre nod-and-shuffle modes readily available.
For nod-and-shuffle observations, the telescope is nodded back-and-forth between the target and adjacent blank sky at a frequency of 0.5-2 Hz. During the the telescope nod the charge accumulated on the CCD is transferred without loss (shuffled) to a storage area and a second region of the CCD is exposed to the sky flux now illuminating the fibre. This process is repeated a number of times before the CCD is readout. This mode allows quasi-simultaneous observations of source and sky, through an identical light path. Allocating a pair of fibre to each source and nodding the source between each fibre in the pair mitigates the implicit 50% on-source duty cycle at the expense of target multiplex.
As will be seen below fibre-optic nod-and-shuffle performs well. However, as well as significant practical inefficiencies such as telescope slew-and-settle time and reduction in target multiplex the nod-and-shuffle technique also introduces a significant reduction in the signal-to-noise ratio achieved, with respect to the dedicated sky fibre approach, for a finite observing time (see §2).
2.3 Overview of Parkinson et al. PCA implementation
The use of a PCA approach for sky subtraction was first demonstrated by Kurtz & Mink (2000), although for that first implementation classical long-slit spectroscopic data was used to simulate the performance of the procedure. The first true test of the PCA approach with fibre spectroscopy was reported by Wild & Hewett (2005) using data from SDSS. However, Wild & Hewett (2005) focused on cleaning up relatively shallow spectroscopy. A goal of many fibre MOS projects has been to achieve more sensitive observations. Indeed, the WiggleZ Dark Energy survey (Drinkwater et al., 2009) utilized a modified version of the (Wild & Hewett, 2005) PCA code to aid in the identification of faint (r(AB)22.5) emission-line galaxies whos characteristic emission lines are otherwise lost in the dense OH-forest at wavelengths beyond 7000Å.
While early implementations have been successful, the PCA sky
subtraction technique has seen little use over the past decade. There
are numerous underlying reasons for this lack of interest in a
potentially powerful technique:
- Much early work was undertaken at relatively blue
wavelengths where the OH sky-line forest is spares and lines are of
only moderate intensity. With the advent of modern large format CCD
system which retain high quantum efficiency out to 1 m and
beyond an important new spectroscopic window is opening up to fibre
spectroscopy.
- Slit systems report excellent results from accurate
slit mapping in 2D, so the technique has not been required for
long-slit or slit-mask spectroscopy systems222However,
systematics do remain, even after correction with a suitable slit
function (commonly due to flexure in the spectrograph). A detailed
measurement with long duration observations has not been performed..
While this will remain true in the coming decade, there is no shortage
of current or planned fibre MOS systems, largely due to the relative
ease of implementation for fibre MOS systems accessing large fields of
view.
- Relatively bright targets have traditionally been
observed with fibre based MOS systems. This is in part due to the
historically somewhat marginal results that have been achieved on
fainter sources due to poor control of systematic spectral defects in
long duration exposures. It is these defects that the PCA process
addresses.
- Most fibre MOS systems report residual error estimates close to the Poisson residuals expected for routine observations and so there has been little need for improvement. We demonstrate that the application of the PCA approach will allow significantly more difficult observations to become routine.
The approach to PCA sky subtraction implemented for the AAOmega system
at the AAT varies from the previous works and is described in detail
in Parkinson et al. (in prep.). The implementation used in this work was a
standalone processing script which ran on the reduced data products
from the 2dfdr data reduction pipeline. The process has now
been incorporated into a pipeline processing option within the body of
the reduction code. A brief overview is given here:
- Each target field is observed with 400
science fibres. Of these, 20-25 are allocated to blank sky positions
across the field to provide night sky spectra free from astronomical
sources.
- The data are processed in the usual manner using
the 2dfdr data reduction software. To perform a first order
sky subtraction a master sky spectrum is created from a median
combination of the dedicated blank sky spectra. This spectrum is then
scaled and subtracted from each science frame using the median flux in
strong OH night sky lines to determine the required scaling.
- Each valid spectrum (i.e. source and sky fibres
are used, but bright calibration sources and unused fibres are
discarded) is then continuum subtracted using a rolling median filter
to remove large scale source structure.
- A set of eigen vector spectra is calculated using a
Principle Components Analysis for the 400 sky subtracted
spectra.
- Each science spectrum is then sky subtracted using
a linear sum of the thirty most significant principle components.
The main departures of the GAMA project PCA implementation of
Parkinson et al. (in prep.) from that of Wild & Hewett (2005) for data from SDSS
are:
- The eigen vectors and values are generated on a
frame-by-frame basis, rather than from a large data base of spectra.
This addresses many of the major sources of poor sky subtraction
residuals (A.1.1).
- Object and sky spectra are used to generate the
components. This clearly breaks down if numerous objects have very
strong structure at common wavelengths (e.g. M-star contamination of
a galaxy survey) or if many similar objects are found within a given
frame (i.e. during galactic survey work).
- Spectral features are not masked since they are not
know a priori. Indeed, enhancing the detectability of such
features within a strong foreground signal is the goal of this work.
- With only 400 input spectra for each frame, only a small number of eigenspectra can be use to perform the sky subtraction. In the work present here thirty components have been used. This number was selected for initial investigations as reported here by inspection of the resulting spectra. A full investigation of the methodologies for parametrisation the eigenvector space from which components are drawn is underway.
2.3.1 Continuum concerns
Sky and source continuum presents a problem. In principle the residual sky continuum should represent a separate set of distinct components in the eigenvector set produced by the PCA algorithm. In practise however, the residual OH and continuum signals and the source spectrum do not represent orthogonal basis sets and so intermixing between source spectral components in such data is inevitable. It will then not be possible to adequately represent any individual sky subtraction residual pattern using a reconstruction from a limited set of these eigenvectors.
Kurtz & Mink (2000) deal with the problem via a two stage fitting process which has the unfortunate side effect of invalidating the spectrum for measurements of the continuum properties. Wild & Hewett (2005) rely on the fact that each SDSS spectrum has had a preliminary sky subtraction to remove sky continuum components prior to their correction for OH line residual via the PCA. Object continuum is removed via median filtering each spectrum in wavelength. In this regard our approach is identical to that of Wild & Hewett (2005).
Ultimately it may be possible to assess the selection of eigenvectors and weighting based on those that preferentially contribute to residual correction in the blank-sky fibres spectra (perhaps requiring an increased number of dedicated sky spectra per observation). We have yet to investigated this aspect of problem. In short, we expect our approach to provide a reliable result for low intensity source spectra taken on moonless nights (so that the first order sky correction is adequate). The primary interest should be focused on the red end of the spectrum where the error budget is dominated by OH subtraction errors and the source distribution should be such that individual spectra have little in common in the observed frame. A small number of high signal, or repetitive spectra (such as calibration stars) should be clipped from the generation of the initial eigenvector set.
For work in which absolute spectral fidelity at the highest level is of paramount importance at the expense of significant survey efficiently - not typically the primary motivation in work such as a wide area galaxy redshift survey - one may require the nod-and-shuffle technique.
2.4 Sky subtraction accuracy
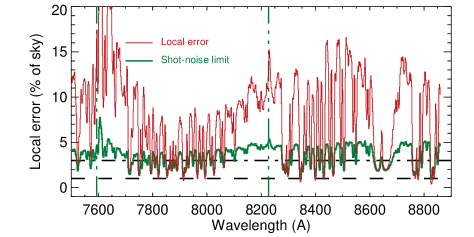
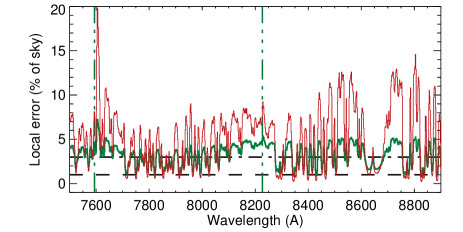
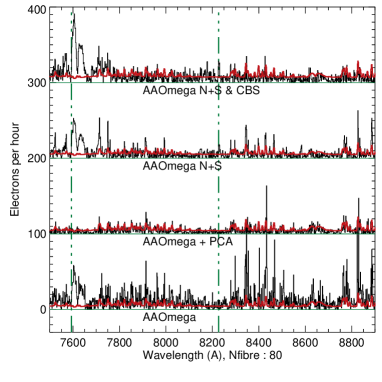
Example sky spectra as observed by the red arm of the AAOmega spectrograph are given in Fig. 1. Two horizontal levels are marked. These indicate the residual Poisson error, expressed as a fraction of the local sky spectrum, which would be expected under the assumption of pure Poisson noise in the spectrum of a 1 hour sky observation. The majority of the spectral region considered here is limited to a residual noise level between 1-3% of the sky signal in each spectral pixel.
We require a metric with which to determine the sky subtraction accuracy achieved in any given observational data set. The figure of merit we use is the local error which we estimate as follows.
A smoothed spectrum is constructed using a sliding square filter (with smoothing length of 100 pixels) and computing a 5- clipped mean at each pixel. For each pixel the rms intensity within the smoothing window is taken as an estimate of the local sky subtraction accuracy.
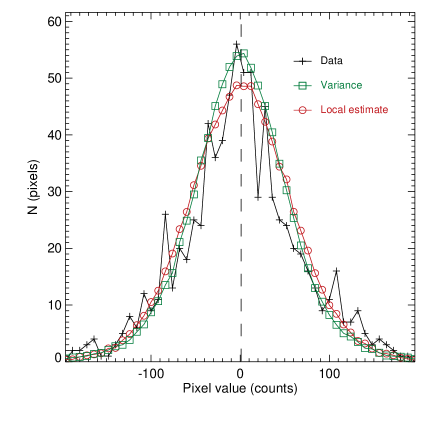
To confirm the validity of this error estimator a number of
simulations are undertaken. Random realisation of noise spectra are
generated with pixel intensities drawn from two distributions. The
first is a Normal distribution with width set to that indicated by the
variance array information which is generated for each spectral pixel
during data reduction. A second realisation is generated from a
normal distribution with width set by the local error estimate
defined above. A thousand random realisation of each distributions
are generated for each spectral pixel and binned histograms of these
model pixel intensities are compared to the pixel intensities for the
observational spectra after subtraction of the smoothed spectrum.
Inspection of the these residual error histograms indicates
- The variance estimates from the data reduction process are
an accurate description of the true noise properties of the data, with
perhaps some small evidence for departure (likely due to small errors
in the gain and CCD read-noise, Nrd, estimation).
- The local error estimator reliably reproduces the distribution of observed pixel indensities and hence is a valid representation of the residual scatter in the data.
3 Example spectra
Sky subtraction accuracy is estimated for the experimental data sets detailed in §2 using the three subtraction methods presented in §2.4. The results are given in Table 2. The individual data sets are discussed below.
3.1 GAMA survey - moderate source intensity data
Observations from the GAMA project (Driver et al., 2009; Baldry et al., 2009) are shown in Fig. 2. The source presented has reported SDSS magnitudes of (AB)=19.17 and is found to be at redshifts of =0.276. The spectrum is composed of 31200 sec integrations, and was processed with the use of 24 dedicated sky fibres to provide the master sky spectrum for subtraction. This master sky spectrum is shown scaled to 10% for comparision. While the sky subtraction does not hamper the identification of redshift for the source, there are systematic residuals in the data.
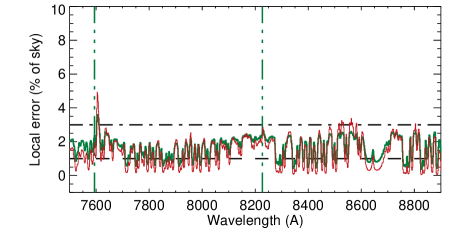
The lower panel in Fig. 2 shows the local error estimate as defined in § 2.4. The local error varies between close to the Poisson noise limit and over 10% of the local sky spectrum with an rms 4.670.6 over the full spectrum.
In the absence of a Poisson component from the target source continuum, the local error estimate is consistent with the variance estimation derived from the pixel intensities during data reduction.
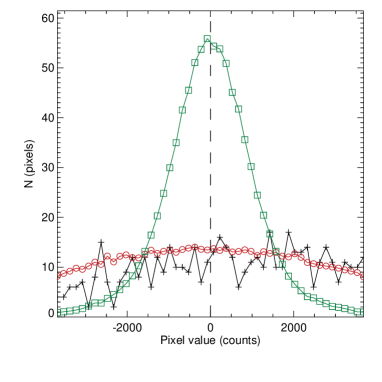
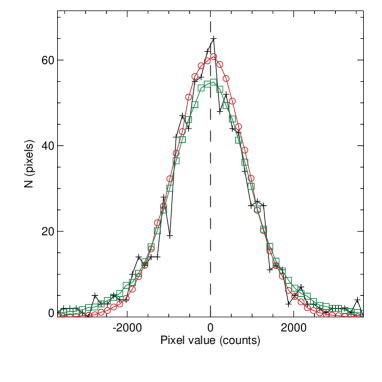
The residual error histogram for the spectrum is shown in Fig. 3, confirming that the local error estimate is consistent with the residual error in the source spectra which is in turn broadly consistent with the spectral error expected from the data reduction pixel variance.
3.2 WiggleZ data - sky limited data
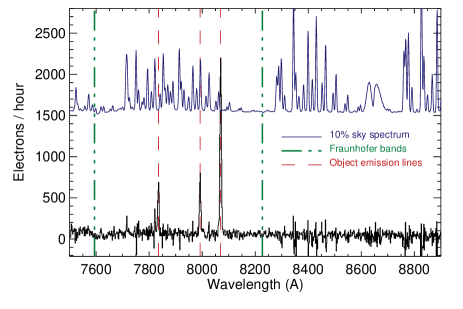
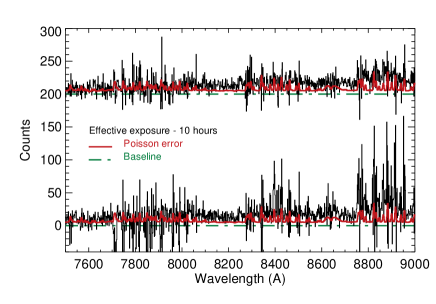
Data from the WiggleZ survey (Drinkwater et al., 2009) is in a different regime from that of the GAMA survey. Since WiggleZ sources are 20 (AB) 22.5 high equivalent width [O ii] emission line sources there is little source continuum to introduce increased noise to the error statistic. Fig. 4 shows such a WiggleZ survey source. The local error is close to the sky limited case (i.e. the limit expected from the pixel intensity variance estimates).
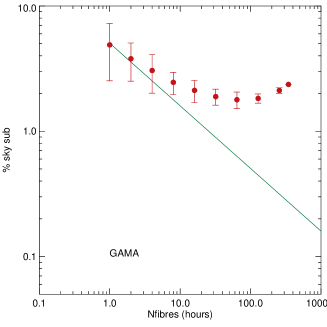
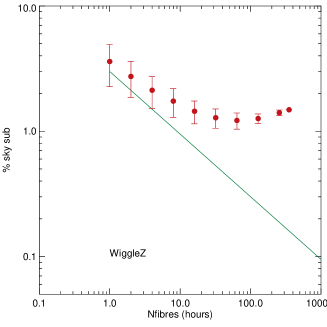
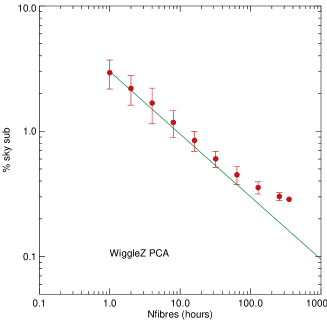
Since WiggleZ spectra are largely free of continuum a stacking analysis of the all 352 science fibre spectra in this frame should produce an improvement in the local error estimate which scales as for the number of fibres stacked. A clear departure from this scaling is seen in the upper panel of Fig. 5. This failure to follow the suppression is the result of systematic errors in the sky subtraction.
On applying the PCA correction to the sky subtracted spectra and repeating the stacking analysis the local error estimate is seen to improve markedly. This control of the build-up of systematic error is easily seen in the residual error histogram of Fig. 6. Without the PCA correction the local error estimator is clearly very different from the expected error distribution (based on pixel variance estimates from data reduction). With the application of the PCA correction prior to stacking, the local error estimator and variance data are largely in agreement.
3.3 WiggleZ Deep - Nod-and-Shuffle data
To compare the previous results to observations taken with the nod-and-shuffle observing technique we use deep observations taken, for quality control purposes, as part of the WiggleZ project. A 6 hour on source observation is available comprising three observations (taken over three nights) of 32400 sec. The data was observed in the Cross-Beam-Switching (CBS) mode with a pair of fibres allocated to each target. The observations where taken in the conventional AAOmega N+S mode with half of the available science fibres masked in order to provide the requisite CCD storage space (rather than the recently implemented mini-shuffling mode discussed later and in Sharp (2009)) .
A representative spectrum for a typical source ((AB)=22.26, =0.851) is presented in Fig. 7. The local error estimator indicates that the observations are indeed close to the Poisson noise limit expected for the N+S observing process.
4 Stability with long duration exposures
Observations of faint sources require long duration exposures to build up the required signal-to-noise ratio within each spectrum. In the limit of pure Poisson-noise in the photon arrival rate, signal-to-noise is expected to build as the square-root of the observation time. However, systematic defects in the spectrum, most commonly from systematic failure of the sky subtraction, will reduce the efficiency of this accrual of signal-to-noise. The common causes of these systematic defects in fibre spectroscopy are considered in appendix A.1.1. Determining the point at which each sky subtraction methodology becomes limited by systematic defects is key to selecting the most efficient observational strategy to achieve ones goals.
In the absence of an ideal data set we mimic long duration exposures using two methods. First we consider the effects of stacking fibre spectra from within a single MOS frame. Secondly we investigate stacking individual fibres from across multiple independent observations. The former is not ideal as there may be strong correlated noise patterns between fibres in a single frame which would average out over many frames. The later is difficult in practise as a suitable data set, which places a single fibre on blank sky across many independent observing frames, is not usually available.
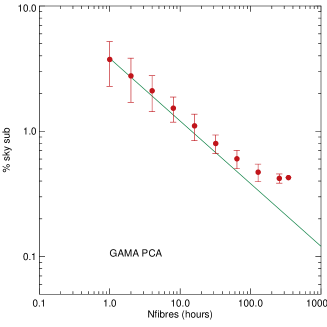
The residual error as a function of time for a single frame stacking process are shown in Fig. 8. Single frames from the GAMA, WiggleZ and WiggleZ N+S data sets presented previously are used. Additionally, in order to construct a single fibre multi-frame stack we use the properties of the WiggleZ survey data to construct a stack of 200 individual fibre spectra from data taken throughout 2009 (Fig. 9). In each case stacked spectra are created with a range of values of N, the number of fibres used. For each value of N, 100 random realisations of the stacked spectrum are created and the local error and its rms scatter are plotted against the number of spectra used in the stack. Each stack of N fibres simulates an exposure of N hours on blank sky. The rate of reduction in residual error with time is then compared to the rate of decline expected from pure Poisson statistics.
It is clear from Fig. 8 that for both the data sets which use purely the dedicated sky fibre subtraction, a systematic noise floor is reach after 10 hours. With the application of the PCA procedure to the data prior to stacking there is no indication of this systematic noise floor until one reaches 100 hours of simulated observation.
The N+S observations show little evidence for a noise floor at the limits of the available exposure time, however the residual error appears to decline at a rate slower than the Poisson limit, rather the rate of decline estimated from the data set is N-0.38.
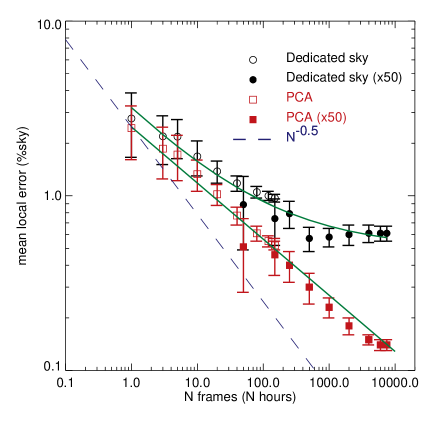
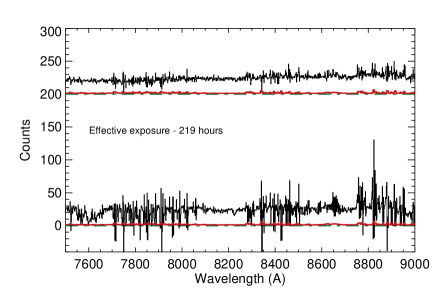
To investigate the decline rate further we perform a single fibre stacking across all 219 observations available from the 2009 WiggleZ project observing program at the AAT. The results of this long duration exposure stacking are shown in Fig. 9. No explicit data quality control has been performed (although only data accepted for use in the survey has been used) and a month-to-month re-binning of the data was require to place data on a common wavelength scale. Local error estimates are shown for random realisations of the stacked data as before. Stacks are created for the data both with and without the PCA sky subtraction. In order to extend the experiment beyond the 219 hours of data available using a single fibre from each observational frame we also repeat the experiment using 50 fibres from each frame, which pushes the effective exposure time to beyond 10,000 hours.
It is clear that the dedicated sky fibre only sky subtraction again reaches a noise floor beyond which sky subtraction is not improved. This occurs at a greater time than for the single frame experiment in Fig. 8 likely due to the presence of stronger correlated errors when using data from a single science frame. The stacked data which has been processed with the PCA procedure continues to show the steady decline in local residual error with no compelling evidence for a systematic noise floor. The rate of decline in the local error is however not N-0.5 as would be expected from purely Poisson noise considerations, but rather N-0.32, closer to the cubed root of exposure time. There is of course a small contribution to the Poisson noise from the intrinsic source flux in each spectrum which, while small and randomised over redshift in this experiment, is none zero. No comparable duration sky-only data set is available with which to avoid this contribution at this time.
4.1 Comparison with N+S survey observations
The long duration experimental results from Fig. 9 indicate that the PCA sky subtraction process applied to dedicated sky fibres observational data produces excellent results. We now ask how these results compare to those obtained with the N+S process. As stated previously, the N+S process requires longer individual integrations to reach a common signal-to-noise level in the data. If single fibres are allocated to each science target, the N+S observing procedure requires 4 the integration to reach the same signal-to-noise level as a dedicated sky fibre observation (due to the 50% duty cycle on source while still retaining the full 100% of the noise budget from the sky spectrum in both the A and B components of the nod observation). If a pair of fibres is allocated to each target and cross-beam-switching (CBS) is used, then this becomes only 2 in exposure time. We shall for the moment ignore the reduce targeting efficiency implied by allocating two spectroscopic fibres to each target.
Since N+S observations require this extend observation time with respect to the dedicated sky fibre observations, we should therefore compare the local residual error estimate of the N+S observation with a dedicated sky fibre and PCA sky subtraction observation of the equivalent overall exposure time, in order to determine the optimal observation strategy. This comparison is made in Fig. 10.
For short duration exposures, the local error estimate for dedicated sky fibre data and for N+S data is comparable, and consistent with the Poisson limit (as demonstrated in Figs. 2-7). For the PCA processed observation, we assume the rate of reduction in local error estimated from Fig. 9. For the N+S data, we apply the 4 (2 if using CBS fibre pairs at the expense of raw target numbers per observation) increase in exposure time to two rates of reduction in the residual error. Firstly we use the theoretical value of N-0.5, secondly we use the slower rate of N-0.38 observed in Fig. 8. We wish to find the exposure time at which the local error is lower with increasing exposure time when using the N+S observation strategy333Clearly if the true rate of error reduction for N+S observations is identical to that of the PCA observations, N-0.32, this situation is never achieved.. These values can be calculated from the assumed gradients as shown in Fig. 10 and are found to be 47 hours (6502 hours) without the CBS fibre pairs assuming the -0.5 (and -0.38) power of decline and 7 hours (81 hours) if CBS fibre pairs are used.
5 Visual comparison of spectral quality
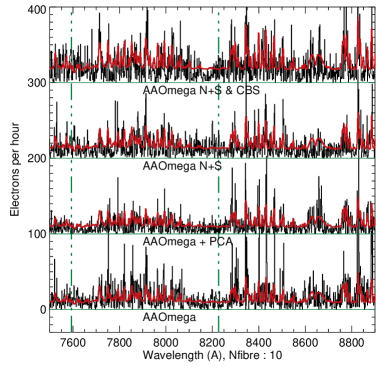
To illustrate the spectral quality of the various sky subtraction methodologies we present the composite spectra, from the stacking analysis using each of the processing methodologyies, in Fig. 11. The indicated number of spectra are combined (using a clipped mean) after subtracting a smooth continuum from each. The modulus of the residual spectrum is shown in each case, overlayed with the error array derived from the pixel variance estimates during data reduction. In each case four data sets are shown. In the lower spectrum we see the 3x1200 sec observation using the dedicated sky fibres method. The second spectrum is the same frame but with the PCA process applied to the data prior to stacking. The third and forth spectra are the N+S observations, the third does not implement CBS fibre pairs while the upper spectrum does. The N+S frame was composed of 32400 sec observations and so the CBS frame contains 2 hours on source data, while the the other contains only 1 hour.
For the dedicated sky fibre observations the residual error is significantly in excess of that expected from the data reduction process and increasingly so as more spectra are combined (in agreement with Fig. 9). The N+S data is broadly consistent with the variance estimation but as is expected the level of this residual error is higher due to the increased sky component of the N+S observations. The frame processed with the PCA sky subtraction is visually by far the cleanest spectrum, supporting our previous analysis. It gives the greatest signal-to-noise data with the lowest sky residual for the shortest on sky integration time. Furthermore it has considerably smaller observational overheads in comparison to the N+S observations and maximises the fibre multiplex since there is no need for cross-beam-switching.
An alternative assessment of the data quality is presented in Fig. 12. Here we create stacked spectra from the 219 WiggleZ observations from 2009. In each case the spectrum is presented with and without the PCA sky subtraction. Insufficient N+S observations are available to generate the comparison spectrum at this time. The suppression of systematic residuals in the spectra is clearly visible in the PCA processed data. No continuum subtraction was applied to the fibres in Fig. 12 and so the weak source continuum from the high equivalent width emission line targets of the WiggleZ survey is visible in the averaged spectrum.
6 Quantitative survey analysis
The most apparent benefit of the PCA analysis to the user, for faint-object spectroscopy, is the reduction in systematic cosmetic defects. In order to provide a quantitative assessment of the improvement a detailed simulation has been undertaken. AAOmega survey data was selected from six clear dark nights from the September 2008 observing campaign for the WiggleZ project. This provided 851200 sec science frames. As discussed previously, WiggleZ targets are primarily high equivalent width faint ((AB)22) emission-line sources hence each of the 354 science fibres largely represents blank sky observation. Additionally, each date frame contains 25 fibre allocated to preselected blank sky positions which are free from the low level Poisson noise contribution from the faint continuum still present in fibres allocated to WiggleZ science targets. In what follows the blank sky fibre provide the idealised test data set while the science fibres observations are used to provide a larger sample size.
Each CCD frame was processed using the 2dfdr software environment and the standard data reduction recipes. For each individual reduced data frames (1200 sec integration) a synthetic spectrum was generated from a template early type galaxy. The galaxy template used was the intermediate age early type spectrum from the GDDS survey (Abraham et al., 2004). The galaxies where distributed in redshift between 0.7z1.3 which is the limit imposed by the rest frame spectral data matched to the observed spectral range. This redshift range see the Calcium H+K absorption lines and the Balmer break transit the strongest OH sky-line regions in the red AAOmega spectrum. Spectra where generated for a series of source intensities scaled to match count rates equivalent to apparent (Vega)=20-24, with the appropriate target Poisson noise included.
The PCA sky subtraction was then applied to each reduced science frame and image stacks where created at each simulated magnitude level with and without the PCA correction. A redshift analysis was undertaken with the fully automated mode of the runz cross-correlation code typically used with data from the 2dF/AAOmega system. The fully automated analysis was chosen in preference to the more typical semi-interactive methods more common to faint object programs undertaken with AAOmega (e.g. Wake et al. (2006); Ross et al. (2006)) to avoid subjective results. For this idealised test case, only a single cross correlation template was used, the same spectrum used in the generation of the mock data. The prior for the redshift distribution was match to that of the mock test data input range.
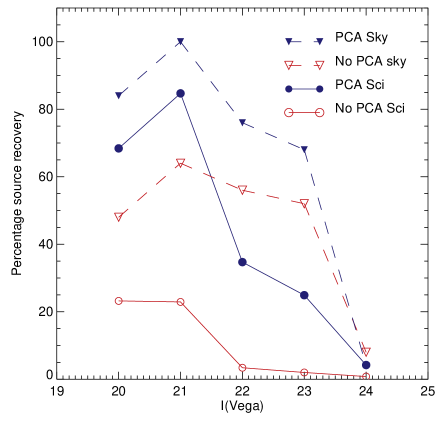
The redshift analysis results are shown in Fig. 13. The upper panel indicates the measured redshift returned by RUNZ as a function of input model redshift for the (Vega)=21 simulated data set for the full 11.3 hour (85 frame). With the PCA processed data we recover the correct redshift for 85% of simulated sources. The misidentified spectra are preferentially at the highest redshifts, where the -band normalisation results in the lowest signal-to-noise ratio spectra. In the absence of the PCA sky correction, the success rate is reduced to 25% with a number of distinct failure modes clearly present.
A comparison of the model spectra derived from blank sky fibre spectra rather than those containing WiggleZ science targets demonstrates that the residual noise contribution from the faint WiggleZ targets present in the science spectra used for this analysis does contribute a reduced efficiency for the test and will therefore contribute to the slope measured for the sky error reduction rate seen in Fig. 9.
The lower panel of Fig. 13 shows the declining recovery rate for fainter model spectra. At fainter input magnitudes, the fully automated RUNZ code, which was not specifically tuned for such a regime, does remarkably well even at =23. With the planed upgrade of the red arm of AAOmega to a new generation high-resistivity CCD (boosting quantum efficiency in the range 800nm-1m by a factor of four) it will be possible for AAOmega to continue to conduct efficent wide field surveys for early type galaxies (Cannon, Drinkwater, Eisenstien et al., 2006) out to at redshift z1.
7 Conclusion
We have demonstrated that the use of a Principle Components Analysis sky subtraction with dedicated sky fibres observations in a manner similar to that prescribed by Kurtz & Mink (2000) and Wild & Hewett (2005) (and subsequently implemented for the GAMA survey by Parkinson et al. (in prep.)), provides excellent quality astronomical spectra over long duration exposures. For moderate length exposures (10-100 hours on source) the spectral quality is comparable to that obtained using the N+S observational technique, and likely for significantly longer exposures. We therefore conclude that for fibre based multi-object spectroscopy, in instances were high multiplex and observing efficiency are critical, the PCA approach is superior to nod-and-shuffle based techniques for moderate signal-to-noise extragalactic survey spectroscopy.
Acknowledgments
We wish to thank Scott Croom, Will Saunders and Karl Glazebrook for invaluable discussion regarding the concepts discussed throughout this work. This investigation would not have been possible without the hard work and dedication of the staff at the Anglo-Australia Observatory, who designed, constructed, operate and maintain the AAT and 2dF/AAOmega system with which the observations presented in this paper where undertaken.
References
- Abraham et al. (2004) Abraham, R.G., Glazebrook, K., McCarthy, P.J., Crampton, D., Murowinski, R., Jørgensen, I.; Roth, K.; Hook, I.M., et al., 2004, AJ, 127, 2455
- Bolton & Burles (2007) Bolton, A.S., & Burles, S., 2007, New Journal of Physics, Vol.9, Iss.12, 443
- Bolton & Schlegel (2010) Bolton, A.S., & Schlegel, D.J., 2010, PASP, 122, 248
- Boyle, Shanks, Croom et al. (2000) Boyle, B.J., Shanks, T., Croom, S.M., Smith, R.J., Miller, L., Loaring, N., Heymans, C., MNRAS, 2000, 317, 1014
- Cannon, Drinkwater, Eisenstien et al. (2006) Cannon, R., Drinkwater, M., Edge, A., Eisenstein, D., Nichol, R., Outram, P., Pimbblet, K., de Propris, R., Roseboom, I., Wake, D. et al., 2006, MNRAS, 372, 425
- Colless (1999) Colless, M.M., 1999, Phil.Trans.Roy.Soc.Lond.A, 357, 105
- Cuillandre et al. (1994) Cuillandre, J.C., Fort, B., Picat, J.P., Soucail, J.P., Altieri, B., Beigbeder, F., Duplin, J.P., Pourthie, T., Ratier, G., 1994, A&A, 281, 603
- Drinkwater et al. (2009) Drinkwater, M., et al., in prep.
- Driver et al. (2009) Driver, S.P., Norberg, P., Baldry, I.K., et al., 2009, A&G, 50e, 12
- Baldry et al. (2009) Baldry, I.K., Robotham, A.S.G., Hill, D.T. MNRAS submitted (arXiv:0910.5120B)
- Ellis & Bland-Hawthorn (2008) Ellis, S.C., & Bland-Hawthorn, J. 2008, MNRAS, 386, 47
- Glazebrook & Bland-Hawthorn (2001) Glazebrook, K.,& Bland-Hawthorn, J., 2001, PASP, 113, 197
- Hill (1988) Hill, J.M., 1988 ASPC, 3, 77
- Hearnshaw (2009) Hearnshaw, J., 2009, Astronomical Spectrographs and their History, Cambridge University Press, ISBN 978-0-521-88257-6
- Kurtz & Mink (2000) Kurtz, M.J., & Mink, D.J., ApJL, 2000, 533 L183
- Parkinson et al. (in prep.) Parkinson H. in prep.
- Ross et al. (2006) Ross, N.P., Shanks, T., Cannon, R.D., Wake, D.A., Sharp, R.G., Croom, S.M., Peacock, J.A., 2008, MNRAS, 387, 1323
- Saunders et al. (2004) Saunders, et al., 2004, SPIE, 5492, 389
- Steinmetz, Zwitter, Siebert et al. (2006) Steinmetz, M., Zwitter, T., Siebert, A., Watson, F.G, Freeman, K.C., Munari, U., Campbell, R., Williams, M., et al., 2006, AJ, 132, 1645
- Sharp (2009) Sharp, R., 2009, AAOnewsletter, 116, 10
- Sharp et al. (2006) Sharp, R., et al., 2006, SPIE, 6269E, 14
- Sharp & Birchall (2010) Sharp, R.G., & Birchall, M.N., 2010, PASA, 27(1), 91
- Wake et al. (2006) Wake, D.A., et al., 2006, MNRAS, 372, 537
- Wild & Hewett (2005) Wild, V., & Hewett, P., 2005, MNRAS, 358,
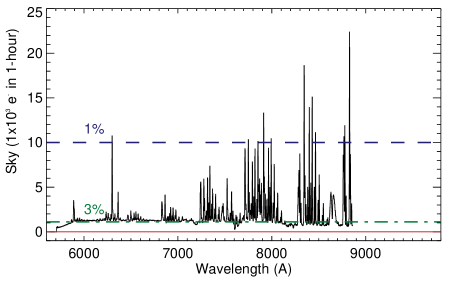
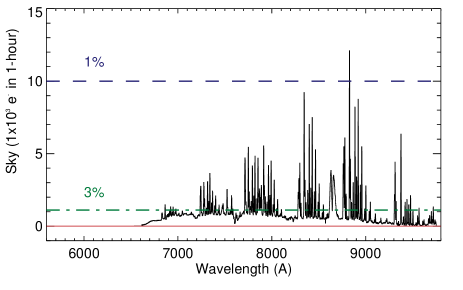
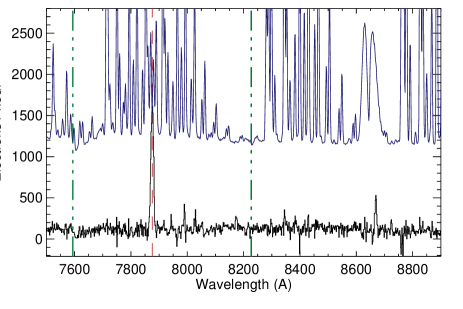
Upper panels – The 5700Å and 6700Å dichroic beam-splitters have been used with the 385R VPH diffraction grating to cover the wavelength range 6000Å 9800Å. The strong OH air-glow lines and the unresolved emission band of O2 are evident. The spectra are gain and exposures time corrected to units of electrons per hour. They are not flux calibrated and so line relative intensities are subject to the instrument response functions. Horizontal lines marks the 1% & 3% sky subtraction accuracy limits from Poisson noise.
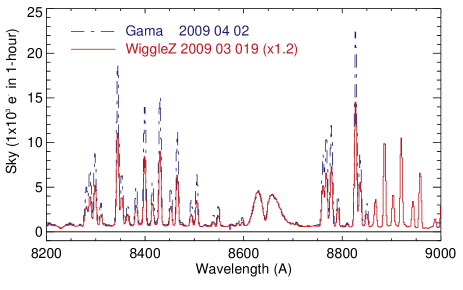
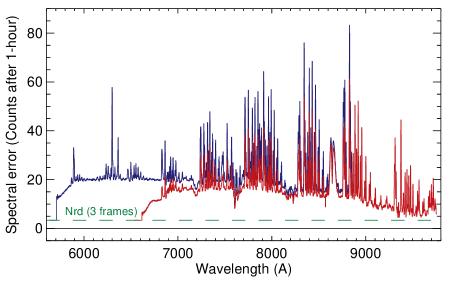
Lower panels – Left) The overlap region of the two sky spectra are compared. The data were taken two weeks apart and a significant variation in the OH sky-line scaling is evident. The WiggleZ survey spectrum has been scaled by a factor of 1.2 to match the O2 band, but the relative intensity of the OH lines remains higher in the April data. Right) The estimated residual error levels (1- assuming purely Poisson noise dominated by the sky emission level) for the two sky spectra are also shown, along with the expected contribution from CCD readout noise assuming three independent 1200 sec exposures.
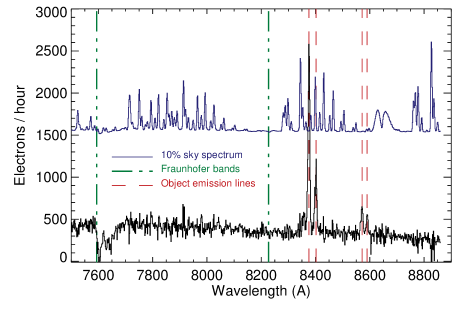
The upper spectrum is composed of 31200 sec exposures of 1 hour on source using 24 dedicated sky fibres to construct the master sky spectrum used for sky subtraction. The emission line source shown (H/[Nii]/[Sii]) is at a redshift of z=0.276. The source catalogue magnitude is r(AB)=19.17. The plotting range is chosen to show regions of strong atmospheric OH and O2 emission, sky line free continuum regions and two Fraunhofer telluric absorption bands.
The lower plot shows the local error in the spectrum, estimated as discribed in § 2.4. The error is presented as a percentage of the local sky spectrum at each wavelength. The Poisson limit determined from pixel varaince array during data reduciton is indicted by the thick line. The Poisson limit is approached in the vicinity of the strong emission lines. Between the emission features, the residual is dominated by Poisson noise from the source spectrum.
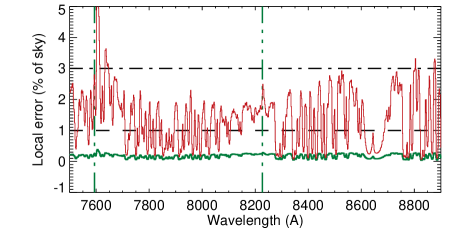
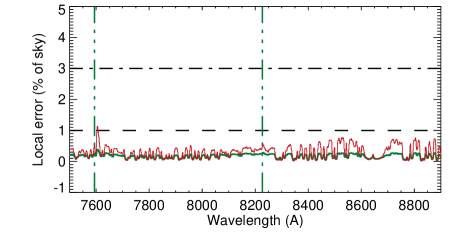
In the lower panel the stacking process is repeated after applying the PCA correction to the data. The local error is largely indistinguisable from the Poisson error in this vissual representation. The associated residual error histograms (§ 2.4) are given in Fig. 6.
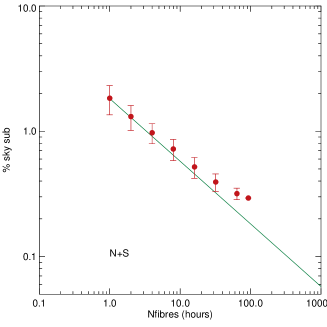
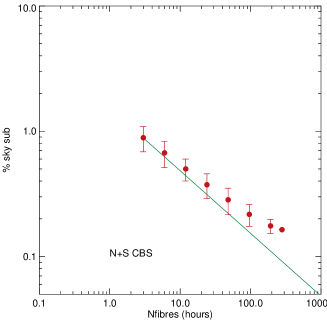
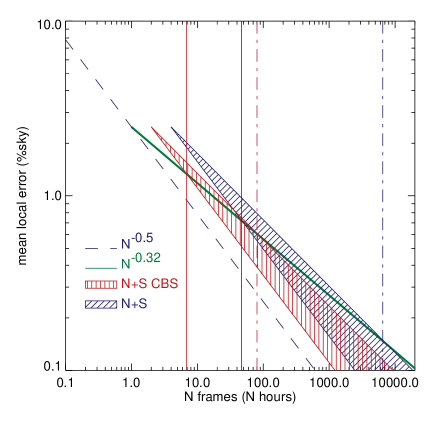
The cross-over points indicated are 47 hours (6502 hours) for No CBS with the slope of N-0.5 (N-0.38). This becomes 7 hours (81 hours) if CBS is implemented.
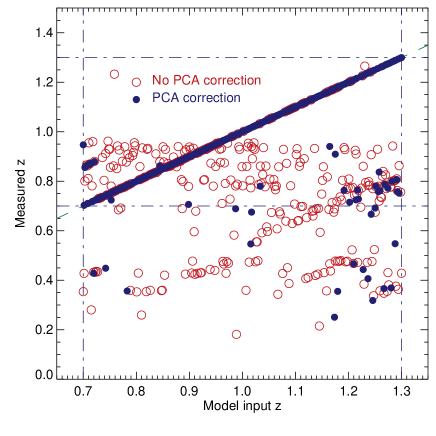
Upper panel) The redshifts recovered by the RUNZ code in fully automated mode are shown as a function of the input model redshift. Open circles show the results without the PCA correction, filled symbols include the improved sky correction. The data set shown is for synthetic spectra with (Vega)=21.
Lower panel) The rate of correct redshift identification is shown as a function on the input model magnitude. The simulations are performed using the 354 science fibres, and also the 25 sky fibres available across each frame.
| Sky subtraction mode | Program | Exp. details | Observation Date |
|---|---|---|---|
| Dedicated sky fibres | GAMA survey (Driver et al., 2009) | 3 1200 sec | 27 March 2008 |
| Dedicated sky fibres | WiggleZ survey (Drinkwater et al., 2009) | 3 1200 sec | 25 March 2008 |
| Nod-and-Shuffle | WiggleZ survey (Drinkwater et al., 2009) | 3 2400 sec 3 nights | 21, 25 & 26 September 2008 |
| Extended PCA test | WiggleZ survey (Drinkwater et al., 2009) | 3 1200 sec | 2009 |
| Data set | R | Poisson error | Local error | Exposure time details |
| mag(Vega) | % sky | % sky | ||
| GAMA | 22 | 3.531.17 | 4.670.60 | 1h on source (1h effective sky) |
| GAMA-PCA | 3.531.17 | 3.760.46 | ||
| WiggleZ | 22 | 3.281.34 | 3.570.38 | 1h on source (1h effective sky) |
| WiggleZ-PCA | 3.281.34 | 3.010.29 | ||
| WiggleZ Deep | 21.25 | 2.320.95 | 1.800.13 | 2h sky, 1h on source (2h effective sky) |
| WiggleZ Deep CBS | 21.65 | 1.640.67 | 1.270.10 | 2h sky, 2h on source (4h effective sky) |
| WiggleZ Deep Full | 22.25 | 0.950.40 | 0.870.07 | 6h sky, 6h on source (12h effective sky) |
Note: for the N+S data, the sky is effectivly twice as strong, as there is a noise contribution from both the on and off observing positions. For the CBS frames the sky is still double the open shutter time, however the on source exposure time is also the full open shutter time.
Appendix A Sky subtraction methodologies
The limiting sensitivity of a spectral observing system is ultimately a question of the signal-to-noise ratio achievable for an given observation. In the faint source limit the Poisson-noise component pertaining to the source photon arrival rate can be largely ignored. Additionally one may assume an observational strategy has been adopted such that noise injected by the detector system (read-noise) may be discounted. In what follows we shall also assume no significant contribution from a thermal or scattered light background. Under these circumstances, at wavelengths in the range 700 nm-1.7 m the limiting factor for system sensitivity becomes the Poisson-noise associated with the foreground screen of emission from the earths atmosphere. On a moonless night, the dominant component of this emission is the molecular emission bands from upper atmosphere OH radicals, with an additional contributions from bands due to O2 (Ellis & Bland-Hawthorn 2008). An example of this OH-airglow spectrum, as seen by the red arm of the AAOmega spectrograph, is shown in Fig. 1. We will return to the troublesome effects of scattered moon light later.
While this sky signature may be subtracted from science spectra, the random noise component remains and can be suppressed only through the collection of a greater quantity of photons, be that via a larger telescope collecting area or an extended exposure time444An important caveat being of course that increasing the source:sky photon ratio via the use of a smaller aperture coupled to improved image quality has an important effect.. In the sky-noise limit increased depth is gained only at the square root of the increase in either. In the presence of even subtle systematic defects in the recorded spectrum of a faint target, increasing the exposure time without end will ultimately reach a noise floor limited by the presence of systematics (Figs. 8 & 9). The depth attainable with any observing system is therefore limited by ones control of sources of systematic error.
Since fibres were first used for astronomical spectroscopy (see Hill (1988) for an historical perspective) a number of strategies have been implemented to attempt to remove the sky signature which is signed, in what often appears to be indelible ink, across every spectrum. A number of standard strategies have evolved over time; we discuss each in turn below.
A.1 Dedicated sky fibres
The most common method for sky subtraction with fibre multi-object spectrographs is to utilise dedicated sky fibres. In this model, a number of fibres are allocated to previously determined blank sky positions across the field of view. This allows the observation of the sky spectrum simultaneously with the science observation removing the effects of temporal variations in the night-sky spectrum.
These sky spectra are processed alongside the science data and combined to provide a photon-noise suppressed sky spectrum (benefiting from the noise suppression from multiple independent samplings of the sky). This combination creates a master sky spectrum effectively noise free by virtue of a high signal-to-noise with respect to the science observations. To achieve this noise free sky spectrum, one must typically combine 15-30 individual spectra. The exact nature of the sum depending on the observational requirements, and factors such as the cosmic ray rate at the detector and the care with which the user has chosen blank sky regions (a non trivial problem for observation in some fields e.g. the galactic bulge).
While the use of the dedicated sky fibres prevents the act of subtracting the master sky spectrum increasing the random noise (since the master sky spectrum is essentially noise free), the subtraction accuracy is at the mercy of a series of systematic defects as outlined below. These systematic effects limit the ultimate depth of observations with the dedicated sky subtraction method, shifting the signal-to-noise firmly off the curve-of-growth one would expect from a purely Poisson process of photon arrival from the target and night sky. The number of fibres one should dedicate to sky is a topic of debate for many a survey program. Clearly each fibre used for blank sky is unavailable for observations of a science target object and so directly reduces the multiplex advantage. For AAOmega observations at the AAT 20-25 fibres are typically allocated to blank sky in a given configuration, 5% of the full complement of available science fibres. It should be noted that this order of overhead will likely remain for systems with many more fibres than AAOmega. The available fibres of such a system will likely be separated across multiple spectrographs and for reasons of PSF stability (outlined below) 15-25 fibres will likely be needed per spectrograph.
The master sky spectrum is subtracted from all object spectra after an appropriate scaling factor is derived to account for fibre relative response variations. Standard dome flat frames typically cannot be used to determine this relative response since it is not usually feasible to provide a uniform intensity illumination to all fibres across the field-of-view of the observing system. For example the quartz-halogen flat field lamp frames used with AAOmega observations provide an excellent wavelength dependant relative response fibre-to-fibre, but provide no total intensity normalisation due to a strong illumination gradient in the flat field. This illumination gradient results from the short path length (2m) between the light source and the diffuser screen. For low resolution sky limited AAOmega observations this scaling is usually derived from measurements of the very night sky air-glow lines one aims to subtract from within the sky and science target spectra. The master sky spectrum is then scaled to match the measured line intensities for subtraction.
A.1.1 Problems associated with dedicated sky fibre observations
There are a number of issues which limit the sky subtraction accuracy typically achieved with dedicated sky fibres. The first five problems considered below amount to systematic modification of the individual input spectra via cross-contamination or the addition of a non-astronomical component which largely invalidates the dedicated sky fibres approach. The remainder are concerned with the introduction of small scale variations in the apparent profile of fibre images on the detector, the Point Spread Function (PSF).
Continuum variations
While there is little evidence on small angular scales for structure in the night sky OH emission, at least at wavelengths shorter than , gradients in the continuum emission particularly during bright-of-moon do significantly modify the observed sky spectrum as a function of field position (certainly for instruments with a wide field-of-view such as the deg2 of the AAOmega system). Indeed for very wide fields of view, spatial variations in OH emission intensities may not in fact average out over the duration of an exposure.555Scattered moon light from a poorly baffled telescope superstructure would of course be particularly damaging. It would be almost impossible to correct for such an additive systematic error, since it will be highly variable both spatially and temporally. The first order effect of strong moon-light gradients in the field will be that line and continuum spectral components scale differently across the field and cannot be adequately accounted for using a single scaling derived from a single component master spectrum.
CCD fibre packing
Perhaps the most mundane effect one must account for is simply the fibre packing onto the CCD. With CCD real-estate at a premium, there is an ever present temptation to push optical fibres closer and closer together in order to increase the multiplex for a given detector area. For the AAOmega system at the AAT, the fibre pitch (separation between adjacent fibres) is 10 pixels, with the fibre profiles projecting an approximately Gaussian FWHM3.4 pixels. A tighter pitch results in significant overlap (cross talk) between adjacent fibres. Close packing hampers scattered light (background) estimation and is particularly problematic in the high contrast calibration frames such as flat fields, where one requires high intensities to reduce Poisson noise sensitivity, but which may compromise accuracy by inducing significant cross-talk errors between fibres. Improved extraction methodologies, which better account for fibre-to-fibre cross-contamination, are invaluable (Sharp & Birchall, 2010; Bolton & Schlegel, 2010).
Flat field irregularities and scattered light
Imperfect flat fielding within the spectrograph will introduce errors. A common problem is imperfect removal of scattered light on the detector system either from a poor accounting for the wings of individual fibre profiles, or from low level diffuse scattering and ghost events from the myriad optical elements within the spectrograph light path (strong ghosts being of such grave consequence that they have been removed by adequate baffling during the detailed spectrograph design process of course). Accurate removal of scattered light from science and calibration frames, particularly high signal level flat field frames, is essential for accurate sky subtraction (Sharp & Birchall, 2010).
Pixel-to-pixel sensitivity variations
Pixel-to-pixel sensitivity variations must be considered carefully. Any high frequency variations in the final image will distort the PSF of individual OH lines within the sky spectrum and modulate the sky subtraction accuracy. Ideally pixel-to-pixel sensitivity variations should be multiplicative corrected via a long-slit flat field process whereby a uniform (both in wavelength and spatial intensity variations) source illuminates the detector and local intensity variations are identified through dividing such a suitably exposed frame by itself after moderate smoothing with a low pass spatial filter. For many observing systems the small amplitude of variations found in the current generation of (low fringing) CCDs appear adequately corrected by the fibre-flat-field process without resorting to external long-slit flat fields. Fringing in the CCD, due to variations in the thickness of the device, is a related issue and for a spectroscopic system can essentialy be treated as part of any pixel-to-pixel sensitivity correction. For the AAOmega system the effect of using a long-slit flat field to correct for pixel-to-pixel sensitivity variations is found to be measurable but not critically significant.
Fibre fringing
Any small air-gap between optical surfaces in the fibre feed will introduce an etalon effect and produce interference fringing in the observed spectrum of a fibre. If this air-gap remains stable over time, then the fringing amplitude modulation will be corrected via the flat-fielding process and amounts only to an, undesirable, loss of observing efficiently. However, if the air-gap is unstable with time the frequency of the interference fringing will change and flat-fielding will no longer correct the signal modulation. In this case sky subtraction through the use of a master sky spectrum is doomed to failure since the relative intensities of sky lines are modulated by the fringing. Fibres that exhibit fringing are therefore of limited value for spectroscopy. Careful preparation of all air/glass surfaces, and where possible immersion of fibre faces, is essential to guard against these catastrophic spectral defects. Fibre fringing has been a perennial problem in a small fraction of AAOmega fibres. The root cause has been traced to differential thermal expansion properties of materials within each 2dF fibre button and a mechanical solution, removing the differential expansion, will shortly be implemented.
Optical system PSF variations
Point Spread Function (PSF) variations within the spectrograph optics are a serious limitation to the accuracy of sky subtraction. The PSF, a measure of the projected image quality at each point in the spectroscopic camera, will typically have a radial dependence due to the camera optics, as well as a wavelength variation. This results in a fibre-to-fibre wavelength dependant variation in the resolution element across the detector. Coupling this with manufacturing tolerances on fibre diameter (typically a few percent variation between fibres from different batchs, with somewhat smaller variations from fibres constructed from a single draw) one realises that no two fibres will project spectra with identical resolution characteristics, and hence OH line profiles.
Wavelength calibration
More mundane but related issues regarding the fidelity of the wavelength calibration introduce further complexity. Typically one might expect to calibrate a well exposed arc lamp spectrum to an accuracy of the order 0.1 pixel, but variations in external factors such as the -ratio at which arc light is fed into the fibres for calibration can reduce the internal relative accuracy of this calibration to a point that compromises sky subtraction, even if the global external solution is within tolerance.
The limited spectral (and spatial during the extraction process) sampling of profiles compounds these errors once interpolation of spectra onto a common working coordinate scale becomes necessary to combine individual sky spectra or to perform the relative baseline shift required to subtract the master sky spectrum from the observed data (methods which limit or avoid this re-sampling are possible (e.g. the b-spline fitting methodology used extensivly in the SDSS pipeline processing software; see Bolton & Burles (2007)). Increasing the PSF sampling presents the usual trade-offs of adversely effecting signal-to-noise and spectral coverage.
Focal ratio degradation
Practical construction considerations also have an impact on performance. In slit mask systems, the impact of slit roughness (primarily burrs from the manufacturing process, and non uniform slit width etc.) have long been known and are dealt with via the use of slit function calibrations, usually from twilight flat field frames. One candidate for the fibre equivalent of slit roughness is Focal Ratio Degradation (FRD). For the multi-mode optical fibres commonly used for astronomy, FRD results in a broadening of the angular distribution of light as it emerges from the fibre with respect to the distribution with which it was fed in. This effect modifies the width of the fibre profile, changing the resolution element, and more insidiously modifies the projected profile shape of the fibre. Hence the myriad sky lines in a set of sky spectra will have subtly different shapes at the spectrograph due to FRD. Careful controls during the preparation of the fibres as part of the fibre feed construction can reduce the impact of FRD and improve throughput by preventing FRD losses from over filled optical elements in the system (resulting from poor accounting for changes in the focal ratio due to FRD).
A.1.2 p-Cygni profiles
The practical upshot of most of these limitations is a tendency for sky subtraction residuals to present the classic p-Cygni line profile at each and every night sky emission feature. A slight mismatch between the master sky spectrum and the individual sky spectra within each object spectrum leads to over and under subtraction of the sky lines as a function of wavelength.
A number of strategies exist for minimising the p-Cygni (or reverse p-Cygni) residual profiles. For example one may benefit from employing a secondary wavelength calibration derived from the air-glow lines themselves. Typically this will not appreciably modify the wavelength solution of any given spectrum, but can correct for small irregularities at the fraction of a pixel level. For the AAOmega system, an iterative optimal sky subtraction routine was adopted within the 2dfdr data reduction package666Credit is due to S.Croom for this significant development within 2dfdr.. Under this scheme, the master sky spectrum is iteratively subtracted from each object spectrum and the residual assessed while fitting for line scaling, small velocity offsets (at the sub-pixel level) between the template and the data, and employing a smoothing filter to account for PSF variations.
With more data at hand, Wild & Hewett (2005) implemented a Principle Components Analysis (PCA) approach to the problem of correction of poor PSF residual sky subtraction. This methodology, first proposed by Kurtz & Mink (2000), has been successfully implemented with AAOmega data at the AAT by both the WiggleZ (Drinkwater et al., 2009) and GAMA (Driver et al., 2009) survey projects. It has been adopted as an option within the AAOmega data reduction environment for moderate signal-to-noise extragalactic spectroscopy.777Credit for this work is due independently to PhD students Emily Wisnioski (WiggleZ) and Hannah Parkinson (GAMA).
A.2 Nod-and-shuffle
The nod-and-shuffle (N+S) observing technique was first deployed at the AAT by Glazebrook & Bland-Hawthorn (2001) for use with the LDSS slit-mask system, building on the earlier work of Cuillandre et al. (1994) and the Va et Vient technique. The premise of N+S observing is to perform quasi-continuous observations of both target and blank sky (adjacent to the target) through the identical light paths, hence preserving the temporal and optical structure of the on and off target sky spectra. The principle is identical to that of beam switching, but achieves a high chopping frequency (30 seconds to 2 minute dwell times) without incurring the onerous CCD read-out times and read-noise associated with classical beam switching at this frequency.
One therefore requires an observational scheme whereby charge can be accumulated on the CCD for multiple independent observations, totaling an observational time of the order 20-40 minutes (sufficient to reach the sky limited regime for observation with the low resolution AAOmega gratings of R1350), and then readout the entire observation in a single (2 minute) readout. This mitigates the impact of readout noise, while still allowing independent quasi-continuous observations of target+sky position pairs. Much has already been written about the mechanics of CCD charge shuffling (Cuillandre et al., 1994; Glazebrook & Bland-Hawthorn, 2001; Abraham et al., 2004), here we merely note that charge accumulated in one pixel of a CCD can be somewhat arbitrarily moved across the CCD, essentially instantaneously, with no loss of signal integrity.
The CCD charge transfer phenomenon is fundamental to the basic operation of a CCD, with all charge accumulated in an ordinary observations essentially being charge transferred across the CCD to the readout register(s) before readout. Prolonged experiments indicate that, with modern CCDs, charge transfer between pixels is essentially loss-less (a charge transfer efficiency of 100%) at least in the limit of low signal levels (high-signal high-frequency data leaving some unfortunate charge transfer inefficiency residuals).
Furthermore, while a full CCD readout may take 2 minutes, transferring charge around the CCD is practically instantaneous. Hence provided sufficient storage space is available on the CCD, one can follow the nod-and-shuffle procedure and accumulate charge with the telescope at multiple pointings before performing a single CCD readout.
A.2.1 Limitations of Nod-and-Shuffle
There are a number of immediate limitations which constrain the
utility of the nod-and-shuffle process.
Duty cycle - There is a 50% on-source
efficiency hit since 50% of the time each fibre is pointing at blank
sky. This can be mitigated through cross beam switching (CBS) as
outlined below.
Fibre masking - For the 2dF/AAOmega
system, only 50% of fibres are available (using the classic N+S
technique) since the remaining fibres must be masked off to provide
the storage area needed on the CCD for the charge shuffling.
Increased Sky noise - Since Sky is
observed in the on and off position and then a simple
image subtraction performed, there is no
suppression of noise in the sky spectrum as was the case for
dedicated sky fibres observations, hence there is a
increase in sky noise per spectrum.
Read noise - There is a
increase in effective CCD readout noise contribution due to the
subtraction of the B position spectrum, which can be significant for
shorter observations.
Telescope overheads - There will be a
telescope settling time overhead for each telescope nod. Usually
telescope slew time is insignificant in comparison to the settling
time. The time scale for variations in the night sky emission is
known to be short (Glazebrook & Bland-Hawthorn, 2001). Experimentation with AAOmega
nod-and-shuffle indicates the best subtraction is achieved with
dwell times 30 sec. However, this incurs a significant overhead
in terms of telescope slew and settle time and an dwell time of
60 sec is more typical. Dwell periods in excess of 90-120 sec are
found to adversely effect data quality.
A.3 Mini-shuffling
One clear limitation of the basic nod-and-shuffle strategy is that one requires significant storage area on the CCD in which to hold charge-shuffled spectra during the alternate cycle of each observation. With the 2dF/AAOmega system this is provided by masking alternate fibres from the spectrograph slit. This is physically achieved through the use of an opaque mask attached to the 2dF top end. This occults the light to alternate fibres, which have been left in the parked position around the edge of the 2dF field plate. Attaching the mask is a trivial process, but it does require that the telescope be parked at prime focus access between observations, which adds 5-15 minutes to the observing cycle (depending on the location of targets on the sky with respect to the due north prime focus access position).
With a high quality PSF within the spectrograph, one is at liberty to reduce the fibre-to-fibre spatial separation (the fibre pitch) on the CCD. In the idealised situation, each fibre would be separated by many multiples of the FWHM of the PSF, however tighter packing is required to make reasonable use of the available CCD real-estate. For the AAOmega system, a fibre pitch of 10 pixels is implemented, for a fibre PSF of 3.2-3.5 pixels (AAOmega exhibits a broadened PSF in the far red, a consequence of the greater penetration of photons into the CCD before detection at these wavelengths, which becomes significant due to the fast beam of the AAOmega red camera). Hence fibres are separated at the 1 level, allowing a straight forward (intensity weighted) pixel summation across each fibre profile during extraction, with minimal fibre-to-fibre cross-talk (Sharp & Birchall, 2010).
With detailed modeling of the spectrograph PSF, one can implement an optimal extraction algorithm which simultaneously extracts the profile information for overlapping fibre profiles, allowing fibres to be packed more densely onto the CCD while limiting cross-talk (Sharp & Birchall, 2010; Bolton & Schlegel, 2010). The optimal extraction routine implemented for AAOmega within the 2dfdr data analysis suite, while significantly slower than a simple weighted summation has be shown to produce 1-2% cross talk residuals even for fibres with a pitch FWHM (Sharp & Birchall, 2010).
Once tight packing of the spectra onto the CCD becomes practical, it is possible to perform nod-and-shuffle observations with the full fibre complement. The AAOmega system was indeed designed with this mode of operation in mind. This mini-shuffling concept allows all 400 AAOmega fibres to be used in a single charge shuffling observation. With a fibre FWHM profile 3.2 pixels, and a fibre pitch of 10 pixels, the interfibre gap is adequate to provide the storage zone for B position pixels if an 800 fibre optimal extraction is then implemented to account for the inevitable cross-talk resulting from a fibre separation of 1- (Sharp, 2009).
Appendix B Comparative efficiency of strategies
In making a decision on which observing strategy to pursue for any given program, one must make a number of base-line assumptions with regards to one’s program requirements, and in addition consider a number of mitigating factors.
B.1 Baseline assumptions
FoV - One requires the large field of view common to
fibre fed spectroscopic systems, and observations with a standard long
slit or slit-mask system cannot achieve the desired goal.
Target density - Sufficient targets are
available per field of view to utilise all available fibres (maximise
the multiplex), i.e. raw target numbers are a significant factor to
the experiment.
Figure of merit - Signal-to-noise and
target number are the figure of merit, not some more abstract (yet
important) measure of spectral fidelity.
Fibre availability - Assume no fibres
are required for calibrations. i.e. we ignore the 5-7% of fibres
usually allocated to simultaneous sky observations. With the AAOmega
system this number is typically 25 fibres. For large multiplex
systems we note that due to PSF variations etc., this percentage will
likely stay constant, requiring a similar number of fibres be
allocated to sky per unit spectrograph rather than per telescope
pointing.
Sky limited observations - The observing strategy is assumed to move one out of the read-noise limit, i.e. the error budget is dominated by Poisson-noise from the sky background. When limited by the arrival rate of photons from one’s target source, one is not likely to require the sky subtraction accuracies provided by nod-and-shuffle observations in order to remove one’s background signal.
B.2 Signal-to-noise implications
The combined effect on the signal-to-noise ratio, given the baseline
assumptions, of observing with the nod-and-shuffle observing mode is a
2 reduction in the signal-to-noise ratio achieved for a given
integration time. This reduction comes from the following sources.
Exposure time - A factor of 2 is lost in exposure time
since half of the time must be spent on sky. This is a loss
in signal-to-noise.
Target multiplex - A factor of 2 is
lost in the number of targets that are observed since one can only use
half the fibres as the remaining half must be masked in order to
provide the storage area into which charge can be shuffled. Therefore
to recover the same number of targets, one must observe two target
sets for half of the exposure time each, a signal-to-noise
loss.
Effective increased sky brightness - There is a factor of two increase in the effective sky background, with respect to the object’s signal, due to the presence of sky emission in both the A and B positions. The noise component from the sky spectrum can not be suppressed as is the case with dedicated sky fibres. Essentially the sky is observed for the full exposure duration while the target is only observed for half of this time. This doubling of the sky signal is a further effect in the SN calculation.
B.3 Mitigating factors
There are a number of strategies which can be used to minimise the
impact of nod-and-shuffle on the loss of signal-to-noise ratio.
When all can be applied the loss in signal-to-noise can be reduced
from 2 to .
Low source density - In the limit of a reduced number
of valid targets per field, the loss from losing half of the fibres is
removed.
Mini-shuffling - The mini-shuffling
strategy outlined in section A.3 can be used to allow
the full fibre multiplex to be used.
Cross-beam switching - In the limit of
a reduced number of valid targets per field, two fibres can be
allocated per target to remove the 50% on-source duty cycle effect.
Again, the mini-shuffling strategy allows the maximum multiplex.
The increased sky background cannot be mitigated, and so the signal-to-noise reduction per unit time from this component remains. However, this is a random error and not a systematic effect and so scales with the square root of an increased exposure time.
In circumstances where a gain is found from the N+S technique the
observing strategy when employed with a fibre multi-object
spectrograph can deliver sky subtraction at the Poisson limit over a
wide field of view and with a high multiplex. Our recommended
observing strategy for using N+S with the AAOmega facility at the AAT
is as follows:
Configure the target field using either
standard nod-and-shuffle with fibre masking (200 fibres) or using
mini-shuffling (400 fibres).
Allocate fibres to targets in pairs
using cross-beam-switching (CBS) to alleviate the 50% on source duty
cycle.
Observe in blocks of 20 pairs of A/B
telescope nods, with 60 seconds dwell per position, for individual
exposures of 40 minutes per exposure.
Perform three/four such integrations
per 2dF fibres configuration in order to avoid losses from atmospheric
perturbations on target positions (due to differential atmospheric
refraction across the field).
Telescope nods should be performed
using 60-120 arcsecond offsets to minimise telescope slew time while
allowing sufficient separation between A and B positions on the 2dF
field plate to allow CBS fibre pairs to be allocated.
Gradients in the pattern of variation
in the OH sky lines can be mitigated by observing in the classic ABBA
pattern. This has the added advantage of removing the requirement for
a significant number of intermediate telescope nods.
Telescope nods should be performed in the Declination (north-south) axis to minimise telescope settling time for an equatorial telescope such as the AAT.