Excitation and Abundance of C3 in star forming cores:
We present spectrally resolved observations of triatomic carbon (C3) in several ro-vibrational transitions between the vibrational ground state and the low-energy bending mode at frequencies between 1654–1897 GHz along the sight-lines to the submillimeter continuum sources W31C and W49N, using Herschel’s HIFI instrument. We detect C3 in absorption arising from the warm envelope surrounding the hot core, as indicated by the velocity peak position and shape of the line profile. The sensitivity does not allow to detect C3 absorption due to diffuse foreground clouds. From the column densities of the rotational levels in the vibrational ground state probed by the absorption we derive a rotation temperature () of 50–70 K, which is a good measure of the kinetic temperature of the absorbing gas, as radiative transitions within the vibrational ground state are forbidden. It is also in good agreement with the dust temperatures for W31C and W49N. Applying the partition function correction based on the derived , we get column densities N(C3) 7–9 cm-2 and abundance x(C3) with respect to H2. For W31C, using a radiative transfer model including far-infrared pumping by the dust continuum and a temperature gradient within the source along the line of sight we find that a model with x(C3)=10-8, =30-50 K, N(C3)=1.5 1015 cm-2 fits the observations reasonably well and provides parameters in very good agreement with the simple excitation analysis.
Key Words.:
ISM: molecules – Submillimeter: ISM – ISM:lines and bands – ISM:individual (W49N, W31C) –line:identification – molecular data – Radiative transfer1 Introduction
Small carbon chains are relevant in the chemistry of stellar and interstellar environments for several reasons: ubiquitous interstellar spatial distribution, they likely participate in the formation of long carbon chain molecules, and they are products in photo-fragmentation processes of larger species such as PAHs. Triatomic carbon, C3, was first tentatively identified in interstellar gas by Van Orden et al. (1995) and Haffner & Meyer (1995). The mid-infrared spectrum of C3 ( antisymmetric stretching mode) was measured in the circumstellar envelope of CW Leo (IRC +10216) by Hinkle et al. (1988), and in low-resolution interstellar absorption in the far-IR ( bending mode) toward Sgr B2 by Cernicharo et al. (2000). Giesen et al. (2001) discussed new laboratory data on the vibrational spectrum of C3 in its low-frequency bending mode and re-visited the first identification of the line in absorption toward Sgr B2 (Van Orden et al. 1995). The abundance and excitation of C3 in translucent clouds were determined convincingly by Maier et al. (2001), Roueff et al. (2002) and Oka et al. (2003) at optical wavelengths.
The Heterodyne Instrument for the Far-Infrared (HIFI; De Graauw et al. 2010) on board the Herschel Space Observatory (Pilbratt et al. 2010), with its broad frequency coverage, high sensitivity and spectral resolution provides for the first time the opportunity for a systematic study of carbon chain molecules such as C3 through probing several ro-vibrational lines at full spectral resolution. In this Letter, we present the first results of our search for C3 obtained from observations of the sight-lines to the bright far-infrared (FIR) continuum sources W31C and W49N as part of the PRISMAS (“PRobing InterStellar Molecules with Absorption line Studies”) Key Program (Gerin et al. 2010).
W31C (G) is one of three bright HII regions within the W31 complex, and an extremely luminous submillimeter and infrared continuum source ( Wright et al. 1977). Located at a distance of kpc (Fish et al. 2003) with vLSR = -3 to -1 km s-1 (Miettinen et al. 2006), the sight-line to G intersects several foreground molecular clouds (Corbel & Eikenberry 2004). W49N is one of the three main IR peaks of W49A, which has a luminosity of ( Ward-Thompson & Robson 1990). It is located at a distance of 11.4 kpc and has vLSR = 12 km s-1. The sight-line toward W49N is spectroscopically interesting because of the numerous features contributed by W49A itself, as well as by additional clouds associated with the Sagittarius spiral arm (which crosses the line of sight twice). Numerous spectroscopic studies (both emission and absorption) have been carried out in the past towards both these sources (e.g., Plume et al. 2004; Neufeld et al. 2010).
2 C3 energy level diagram and radiative transitions
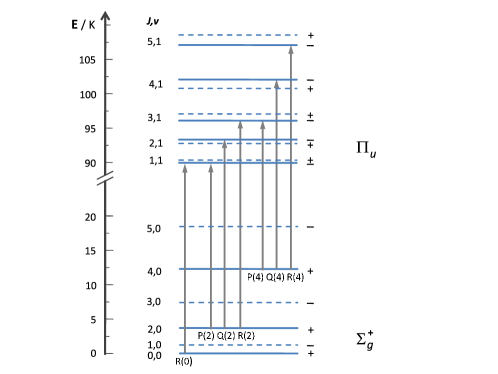
Linear C3 has an energetically unusually low bending mode at only K. Ro-vibrational transitions of the band in its electronic ground state have been reported by Gendriesch et al. (2003) and Schmuttenmaer et al. (1990). transitions with , with , and with …16 have been measured in the laboratory, using high resolution Terahertz sideband spectrometers at Berkeley (Schmuttenmaer et al. 1990) and Cologne (Gendriesch et al. 2003) with frequency accuracies of 7 MHz and 0.5 MHz respectively, which corresponds to line frequency uncertainties of 1.1 km s-1 and 0.08 km s-1. All data were used in a global fit analysis to obtain most accurate molecular constants (Giesen et al. 2001) which are presented as line lists for astronomical observations in the Cologne Data Base for Molecular Spectroscopy (CDMS) (Müller et al. 2005). The ground state of C3 has symmetry while the vibrational excited is a two-fold degenerate bending state of symmetry. Due to the 12C nuclear spin of in the ground state only levels of (+) parity are present, while for the excited bending state only levels with (-) parity are allowed. As a consequence, in the ground state of C3 all odd numbered rotational levels are missing, whereas in the vibrational excited state both, even and odd rotational levels are present, but the two-fold degeneracy of the vibrational state is lifted (see Fig. 1). Consequently, the statistical weights of the ro-vibrational levels is simply given by the rotational degeneracy: . The bending mode has a perpendicular type spectrum with a calculated vibrational dipole moment of 0.437 Debye (Jensen et al. 1992) which shows prominent , , and branch transitions.
For the analysis of the HIFI C3 data, rest frequencies for , , and were taken from laboratory measurements while for the rest frequency has been obtained from a global fit of all available laboratory data.
| Name | Transition | Frequency a | A-coeff | El | ||
|---|---|---|---|---|---|---|
| (,) | () | [MHz] | s-1 | [K] | ||
| (9,1) | (10,0) | 1654081. | 66(4.68) b | 2.38 | 47.3 | |
| (3,1) | (4,0) | 1787890. | 57(6.90) | 2.72 | 8.6 | |
| (2,1) | (2,0) | 1890558. | 06(0.25) | 7.51 | 2.6 | |
| (4,1) | (4,0) | 1896706. | 56(0.15) | 7.58 | 8.6 | |
a Experimental rest frequencies, uncertainties are given in parentheses.
b Calculated frequency and 1 uncertainty taken from CDMS catalog.
3 Observations and data reduction
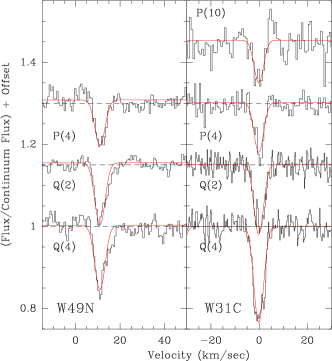
Along the sight-lines to W31C and W49N we have observed four lines of the bending mode, , , and (the latter only in W31C), of triatomic carbon in the upper sideband of the HIFI bands 7a, 7b and the lower sideband of band 6b of the HIFI receiver. The observations of W31C and W49N were carried out on 2010 March 8 and 2010 April 19 respectively. The line was available as a “bonus” for an LO tuning dedicated to observe the CH line at 1661 GHz and it is yet to be observed in W49N with HIFI. All observations are in dual beam switch (DBS) mode and with the Wide Band Spectrometer with its spectral resolution of 1.1 MHz, corresponding to a velocity resolution of 0.17 km s-1 at the frequencies of the C3 lines. To identify the line origin from the lower and upper sidebands, each line was observed with three LO settings shifted by 15 km s-1 relative to each other. The line also shows up in the observations from the lower sideband, and, for one of the LO tunings, partially overlap with the former. The data were first processed with HIPE (Ott et al. 2010), and subsequently exported to CLASS. At the high frequencies for these observations the H and V polarizations were at times found to be discrepant in the measured continuum level. Observations optimized for reliable continuum measurement were used to select the spectra with the correct continuum level, used for the subsequent analysis. All spectra were smoothed to a resolution of 0.68 km s-1 and the rms noise level for the spectra lie between 0.01–0.03 K. Table 2 gives the measured double sideband continuum level (). For the remainder of the paper we discuss the line intensities normalized to the single-sideband continuum level, where we have assumed a sideband gain ratio of unity.
4 Results
We have for the first time detected the spectrally resolved band transitions , , and lines of C3. Fig. 2 shows the observed spectra normalized to the (single sideband) continuum level. A multi-component Gaussian with common velocity width and spacing and individual amplitudes for each line was fitted to derive the basic parameters of the absorption spectra. Table 2 presents the fit results and their uncertainties. The spectrum is affected by the spectral lines of CH (1661.10726 GHz) and H2O (1661.007637 GHz) from the upper sideband.
The C3 absorption features towards W31C and W49N are centered near 0 km s-1 and 11 km s-1 respectively. The systemic velocities of W31C and W49N are at = km s-1 and 12 km s-1. Thus the C3 absorption lines detected here appear to be physically associated with the hot core itself and most likely arise in the lower density warm envelope surrounding them. We do not detect any absorption feature arising from the foreground clouds towards either of these sources (see Sec. 5).
| Transition | W31C | W49N | ||||
|---|---|---|---|---|---|---|
| Nl | Nl | |||||
| [K] | [km/s] | [cm-2] | [K] | [km/s] | [cm-2] | |
| 11.40.4 | 0.51 | 1.0 1014 | … | …… | ||
| 10.50.3 | 0.61 | 1.5 1014 | 16.80.2 | 0.62 | 1.6 1014 | |
| 11.80.2 | 0.87 | 7.2 1013 | 18.30.3 | 0.87 | 7.3 1013 | |
| 11.80.2 | 1.22 | 1.0 1014 | 18.30.2 | 0.90 | 7.6 1013 | |
4.1 Two-layer excitation analysis
We first consider a simple two-layer model in which a (warm) absorbing layer without continuum opacity lies in front of a (hotter) emitting background source. We used the formalism explained in detail in Appendix A to obtain estimates of the rotational temperature () from the state specific column densities (Tab. 2). The column densities are redundantly determined through both the and transitions. One of the primary sources of error in determination of the state specific column densities is the determination of the continuum levels. We estimate the uncertainty in the derived column densities to be 20%. For both W31C and W49N the discrepancy in the column densities determined from and is much larger than this uncertainty. We can only speculate on the reason: firstly, the assumptions of the simple two-layer model may not be appropriate and a more sophisticated model should be used (see below). Secondly, we note that in case the C3 absorption fills only a fraction of the solid angle of the continuum source within the beam, the intrinsic absorption would be much larger, possibly reaching saturation for the stronger line. We use an average of the column densities at obtained from and for the rest of the paper.
Using the formulae from Appendix A, we obtain for W49N a of 70 K with a large formal error. This is consistent with derived from dust continuum observations as 43 K (Vastel et al. 2000) since can be higher than through direct gas heating near the core. For = 70 K we calculate from the =2 column density a total column density of N(C3) = 9 1014 cm-2.
For W31C we have used the state-specific column densities () at =2, 4 and 10, to determine and from the slope and the intercept respectively of a linear fit to the log() vs points (“rotation diagram”). Assuming a uniform 20% error in the determination of the column densities we obtain = 566 K and = (70.5) 1014 cm-2. The estimated is consistent with the observed dust temperature of 52 K derived from continuum observations by Mueller et al. (2002).
4.2 Radiative transfer models for C3 excitation in W31C
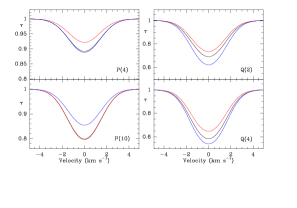
In the likely scenario that the dust continuum source and its associated continuum opacity are coexistent with the gas that absorbs in the C3 lines, the C3 molecule will be embedded in a relatively strong continuum radiation which would contribute to the ro-vibrational excitation. In addition, the source intrinsic continuum will partially fill in the line absorption. Thus, in a more detailed approach we use a radiative transfer model, which considers FIR pumping by the dust continuum (Cernicharo et al. 2000) and a temperature gradient of the continuum source along the line of sight. For W31C we find that the C3 column densities can be interpreted by a cloud which is twice the size of the continuum source, has a molecular hydrogen density (H2) = 105 cm-3, vturb= 2 km s-1, abundance (C3) = 5 10-8, kinetic temperature of 50 K and = 1.5 1015 cm-2 (see Fig. 3). The fact that the C3 column density comes out larger in this more detailed model is expected, as the dust opacity partially fills-in the absorption line.
The main source of uncertainty in these models are the ro-vibrational collisional rates which are based on rather crude assumptions (Cernicharo et al. 2000). However, irrespective of the adopted collisional rates the ground state is always thermalized, even in the presence of a strong IR radiation field in our models. We find that owing to the lack of a permanent electrical dipole moment the uncertainties in the collisional rates have little effect on the emerging intensities. Fig. 3 also shows that the resulting absorption depths are almost unaffected by a change in the local density (and hence abundance) by as much as a factor of 5, as long as the column density remains constant. We find that the =1–0 transitions are dominated by infrared pumping. The ro-vibrational excitation temperature in the inner part of the cloud is 35–37 K for the lowest rotational levels and around 20 for the higher-J states. In the external layers decreases by 20 and 10 K, respectively. In a second model with (H2) = 5 105 cm-3 and (C3)=10-8 the results are almost equally consistent with the observations. We also note, that depending on the geometrical arrangement, the FIR-pumping in the ro-vibrational transitions can result in the net effect of lowering the rotational temperature in the vibrational ground state slightly below the kinetic temperature of the gas.
We find that the major effect on the resulting absorption depths is related to the kinetic temperature adopted for the absorbing gas. In Fig. 3 the blue lines correspond to a gas with =30 K. The high- lines of the ground state are less populated than in the previous case and the opacities for the 1–0 transitions decrease. If the opacity of the ro-vibrational lines become larger than 1, and the central continuum source is optically thick at the wavelengths of the =1–0 transitions, then the level becomes thermalized to the temperature of the dust. This effect can be counterbalanced by decreasing the gas temperature in the external layers of the cloud. Clearly, a more elaborate analysis than can be presented in this letter, is needed to explore the full parameter range.
5 Discussion
In the absence of allowed radiative transitions in the ground state, the excitation of C3 in the state can be assumed to be thermalized to the kinetic temperature: = . However, can be larger than in the presence of direct gas heating mechanism like the photoelectric heating. The mode on the other hand could be excited by collisions and as well as by infrared photons. With Einstein coefficients ranging between 2 and 7 10-3 s-1, the line opacities can be high and the infrared pumping rather efficient. As a result, the excitation temperatures of the ro-vibrational lines are much lower, typically between the beam-diluted and and hence the lines are seen in absorption. However, as explained above, the excitation temperature within the rotation ladder of the ground vibrational state can have values larger than .
Crude estimates based on the “two-layer” approach derive a consistent with the dust temperature of the continuum source and give column densities of C3 in W31C and W49N to be between 7–9 cm-2. Using the more elaborate radiative transfer model we derived a column density of 1.5 1015 cm-2 for W31C for of 30 K. Based on the discussion above we further argue that the thus derived column density of C3 is likely to be a lower limit. Implicit assumptions like a source filling factor of unity, etc. in the two-layer approach translate to an underestimate of . Moreover the source intrinsic continuum opacity at 1.9 THz partially re-fills the absorption (as shown in the radiative transfer model), and hence the column densities derived from the radiative transfer model are higher than those derived in the two-layer model. Thus taking all uncertainties into account we conclude that for both W31C and W49N the C3 column densities are cm-2, correct to within a factor of 2 or so. The H2 column densities in W31C and W49N are cm-2 (Miettinen et al. 2006) and cm-2 respectively, so that the abundances of C3 are . It is interesting to note that warm-up chemical models of the environment around hot cores similar to the models by Hassel et al. (2008), with =2 105 cm-3 and AV = 10 yield an abundance of 4–6.
Based on absorption studies of C3 in optical wavelengths the C3 column densities in diffuse and translucent clouds are found to range between 1012–1013 cm-2 (Maier et al. 2001; Roueff et al. 2002; Oka et al. 2003). The C3 column density observed in the present study is larger by about a factor of 100 or more than those from the optical studies. Thus, the non-detection of C3 in the foreground diffuse gas in the direction of our sources is consistent with the sensitivity of our observations.
References
- Bieging et al. (1982) Bieging, J. H., Wilson, T. L., & Downes, D. 1982, A&AS, 49, 607
- Cernicharo et al. (2000) Cernicharo, J., Goicoechea, J. R., & Caux, E. 2000, ApJ, 534, L199
- Cohen & Willson (1981) Cohen, N. L., & Willson, R. F. 1981, A&A, 96, 230
- Corbel & Eikenberry (2004) Corbel, S., & Eikenberry, S. S. 2004, A&A, 419, 191
- De Graauw et al. (2010) De Graauw, T. et al. A&A, Herschel Special Issue
- Falgarone et al. (2005) Falgarone, E., Phillips, T. G., & Pearson, J. C. 2005, ApJ, 634, L149
- Fish et al. (2003) Fish, V. L., Reid, M. J., Wilner, D. J., & Churchwell, E. 2003, ApJ, 587, 701
- Gendriesch et al. (2003) Gendriesch, R, Pehl, T., F., Winnewisser, G. et al. 2003, Zeit. Naturforsch., 58a, 129
- Gerin et al. (2010) Gerin, M., De Luca, M., Black, J. et al. 2010, A&A, Herschel Special issue (in press)
- Giesen et al. (2001) Giesen, T. F., Van Orden, A. O., Cruzan, J. D. et al. 2001, ApJ, 551, L181
- Greaves & Williams (1994) Greaves, J. S., & Williams, P. G. 1994, A&A, 290, 259
- Gwinn et al. (1992) Gwinn, C. R., Moran, J. M., & Reid, M. J. 1992, ApJ, 393, 149
- Haffner & Meyer (1995) Haffner, L. M., & Meyer, D. M. 1995, ApJ, 453, 450
- Harvey et al. (1977) Harvey, P. M., Campbell, M. F., & Hoffmann, W. F. 1977, ApJ, 211, 786
- Hassel et al. (2008) Hassel, G. E., Herbst, E., & Garrod, R. T. 2008, ApJ, 681, 1385
- Herbst (2005) Herbst, E. 2005, ESA Special Publication, 577, 205
- Hinkle et al. (1988) Hinkle, K. W., Keady, J. J., & Bernath, P. F. 1988, Science, 241, 1319
- Jensen et al. (1992) Jensen, P., Rohlfing, C. M., & Almloef, J. 1992, Journal of Chemical Physics, 97, 3399
- Keene et al. (1999) Keene, J., Lis, D. C., Phillips, T. G., et al. 1999, The Universe as Seen by ISO, 427, 687
- Lucas & Liszt (2000) Lucas, R., & Liszt, H. S. 2000, A&A, 355, 327
- Maier et al. (2001) Maier, J. P., Lakin, N. M., Walker, G. A. H., et al. 2001, ApJ, 553, 267
- Miettinen et al. (2006) Miettinen, O., Harju, J., Haikala, L. K., & Pomrén, C. 2006, A&A, 460, 721
- Mueller et al. (2002) Mueller, K. E., Shirley, Y. L., Evans, N. J., II, et al. 2002, ApJS, 143, 469
- Müller et al. (2005) Müller, H. S. P., Schlöder, F., Stutzki, J., & Winnewisser, G. 2005, Journal of Molecular Structure, 742, 215
- Mufson & Liszt (1977) Mufson, S. L., & Liszt, H. S. 1977, ApJ, 212, 664
- Neufeld et al. (2010) Neufeld, D. A., Sonnentrucker, P., Phillips, T. G. et al. 2010, A&A, Herschel special issue (in press)
- Nyman (1983) Nyman, L.-A. 1983, A&A, 120, 307
- Oka et al. (2003) Oka, T., Thorburn, J. A., McCall, B. J., et al. 2003, ApJ, 582, 823
- Ott et al. (2010) Ott S., 2010, in ASP conference series “Astronomical Data analysis Software and Systems XIX”, Y. Mizumoto, K. I. Morita and M. Ohishi eds., in press
- Pety et al. (2005) Pety, J., Teyssier, D., Fossé, D., Gerin, M., et al. 2005, A&A, 435, 885
- Pilbratt et al. (2010) Pilbratt G. et al. A&A, Herschel Special Issue
- Plume et al. (2004) Plume, R., et al. 2004, ApJ, 605, 247
- Roueff et al. (2002) Roueff, E., Felenbok, P., Black, J. H., & Gry, C. 2002, A&A, 384, 629
- Schmuttenmaer et al. (1990) Schmuttenmaer, C. A., Cohen, R. C., Pugliano, N., Heath, J. R., & Cooksy, A. L. 1990, Science, 249, 897
- Van Orden et al. (1995) Van Orden, A., Cruzan, J. D., Provencal, R. A., Giesen, T. F., et al. 1995, in ASP Conf. Ser. 73, Proc. Airborne Astronomy Symp. on the Galactic Ecosystem, ed. M. R. Haas, J. A. Davidson, & E. F. Erickson (San Francisco: ASP), 67
- Vastel et al. (2000) Vastel, C., Caux, E., Ceccarelli, C., et al. 2000, A&A, 357, 994
- Ward-Thompson & Robson (1990) Ward-Thompson, D., & Robson, E. I. 1990, MNRAS, 244, 458
- Wright et al. (1977) Wright, E. L., Fazio, G. G., & Low, F. J. 1977, ApJ, 217, 724
Appendix A Formulae used for the excitation analysis
In the approximation of weak absorption () and a negligible population in the upper, , state, the lower state column density is given by:
| (1) |
The rotational temperature, , is calculated from the state specific column densities by
| (2) |
where the energy of the levels is given by and the rotational constant for the lower vibrational state ( = 0) is B = 12908.242 MHz.
Note that a ratio of level populations close to unity, , implies high values of in comparison to the rotational energy scale defined by , i.e. 0.62 K in the case of C3. The formal errors derived for the are correspondingly very large.
Assuming a thermalized population across the rotational ladder with a unique value of for all levels, a measured single state column density can be converted to the total column density using:
rrc
where the approximation has been applied for the partition function
| (5) |
which is half of the usual value for a linear rotor due to the symmetry not allowing odd-J states.