The distance and internal composition of the neutron star in EXO 0748676 with XMM-Newton
Abstract
Recently, the neutron star X-ray binary EXO 0748-676 underwent a transition to quiescence. We analyzed an XMM-Newton observation of this source in quiescence, where we fitted the spectrum with two different neutron-star atmosphere models. From the fits we constrained the allowed parameter space in the mass-radius diagram for this source for an assumed range of distances to the system. Comparing the results with different neutron-star equations of state, we constrained the distance to EXO 0748-676. We found that the EOS model ’SQM1’ is rejected by the atmosphere model fits for the known distance, and the ’AP3’ and ’MS1’ is fully consistent with the known distance.
keywords:
stars: neutron — X-rays: binaries — dense matter: equation of state — stars: individual: EXO 0748676Accepted. Received; in original form
1 Introduction
The low-mass X-ray binary (LMXB) EXO 0748–676 was discovered as a transient source with the European X-ray Observatory Satellite (EXOSAT) in 1985 (Parmar et al., 1986). The source exhibits simultaneous X-ray and optical eclipses from which the orbital period of P = 3.82 hr was deduced (Crampton et al., 1986). EXO 0748676 also exhibited irregular X-ray dipping activity (Parmar et al., 1986), and type-I X-ray bursts (Gottwald et al., 1986). Burst oscillations in EXO 0748676 were first reported by Villarreal & Strohmayer (2004) at 45 Hz in the average Fourier Power Spectrum of 38 type-I X-ray bursts; the 45-Hz signal was then interpreted as the spin frequency of the neutron star. Recently, Galloway et al. (2009) detected millisecond oscillations in the rising phase of two type-I X-ray bursts in EXO 0748-676 at a frequency of 552 Hz. They concluded that the spin frequency of EXO 0748-676 is close to 522 Hz, rather than 45 Hz as suggested by Villarreal & Strohmayer (2004). The 45 Hz oscillation may arise in the boundary layer between the disk and the neutron star (Balman, 2009) or it could be a statistical fluctuation (Galloway et al., 2009). Cottam, Paerels & Méndez (2002) reported a measurement of the gravitational redshift from iron and oxygen X-ray absorption lines arising from the atmosphere of the neutron star in EXO 0748676 during type-I X-ray bursts, but subsequent observations failed to confirm these features (Cottam et al., 2008). Based on the gravitational redshift, Özel (2006) suggested that the mass, radius and distance of EXO 0748676 are , km and kpc, respectively, which would rule out many neutron-star equations of state.
Measuring the distance to LMXBs is difficult, except for the case of sources in globular clusters. A way to get the distance is using type-I X-ray bursts. The peak flux for some very bright bursts can reach the Eddington luminosity at the surface of the neutron star. From a strong X-ray burst, Wolff et at. (2005) derived a distance to EXO 0748676 of 7.7 kpc for a helium-dominated burst photosphere, and 5.9 kpc for a hydrogen-dominated burst photosphere. Galloway et al. (2008a) analyzed several type-I X-ray bursts from EXO 0748676 and estimated a distance of 7.4 kpc, different from the value of 9.2 kpc reported by Özel (2006). Taking into account the touchdown flux and high-inclination in EXO 0748676 , recently Galloway et al. (2008b) gave a distance of 7.1 1.2 kpc.
Another way to get the distance to an LMXB is through observations of quiescent X-ray emission from the neutron-star surface. During the quiescent state, X-ray emission originates from the atmosphere of the neutron star. By fitting the X-ray spectrum of the neutron-star system with hydrogen atmosphere models, one can estimate the mass, radius and distance of the neutron star. Recently, the neutron-star X-ray transient EXO 0748676 underwent a transition into quiescence (Degenaar et al., 2009; Bassa et al., 2009).
In this paper, we report on the distance to EXO 0748676 that we constrained from XMM-Newton data. We use two different neutron-star atmophere models to fit the X-ray spectrum, and compare the results of the spectral fitting with different neutron-star equation of state (EOS). In the next section, we describe the observation and data analysis. We show the fitting results in §3, and we discuss our findings in §4.
2 OBSERVATIONS AND DATA ANALYSIS
EXO 0748676 was observed with the European Photon Imaging Camera (EPIC PN and MOS) on board the XMM-Newton on 2008 November 6 at 08:30:03 UTC (obsID 0560180701). The PN and the two MOS cameras were operated in Full-Window mode. We reduced the XMM-Newton Observation Data Files (ODF) using version 8.0.0 of the science analysis software (SAS). We used the epproc and emproc tasks to extract the event files for the PN and the two MOS cameras, respectively. Source light curves and spectra were extracted in the 0.2 12.0 keV band using a circular extraction region with a radius of 30 arcsec centered on the position of the source. Background light curves and spectra were extracted from a circular source-free region of 35 arcsec source-free on the same CCD. We applied standard filtering and examined the light curves for background flares. No flares were present and we used the whole exposure for our analysis. The exposure time for the PN camera was 24.2 ks, and for each MOS camera was 29.03 ks. The source count rate was cts/s for PN, and cts/s and cts/s for MOS1 and MOS2, respectively. We checked the filtered event files for photon pile-up by running the task epatplot. No pile-up was apparent in the PN, MOS1 and MOS2 data. The photon redistribution matrices and ancillary files for the source spectra were created using the SAS tools rmfgen and arfgen, respectively. We rebinned the source spectra using the tool pharbn111M. Guainazzi, private communication, such that the number of bins per resolution element of the PN and MOS spectra was 3 and the minimum number of counts per channel was 20.
We fitted the PN and MOS spectra simultaneously in the 0.510.0 keV range with XSPEC 12.50 (Arnaud, 1996), using either of two neutron-star hydrogen-atmosphere models: NSAGRAV (Zavlin et al., 1996) and NSATMOS (Heinke et al., 2006). The NSAGRAV model provides the spectra emitted from a nonmagnetic hydrogen atmosphere of a neutron star with surface gravitational acceleration, , ranging from to cm s-2. This model uses the mass () and radius () of the neutron star and the unredshifted effective temperature of the surface of the star () as parameters. The normalization of the model is defined as , where is the distance to the source in pc. The second model that we used, NSATMOS, includes a range of surface gravities and effective temperatures, and incorporates thermal electron conduction and self-irradiation by photons from the compact object. This model assumes negligible magnetic fields (less than G) and a pure hydrogen atmosphere. NSATMOS parameters are , , log (the same as for NSAGRAV), distance in kpc, and a separate normalization , which corresponds to the fraction of the neutron-star surface that is emitting. We fixed to be 1 in all our fits with NSATMOS.
We included the effect of interstellar absorption using PHABS assuming cross-sections of Balucinska-Church & McCammon (1992) and solar abundances from Anders & Grevesse (1989), and we let , column density along the line of sight free to vary during the fitting. In order to account for differences in effective area between the different cameras, we introduced a multiplicative factor in our model. First, this factor was fixed to unity for PN and free for MOS1 and MOS2. Then, we set the scaling factor to unity for MOS1 and MOS2, respectively, and set the factor free for the other cameras. We found that, fixing the scaling factor for different cameras gives similar best-fit results. Therefore in the rest of the paper we fixed the factor to be 1 for PN and free to vary for the other cameras. None of the atmosphere models alone fitted the spectrum above keV properly. Adding a power-law component improved the fits significantly, however, all parameters were less constrained than when fitting the data with the neutron-star atmosphere model only. We first fixed the power-law index to 0.5, 1.0 and 1.5 to get better constraints on the parameters of the neutron-star atmosphere model (Degenaar et al. 2009). Further, we initially fixed the distance to the NS at 7.1 kpc, which is the value inferred from the touchdown flux of Galloway et al. (2008b) .
3 RESULTS
3.1 Results from the spectral fits
| model | NH | /d.o.f. | ||||||
|---|---|---|---|---|---|---|---|---|
| () | (eV) | () | (km) | 10-13 ergs cm-2 s-1 | 10-12 ergs cm-2 s-1 | |||
| NSAGRAV | 0.5 | 0.986/219 | ||||||
| NSATMOS | 0.5 | 0.985/219 | ||||||
| NSAGRAV | 1.0 | 0.977/219 | ||||||
| NSATMOS | 1.0 | 0.977/219 | ||||||
| NSAGRAV | 1.5 | 0.987/219 | ||||||
| NSATMOS | 1.5 | 0.985/219 |
-
Note. – NH is the equivalent hydrogen column density, the effective temperature of the neutron-star surface as seen at infinity, and are the mass and radius of the neutron star, respectively. is the unabsorbed flux of the power-law component in the 0.510 keV energy band, and is the total unabsorbed X-ray flux in the same energy band. The last column gives the reduced for 219 degrees of freedom. The quoted errors represent the 90% confidence levels.
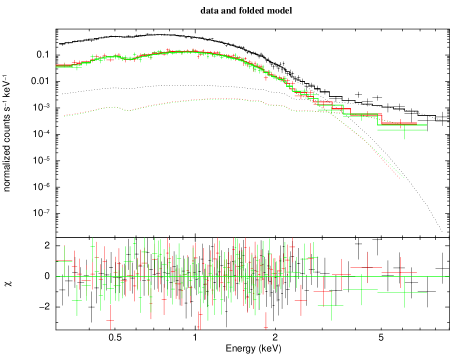
Figure 1 shows the XMM-Newton spectra of EXO 0748-676 fitted with the model “phabs (NSATMOS + powerlaw) ”. The power-law index is fixed at 1.0. The best fit of this model gives cm-2, neutron-star mass , neutron-star radius km, and effective temperature log (in ). According to the same formula used by Degenaar et al. (2009), we converted to the effective temperature as seen by an observer at infinity, eV. In the formula, is the gravitational constant and is the speed of light. The model predicts 0.510 keV an unabsorbed X-ray flux ergs cm-2 s-1. The flux of the power-law component in the same energy band is ergs cm-2 s-1, which corresponds to of the total unabsorbed flux. The reduced is 0.977 for 219 degrees of freedom. The best-fit results of the models NSAGRAV and NSATMOS for the three different power-law index are given in Table-LABEL:tab:model. Errors are given at the 90% confidence level for one fit parameter.
We note from Table LABEL:tab:model that both atmosphere models, regardless of the value of , yield a good fit with similar . In the rest of the analysis, we used a power-law index fixed to 1. Further, and are well constrained and are consistent for the different fits. Both NSAGRAV and NSATMOS models also give consistent results on and . The NSATMOS model is more accurate in constraining than the NSAGRAV model.
3.2 Equation of state
Fitting the quiescence XMM-Newton spectrum of EXO 0748676 with two different atmosphere models and comparing the results allows us to test the reliability and accuracy of both models. From the fits we get a mass and radius of the neutron star at a specified distance, and then by comparing the inferred mass and radius with the different neutron-star EOS we can give upper limits to the source distance for the different EOS.
We used the steppar command in xspec to vary the mass, radius and distance parameters simultaneously, allowing other parameters to be free to find the best fit at each step. For the mass we go from 0.5 to 2.5 with steps of 0.1 , and for the distance we go from 5 to 10 kpc with steps of 0.25 kpc. The minimum and maximum radius allowed with these models are 5.0 km and 25.0 km, respectively. In Fig 2 we show the contour plots obtained from the STEPPAR procedure for the NSATMOS model. Each plot is for a different distance, ranging from 5 to 10 kpc. The contour lines (red) are for the confidence levels of 90% (solid) and 99% (dashed). Further, in Fig 2 we give different neutron-star EOS (black) taken from Lattimer & Prakash (2007). We did the same analysis for the NSAGRAV model as well. Both two models give consistent result, in accordance with the findings of Webb & Barret (2007).
Using the optical data from the Very Large Telescope (VLT), moderate-resolution spectroscopy of the optical counterpart and Doppler tomography, Muñoz et al. (2009) provided the first dynamical constraints on the stellar mass of LMXB EXO 0748676 . The mass range of the neutron star that they derived is . Subsequently, Bassa et al. (2009) analyzed optical spectra of EXO 0748676 when the source was in the quiescent state, and they gave a lower limit to the neutron-star mass of 1.27 . As upper limit we used the value reported by Muñoz et al. (2009), but since at the time of their observation the source was still in outburst, we used the lower limit reported in Bassa et al. (2009). In Figure 2 we also give the lower (pink/dotted) and upper (green/dashed) limits to the neutron-star mass.
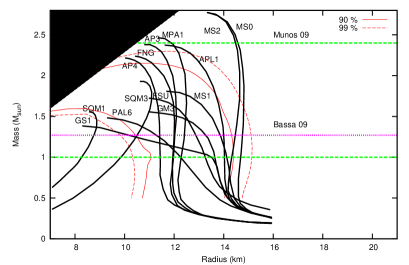
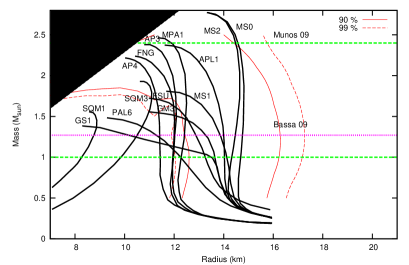
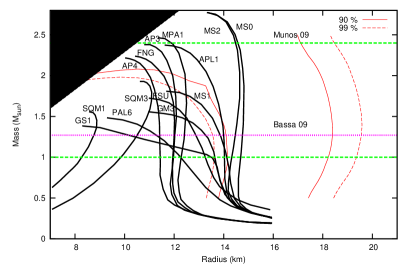
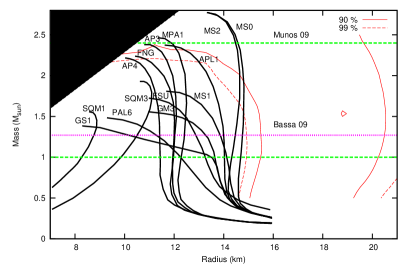
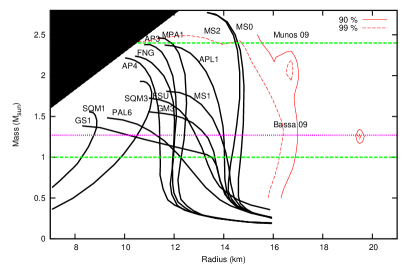
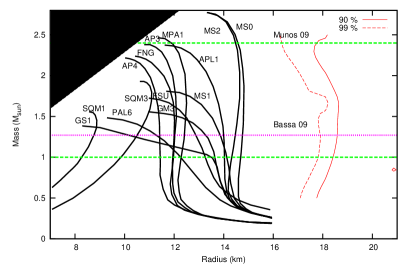
In order to test the EOS and identify the upper limit to the source distance, we assume three different EOS models: normal nucleonic matter (AP3), boson condensates matter (MS1) and strange quark matter (SQM1). By varying the source distance from 5 to 10 kpc, the contour lines for the fitted model move on the NS mass-radius diagram. We can estimate the probability of the distance for each EOS when the contour lines pass through the EOS curves. Note that as the distance increases (see Figure 2), the satisfied area of the model moves from bottom left to top right in the plot. The results using NSAGRAV are similar to those shown in Figure 2. For a certain distance we found that not all the EOSs are consistent with the two neutron-star atmosphere models that we used.
If the neutron star in EXO 0748676 follows the EOS model ‘AP3’, the probability that the source has a distance of 10.0 kpc is and for NSAGRAV and NSATMOS, respectively. If we want to get a probability for the distance larger than (99% confidence), the distance for NSAGRAV and NSATMOS should be smaller than 8.9 kpc and 8.5 kpc, respectively. The distance at 90% confidence for NSAGRAV and NSATMOS is less than 8.3 kpc and 8.2 kpc, respectively. Both models are consistent with the distance of 7.1 kpc given by type-I X-ray bursts (Galloway et al., 2008b).
For the EOS model ’MS1’, the probabilities that EXO 0748676 is at a distance of 10 kpc is and for NSAGRAV and NSATMOS, respectively. For both models, respectively, the distance at 99% confidence level is less than 7.3 kpc and 7.1 kpc, and the distance at 90% confidence level is less than 6.9 kpc and 6.8 kpc. Both neutron-star atmosphere models with the ’MS1’ model have an upper limit for the distance smaller than 7.1 kpc.
For a EOS model ‘SQM1’, the distance at 99% confidence level is less than 5.2 kpc, and the distance at 90% confidence level is less than 5.0 kpc for both atmosphere models. The upper limits on the distance to EXO 0748676 for different EOS are shown in Table LABEL:tab:upper_limit. The ’SQM1’ model is rejected at a 99% confidence level for this neutron star, unless the source is closer than 5.2 kpc.
| EOS | AP3 | AP3 | MS1 | MS1 | SQM1 | SQM1 |
|---|---|---|---|---|---|---|
| confidence | 90% | 99% | 90% | 99% | 90% | 99% |
| NSAGRAV | 8.3 | 8.9 | 6.9 | 7.3 | 5.0 | 5.2 |
| NSATMOS | 8.2 | 8.5 | 6.8 | 7.1 | 5.0 | 5.2 |
-
Note. –The 90% and 99% confidence levels upper limit for the two NS atmosphere models NSAGRAV and NSATMOS for the EOS models: ‘AP3’, ‘MS1’ and ’SQM1’. The distance is in kpc.
4 DISCUSSION
We analyzed an XMM-Newton observation of the neutron star EXO 0748676 in the quiescent state. The unabsorbed X-ray flux in the 0.510.0 keV energy band was 10-12 ergs cm-2 s-1. We found that the non-thermal (power-law) component only contributes of the 0.510 keV X-ray flux, which is lower than what Degenaar et al. (2009) found from Chandra data ( was 1617 of the 0.510 keV X-ray flux from the fit with ) about a month earlier than our observation. The total unabsorbed flux (0.510.0 keV) decreased from ergs cm-2 s-1 in the Chandra observation to ergs cm-2 s-1 in our observation, whereas changed from to . The effective temperature, however, did not show large variations in one month time. According to the above comparisons, the reduction of the total flux is due to a lower contribution of the power-law component.
Because the X-ray spectrum in the quiescent state is dominated by thermal emission originating from the NS surface, our data allow us to constrain the mass and radius of the neutron star. From the two different NS atmosphere models (NSAGRAV and NSATMOS) that we used to fit the X-ray spectrum, we found that both models show similar results and set good constraints on the neutron-star radius. Even taking into account the lower limit (from Bassa et al., 2009), upper limit (from Muñoz et al., 2009) and our best fit contour, we still have a large area on the mass-radius diagram, and many EOSs are still possible (see Figure 2). In order to constrain the allowed space of mass and radius at a specified distance, we choose three typical neutron-star EOS, ‘AP3’, ‘MS1’ and ’SQM1’. We found that the smaller the distance to the NS the more EOSs are consistent with the data.
For any specific EOS, as the upper limit of the distance we took the value of the distance where the 99% confidence contour just intersects the curve of that EOS. We found that the upper limits on the distance as derived from the NSAGRAV model are slightly higher than those for the NSATMOS model. The EOS model ‘MS1’ can be just satisfied at a distance of 7.1 kpc. If we assume that the neutron star in EXO 0748676 is a normal neutron star, following the EOS ‘AP3’, the source should be closer than 8.9 kpc for the NSAGRAV model, or 8.5 kpc for the NSATMOS model. Both the ’MS1’ and ’AP3’ EOS are fully consistent with the measured distance of 7.1 kpc (Galloway et al., 2008b; Wolff et at., 2005). For larger distances more EOS are ruled out. The EOS ’SQM1’ is rejected by the atmosphere model fits for a distance of 7.1 kpc measured from the X-ray bursts Galloway et al. (2008b). We note, however, the neutron-star atmosphere models may not appropriate for ’bare’ quark matter stars, but only for those normal quark star where a crust is present.
Acknowledgments
This work is based on the observations obtained from XMM-Newton. PGJ acknowledges support from a VIDI grant from the Netherlands Organisation for Scientific Research.
References
- Anders & Grevesse (1989) Anders, E., & Grevesse, N. 1989, Geochim. Cosmochim. Acta, 53, 197
- Arnaud (1996) Arnaud, K. A. 1996, ASP Conf. Ser., 101, 17
- Balucinska-Church & McCammon (1992) Balucinska-Church, M., & McCammon, D. 1992, ApJ, 400, 699
- Balman (2009) Balman, S. 2009, The Astronomer’s Telegram, 2097
- Bassa et al. (2009) Bassa, C. G.; Jonker, P. G.; Steeghs, D.; Torres, M. A. P, 2009, MNRAS, tmp, 1238B
- Cottam, Paerels & Méndez (2002) Cottam J., Paerels F., Méndez M., 2002, Nat, 420, 51
- Cottam et al. (2008) Cottam, J., Paerels, F., Méndez, M., Boirin, L., Lewin, W. H. G., Kuulkers, E., & Miller, J. M. 2008, ApJ, 672, 504
- Crampton et al. (1986) Crampton, D., Stauffer, J., Hutchings, J. B., Cowley, A. P., & Ianna, P. 1986, ApJ, 306, 599
- Degenaar et al. (2009) Degenaar N. et al., 2009, MNRAS, 396, L26
- Galloway et al. (2008a) Galloway D. K., Muno M. P., Hartman J. M., Savov P., Psaltis D., Chakrabarty D., 2008, ApJS, 179, 360
- Galloway et al. (2008b) Galloway D. K., Özel F. & Psaltis D., 2008b, MNRAS, 387, 268
- Galloway et al. (2009) Galloway D. K., Chakrabarty D., Lin R., 2009, Astron. Telegram, 2094
- Gottwald et al. (1986) Gottwald M., Haberl F., Parmar A. N., White N. E., 1986, ApJ, 308, 213
- Heinke et al. (2006) Heinke, C. O., Rybicki, G. B., Narayan, R., & Grindlay, J. E. 2006, ApJ, 644, 1090
- Lattimer & Prakash (2007) Lattimer J. M., Prakash M., 2007, Phys. Rep., 442, 109
- Muñoz et al. (2009) Muñoz-Darias T., Casares J., O’Brien K., Steeghs D., Martínez-Pais I. G., Cornelisse R., Charles P. A., 2009, MNRAS, 394, L136
- Özel (2006) Özel F., 2006, Nat, 441, 1115
- Parmar et al. (1986) Parmar, A. N., White, N. E., Giommi, P., & Gottwald, M. 1986, ApJ, 308, 199
- Parmar et al. (1992) Pavlov, G. G., Shibanov, Y. A., & Zavlin, V. E. 1992, MNRAS, 253, 193
- Villarreal & Strohmayer (2004) Villarreal A. R., Strohmayer T. E., 2004, ApJ, 614, L121
- Webb & Barret (2007) Webb, N. A., & Barret, D. 2007, ApJ, 671, 727
- Wolff et at. (2005) Wolff, M. T., Becker, P. A., Ray, P. S., & Wood, K. S. 2005, ApJ, 632, 1099
- Zavlin et al. (1996) Zavlin, V. E., Pavlov, G. G., & Shibanov, Y. A. 1996, A&A, 315, 141
- (24)