Identification of two bright submillimeter galaxy candidates in the COSMOS field⋆
Abstract
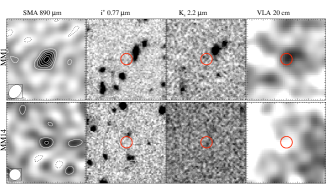
We present high-resolution interferometric Submillimeter Array (SMA) imaging at 890m ( resolution) of two millimeter selected galaxies – MMJ100015021549 and MMJ100047021021 – discovered with the Max-Planck Millimeter Bolometer (MAMBO) on the IRAM 30 m telescope and also detected with Bolocam on the CSO, in the COSMOS field. The first source is significantly detected at the level, while the second source is tentatively detected at the level, leading to a positional accuracy of . MM100015021549 is identified with a faint radio and -band source. MMJ100047021021 shows no radio emission and is tentatively identified with a very faint -band peak which lies at from a clumpy optical source. The submillimeter-to-radio flux ratio for MM100015021549 yields a redshift of , consistent with the redshift implied by the UV-to-submillimeter photometry, . We find evidence for warm dust in this source with an infrared luminosity in the range , supporting the increasing evidence for a population luminous submillimeter galaxies at . Finally, the lack of photometric data for MMJ100047021021 does not allow us to investigate its properties in detail, however its submillimeter-to-radio ratio implies .
Subject headings:
galaxies: evolution — galaxies: high-redshift — galaxies: starburst1. Introduction
Submillimeter (submm) wavelength blank-field surveys discovered a population of heavily dust-obscured starburst galaxies at high redshifts (e.g. Smail et al. 1997; Barger et al. 1998; Hughes et al. 1998). These submm galaxies (SMGs) contribute a large fraction of the comoving infrared (IR) luminosity density at high-redshift (Le Floc’h et al. 2005), and their clustering properties indicate they could be progenitors of the most massive galaxies at (Blain et al. 2004; Viero et al. 2009; Aravena et al. 2010). The number counts and dust production rates of these massive, high-redshift starburst galaxies actually place tight constrains on galaxy formation models (Baugh et al. 2005).
The identification of optical counterparts to the submm sources has mainly been based on the identification of radio counterparts, detected through deep Very Large Array (VLA) 20 cm imaging. This technique exploits the local far-IR/radio correlation (Condon 1992) and statistical arguments to claim an association between a closeby radio source and the submm source, localizing the SMG with an accuracy of . The direct search for counterparts in optical wavebands is not practical due to their common faintness and the high number density of optical sources within the positional uncertainty. For about of all submm sources precise positions can be determined from an identification of faint radio counterparts (Ivison et al. 2007).
However, the depth of current radio observations limits the identification of submm sources to , since due to the strong K-correction, the radio flux (unlike the submm flux) drops rapidly with redshift (Carilli & Yun 1999). The only unambiguous way to localize the highest-redshift SMGs in the optical/near-IR is via submm interferometry.
Radio-selected SMGs have been found to have a median redshift of (Chapman et al. 2005). However, recent interferometric submm imaging of a flux-limited sample of SMGs has provided substantial evidence that up to of this population is likely located at (Iono et al. 2006; Younger et al. 2007, 2009). These radio-dim SMGs appear to be inconspicuous at optical wavelengths, likely obscured by large amounts of dust, and their nature can only be revealed in the IR (Wang et al. 2007; Dannerbauer et al. 2008; Cowie et al. 2009). To date, only five such high-redshift SMGs have been confirmed spectroscopically (Capak et al. 2008; Schinnerer et al. 2008; Coppin et al. 2009; Daddi et al. 2009b, a; Knudsen et al. 2010).
In this paper, we report accurate astrometry of two bright SMGs in the COSMOS field whose radio to submm flux ratio indicates that are likely at . We assume a standard cosmology with km s-1 Mpc-1, and .
2. Observations
| Band | MM1 | MM14S | MM14N | Units | |
|---|---|---|---|---|---|
| 0.45 | nJy | ||||
| 0.77 | nJy | ||||
| 2.2 | nJy | ||||
| IRAC | 3.6 | Jy | |||
| IRAC | 4.5 | Jy | |||
| MIPS | 24 | … | mJy | ||
| MIPS | 70 | mJy | |||
| MIPS | 160 | mJy | |||
| LABOCA | 870 | … | mJy | ||
| SMA | 890 | mJy | |||
| Bolocam | 1100 | … | mJy | ||
| MAMBO | 1200 | … | mJy | ||
| VLA | 20 | Jy |
a Measurements at and m based on the deep Spitzer warm mission exposures. b Wavelength in microns, except for the VLA where it is given in centimeters. c Photometry in the MIPS 24 m bands not possible due to blending with a bright source.
2.1. The COSMOS field
COSMOS is the largest deep survey carried out with the Hubble Space telescope (HST) covering deg2 in the sky. Extensive imaging of the COSMOS field has been performed from the X-rays to the radio wavelengths. This includes: complete optical/near-IR coverage in 22 broad and intermediate bands with several ground based observatories including the Subaru telescope, the CFHT, the UKIRT and the KPNO; IR imaging with Spitzer, including new deep 3.6 and 4.5 m images obtained as part of its warm mission; and radio imaging with the VLA at 20 cm. For details in the optical/IR imaging and catalogs of the COSMOS field see Capak et al. (2007) and Ilbert et al. (2009). A complete description of the radio imaging is given in Schinnerer et al. (2007).
2.2. Sample selection
In the course of the MAMBO 1.2 mm survey of the COSMOS field (Bertoldi et al. 2007), fifteen sources were detected with , five of which do not have a significant radio counterpart ( Jy, 3). From these five radio-faint mm sources, we selected two that were also significantly detected at 1.1 mm with Bolocam: MMJ100016021549 and MMJ100047021018. Hereafter, we refer to these sources as MM1 and MM14, respectively, following Bertoldi et al. (2007). The deboosted flux densities for MM1 were mJy and mJy in the MAMBO and Bolocam maps, respectively (Bertoldi et al. 2007). This source was recently detected with the Large Bolometer Camera (LABOCA) with mJy (Albrecht et al., in preparation). The MAMBO and Bolocam deboosted flux densities for MM14 were mJy and mJy, respectively (Bertoldi et al. 2007), however no significant emission is seen in the LABOCA image down to 10.5 mJy (3).
2.3. SMA 890 m imaging
SMA observations of MM1 and MM14 were carried out in 2009 January 10 and 2009 May 07, respectively, under good weather conditions (). The receivers have two sidebands, each with 2 GHz bandwidth, which when averaged yield a 4 GHz effective bandwidth centered at GHz (m). Seven antennas, arranged in the compact (COM) configuration111half-power beam width (HPBW) ; see http://sma1.sma.hawaii.edu/specs.html for more information. with the MAMBO source positions as phase tracking centers.
The data were calibrated with the MIR package (Scoville et al. 1993) specially adapted for SMA data, using the strong continuum source 3C273 ( Jy) as passband calibrator and Ceres ( Jy) for primary flux calibration. The flux scale is estimated to be accurate within 20%. The quasars J0854201 (3.1 Jy; away) and J1058015 ( Jy; away) were observed every min for gain calibration. Following Younger et al. (2008, 2009, 2010), we also performed hourly scans of a dimmer, but significantly closer test quasar J1008063 ( Jy; away) to empirically verify the phase transfer and estimate the positional uncertainty. The visibility data for MM1 showed good phase stability, however, about half of the data for MM14 had to be flagged due to bad phases.
The calibrated visibility data were imaged using the AIPS software. We used the AIPS task IMAGR, which uses the CLEAN algorithm, and natural weighting to deconvolve the images down to in a box centered on our targets. This led to beam sizes of and and noise levels of mJy and mJy beam-1 for MM1 and MM14, respectively. Finally, fluxes were measured with Gaussian fits using the JMFIT task, included in the AIPS software.
3. Results and Analysis
3.1. SMA detections
Fitting two-dimensional Gaussians to the SMA images, leads to flux densities of mJy and mJy for MM1 and MM14, respectively. The MM14 detection is tentative since, as we shall see below, it could not be reliably identified with any significant counterpart at other wavelengths.
The Gaussian fit indicates that both sources are unresolved with a maximum deconvolved FWHM size of and , respectively, consistent with the sizes found for high-redshift SMGs, which are typically unresolved at resolution (Iono et al. 2006; Younger et al. 2007; Wang et al. 2007; Younger et al. 2009). This also yields from the flatness of the real visibility amplitudes as a function of the projected baseline length. The measured SMA position for MM1 is , , with a positional error in the Gaussian fit of , while for MM14 it is , , with a positional error in the fit of . This positional accuracy in the fit is consistent with the one expected for the beam and S/N of the observations: 0.09″and 0.2″for MM1 and MM14, respectively. From the comparison of the reference (Browne et al. 1998) and measured (this work) positions of the test quasar J1008063, we find a positional uncertainty of . This, added in quadrature to the positional error in the Gaussian fit to the MM1 and MM14 images, gives a positional uncertainty of and , respectively.
3.2. Multi-wavelength counterparts
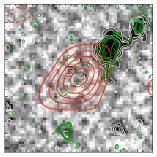
MM1. The SMA peak position coincides with the position of a radio peak (Fig. 1). A bright and elongated source with photometric redshift (Ilbert et al. 2009) is located at 2.1″north-west from the SMA position. The radio peak lies within from the SMA position, however given the beam of the radio image (), we do not discard that part of the emission comes from this bright optical source. From Fig. 2 (left), we identify a very faint -band source, located at from the SMA position, as the likely counterpart. The bright optical source strongly contaminates the Spitzer images, making it difficult to reliably measure the faint emission of MM1. We extracted photometry in the IRAC bands by subtracting this bright source based on the K-band image convolved with the IRAC PSF (Table 1). We do not attempt to extract photometry of this source in the 24 m images. No emission is detected at 70 and 160 m.
The deep -band images show two peaks, separated by about 0.6″, or a physical scale of kpc at (Fig. 2). The fainter peak appears to be the one associated with the submm emission, suggesting a possible double system, similar to the case of the SMG AzTEC11 (Younger et al. 2009).
MM14. The radio maps do not show any peak close to the position of the SMA source down to a level of 30 Jy. At to the north of the SMA position we find a faint optical source that appears diffuse and faint in the -band (Fig. 1). This source has a likely photometric redshift of (Mobasher et al. 2007).
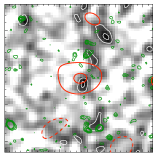
From Fig. 1, the northern optical source appears to be composed by several “clumps” that extend over , or kpc at . We also find a very faint -band emission peak (3 in the smoothed image), located 0.4″ to the south of the SMA position (Fig. 2). This peak has significance in the original -band image (without smoothing; Fig. 1), implying the source is spatially extended. Due to its proximity to the SMA position, it appears to be the most likely counterpart to the submm emission despite its faintness. Hereafter, we refer to this source as MM14S (south), while for the northern optical source we refer as MM14N. However, since we could not reliably identify any significant multi-wavelength counterpart for this source and given the relatively low significance of the SMA detection, we label this source (MM14S) as a tentative detection.
The spatial configuration between MM14S and MM14N could resemble a merger/interaction system, where the submm emission comes from a highly obscured source (MM14S), but could also correspond to an extended galaxy with the submm emission located in an obscured spiral arm. The offset between the MM14N and the submm position (MM14S) is kpc, assuming , similar to the case of the high-redshift SMG GN20 (Iono et al. 2006), where the submm and the optical peaks are separated by , or kpc. Based on the local density of sources with , arcsec-2, we find that the probability that a optical source brighter than MM14N is located by chance within a distance of 1.2″ from the SMA position is only , thus supporting a physical association.
Optical/IR photometry was performed with SExtractor (Bertin & Arnouts 1996) in a 2″ aperture, using the -band images for detection. None of our targets was detected in the Spitzer MIPS bands, and we thus provide upper limits based on their local noise level within one beam. The measured flux densities at several wavelengths for MM1, MM14S and MM14N are listed in Table 1.
3.3. Photometric redshifts
MM1 and MM14S were not detected in the COSMOS catalogs (Capak et al. 2007; Ilbert et al. 2009) and thus there is no previous estimate for their redshift.
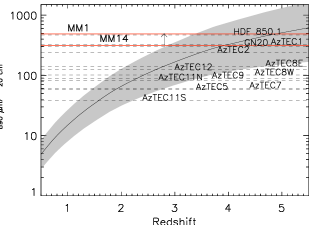
Assuming that the correlation between the far-IR and radio integrated emission from local starburst galaxies also holds for distant galaxies, the submm-to-radio flux ratio can be used as a measure of redshift (Carilli & Yun 1999). Figure 3 shows the 890 m to 20 cm flux ratio as a function of redshift for the prototypical starburst galaxy Arp220, and illustrates the uncertainties introduced by different dust temperatures. From this, we derive a redshift of 4.8 for MM1, and a lower limit for MM14S.
Given the lack of optical/IR photometric information for MM14S, we do not attempt to derive the redshift and dust properties of this source, and hereafter we focus on MM1 and MM14N.
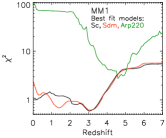
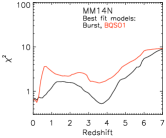
We derived optical/IR photometric redshifts for MM1 and MM14N using the HyperZ code (Bolzonella et al. 2000). We allowed for a redshift range , and using a Calzetti et al. (2000) extinction law with an extinction range . For comparison, we used two different set of templates libraries: 5 solar metallicity stellar population models from Bruzual & Charlot (2003), similar to the HyperZ defaults; and 10 templates from the SWIRE library (Polletta et al. 2007), including models for an elliptical, three spiral, four starburst and three AGN dominated galaxies.
As shown in Fig. 4, the distribution and redshift solutions for MM1 and MM14N obtained using both set of templates are similar. Using the Bruzual & Charlot (2003) templates, the best fit for MM1 is produced at by a spiral galaxy model, with (black curve); while the best fit for MM14N is produced at by a single burst model, with . Using the SWIRE library, the best fits are produced by a late spiral galaxy at and a QSO template at for MM1 and MM14N, respectively. The quoted uncertainties correspond to the 90% confidence level derived from the fitting routine.
Each of the Bruzual & Charlot (2003) templates follow a prescription for the stellar mass to luminosity ratio (e.g. as a function of age). Using the best fits and assuming a Chabrier (2003) initial mass function, we find stellar masses of and , for MM1 and MM14N, respectively. We note, however, that these stellar mass estimates are rough given the large uncertainty in redshift.
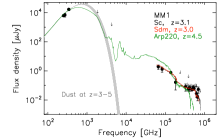
For MM1, we also computed redshifts by fitting templates to the UV-to-mm photometry. We used the same SWIRE templates, redshift and extinction ranges. The best fit is produced by an Arp220 model, with and . The value of is dominated by the ratio between the submm to optical light, indicating a possible range of redshift from 3.0 to 5.0. Our redshift estimates are in good agreement with the redshift implied by the submm to radio flux ratio and supports a higher redshift than that obtained purely from the optical photometry.
3.4. Dust properties
As illustrated in Fig. 4, the far-IR SED of MM1 can be described by a modified black body spectrum. We fitted a model of the form , where is the Planck function. The opacity, , is proportional to the dust mass and to , with the emissivity index . Given the large uncertainties in redshift, we consider a range of redshift to model the photometric data (m).
We find dust temperatures and masses in the range K and . These models imply far-IR luminosities . Using the computed IR luminosities and the Kennicutt (1998) empirical calibration, we compute star-formation rates (SFRs) of yr-1 for this source.
4. Discussion
Our detection of two out of the five significant radio-faint sources discovered in the MAMBO survey of the COSMOS field supports the increasing evidence for a population of luminous SMGs at . It has recently been suggested that these galaxies may be the progenitors of quiescent, massive galaxies at (Capak et al. 2008; Coppin et al. 2009, 2010). The old stellar populations found in these quiescent galaxies require to have formed at in short bursts of star formation.
If we assume that four of these five MAMBO sources with no radio significant radio counterparts are real and located at (e.g., we expect that one of the five is a fake detection due to flux boosting), it implies that up to (4/15) of the mJy detections are located at . This is well justified by the confirmation of MM1 and tentative detection of MM14 with the SMA, and of two other MAMBO sources with LABOCA (Albrecht et al., in preparation). Assuming that of the MAMBO sources are uniformly distributed over the comoving volume spanned by within the area of the MAMBO survey, we find a surface density of deg-2 and a volume density of Mpc-3. This is consistent with the upper limit of Mpc-3 ( deg-2) from the spectroscopically confirmed SMGs (Coppin et al. 2009) and with the density of systems with baryonic masses from predictions of theoretical models (Baugh et al. 2005).
References
- Aravena et al. (2010) Aravena, M., et al. 2010, ApJ, 708, L36
- Barger et al. (1998) Barger, A. J., Cowie, L. L., Sanders, D. B., Fulton, E., Taniguchi, Y., Sato, Y., Kawara, K., & Okuda, H. 1998, Nature, 394, 248
- Baugh et al. (2005) Baugh, C. M., Lacey, C. G., Frenk, C. S., Granato, G. L., Silva, L., Bressan, A., Benson, A. J., & Cole, S. 2005, MNRAS, 356, 1191
- Bertin & Arnouts (1996) Bertin, E. & Arnouts, S. 1996, A&AS, 117, 393
- Bertoldi et al. (2007) Bertoldi, F., et al. 2007, ApJS, 172, 132
- Blain et al. (2004) Blain, A. W., Chapman, S. C., Smail, I., & Ivison, R. 2004, ApJ, 611, 725
- Bolzonella et al. (2000) Bolzonella, M., Miralles, J., & Pelló, R. 2000, A&A, 363, 476
- Browne et al. (1998) Browne, I. W. A., Wilkinson, P. N., Patnaik, A. R., & Wrobel, J. M. 1998, MNRAS, 293, 257
- Bruzual & Charlot (2003) Bruzual, G., & Charlot, S. 2003, MNRAS, 344, 1000
- Calzetti et al. (2000) Calzetti, D., Armus, L., Bohlin, R. C., Kinney, A. L., Koornneef, J., & Storchi-Bergmann, T. 2000, ApJ, 533, 682
- Capak et al. (2007) Capak, P., et al. 2007, ApJS, 172, 99
- Capak et al. (2008) —. 2008, ApJ, 681, L53
- Carilli & Yun (1999) Carilli, C. L., & Yun, M. S. 1999, ApJ, 513, L13
- Chabrier (2003) Chabrier, G. 2003, ApJ, 586, L133
- Chapman et al. (2005) Chapman, S. C., Blain, A. W., Smail, I., & Ivison, R. J. 2005, ApJ, 622, 772
- Condon (1992) Condon, J. J. 1992, ARA&A, 30, 575
- Coppin et al. (2010) Coppin, K., et al. 2010, ArXiv:1004.4001
- Coppin et al. (2009) —. 2009, MNRAS, 395, 1905
- Cowie et al. (2009) Cowie, L. L., Barger, A. J., Wang, W., & Williams, J. P. 2009, ApJ, 697, L122
- Daddi et al. (2009a) Daddi, E., Dannerbauer, H., Krips, M., Walter, F., Dickinson, M., Elbaz, D., & Morrison, G. E. 2009a, ApJ, 695, L176
- Daddi et al. (2009b) Daddi, E., et al. 2009b, ApJ, 694, 1517
- Dannerbauer et al. (2008) Dannerbauer, H., Walter, F., & Morrison, G. 2008, ApJ, 673, L127
- Greve et al. (2005) Greve, T. R., et al. 2005, MNRAS, 359, 1165
- Hughes et al. (1998) Hughes, D. H., et al. 1998, Nature, 394, 241
- Ilbert et al. (2009) Ilbert, O., et al. 2009, ApJ, 690, 1236
- Iono et al. (2006) Iono, D., et al. 2006, ApJ, 640, L1
- Ivison et al. (2007) Ivison, R. J., et al. 2007, MNRAS, 380, 199
- Kennicutt (1998) Kennicutt, Jr., R. C. 1998, ARA&A, 36, 189
- Knudsen et al. (2010) Knudsen, K. K., Kneib, J., Richard, J., Petitpas, G., & Egami, E. 2010, ApJ, 709, 210
- Le Floc’h et al. (2005) Le Floc’h, E., et al. 2005, ApJ, 632, 169
- Michałowski et al. (2010) Michałowski, M. J., Watson, D., & Hjorth, J. 2010, ApJ, 712, 942
- Mobasher et al. (2007) Mobasher, B., et al. 2007, ApJS, 172, 117
- Polletta et al. (2007) Polletta, M., et al. 2007, ApJ, 663, 81
- Schinnerer et al. (2007) Schinnerer, E., et al. 2007, ApJS, 172, 46
- Schinnerer et al. (2008) —. 2008, ApJ, 689, L5
- Scoville et al. (1993) Scoville, N. Z., Carlstrom, J. E., Chandler, C. J., Phillips, J. A., Scott, S. L., Tilanus, R. P. J., & Wang, Z. 1993, PASP, 105, 1482
- Smail et al. (1997) Smail, I., Ivison, R. J., & Blain, A. W. 1997, ApJ, 490, L5+
- Viero et al. (2009) Viero, M. P., et al. 2009, ApJ, 707, 1766
- Wang et al. (2007) Wang, W., Cowie, L. L., van Saders, J., Barger, A. J., & Williams, J. P. 2007, ApJ, 670, L89
- Younger et al. (2007) Younger, J. D., et al. 2007, ApJ, 671, 1531
- Younger et al. (2008) —. 2008, ApJ, 688, 59
- Younger et al. (2009) —. 2009, ApJ, 704, 803
- Younger et al. (2010) —. 2010, ArXiv:1003.4264