Ratios in Higher Order Statistics (RHOS) values of Seismograms for Improved Automatic P-Phase Arrival Detection
Abstract
In this paper we present two new procedures for automatic detection and picking of P-wave arrivals. The first involves the application of kurtosis and skewness on the vector magnitude of three component seismograms. Customarily, P-wave arrival detection techniques use vertical component seismogram which is appropriate only for teleseismic events. The inherent weakness of those methods stems from the fact that the energy from P-wave is distributed among horizontal and vertical recording channels. Our procedure, however, uses the vector magnitude which accommodates all components. The results show that this procedure would be useful for detecting/picking of P-arrivals from local and regional earthquakes and man-made explosions. The second procedure introduces a new method called ”Ratios in Higher Order Statistics (RHOS).” Unlike commonly used techniques that involve derivatives, this technique employs ratios of adjacent kurtosis and skewness values to improve the accuracy of the detection of the P onset. RHOS can be applied independently on vertical component seismogram as well as the vector magnitude for improved detection of P-wave arrivals.
pacs:
91.30.-f, 93.85.RtI INTRODUCTION
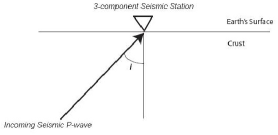
Detection of P-wave arrivals accurately is an important step to make earthquake forecast, to analyze the interior structure of the earth and to study earthquake sources. Picking seismic phase arrivals correctly is also helpful to discriminate between natural earthquakes and man-made explosions. Several P-wave detection techniques utilize only one component of the usually recorded three-component seismogram REF1 . These techniques work very well for the case of teleseismic events (with epicentral distance 3300 km) since seismic P-waves approach the seismic sensors in a nearly vertical incidence (where is the epicentral distance between a seismic station and the seismic epicenter) (Figure 2).
Magotra REF2 attempted to use horizontal component seismograms in order to determine the direction of arrival of seismic waves towards a seismic station. REF3 used kurtosis and skewness of the vertical component seismogram to estimate the P-onset time assuming that the maximum of the derivatives of the kurtosis and skewness curve, just before the curve attains its maximum, is considered to be the time of arrival for the P-wave. Unlike in teleseismic events, the P-wave signal originating from regional (100 km 1400 km) and local distances 200 km) arrive at the seismic station with significant strengths in both horizontal and vertical directions REF2 -REF4 . Since the energy is distributed between the horizontal and the vertical recording channels, both horizontal and vertical component seismograms need to be taken into account for improved detection. In this study the seismic vector magnitude of three component seismograms from a single station is used to determine the P-wave arrival without employing the derivatives of the kurtosis and skewness.
When a P-wave arrives, we can observe a maximum asymmetry of distribution of the vector magnitude of the three-component seismograms. As a result of this asymmetry, maximum values of kurtosis and skewness are expected to occur when a P-wave arrives and this information can be extracted and used for the P-arrival detector. Thus, one essential hypothesis of this study is that the normalized vector magnitude will show very high kurtosis and skewness magnitude when a P-wave arrives. First we perform window-by-window normalization of the vector magnitude to reduce the huge variations in magnitude resulting from the ground motion and obtain a zero-mean normalized vector magnitude for each window. The normalized vector magnitude is then used as input to the detection and picking system. The automatic detection and picking system makes use of the skewness and kurtosis of the input normalized vector magnitude in order to detect the P-arrival. For a sliding time window of the seismic vector magnitude the values of kurtosis and skewness are calculated and the time at which these values become maximum/minimum is used to estimate the time of arrival of the P-wave.
Another important contribution of this study is that unlike some previous studies which are applied only on the vertical component seismogram and used the derivatives within the kurtosis and skewness values for their correction REF3 , our technique uses the ratios within the kurtosis and skewness values rather than the derivative to make a correction in the P-onset time. This new technique supposes that the time for P-onset occurs when the HOS (skewness and kurtosis) values of the vector magnitude begins to change drastically during the course of gaining their maximum values. In the next subsections we discuss the mathematical background of the implemented technique, our proposed methods, results, discussion, and some concluding remarks.
II Rationale and Mathematical Background
II.1 Background for Vector Magnitude and Normalization
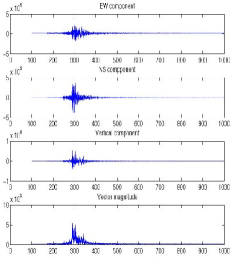
Broadband seismograms represent either the ground velocity or displacement. If the three component seismograms representing the motion of a seismic sensor in the three perpendicular directions have magnitudes x, y and z, where x and y are usually the east-west and north-south components, and z is the vertical component, the magnitude of the resultant velocity/displacement vector v (Figure 1) can be given by
| (1) |
For a sequence of digital seismograms, v can be calculated sample-by-sample as
| (2) |
where n is the nth sample. The angle of incidence for the seismic ray in Figure 2 can be given in terms of x, y, and z component values as
| (3) |
where represents the total horizontal component of the seismic P-wave velocity. For teleseismic earthquakes (events), the P-wave arrives the seismic sensor nearly vertically and thus this angle of incidence is very small. For local and regional earthquakes this angle of incidence becomes significant. The method developed here is an improved version of the P Arrival Identification-Skewness/Kurtosis techniqueREF3 . That method is based on the observation that the noise in the vertical component seismogram shows zero-mean Gaussian behavior until the P-wave arrives. On the other hand, unlike the single components, the seismic vector magnitude, v(n) is always greater than or equal to zero, and it may not show zero mean Gaussian behavior. But we can normalize this vector magnitude on a window-by-window basis not only to have a zero mean Gaussian behavior, but also to better look at the differences in the computed skewness and kurtosis. The normalized vector magnitude is obtained through the following transformation:
| (4) |
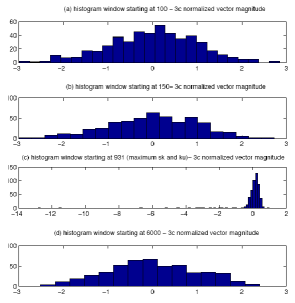
Each normalized variable is a rescaled (transformed) variable of sample for an ith window of mean value and standard deviation . This transformation is linear REF5 . Figure 3 displays the Gaussian behavior of the normalized vector magnitude for a 3-component seismogram. It also shows how the distribution and skewness and kurtosis values for the normalized vector magnitude change drastically when P arrives (Figure 3(c)). As Figure 3 clearly displays, skewness and kurtosis receive much higher values when a P-wave arrival is included in their calculation (Figure 3(c)) as compared to their near-zero values when P-arrival is not included in the sliding window (Figure 3(a),(b), and (d)).
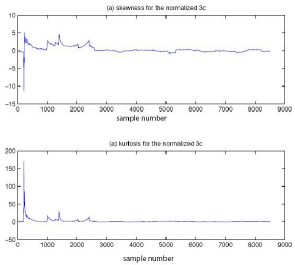
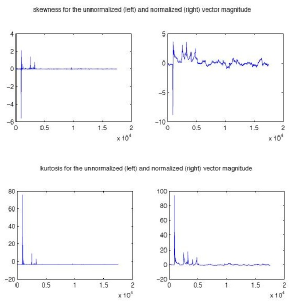
Figure 4 depicts clearly that the kurtosis and skewness values take their peaks just after P-arrives. This normalization process seems to lead to enhancement of differences and sets the limit in the range of variations. Figure 5 shows the enhancement in the maximum values of the quantities under investigation when we apply normalization as compared to the values without normalization.
II.2 Mathematical Background for Higher Order Statistics
Skewness(sk) and kurtosis (ku) for a finite length sequence v(n) are estimated by:
| (5) |
and
| (6) |
Here and are the mean and standard deviation estimates of and is the length of the finite sequence. Generally, HOS values for a Gaussian distribution are zero. In this case, it is demonstrated that the normalized magnitude yields higher HOS values for P-arrival than the values calculated for the background noise and P-wave coda (Figure 3(c)).
III Hypotheses and Procedure
A generalized hypothesis applicable to local and regional events is proposed. This hypothesis is based on the combination of all three-component seismograms in a single station, and it is supposed to outperform those techniques that are based on just a single component seismogram. Following the mathematical equations in section 2, the vector magnitude of three component seismograms for a single station was calculated. This is followed by normalization of N-sample window of the vector magnitude (Eq. 4). While this window slides to the right by one-sample at a time the window next to it is automatically normalized. This normalization continues until the last window is normalized. The skewness and kurtosis of each normalized window were computed.
Pure background noise and the seismic signal away from P-phase arrival follow a Gaussian distribution with nearly zero HOS values. Because of high asymmetry and non-Gaussian distribution introduced by the P-arrival on the Gaussian background noise, the window with P-arrival follows a highly skewed distribution. Maximum (Minimum) HOS values are attained for the window that includes the arrival of the P-onset and just few additional samples of the P-wave coda. Thus, to determine the P-onset time more accurately, a correction scheme is introduced for the additional samples included after the actual P-onset.
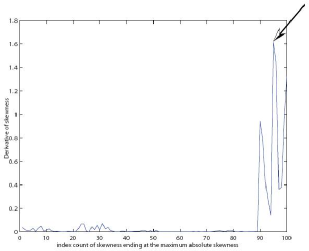
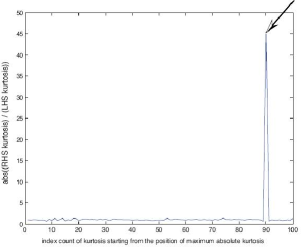
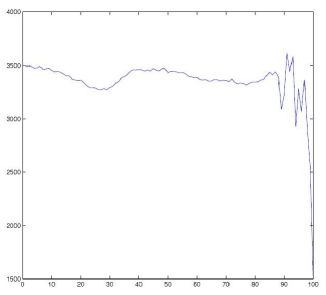
The PAI-S/K method of REF3 , using the vertical component alone, proposes to use the location of the maximum slope as the P-onset time. In this study, however, the P-onset time is taken as the time when the HOS values of the normalized vector magnitude start to increase sharply. The HOS values change drastically when P breaks out from the background noise level during the P-onset. Thus, the magnitude of the ratio of the skewness value on the right-hand-side at the P-onset to the skewness value on the left-hand-side (background noise) should be the maximum of all the ratios within the window. The same is true with the ratio of kurtosis values (Figures 6 to 9).
IV Results and Discussion
IV.1 Experimental Setup
For this particular study, we used seismic data sets obtained from Integrated Research Institutions for Seismology (IRIS) Data Management Center (DMC) depository website. Events from several geological terrains were selected. The seismic networks contributing to the IRIS/DMC which are utilized in this study include the IRIS-PASSCAL Tanzania Broadband Experiment (1994/1995), the Global Seismic Network (GSN), IRIS/USGS network, PFO of the IRIS/IDA, Southern California Seismic Network (SCSN), and Pacific Northwest Seismograph Network (PNSN).
IV.2 Results of the new scheme
Events within regional and local distance range of 50 km to 1400 km were selected. Only broadband seismic data are used in this study. Seismic records with different levels of noise were included. The signal analysis was performed using Matlab 7.6, R2008a (3 GHz Dual-Core Intel mac pro). The performance of the method using the seismogram vector magnitude has been compared to the PAI-S/K (Figures 6 to 9). The improvement of the arrival detection when applying the ratios of HOS values as compared to using just the HOS values directly as in REF3 is clearly shown for both skewness and kurtosis. Further discussion is given in the next subsection. Sizes of sliding window ranging from 30 to 500 samples are found to exhibit best results.
IV.3 Discussion
Comparison with PAI-S/K and other schemes has been made. There are three important differences between the new technique presented in this paper and PAI-S/K REF3 method. The PAI-S/K method is among the many vertical component utilizing methods while our method is a three-component based technique. Though the new technique is applicable to all distance ranges, it is more advantageous for regional and local distance range studies. Another important difference between the PAI-S/K and the new technique is the application of the normalization scheme that helps to reduce the variation in the computed values of skewness and kurtosis from window-to-window.
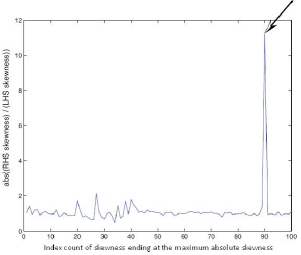
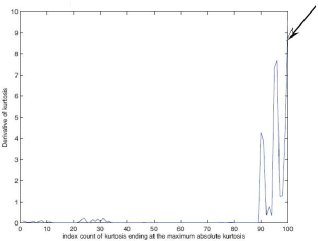
The third difference, which is a striking one, between the PAI-S/K and the technique in this paper is a correction procedure, procedure for making correction to the P-wave arrival time estimate. To the best of our knowledge, this new procedure is introduced in this study for the first time to solve such problems. The absolute value of the ratio of right-hand-side (RHS) to left-hand-side (LHS) HOS values gives a very good estimate of the accurate arrival correction. Saragiotis et al. REF3 PAI-S/K method uses a maximum slope correction procedure. Figures 6 to 9 show a comparison between these two approaches and our results indicate clear improvements when using the absolute values of the ratios of the adjacent values of HOS (abs(RHS/LHS) of HOS values) as compared to using the slope (derivative) of the HOS values. On Figures 6 and 7, the new ratio method for skewness implemented here suggests 11 sample correction while the maximum slope in PAI-S/K method suggests 5 sample correction. On Figures 8 and 9, the ratio approach for kurtosis suggests 11 sample correction while the slope approach of PAI-S/K technique indicate 1 sample correction. The actual correction required can be seen by closely looking at the P-arrival very closely (Figure 10).
Figure 10 indicates that the required correction is 13 samples. Our approach gives not only a much better correction in both kurtosis and skewness cases, but also both skewness and kurtosis give consistent correction values. Like PAI-S/K we suggest to apply both skewness and kurtosis together to detect a P phase arrival. The use of both these statistical quantities instead of just one for detection will constrain and give a better result than using just one of these quantities. The number of false alarms also decreases with the use of the two quantities simultaneously than using just one of them.
V Conclusion
This article has attempted to make use of vector magnitude of three component seismograms in order to improve P-wave arrival detection system. Many single component (usually the vertical component), single-station based methods have been developed for a P-wave arrival detection and picking. Since seismic waves from regional events approach a seismic station (sensor) in a more horizontal incidence than seismic waves from teleseismic events, the energy is generally distributed among the horizontal and vertical recording channels. Thus, it is not only advantageous to develop a method that makes use of all the three components recorded by the single station in a combined form but it also gives the technique more generality. Though the method is applicable to all distance ranges, it is more advantageous for regional and local distance range studies. We investigated the application of the normalization to vector magnitude. In contrast, the HOS values for a P-phase arrival do not improve as compared to other possible seismic phase arrivals which may suggest that normalization may play an important role in the identification of the-more-difficult-to-identify smaller seismic phases.
We have proposed to apply kurtosis and skewness on the combination of three component seismograms for picking P wave arrivals automatically and determined that the method introduced by Saragiotis et al. REF3 can be improved if we use the vector magnitude of seismograms for regional events. This technique makes use of the information from all the three component data as compared to the application of the technique on the single component, vertical, seismogram. The three component seismograms help us determine the magnitude of the total ground motion through their vector magnitude. A new approach for making correction of P-wave arrival time is also proposed and implemented. The absolute value of the ratio of right-hand-side (RHS) to left-hand-side (LHS) HOS values gives a very good estimate of the accurate arrival correction. This has been compared to the derivative (slope) values correction used in the Saragiotis et al. REF3 PAI-S/K method and our results indicate improvements when using abs(RHS/LHS) of HOS values as compared to using the slope of the HOS values.
We also propose to use both skewness and kurtosis together to detect a seismic phase arrival. The use of both these statistical quantities instead of just one for detection will constrain and give a better result than using just one of these quantities. The number of false alarms also decreases with the use of thresholds on both quantities simultaneously than using just one of these two quantities.
This study has indicated that the RHOS technique can be applied on vector magnitude of three component seismograms for improved detection of P-wave arrivals. It is also shown that the new ratio of HOS values technique can be applied just on the vertical component seismograms in lieu of the vector magnitude of three component seismograms and it still gives an improved detection of P-wave arrivals as compared to that of PAI-S/K. This new procedure also provides better detection and picking of P-wave arrivals which is essential for locating earthquake sources more accurately. The source of the earthquake is the point where slippage between the fault surfaces or faulting starts inside the earth. Thus, RHOS would enable us to make more accurate earthquake location using seismic signals. We strongly believe that this new technique has the potential to be applied in a similar fashion for accurate detection and location of fractures in machines or mechanical systems using acoustic signals.
References
- (1) R. V. Allen, ”Automatic earthquake recognition and timing from signal traces,” Bull. Seismol. Soc. Amer., vol. 68, pp. 1521-1532, Oct. 1978.
- (2) N. Magotra, N. Ahmed, and E. Chael, ”Single-station seismic event detection and location,” IEEE Trans. Geosci. Remote Sensing, vol. 27, pp.15-23, 1989.
- (3) Christos D. Saragiotis, Leontios J. Hadjileontiadis, and Stavros M. Panas, (2002). ”PAI-S/K: a robust automatic seismic P Phase Arrival Identification scheme.” IEEE transactions on Geoscience and remote sensing, vol. 40, no. 6, 1395-1404, June 2002.
- (4) Lay, T. and T. C. Wallace. Modern Global Seismology, vol. 58 of International geophysics series. San Diego, Academic Press, 1995.
- (5) Christopher M. Bishop, ”Neural Networks for Pattern Recognition,” 504 pp., 1995.