Reverberation Mapping Measurements of Black Hole Masses in Six Local Seyfert Galaxies
Abstract
We present the final results from a high sampling rate, multi-month, spectrophotometric reverberation mapping campaign undertaken to obtain either new or improved H reverberation lag measurements for several relatively low-luminosity AGNs. We have reliably measured the time delay between variations in the continuum and H emission line in six local Seyfert 1 galaxies. These measurements are used to calculate the mass of the supermassive black hole at the center of each of these AGNs. We place our results in context to the most current calibration of the broad-line region (BLR) – relationship, where our results remove outliers and reduce the scatter at the low-luminosity end of this relationship. We also present velocity-resolved H time delay measurements for our complete sample, though the clearest velocity-resolved kinematic signatures have already been published.
1 INTRODUCTION
The technique of reverberation mapping (Blandford & McKee, 1982; Peterson, 1993) has been used to directly measure black hole masses in relatively local broad-line (Type 1) AGNs for over two decades (see compilation by Peterson et al., 2004). In recent years, these measurements have become particularly desirable with the increasingly strong evidence (both observational and theoretical) that there is a connection between supermassive black hole (BH) growth and galaxy evolution (e.g., Silk & Rees, 1998; Kormendy & Gebhardt, 2001; Häring & Rix, 2004; Di Matteo et al., 2005; Bennert et al., 2008; Somerville et al., 2008; Hopkins & Hernquist, 2009; Shankar et al., 2009). Empirical relationships have been discovered for both quiescent and active galaxies that show similar correlations between the central BH and properties of the bulge of the host galaxy (well outside the gravitational sphere of influence of the black hole). Examples include correlations between the BH mass and total luminosity of stars in the galactic bulge — the – relationship (Kormendy & Richstone, 1995; Magorrian et al., 1998; Wandel, 2002; Graham, 2007; Bentz et al., 2009a) — and between BH mass and the bulge stellar velocity dispersion — the – relationship (Ferrarese & Merritt, 2000; Gebhardt et al., 2000a, b; Ferrarese et al., 2001; Tremaine et al., 2002; Onken et al., 2004; Nelson et al., 2004).
The current thrust to better understand this BH-galaxy connection relies on mass measurements of large samples of black holes in both the local and distant Universe. The masses of BHs in distant galaxies can only be measured indirectly using the scaling relationships mentioned above, as well as the AGN – relationship (Kaspi et al., 2000, 2005; Bentz et al., 2006, 2009b), which provides the capability to estimate BH masses from a single spectrum of an AGN (Wandel et al., 1999). In order to understand the evolution of BH and galaxy growth over cosmological times, it is useful to compare the location of distant galaxies on these relationships with local samples. This can only be done by calibrating the local relation with direct BH mass measurements.
Local masses are measured directly in quiescent galaxies using dynamical methods (see Kormendy & Richstone, 1995; Kormendy & Gebhardt, 2001; Ferrarese & Ford, 2005, for reviews) that rely on resolving the motions of gas and stars within the sphere of influence of the central BH and are thus very resolution intensive and only applicable in the nearby Universe. Direct measurements can also be made from observations of megamasers sometimes seen in Type 2 AGNs, but making these observations relies on a particular viewing angle into the nuclear region of these galaxies and is thus not applicable to large numbers of objects. Direct mass measurements can also be made in Type 1 AGNs using reverberation mapping, which is a method that relies on time resolution to trace the light-travel time delay between continuum and broad emission-line flux variations to measure the characteristic size of the broad line region (BLR). Using virial arguments, this size is related to the black hole mass through the velocity dispersion of the BLR gas, determined from the broad emission-line width. Although reverberation mapping is technically applicable at all redshifts, the reverberation time-delay scales with the AGN luminosity (i.e., the – relationship), and this coupled with time dilation effects make it difficult and particularly time-consuming to make such measurements out to high redshift (see Kaspi et al., 2007).
The constraints for making direct BH mass measurements at large distances make the use of the – relationship particularly attractive for obtaining even indirect mass estimates at all redshifts for which a broad-line AGN spectrum can be obtained. In addition, masses can be estimated for large samples of objects (e.g., McLure & Dunlop, 2004; Kollmeier et al., 2006; Salviander et al., 2007; Shen et al., 2008; Vestergaard et al., 2008), facilitating studies of the BH-galaxy connection and its evolution across cosmic time (e.g., Salviander et al., 2007; Vestergaard & Osmer, 2009). However, in order to reliably apply these relationships to high redshift objects and determine any evolution in the relationships themselves, local versions of the relationships need to be well-populated with high-quality data, so that calibration of these local relationships is secure (i.e., observational scatter minimized) and any intrinsic scatter is well characterized (see, e.g., Bentz et al., 2006, 2009a, 2009b; Graham, 2007; Gültekin et al., 2009; Woo et al., 2010, for recent efforts to improve scaling relation calibration and characterization of intrinsic scatter). Furthermore, systematic uncertainties also need to be understood and minimized so that the local relations, on which all other related studies are based, are as robust as possible. For instance, systematic uncertainties are present in the direct, dynamical mass measurements of the BHs in quiescent galaxies due to model-dependencies of the mass derivation (e.g., Gebhardt & Thomas 2009 find more than a factor of two difference in the measured BH mass in M87 when they include a dark matter halo in their model; see also Shen & Gebhardt 2010 and van den Bosch & de Zeeuw 2010 for more recent model-dependent changes made to previously measured quiescent black hole masses that change the masses by similar amounts, i.e., factors of 2). On the other hand, the reverberation-based masses as we present them (measuring simply the mean BLR radius from the reverberation time-delay) do not rely on any physical models; instead, the largest systematic uncertainty comes from the additional zero-point calibration of the mass scale (Woo et al., 2010). This calibration is needed due to a number of uncertainties, such as the relationship between the line-of-sight (LOS) velocity dispersion measured from the broad-line width and the actual velocity dispersion of the BLR, systematic effects in determining the effective radius, and the role of non-gravitational forces.
In this work, we present new reverberation-mapping measurements of the BLR radius and black hole mass for several nearby Seyfert galaxies from an intensive spectroscopic and photometric monitoring program. The goals of this program are (1) to improve the calibration of local scaling relationships by populating them with not only additional high-quality measurements, but also replace previous measurements of either poor quality or that were suspect for one reason or another, and (2) to take the method of reverberation mapping one step past its currently successful application of measuring BLR radii and BH masses to uncover velocity-resolved structure in the reverberation delays from the H emission line. This velocity-resolved analysis is a first step towards recovering velocity-dependent H transfer functions, or “velocity–delay maps”, which describe the response of the emission-line to an outburst from the ionizing continuum as a function of LOS velocity and light-travel time-delay (for a tutorial, see Peterson, 2001; Horne et al., 2004). Creation of velocity–delay maps provides valuable knowledge of the structure, inclination, and kinematics of the BLR, which in turn will reduce systematic uncertainties in reverberation-based black hole mass measurements.
Our monitoring program spanned more than four months, over which primary spectroscopic observations were obtained nightly (weather permitting) for the first three months at MDM Observatory. Supplementary observations were gathered from other observatories around the world. Objects in our sample were targeted because (a) they had short enough expected lags (i.e., low enough luminosity) that we were likely to see sufficient variability over the course of our 3–4 month campaign to securely measure a reverberation time delay, (b) they appeared as outliers on AGN scaling relationships and/or had large uncertainties associated with previous results due to suspected undersampling or other complications, and (c) previous observations demonstrated the potential for our high sampling-rate observations to uncover a velocity-resolved line response to the continuum variations. We also note that some of the AGNs observed in this program are among the closest AGNs and are therefore the best candidates for measuring the central black hole masses by other direct methods such as modeling of stellar or gas dynamics, which will allow a direct comparison of mass measurements from multiple independent techniques. This paper is arranged such that we present our observations and analysis in Section 2, the black hole mass measurements are described in Section 3, any velocity-resolved structures that we uncovered are presented in Section 4, and our results are discussed in Section 5.
2 Observations and Data Analysis
Except where noted, data acquisition and analysis practices employed here follow closely those laid out by Denney et al. (2009b) for the first results from this campaign on NGC 4051. The reader is also referred to similar previous works, such as Denney et al. (2006) and Peterson et al. (2004), for additional details and discussions on these practices. Throughout this work, we assume the following cosmology: , , and km sec-1 Mpc-1.
2.1 Spectroscopy
Spectra of the nuclear region of our complete111We also monitored MCG 08-23-067, but because this object did not vary sufficiently during our campaign, we did not complete a full reduction and analysis of the data and do not include it as part of our final, complete sample. sample (see Table 1) were obtained daily (weather permitting) over 89 consecutive nights in Spring 2007 with the 1.3 m McGraw–Hill telescope at MDM Observatory, and supplemental spectroscopic observations of most targets were obtained with the 2.6 m Shajn telescope of the Crimean Astrophysical Observatory (CrAO) and/or the Plaskett 1.8 m telescope at Dominion Astrophysical Observatory (DAO) to extend the total campaign duration to 120 nights. We used the Boller and Chivens CCD spectrograph at MDM with the 350 grooves/mm grating (i.e., a dispersion of 1.33 Å/pix) to target the H and [O iii] emission line region of the optical spectrum. The position angle was set to , with a slit width of 50 projected on the sky, resulting in a spectral resolution of 7.6 Å across this spectral region. We acquired the CrAO spectra with the Nasmith spectrograph and SPEC-10 pixel CCD. For these observations a 30 slit was utilized, with a position angle. Spectral wavelength coverage for this data set was from 3800–6000 Å, with a dispersion of 1.8 Å/pix and a spectral resolution of 7.5 Å near 5100 Å. The actual wavelength coverage is slightly greater than this, but the red and blue edges of the CCD frame are unusable due to vignetting. The DAO observations of the H region were obtained with the Cassegrain spectrograph and SITe-5 CCD, where the 400 grooves/mm grating results in a dispersion of 1.1 Å/pix. The slit width was set to 30 with a fixed position angle. This setup resulted in a resolution of 7.9 Å around the H spectral region. Figure 1 shows the mean and rms spectra of our sample based on the MDM observations. Table 2 gives more detailed statistics of the spectroscopic observations obtained for each target, including number of observations, time span of observations, spectral resolution, and spectral extraction window.
A relative flux calibration of each set of spectra was performed using the goodness of fit estimator algorithm of van Groningen & Wanders (1992) to scale relative fluxes to the [O iii] constant narrow-line flux. This algorithm not only makes a multiplicative scaling to account for the night-to-night differences in flux in this line caused primarily by aperture affects, but it also makes slight wavelength shifts to correct for zero-point differences in the wavelength calibration and small resolution corrections to account for small variations in the line width caused by variable seeing. The best-fit calibration is found by minimizing residuals in the difference spectrum formed between each individual spectrum and the reference spectrum, which was taken to be the average of the best spectra of each object (i.e., those obtained under photometric or near-photometric conditions). Because of this multiple-component calibration method, the final, scaled [O iii] line flux in each spectrum is not exactly the same as the reference spectrum. Instead, there is a small standard deviation in the mean line flux due to differences in data quality that averages 1.2% across our sample.
2.2 Photometry
In addition to spectral observations, we obtained supplemental -band photometry from the 2.0 m Multicolor Active Galactic NUclei Monitoring (MAGNUM) telescope at the Haleakala Observatories in Hawaii, the 70 cm telescope of the CrAO, and the 0.4 m telescope of the University of Nebraska. The number of observations obtained from each telescope and the time span over which observations were made of each target are given in Table 3.
The MAGNUM observations were made with the multicolor imaging photometer (MIP) as described by Kobayashi et al. (1998a, b), Yoshii (2002), and Kobayashi et al. (2004). Photometric fluxes were measured within an aperture with radius 83. Reduction of these observations was similar to that described for other sources by Minezaki et al. (2004) and Suganuma et al. (2006), except the host-galaxy contribution to the flux within the aperture was not subtracted and the filter color term was not corrected because these photometric data were later scaled to the MDM continuum light curves (as described below). Also, minor corrections (of order 0.01 mag or less) due to the seeing dependence of the host-galaxy flux were ignored.
The CrAO photometric observations were collected with the AP7p CCD mounted at the prime focus of the 70 cm telescope ( cm). In this setup, the pixels of the CCD field projects to a 15′ 15′ field of view. Photometric fluxes were measured within an aperture diameter of 150. For further details of the CrAO -band observations and reduction, see the similar analysis described by Sergeev et al. (2005).
The University of Nebraska observations were conducted by taking and separately measuring a large number of one-minute images (20). Details of the observing and reduction procedure are as described by Klimek et al. (2004). Comparison star magnitudes were calibrated following Doroshenko et al. (2005a, b) and Chonis & Gaskell (2008). To minimize the effects of variations in the image quality, fluxes were measured through an aperture of radius 80. The errors given for each night are the errors in the means.
2.3 Light Curves
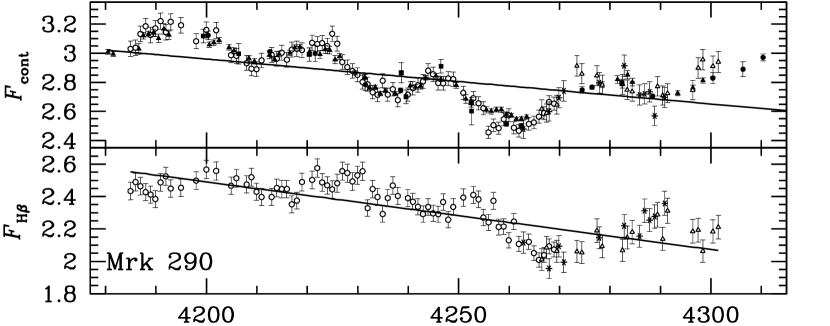
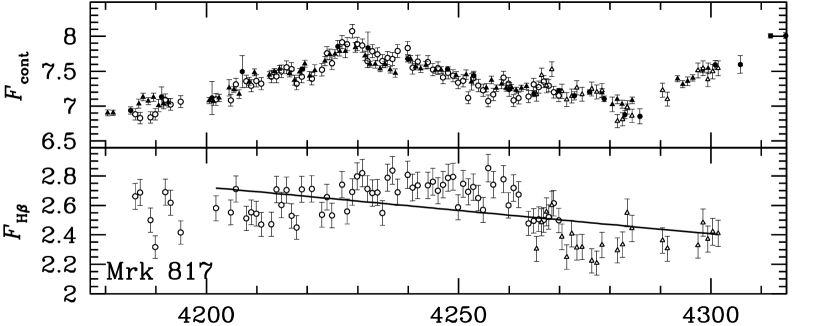
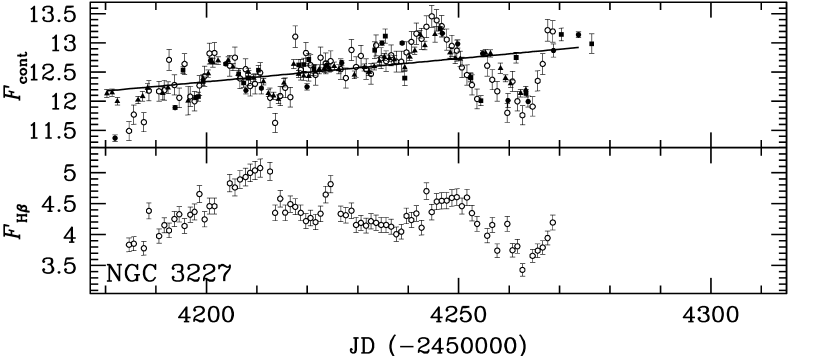
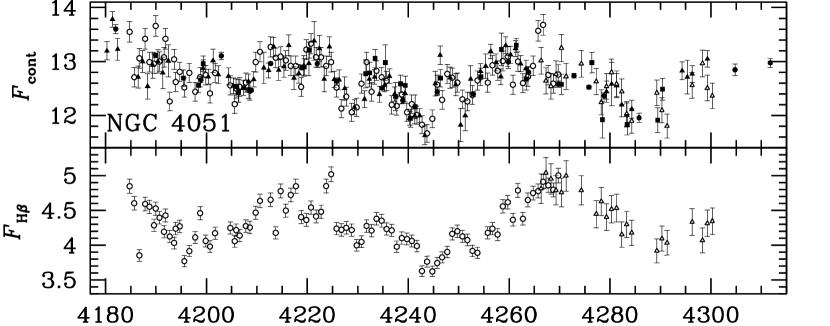
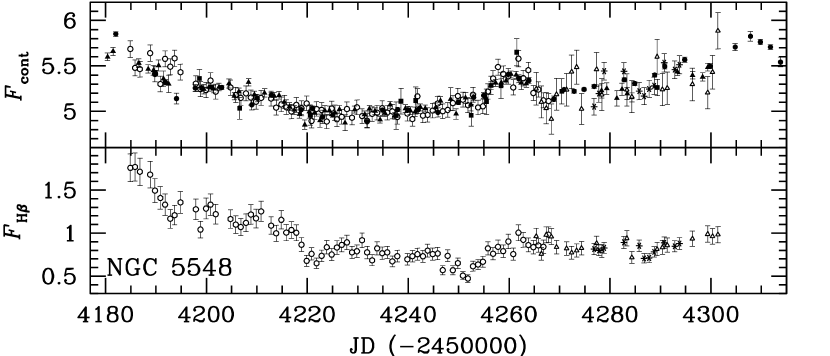
Except where noted below for individual objects, continuum and H light curves were created as followed. Continuum light curves for each object were made with the -band photometric observations and the average continuum flux density measured from spectroscopic observations over the spectral ranges listed in Table 2 (i.e., rest frame 5100 Å). Continuum light curves from each source were scaled to the same flux scale following the procedure described by Denney et al. (2009b). Figure 2 (top panels) shows these merged light curves, where measurements from each different observatory are shown by the different symbols described in the figure caption.
Light curves of the H flux were made by integrating the line flux above a linearly interpolated continuum, locally defined by regions just blueward and redward of the H emission line. The H emission line was defined between the observed frame wavelength ranges given for each object in Table 2. The H light curves formed from each separate spectroscopic data set (i.e., MDM, CrAO, and DAO) were placed on the same flux scale (i.e., that of the MDM observations) by again following the scaling procedures described by Denney et al. (2009b). An additional flux calibration step was used for NGC 3516, however, because it has a particularly extended [O iii] narrow-line emission region. In an attempt to decrease the uncertainties in our relative flux calibration from slit losses of this extended emission, we made an additional correction to each MDM H flux measurement to account for possible differences in the observed [O iii] flux due to seeing effects. To measure the expected differences in [O iii] flux entering the slit as a result of changes in the nightly seeing, we followed the procedure of Wanders et al. (1992), using their artificially seeing-degraded narrow-band image of the [O iii] emission from the nuclear region of NGC 3516 (details regarding the narrow-band data are described by Wanders et al.). Using the differences in measured flux, we scaled our MDM flux measurements accordingly. We could only do this for the MDM measurements, since we do not have accurate seeing estimates for the CrAO and DAO data sets. Because of our deliberately large aperture (see Table 2, Column 8), the effect was not appreciable for most observations, and there is no indication that our inability to complete the same analysis for the CrAO and DAO data had any measurable effect on the subsequent time-series analysis. The lower panels of Figure 2 show the H light curves for each object after merging the separate data sets into a single H light curve.
Before completing the time-series analysis, the light curves shown in Figure 2 were modified in the following ways:
-
1.
An absolute flux calibration was applied to both continuum and H light curves by scaling to the absolute flux of the [O iii] emission line given for each object in Column 3 of Table 4. For objects in which there was not a previously reported absolute flux, we calculated one from the average line flux measured from only those observations obtained at MDM under photometric conditions.
-
2.
The host galaxy starlight contribution to the continuum flux was subtracted. This contribution, listed for each target in Column 5 of Table 4, was determined using the methods of Bentz et al. (2009b) for all objects except Mrk 290, which had not been targeted for reverberation mapping prior to our observing campaign222The 2008 LAMP campaign (Bentz et al., 2009c) subsequently monitored Mrk 290, and it is currently being targeted for HST observations (GO 11662, PI Bentz) to measure its host starlight contribution, but the observations have not yet been completed.. For Mrk 290, we use an estimate made from the spectral decomposition (following decomposition method “B” described by Denney et al. 2009a) of an independent spectrum taken at MDM with nearly the same setup as our campaign observations but covering optical wavelengths from 3500–7150 Å with a 15 slit. This value is only a lower limit, however, since this slit width was smaller than that of our campaign observations (i.e., 50).
-
3.
We “detrended” any light curves in which we detected long-term secular variability over the duration of the campaign that is not associated with reverberation variations (Welsh 1999; see also Sergeev et al. 2007, who show that there is little correlation between long-term continuum variability and H line properties, demonstrating the independence of this variability on reverberation processes). Detrending is important because if the time series contains long-term trends (i.e., compared to reverberation timescales), the flux measurements are not randomly distributed about the mean and are, thus, highly correlated on these long timescales. These long time scale correlations then dominate the results of the cross correlation analysis that determines the time delay, biasing the desired correlation due to reverberation. Welsh (1999) strongly recommends removing these low-frequency trends with low order polynomials (a linear fit at the very least) to improve the reliability of cross correlation lag determinations. We took a conservative approach and only linearly detrended light curves in which there was evidence for secular variability and for which the cross correlation analysis was improved upon detrending: both light curves from Mrk 290, the H light curve from Mrk 817, and the continuum light curve from NGC 3227 (see Section 2.4 for further discussion). These fits are shown in Figure 2 for each of these respective light curves. It was unnecessary to detrend all light curves, as no improvement in the cross correlation analysis would result from detrending light curves that already have a relatively flat mean flux. Also, it is not surprising for associated continuum and line light curves to exhibit different long-term secular trends, since the relationship between the measured continuum and the ionizing continuum responsible for producing the emission lines may not be a linear one (Peterson et al., 2002), and the exact response of the line depends on the detailed structure and dynamics of the BLR.
-
4.
We excluded the points from the Mrk 817 light curve with JD2454200 because (1) there is a large gap in the data between these points and the rest of the light curve, and (2) there is little to no coherent variability pattern seen here (i.e., the continuum is relatively flat and noisy, and the H fluxes are particularly noisy and are of otherwise little use, given there are no continuum points at earlier times).
Tabulated continuum and H fluxes for all objects, except for NGC 4051 which were previously reported by Denney et al. (2009b), are given in Tables 5 and 6, respectively. Values listed represent the flux of each observation after completing all flux calibrations described above (i.e., absolute flux calibration based on the [O iii] emission-line flux and host galaxy starlight subtraction), but before detrending, since this results in an arbitrary flux scale normalized to 1.0. The final calibrated light curves used for the subsequent time-series analysis are shown for each object in the left panels of Figure 3. Statistical parameters describing these calibrated light curves (again, before detrending) are given in Table 7, where Column (1) lists each object. Columns (2) and (3) are mean and median sampling intervals, respectively, between data points in the continuum light curves. The mean continuum flux is shown in column (4), while column (5) gives the excess variance, calculated as
| (1) |
where is the variance of the observed fluxes, is their mean square uncertainty, and is the mean of the observed fluxes. Column (6) is the ratio of the maximum to minimum flux in the continuum light curves. Columns (7–11) display the same quantities as Columns (2–6) but for the H light curves.
2.4 Time-Series Analysis
We performed a cross correlation analysis to evaluate the mean light-travel time delay, or lag, between the continuum and H emission line flux variations. We primarily employed an interpolation scheme (Gaskell & Sparke 1986; Gaskell & Peterson 1987, with the modifications of White & Peterson 1994). Using this method, we first interpolate (with an interval equal to roughly half the median data spacing, i.e., 0.5 day) between points in the emission-line light curve before cross correlating it with the original continuum light curve, calculating cross correlation coefficients, , for many potential lag values (both positive and negative). We then average these cross correlation coefficients with those measured by imposing the same set of possible lag values in the case where we cross correlate an interpolated continuum light curve with the original emission-line light curve. This gives us a distribution of average cross correlation coefficients as a function of possible lags, known as the cross correlation function (CCF). We checked the results from this method with the discrete correlation method of Edelson & Krolik (1988), also employing the modifications of White & Peterson (1994), but we do not show these results here, since they are consistent with our primary cross correlation method, and provide no additional information.
The right panels of Figure 3 show the adopted cross correlation results for each object (i.e., after detrending selected light curves; see below for a discussion of the effect of detrending on this analysis). Here, the auto-correlation function (ACF), computed by cross correlating the continuum with itself, is shown in the top right panel for each object, and the CCF computed by cross correlating the H light curve with that of the continuum, is shown in the bottom right. Because the CCF is a convolution of the transfer function with the ACF, it is instructive to compare the two distributions, as the lag measured through this type of cross correlation analysis will depend not only on the delay map, but also on characteristic time scales of the continuum variations (see, e.g., Netzer & Maoz, 1990). We characterize the time delay between the continuum and emission-line variations by the parameter , the centroid of the CCF based on all points with , as well at the lag corresponding to the peak in the CCF at , . Time dilation-corrected values of and were determined for each object using the redshifts listed in Table 1, i.e., , and are given in Table 8. Uncertainties in both lag determinations are computed via model-independent Monte-Carlo simulations that employ the bootstrap method of Peterson et al. (1998), with the additional modifications of Peterson et al. (2004).
Visual inspection of the CCFs of selected objects before and after detrending was made to determine if detrending these light curves was warranted. Based on the combined properties of the light curves shown in Figure 2 (whether or not an overall slope appeared in the flux across the extent of our campaign) and the CCFs, shown in Figure 4 for Mrk 290, Mrk 817, and NGC 3227 before and after detrending, we ultimately decided to adopt the detrending for the following reasons listed for each object:
Mrk 290 — The top panels of Figure 4 show that before detrending (left), the peak of the CCF is broader than the detrended peak (right) and is blended with an aliased peak at 30 days. Since the reverberation lag is clearly seen in the Mrk 290 light curves in Figures 2 and 3 and the peak of highest significance is the same both before and after detrending, the presence of this alias only acts to decrease the precision of our lag measurements. While is roughly one day smaller after detrending (a difference less than even the measured uncertainty) due to the reduced significance of the aliased peak at 30 days by a factor of almost 10, the detrended CCF is narrower and the measured lags more precise, so we adopt the detrended measurements.
Mrk 817 — The middle panels of Figure 4 show the original (left) and detrended (right) CCFs from the analysis of Mrk 817. The choice to detrend was marginal in this case. The process resulted in a larger observed lag ( days versus ) after detrending, contrary to the typical expectation that lags will be underestimated after detrending (since the process removes low frequency variability). We adopt the detrended results because the resulting CCF is narrower, particularly with respect to lags days, and the resulting lag measurement is more consistent with past results that we hold to be reliable (see Section 5.1).
NGC 3227 — The bottom panels of Figure 4 show the original (left) and detrended (right) CCFs from the analysis of NGC 3227. Here is it obvious that not detrending the light curves results in a non-physical measurement of the lag at -33 days with a broad peak (due to aliasing effects between the features with the highest flux in each of the original continuum and H light curves). While the physical peak (i.e, with positive lag, as seen and measured from the detrended CCF) is present, every lag is of low significance, i.e., 0.4. After detrending, the CCF peak at negative lags is still present, however the ’true’ reverberation signal at a lag of 4 days is rightfully more significant.
3 Black Hole Masses
We assume that the motions of the BLR are dominated by the gravity of the central black hole so that the mass of the black hole can be defined by
| (2) |
Here, is the measured emission-line time delay, so that c represents the BLR radius, and is the BLR velocity dispersion. The dimensionless factor depends on the structure, kinematics, and inclination of the BLR, and we adopt the value of Onken et al. (2004), , determined empirically by adjusting the zero-point of the reverberation-based masses to scale the AGN – relationship to that of quiescent galaxies.
An estimate of the BLR velocity dispersion is made from the width of the Doppler-broadened H emission line. This line width is commonly characterized by either the FWHM or the line dispersion, i.e., the second moment of the line profile. Table 8 gives both FWHM and line dispersion, , measurements from the rms spectra of all objects except Mrk 817, in which the rms profile was not well defined (see Figure 1), and thus we measured the width from the mean spectrum. All widths and their uncertainties were measured employing methods described in detail by Peterson et al. (2004). We removed the narrow-line [O iii] emission and the narrow-line component of H from all objects before these line widths were measured (except for NGC 4051, where this component could not be reliably isolated due to the line profile shape and, in any case, does not affect our rms line width measurements; see Denney et al. 2009b). Flux contributions from the narrow-line component will not contaminate the line widths measured in the rms spectrum (i.e., the narrow-line component does not vary in response to the ionizing continuum on reverberation timescales), so removal of this component was generally unnecessary for most objects in our sample; however, we do so for all objects anyway to check the accuracy of our H to O iii 5007 line ratio determinations (Table 4, column 4) by looking for any significant residual narrow-line emission in the rms spectra of Figure 1. The exception to this is for Mrk 817: since we measured the width in the mean spectrum, it was necessary to remove the narrow-line before measuring the line widths because the narrow-line component will bias (i.e., underestimate) line widths measured in the mean spectrum or in any single-epoch spectrum (see Denney et al., 2009a). Also, for the width measurements in two cases, Mrk 290 and NGC 3227, we narrowed the line boundaries to 4935–5064 Å and 4810–4942 Å, respectively, compared to what was used for the flux measurements, since the rms line profiles of these objects were clearly narrower than their mean profiles (the rms profile is often narrower than the mean profile, which is not surprising, given that likely not all flux seen in the mean spectrum varies in response to the continuum; see, e.g., Korista & Goad 2004).
Black hole masses for all objects, calculated from equation (2), are listed in Table 8 and were calculated using , for the time delay, , and the quoted line dispersion, , for the emission-line width, . This combination of measurements for the line width and reverberation lag is not only appropriate because it is the combination used by Onken et al. (2004) to determine the value of the scale factor, , that we adopt here, but also because Peterson et al. (2004) show that this combination also results in the strongest virial relation between line width and BLR radius, i.e., . The exception to this prescription for the black hole mass calculation is Mrk 817, which has a poorly defined, triple-peaked rms line profile. Because the rms profile is weak and poorly-defined, we measure the line widths from the mean spectrum and use the Collin et al. (2006) calibration of the scale factor determined for the line dispersion measured from the mean spectrum, . Statistical and observational uncertainties have been included in these mass measurements, but intrinsic uncertainties from sources such as unknown BLR inclination cannot be accurately ascertained. We also note here that there has been some debate in the literature as to the importance of radiation pressure on black hole masses calculated using virial assumptions, since the outward radiation force has the same radial dependence as gravity (see Marconi et al., 2008; Netzer, 2009; Marconi et al., 2009). As there is not yet conclusive evidence suggesting a radiation-pressure correction is important for the relatively low Eddington ratio objects we present here, we do not make this correction, but a radiation-pressure corrected mass can be computed from the observables given in Table 8 and the formulae provided by Marconi et al. (2008).
4 Velocity-Resolved Reverberation Lags
The primary cross correlation analysis presented above was intended to measure the average time delay across the full extent of the BLR from which to ascertain the mean, or “characteristic,” radius of the H-emitting region of the BLR to use for calculating black hole masses. For this reason, we utilized the full line flux from which to measure the reverberation signal. However, the BLR is an extended region, and therefore, the light-travel time for the ionizing continuum to reach different volume elements within the BLR will vary across the extent of the emitting region. The expectation is then that the responding BLR gas variations will lag the continuum variations on slightly different time scales as a function of the line of sight velocity. Measuring and mapping these slight differences in the BLR response time across velocity space recovers the transfer function, which is easily visualized as a velocity–delay map (see Horne et al., 2004). Recovering an unambiguous velocity–delay map is a continuing goal of reverberation mapping analyses, as the construction and analysis of such a map is our best hope, with current technology, of gaining insight into the geometry and kinematics of the BLR.
The construction and analysis of full two-dimensional velocity–delay maps is beyond the scope of this work and remains the focus of future research. However, we do present a more simple reconstruction of the velocity-dependent reverberation signal, observed across the H emission line region when we divide the line flux into eight velocity-space bins of equal flux. These results for NGC 4051, NGC 3516, NGC 3227, and NGC 5548 have been previously published (Denney et al., 2009b, c) but are included again here for completeness. Line boundaries are the same as those used in the full line analysis, except where noted in Table 2. In these cases the narrowed boundaries given above for Mrk 290 were used, and a discussion of the difference in boundary choices for the other objects is presented by Denney et al. (2009c). Light curves were created from measurements of the integrated H flux in each bin and then cross correlated with the continuum light curve following the same procedures described above. Figure 5 shows the results of this analysis for all objects, where the top panel shows the division of each rms H line profile into the eight velocity bins, and the bottom panels shows the lag measurements and uncertainties for each of these bins. Error bars in the velocity direction represent the bin width. We see a variety of velocity-resolved responses that we discuss in further detail below.
5 Discussion
5.1 Comparison with Previous Results
Some of the objects in this campaign were targeted, at least in part, because they have previously appeared as outliers on AGN scaling relationships, in particular, the – relationship. As such, all objects except Mrk 290 have previous reverberation results, several of which were suspect for one reason or another and warranted re-observation. Based on the outcomes of the current analysis, we will group our results into three categories: (1) new measurements for an object never before targeted, i.e., Mrk 290, (2) replacement measurements for objects that had uncertain results (typically due to undersampling) and for which our results completely replace any previous measurements of the H reverberation lag, i.e., NGC 3227, NGC 3516, and NGC 4051, and (3) additional measurements of objects for which we already trust the previous lag measurements, i.e., NGC 5548 and Mrk 817. In this context, we can compare our new results to previously published results.
5.1.1 New Measurements
At the time of our campaign (first half of 2007), reverberation mapping had never before targeted Mrk 290. However, in 2008 LAMP also monitored Mrk 290 for a reverberation analysis (see Bentz et al., 2009c), although they were unable to recover an unambiguous reverberation lag measurement from their data because Mrk 290 exhibited little variability during their campaign. Therefore, the results we present here are the only reverberation measurements of this object.
5.1.2 Replacement Measurements
Our current measurements of NGC 3227, NGC 3516, and NGC 4051 should completely supersede previous results measuring a reverberation radius based on H and the black hole mass. A thorough comparison between our new measurement of the BLR radius of NGC 4051 and that from past studies is discussed by Denney et al. (2009b), and the reader is referred to this work for details. However, the main conclusion of that comparison is that the light curves from which previous measurements of the lag were made (e.g., Peterson et al., 2000) were undersampled, leading to an overestimate of the lag. Our current study remedied this problem with a much higher sampling rate, routinely obtaining more than one observation per day.
Previous reverberation lag measurements of the H-emitting region in NGC 3227 (Salamanca et al., 1994; Winge et al., 1995; Onken et al., 2003) were reanalyzed by Peterson et al. (2004). The H light curves of Salamanca et al. (1994) from a Lovers of Active Galaxies (LAG) campaign were undersampled, and they do not even attempt to measure a time delay from them. Winge et al. (1995) report an H lag of days from observations taken during a period in which the optical luminosity was only 0.3 dex larger than our current observations (i.e., a change in radius of 40% is expected from such a change in luminosity, based on a – relationship slope of 0.5). However, their average and median sampling intervals were 6 and four days, respectively, which is marginally sampled compared to what is needed for this low luminosity source. These early reverberation campaigns did not have the benefit of the predictive power that we currently have with the – relationship to use for planning campaign observations; i.e., these campaigns were fundamentally exploratory. A reanalysis of the LAG consortium data presented by Salamanca et al. (1994) was conducted by Onken et al. (2003) using the van Groningen & Wanders (1992) algorithm to reduce uncertainties in the relative flux calibration of the spectra. Onken et al. found an H lag of days, consistent with the results of Winge et al. (1995). Later, Peterson et al. (2004) also re-analyzed the CTIO data presented by Winge et al. (1995) with the van Groningen & Wanders (1992) algorithm and further re-examined the LAG data rescaled by Onken et al. (2003). This reanalysis resulted in some improvement in the H lag determinations and uncertainties, i.e., smaller overall lags, however, the reanalyzed values still had large uncertainties, resulting in a measurement consistent with zero lag: days and days for the CTIO and LAG data sets, respectively (Peterson et al., 2004). It is clear that our new measurement of the H lag in NGC 3227 of days should supersede these past results.
Likewise, the previous reverberation data for NGC 3516 also came from a LAG consortium campaign, also with a sampling interval of 4 days (Wanders et al., 1993). Since the lag for this object was at least larger than the sampling rate, the undersampling was not as severe a handicap as for other objects in our sample, such as NGC 4051 and NGC 3227. Thus, reanalysis of the LAG data first by Onken et al. (2003) and then by Peterson et al. (2004) measure lags of days and days, respectively, that are consistent with the original analysis by Wanders et al., who measure the peak H lag to be days, with the centroid of the CCF yielding a radius of 11 light days. All of these centroid measurements are consistent with our new measurement of days. Also, the LAG spectra were obtained through a narrow (20) slit; as the narrow-line region in this object is partially resolved, it was necessary to make seeing-dependent corrections to the continuum and emission-line measurements (Wanders et al., 1992) that are both large and uncertain. For our new measurements, the aperture corrections are small and have a negligible effect on the final results; the seeing-corrected and uncorrected fluxes differ by, on average, , which is smaller than the standard deviation of our relative flux scaling of 1.6% for NGC 3516. Clearly, our new observations with an approximately daily sampling rate show great improvement over past campaigns, for these objects, and the results presented here should supersede past values of the H lag measured for NGC 3227, NGC 3516, and NGC 4051.
5.1.3 Additional Measurements
The goals of this campaign were not only to re-observe outliers or objects with highly uncertain lag measurements but also to explore the possibility of uncovering velocity-resolved kinematic signatures and eventually reconstruct velocity–delay maps. Therefore, we also monitored two objects, NGC 5548 and Mrk 817, for which previous reverberation mapping results are solid, and lags measured from this campaign are simply to be considered additional measurements of the BLR radius. Reasons for making repeat reverberation measurements of AGNs include (1) exploring the radius-luminosity relationship in a single source, (2) checking the repeatability of the mass measurements for AGNs at different times, in different luminosity states, and with different line profiles, and (3) testing different characterizations of the line width (i.e., determining what line width measure leads to the most repeatable mass value). The mean lag and black hole mass results presented here for NGC 5548 are consistent with past results, taking into account the luminosity state of NGC 5548 during our campaign compared with other campaigns (i.e., NGC 5548 has been in a low luminosity state for the past several years, but the measured lags have been consistently smaller, as expected for this low state; also see Bentz et al. 2007, 2009c).
We also monitored Mrk 817, which is the highest luminosity object in our present sample. Previous measurements of the H radius were made by Peterson et al. (1998) from an eight-year campaign to monitor nine Seyfert 1 galaxies. From this campaign, they separately measured the lag from three different observing seasons. The reanalysis of this data by Peterson et al. (2004) resulted in rest-frame measurements of , , and days. Bentz et al. (2009b) calculate a weighted average of log from these three measurements of (converted back to linear space) days at an average luminosity of to use in calibrating the – relationship. The luminosity of Mrk 817 during our campaign was only about 0.1 dex higher than the weighted average luminosity quoted by Bentz et al., and our measured lag of days is highly consistent with the shortest lag of Peterson et al. and marginally consistent with the 19.0 day lag and the weighted average. Furthermore, the virial mass that we measure (see Column 8 of Table 8) is also consistent with those given by Peterson et al. (2004). Unfortunately, we were not able to improve on the uncertainties associated with these measurements, as our H light curve for this object was rather noisy (see Figures 2 and 3), which decreases the certainty with which we are able to trace the reverberated continuum variations in the line light curve. Since there was neither an improvement over nor a discrepancy with past measurements, this new result is simply added to past results as an additional measurement of the H-based BLR radius and in Mrk 817.
5.2 The BLR Radius Luminosity Relationship
To investigate the outcome of our goal to improve the calibration of scaling relations by re-examining objects that had large measurements uncertainties and/or that appeared as outliers on these scaling relationships, we place our new measurements in context to the – relationship most recently calibrated by Bentz et al. (2009b). Luminosities were measured from the average, host-corrected continuum flux density measured within the 5100 Å rest-frame continuum windows listed for each object in Table 2. For most objects, we simply corrected for Galactic reddening along the line of sight (Schlegel et al., 1998); however, NGC 3227 and NGC 3516 show evidence of internal reddening that must be taken into account in determining the luminosity. Gaskell et al. (2004) argue that the UV-optical continua of AGNs are all very similar, so that the reddening can be estimated by dividing the spectrum of a reddened AGN by the spectrum of an unreddened AGN. In the case of NGC 3227, we use the value of determined by Crenshaw et al. (2001) by comparing the UV-optical spectrum of NGC 3227 to the unreddened spectrum of NGC 4151. For NGC 3516, we consider two methods for estimating the reddening, which result in consistent estimates of : (1) we follow the Crenshaw et al. method, comparing the spectrum of NGC 3516 again to that of NGC 4151, which results in , and (2) we use the Balmer decrement measured from the broad components of the H and H emission lines to estimate a reddening of . These two values are highly consistent, and we adopt the average between the two methods of . Our measured luminosities are given in Column 9 of Table 8, where the uncertainties in the luminosities are the standard deviation in the continuum flux over the course of the campaign, except for NGC 4051, where the uncertainty in the distance is added in quadrature to this (see Denney et al., 2009b).
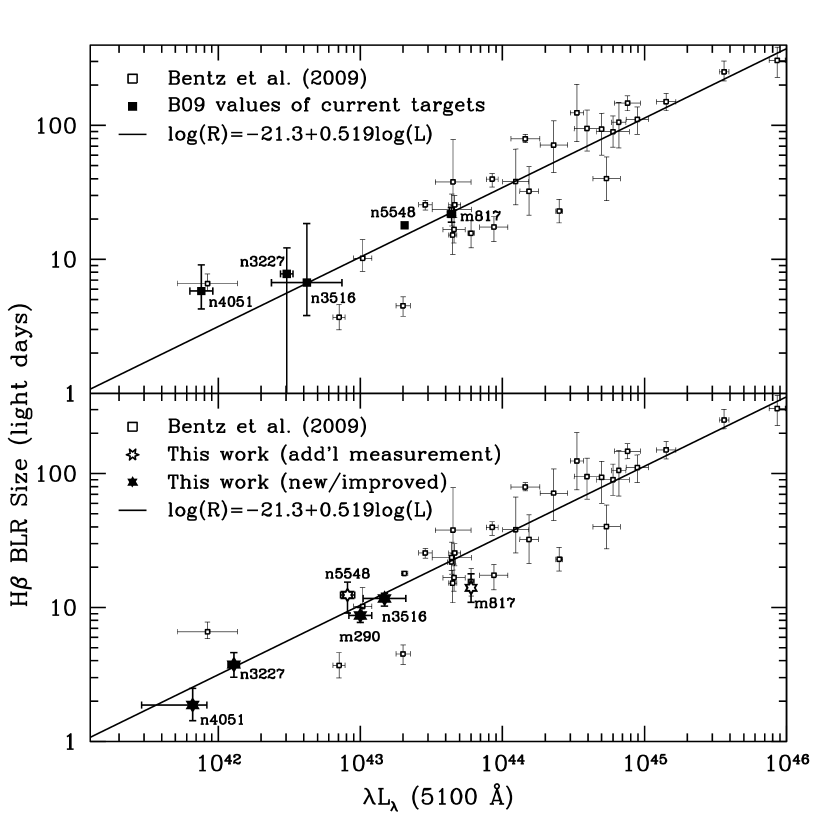
The top panel of Figure 6 shows the Bentz et al. (2009b) – relationship, reproduced from the bottom panel of their Figure 5. Here, we have differentiated the objects targeted for our present campaign with solid squares, while all other objects presented by Bentz et al. are open squares. The bottom panel of Figure 6 shows our current results, where the objects for which our new measurements are either truly new (i.e., Mrk 290) or have become replacements for old values are shown by the solid stars, and we no longer plot the old values. Our additional measurements for NGC 5548 and Mrk 817 are shown with the open stars, and the previous weighted average lags and luminosities for these objects as reported by Bentz et al. are still present in this bottom panel. The reader should immediately notice the increased precision and accuracy of our new and replacement measurements, where it is important to note that we have not determined a new fit to the data333Re-evaluating the fit to and scatter in this relationship is outside the scope of this paper but is planned for future work that will include all new, relevant data (see, e.g., Bentz et al., 2009c).. Clearly, these better measurements emphasize the small intrinsic scatter in this relationship, reinforcing the apparently homologous nature of AGNs, even over many orders of magnitude in luminosity. The results from this campaign also support the conclusion of Peterson (2010) that improving this relationship further will not come from simply obtaining more BLR radii measurements to “beat down” the noise, but rather, from more reliable, higher-precision measurements.
5.3 Velocity-Resolved Results
The cleanest cases of a velocity-resolved reverberation response are for NGC 3516, NGC 3227, and NGC 5548, where we see kinematic signatures indicating apparent infall, outflow, and non-radial, or “virialized,” motions, respectively. Denney et al. (2009c) discuss the velocity-resolved results for these three objects and the implications of these different kinematic signatures in the context of our overall understanding of the BLR and the use of BLR radii measurements for determining black hole masses. In addition, Denney et al. (2009b) present and discuss the marginally velocity-resolved lags shown here for NGC 4051, and so those results are not discussed further here.
The objects not discussed in previous publications are Mrk 290 and Mrk 817. Figure 5 shows that there is very little variation in the reverberation lag across the full width of the Mrk 290 line profile, indicating that any differences in the reverberation lag across the extent of the H-emitting region in this object were unresolvable with the sampling rate of our campaign. An additional possibility for the uniform response we observed (i.e., small range in lags and no short lags observed) could be that the highest velocity gas seen in the wings of the mean spectrum is optically thin, and therefore does not respond to the continuum variations. This is supported by the narrowness of the H profile in the rms spectrum compared to that observed in the mean spectrum. On the other hand, based on the relative emission-line strengths of the high-velocity wings in several AGNs, Snedden & Gaskell (2007) argue against this interpretation.
At first glance, Mrk 817 appears to show an outflow signature similar to that of NGC 3227, however, cross correlation between the continuum light curve and those derived from the line flux in the first four velocity bins actually results in lag determinations that are, though negative, largely consistent with zero lag. Ignoring these first bins gives results similar to Mrk 290, where no velocity-dependent differences in the lags are resolved. Taken at face value, this result is curious. We present binned light curves of the Mrk 817 line profile in Figure 7, where to increase the clarity of the discrepancy between the red and blue sides of the line for this discussion, we have combined sets of two bins to make a total of 4 bins instead of eight, i.e., we plot the flux from bin 1 added to that of bin 2, bin 3 added to bin 4, etc. For completeness we also recompute the CCFs (also shown in Fig. 7) and velocity-resolved lag measurements for these four combined bins and find results consistent with simply taking the average of the lags of each set of two bins that we combined, though the uncertainties in the newly measured lags are generally smaller, particularly for the bluest and reddest bins. Upon inspection of the individual light curves for these bins, it becomes apparent that the cross correlation analysis for these bins essentially failed, not finding a strong correlation between the continuum flux variability and that seen in the light curves of Bin 1 and Bin 2. The light curves show a lack of variability in the flux in these bins during the first half of the campaign, and then a fairly monotonic rise in flux during the second half, so the peak in the continuum flux seen near JD2454230 is not seen in the light curves of Bins 1 and 2, and instead, the feature the cross correlation analysis picks up is the trough near JD2454282, apparently seen in the Bins 1 and 2 light curves 8–10 days earlier. This combination causes the cross correlation analysis to give unreliable results. Furthermore, no real indication of the expected positive lag can been seen by eye, as can with the other bins (and other objects, for that matter). The observations could be explained by some gas having an unresolved velocity structure near the mean radius measured for this object and there also being an outflowing component in the BLR of this object, so that the blue-shifted gas is primarily along line of sight and a resulting zero day lag is measured. However, given that (1) the overall variability observed in this object was small during this campaign, and (2) the H profile is very broad, leading to a small variability signal spread over a large wavelength range, we cannot make any strong conclusions at this time. Future efforts will be made both to glean further information from the velocity–delay map reconstructed from our current data as well as to re-analyze the previous monitoring data on this object in an attempt to search for any other indications of velocity-resolved signatures.
Despite the differences we see in the velocity-resolved kinematics across our sample of objects, we do not believe that there is cause for concern for the masses derived from the mean BLR radii measured from these reverberation lags. Obviously, observing unresolved, virial, or infalling gas motions certainly does not question the validity of our assumption that the BLR motions are gravitationally dominated, but indications of outflow may be more problematic. However, even given these signatures, the mean lag we measure is still consistent with lags derived from the majority of the emission-line gas. Besides, it is only gas outflowing at velocities larger than the escape velocity that would break the validity of our assumptions, and this does not seem to be the case. There are good observational and theoretical reasons to believe that there are multiple components within the BLR (e.g., disk and wind components), and the disk-wind model of Murray et al. (1995), for example, is still able to justify the constraint of the black hole mass by the reverberation mapping radii measurements, even with the presence of a wind (see Chiang & Murray, 1996).
From velocity-resolved studies such as the one discussed here and in our previous publications on this data set (Denney et al., 2009b, c), it is clear that high-cadence reverberation mapping studies are beginning to push the envelope with respect to the amount of information we are able to glean from data of high quality and homogeneity. The next goal is to attempt a reconstruction of the velocity-resolved transfer function through the production of velocity–delay maps, with priority placed on the objects shown here and discussed by Denney et al. (2009c) that exhibit statistically significant kinematic signatures of infall, outflow, and virialized motions (NGC 3516, NGC 3227, and NGC 5548, respectively). Preliminary results from this analysis show the potential to reveal the types of structured maps that will hopefully provide additional constraints on future models of the BLR and more clearly reveal distinct kinematic structures responsible for the velocity-resolved signatures we presented here.
6 Conclusion
We have reported the results for our complete sample of six local Seyfert 1 galaxies that were monitored in a reverberation mapping campaign that aimed to remeasure the BLR radius from H emission in objects that previously had poor measurements (large measurement uncertainties and/or undersampled light curves) or that were targeted with the aim of recovery of velocity-resolved reverberation lag signals and/or transfer functions. Based on the measured luminosities of our sample over the course of our 4 month campaign, we measure H lags that are in excellent agreement with the expectations of the most recent calibration of the – relationship of Bentz et al. (2009b).
Combining these lag measurements with velocity dispersion measurements estimated from the width of the broad H emission line, we make direct black hole mass measurements for our entire sample. Based on a comparison of our results with previous measurements (where available), most of our sample constitutes results that are either entirely new (Mrk 290) or supersede past measurements (NGC 3227, NGC 3516, and NGC 4051). However, for NGC 5548 and Mrk 817, we compared our current mass measurements with past results and find them consistent within the measurements uncertainties, and therefore, place these results under the category of “additional measurements” for these objects.
An additional goal of this campaign was to determine velocity-resolved reverberation lags across the extent of the H-emitting region of the BLR for use in future efforts to recover velocity–delay maps to help constrain the geometry and kinematics of the BLR. Though the velocity structure in some of our targets remained unresolved on sampling-rate-limited time scales, we still found some statistically significant and kinematically diverse velocity-resolved signatures, even within this small sample. We see indications of apparent infall, outflow, and virialized motions, which, if taken at face value, would indicate that the BLR is a complicated region that differs from object to object. However, given the small scatter in the – relation and the consistency with which we are able to measure the BLR radius and black hole mass in multiple objects across dynamical time scales (e.g., NGC 5548 and Mrk 817), it is unlikely that the steady-state dynamics within this region are truly this diverse. The BLR could be made up of multiple kinematic components with possible transient features such as winds and/or warped disks that travel through the line of sight to the observer over dynamical timescales. In such a scenario, evidence for different types of kinematic signatures would arise depending on the observer’s line of sight through this region at a given time. In order to quantify such possibilities and fit models to the velocity-resolved data, it is necessary to collect more velocity-resolved reverberation mapping results for these objects, as well as others. This remains a goal for future observing programs, and efforts are focused on recovering velocity–delay maps for the current sample. Similar efforts are being made by the LAMP consortium (M. Bentz, priv. comm.) with the sample presented by Bentz et al. (2009c), increasing our probability of success for this elusive goal of reverberation mapping.
References
- Bennert et al. (2008) Bennert, N., Canalizo, G., Jungwiert, B., Stockton, A., Schweizer, F., Peng, C. Y., & Lacy, M. 2008, ApJ, 677, 846
- Bentz et al. (2009a) Bentz, M. C., Peterson, B. M., Netzer, H., Pogge, R. W., & Vestergaard, M. 2009a, ApJ, 697, 160
- Bentz et al. (2009b) Bentz, M. C., Peterson, B. M., Pogge, R. W., & Vestergaard, M. 2009b, ApJ, 694, L166
- Bentz et al. (2006) Bentz, M. C., Peterson, B. M., Pogge, R. W., Vestergaard, M., & Onken, C. A. 2006, ApJ, 644, 133
- Bentz et al. (2007) Bentz, M. C., et al. 2007, ApJ, 662, 205
- Bentz et al. (2009c) —. 2009c, ApJ, 705, 199
- Blandford & McKee (1982) Blandford, R. D., & McKee, C. F. 1982, ApJ, 255, 419
- Chiang & Murray (1996) Chiang, J., & Murray, N. 1996, ApJ, 466, 704
- Chonis & Gaskell (2008) Chonis, T. S., & Gaskell, C. M. 2008, AJ, 135, 264
- Collin et al. (2006) Collin, S., Kawaguchi, T., Peterson, B. M., & Vestergaard, M. 2006, A&A, 456, 75
- Crenshaw et al. (2001) Crenshaw, D. M., Kraemer, S. B., Bruhweiler, F. C., & Ruiz, J. R. 2001, ApJ, 555, 633
- Denney et al. (2009a) Denney, K. D., Peterson, B. M., Dietrich, M., Vestergaard, M., & Bentz, M. C. 2009a, ApJ, 692, 246
- Denney et al. (2006) Denney, K. D., et al. 2006, ApJ, 653, 152
- Denney et al. (2009b) —. 2009b, ApJ, 702, 1353
- Denney et al. (2009c) —. 2009c, ApJ, 704, L80
- Di Matteo et al. (2005) Di Matteo, T., Springel, V., & Hernquist, L. 2005, Nature, 433, 604
- Doroshenko et al. (2005a) Doroshenko, V. T., Sergeev, S. G., Merkulova, N. I., Sergeeva, E. A., Golubinsky, Y. V., Pronik, V. I., & Okhmat, N. N. 2005a, Astrophysics, 48, 156
- Doroshenko et al. (2005b) —. 2005b, Astrophysics, 48, 304
- Edelson & Krolik (1988) Edelson, R. A., & Krolik, J. H. 1988, ApJ, 333, 646
- Ferrarese & Ford (2005) Ferrarese, L., & Ford, H. 2005, Space Science Reviews, 116, 523
- Ferrarese & Merritt (2000) Ferrarese, L., & Merritt, D. 2000, ApJ, 539, L9
- Ferrarese et al. (2001) Ferrarese, L., Pogge, R. W., Peterson, B. M., Merritt, D., Wandel, A., & Joseph, C. L. 2001, ApJ, 555, L79
- Gaskell et al. (2004) Gaskell, C. M., Goosmann, R. W., Antonucci, R. R. J., & Whysong, D. H. 2004, ApJ, 616, 147
- Gaskell & Peterson (1987) Gaskell, C. M., & Peterson, B. M. 1987, ApJS, 65, 1
- Gaskell & Sparke (1986) Gaskell, C. M., & Sparke, L. S. 1986, ApJ, 305, 175
- Gebhardt & Thomas (2009) Gebhardt, K., & Thomas, J. 2009, ApJ, 700, 1690
- Gebhardt et al. (2000a) Gebhardt, K., et al. 2000a, ApJ, 539, L13
- Gebhardt et al. (2000b) —. 2000b, ApJ, 543, L5
- Graham (2007) Graham, A. W. 2007, MNRAS, 379, 711
- Gültekin et al. (2009) Gültekin, K., Richstone, D. O., Gebhardt, K., Lauer, T. R., Tremaine, S., Aller, M. C., Bender, R., Dressler, A., Faber, S. M., Filippenko, A. V., Green, R., Ho, L. C., Kormendy, J., Magorrian, J., Pinkney, J., & Siopis, C. 2009, ApJ, 698, 198
- Häring & Rix (2004) Häring, N., & Rix, H. 2004, ApJ, 604, L89
- Hopkins & Hernquist (2009) Hopkins, P. F., & Hernquist, L. 2009, ApJ, 694, 599
- Horne et al. (2004) Horne, K., Peterson, B. M., Collier, S. J., & Netzer, H. 2004, PASP, 116, 465
- Kaspi et al. (2007) Kaspi, S., Brandt, W. N., Maoz, D., Netzer, H., Schneider, D. P., & Shemmer, O. 2007, ApJ, 659, 997
- Kaspi et al. (2005) Kaspi, S., Maoz, D., Netzer, H., Peterson, B. M., Vestergaard, M., & Jannuzi, B. T. 2005, ApJ, 629, 61
- Kaspi et al. (2000) Kaspi, S., Smith, P. S., Netzer, H., Maoz, D., Jannuzi, B. T., & Giveon, U. 2000, ApJ, 533, 631
- Klimek et al. (2004) Klimek, E. S., Gaskell, C. M., & Hedrick, C. H. 2004, ApJ, 609, 69
- Kobayashi et al. (2004) Kobayashi, Y., Yoshii, Y., & Minezaki, T. 2004, Astronomische Nachrichten, 325, 537
- Kobayashi et al. (1998a) Kobayashi, Y., Yoshii, Y., Peterson, B. A., Minezaki, T., Enya, K., Suganuma, M., & Yamamuro, T. 1998a, in Proc. SPIE, Vol. 3354, 769–776
- Kobayashi et al. (1998b) Kobayashi, Y., et al. 1998b, in Proc. SPIE, Vol. 3352, 120–128
- Kollmeier et al. (2006) Kollmeier, J. A., et al. 2006, ApJ, 648, 128
- Korista & Goad (2004) Korista, K. T., & Goad, M. R. 2004, ApJ, 606, 749
- Kormendy & Gebhardt (2001) Kormendy, J., & Gebhardt, K. 2001, in American Institute of Physics Conference Series, Vol. 586, 20th Texas Symposium on relativistic astrophysics, ed. J. C. Wheeler & H. Martel, 363–381
- Kormendy & Richstone (1995) Kormendy, J., & Richstone, D. 1995, ARA&A, 33, 581
- Magorrian et al. (1998) Magorrian, J., et al. 1998, AJ, 115, 2285
- Marconi et al. (2008) Marconi, A., Axon, D. J., Maiolino, R., Nagao, T., Pastorini, G., Pietrini, P., Robinson, A., & Torricelli, G. 2008, ApJ, 678, 693
- Marconi et al. (2009) Marconi, A., Axon, D. J., Maiolino, R., Nagao, T., Pietrini, P., Risaliti, G., Robinson, A., & Torricelli, G. 2009, ApJ, 698, L103
- McLure & Dunlop (2004) McLure, R. J., & Dunlop, J. S. 2004, MNRAS, 352, 1390
- Minezaki et al. (2004) Minezaki, T., Yoshii, Y., Kobayashi, Y., Enya, K., Suganuma, M., Tomita, H., Aoki, T., & Peterson, B. A. 2004, ApJ, 600, L35
- Murray et al. (1995) Murray, N., Chiang, J., Grossman, S. A., & Voit, G. M. 1995, ApJ, 451, 498
- Nelson et al. (2004) Nelson, C. H., Green, R. F., Bower, G., Gebhardt, K., & Weistrop, D. 2004, ApJ, 615, 652
- Netzer (2009) Netzer, H. 2009, ApJ, 695, 793
- Netzer & Maoz (1990) Netzer, H., & Maoz, D. 1990, ApJ, 365, L5
- Onken et al. (2004) Onken, C. A., Ferrarese, L., Merritt, D., Peterson, B. M., Pogge, R. W., Vestergaard, M., & Wandel, A. 2004, ApJ, 615, 645
- Onken et al. (2003) Onken, C. A., Peterson, B. M., Dietrich, M., Robinson, A., & Salamanca, I. M. 2003, ApJ, 585, 121
- Peterson (1993) Peterson, B. M. 1993, PASP, 105, 247
- Peterson (2001) Peterson, B. M. 2001, in Advanced Lectures on the Starburst-AGN Connection, ed. I. Aretxaga, D. Kunth, & R. Mújica (Singapore: World Scientific), p. 3
- Peterson (2010) —. 2010, in prep, (see also arXiv1001.3675)
- Peterson et al. (1998) Peterson, B. M., Wanders, I., Bertram, R., Hunley, J. F., Pogge, R. W., & Wagner, R. M. 1998, ApJ, 501, 82
- Peterson et al. (1991) Peterson, B. M., et al. 1991, ApJ, 368, 119
- Peterson et al. (2000) —. 2000, ApJ, 542, 161
- Peterson et al. (2002) —. 2002, ApJ, 581, 197
- Peterson et al. (2004) —. 2004, ApJ, 613, 682
- Salamanca et al. (1994) Salamanca, I., et al. 1994, A&A, 282, 742
- Salviander et al. (2007) Salviander, S., Shields, G. A., Gebhardt, K., & Bonning, E. W. 2007, ApJ, 662, 131
- Schlegel et al. (1998) Schlegel, D. J., Finkbeiner, D. P., & Davis, M. 1998, ApJ, 500, 525
- Sergeev et al. (2007) Sergeev, S. G., Doroshenko, V. T., Dzyuba, S. A., Peterson, B. M., Pogge, R. W., & Pronik, V. I. 2007, ApJ, 668, 708
- Sergeev et al. (2005) Sergeev, S. G., Doroshenko, V. T., Golubinskiy, Y. V., Merkulova, N. I., & Sergeeva, E. A. 2005, ApJ, 622, 129
- Shankar et al. (2009) Shankar, F., Weinberg, D. H., & Miralda-Escudé, J. 2009, ApJ, 690, 20
- Shen & Gebhardt (2010) Shen, J., & Gebhardt, K. 2010, ApJ, 711, 484
- Shen et al. (2008) Shen, Y., Greene, J. E., Strauss, M. A., Richards, G. T., & Schneider, D. P. 2008, ApJ, 680, 169
- Silk & Rees (1998) Silk, J., & Rees, M. J. 1998, A&A, 331, L1
- Snedden & Gaskell (2007) Snedden, S. A., & Gaskell, C. M. 2007, ApJ, 669, 126
- Somerville et al. (2008) Somerville, R. S., Hopkins, P. F., Cox, T. J., Robertson, B. E., & Hernquist, L. 2008, MNRAS, 391, 481
- Suganuma et al. (2006) Suganuma, M., et al. 2006, ApJ, 639, 46
- Tremaine et al. (2002) Tremaine, S., et al. 2002, ApJ, 574, 740
- van den Bosch & de Zeeuw (2010) van den Bosch, R. C. E., & de Zeeuw, P. T. 2010, MNRAS, 401, 1770
- van Groningen & Wanders (1992) van Groningen, E., & Wanders, I. 1992, PASP, 104, 700
- Vestergaard et al. (2008) Vestergaard, M., Fan, X., Tremonti, C. A., Osmer, P. S., & Richards, G. T. 2008, ApJ, 674, L1
- Vestergaard & Osmer (2009) Vestergaard, M., & Osmer, P. S. 2009, ApJ, 699, 800
- Wandel (2002) Wandel, A. 2002, ApJ, 565, 762
- Wandel et al. (1999) Wandel, A., Peterson, B. M., & Malkan, M. A. 1999, ApJ, 526, 579
- Wanders et al. (1992) Wanders, I., Peterson, B. M., Pogge, R. W., Derobertis, M. M., & van Groningen, E. 1992, A&A, 266, 72
- Wanders et al. (1993) Wanders, I., et al. 1993, A&A, 269, 39
- Welsh (1999) Welsh, W. F. 1999, PASP, 111, 1347
- White & Peterson (1994) White, R. J., & Peterson, B. M. 1994, PASP, 106, 879
- Whittle (1992) Whittle, M. 1992, ApJS, 79, 49
- Winge et al. (1995) Winge, C., Peterson, B. M., Horne, K., Pogge, R. W., Pastoriza, M. G., & Storchi-Bergmann, T. 1995, ApJ, 445, 680
- Woo et al. (2010) Woo, J., et al. 2010, ApJ, 716, 269
- Yoshii (2002) Yoshii, Y. 2002, in New Trends in Theoretical and Observational Cosmology, ed. K. Sato & T. Shiromizu (Tokyo: Universal Academy), 235
| Objects | Host | ||||
|---|---|---|---|---|---|
| (hr min sec) | (° ′ ″) | Classification | (mag) | ||
| (1) | (2) | (3) | (4) | (5) | (6) |
| Mrk 290 | 0.02958 | 15 35 52.3 | +57 54 09 | E1 | 0.065 |
| Mrk 817 | 0.03145 | 14 36 22.1 | +58 47 39 | SBc | 0.029 |
| NGC 3227 | 0.00386 | 10 23 30.6 | +19 51 54 | SAB(s) pec | 0.76aaValues have been adjusted to account for additional internal reddening as described in section 5.2. |
| NGC 3516 | 0.00884 | 11 06 47.5 | +72 34 07 | (R)SB(s) | 1.70aaValues have been adjusted to account for additional internal reddening as described in section 5.2. |
| NGC 4051 | 0.00234 | 12 03 09.6 | +44 31 53 | SAB(rs)bc | 0.056 |
| NGC 5548 | 0.01717 | 14 17 59.5 | +25 08 12 | (R’)SA(s)0/a | 0.088 |
| Julian Dates | Res | 5100Å Cont. | H Line | Extraction | |||
|---|---|---|---|---|---|---|---|
| Objects | Observ. | (-2450000) | (Å) | Window (Å) | Limits (Å) | Window (″) | |
| (1) | (2) | (3) | (4) | (5) | (6) | (7) | (8) |
| Mrk 290 | MDM | 71 | 4184–4268 | 7.6 | 5235–5265 | 4915–5086a,a,footnotemark: bbH line limits were changed for the velocity-resolved lag investigation. See Section 4 for details. | 5.012.75 |
| CrAO | 18 | 4266–4301 | 7.5 | 5235–5265 | 4915–5086 | 3.011.0 | |
| DAO | 11 | 4262–4290 | 7.9 | 5235–5265 | 4915–5086 | 3.06.28 | |
| Mrk 817 | MDM | 65 | 4185–4269 | 7.6 | 5245–5275 | 4900–5099 | 5.012.75 |
| CrAO | 23 | 4265–4301 | 7.5 | 5245–5275 | 4900–5099 | 3.011.0 | |
| NGC 3227 | MDM | 75 | 4184–4268 | 7.6 | 5105–5135 | 4795–4942a,a,footnotemark: bbH line limits were changed for the velocity-resolved lag investigation. See Section 4 for details. | 5.08.25 |
| NGC 3516 | MDM | 74 | 4184–4269 | 7.6 | 5130–5160 | 4845–4965bbH line limits were changed for the velocity-resolved lag investigation. See Section 4 for details. | 5.012.75 |
| CrAO | 19 | 4266–4300 | 7.5 | 5130–5160 | 4845–4965bbH line limits were changed for the velocity-resolved lag investigation. See Section 4 for details. | 3.011.0 | |
| NGC 4051 | MDM | 86 | 4184–4269 | 7.6 | 5090–5130 | 4815–4920 | 5.012.75 |
| CrAO | 22 | 4266–4300 | 7.5 | 5090–5130 | 4815–4920 | 3.011.0 | |
| NGC 5548 | MDM | 77 | 4184–4267 | 7.6 | 5170–5200 | 4845–5004bbH line limits were changed for the velocity-resolved lag investigation. See Section 4 for details. | 5.012.75 |
| CrAO | 20 | 4265–4301 | 7.5 | 5170–5200 | 4845–5004bbH line limits were changed for the velocity-resolved lag investigation. See Section 4 for details. | 3.011.0 | |
| DAO | 11 | 4276–4293 | 7.9 | 5170–5200 | 4845–5000bbH line limits were changed for the velocity-resolved lag investigation. See Section 4 for details. | 3.06.28 |
| Julian Dates | |||
|---|---|---|---|
| Objects | Observatory | (-2450000) | |
| (1) | (2) | (3) | (4) |
| Mrk 290 | MAGNUM | 17 | 4200–4321 |
| CrAO | 61 | 4180–4298 | |
| UNebr | 6 | 4199–4252 | |
| Mrk 817 | MAGNUM | 24 | 4185–4330 |
| CrAO | 69 | 4180–4299 | |
| NGC 3227 | MAGNUM | 19 | 4181–4282 |
| CrAO | 58 | 4180–4263 | |
| UNebr | 19 | 4195–4276 | |
| NGC 3516 | MAGNUM | 10 | 4190–4277 |
| CrAO | 73 | 4181–4299 | |
| UNebr | 22 | 4195–4258 | |
| NGC 4051 | MAGNUM | 23 | 4182–4311 |
| CrAO | 76 | 4180–4299 | |
| UNebr | 28 | 4195–4290 | |
| NGC 5548 | MAGNUM | 48 | 4182–4332 |
| CrAO | 71 | 4180–4299 | |
| UNebr | 13 | 4198–4289 |
| FWHM([O iii] )aaH line limits were narrowed for the measurement of the line width in the rms spectrum. See Section 3 for details. | ([O iii]5007) | Hnar | ||
|---|---|---|---|---|
| Objects | rest frame (km s-1) | ( ergs s-1 cm-2) | Line StrengthbbRatio of narrow (Hnar) to ([O iii]5007). | ( ergs s-1 cm-2 Å-1) |
| (1) | (2) | (3) | (4) | (5) |
| Mrk 290 | 380 | 0.08 | 1.79 | |
| Mrk 817 | 330 | 0.08 | ||
| NGC 3227 | 485 | 0.088ccFrom Peterson et al. (2000). | ||
| NGC 3516 | 250 | 0.07 | ||
| NGC 4051 | 190 | ccFrom Peterson et al. (2000). | ||
| NGC 5548 | 410 | ddFrom Peterson et al. (1991). | 0.11eeFrom Peterson et al. (2004). |
| Mrk 290 | Mrk 817 | NGC 3227 | NGC 3516 | NGC 5548 | |||||
|---|---|---|---|---|---|---|---|---|---|
| JDaaFrom Whittle (1992). | bbContinuum fluxes are in units of ergs s-1 cm-2 Å-1 and represent the average continuum flux density measured 5100 Å, rest-frame, from spectroscopic observations or the photometric -band flux. Spectroscopic and photometric fluxes were scaled to a uniform scale as described in Section 2.3. All fluxes have been corrected for host starlight contamination. | JDaaJulian Dates are and include the following observatory code to indicate the origin of the observation: MDM — m, MAGNUM — g, CrAO spectroscopy — c, CrAO photometry — p, UNebr. — n, and DAO — d. | bbContinuum fluxes are in units of ergs s-1 cm-2 Å-1 and represent the average continuum flux density measured 5100 Å, rest-frame, from spectroscopic observations or the photometric -band flux. Spectroscopic and photometric fluxes were scaled to a uniform scale as described in Section 2.3. All fluxes have been corrected for host starlight contamination. | JDaaJulian Dates are and include the following observatory code to indicate the origin of the observation: MDM — m, MAGNUM — g, CrAO spectroscopy — c, CrAO photometry — p, UNebr. — n, and DAO — d. | bbContinuum fluxes are in units of ergs s-1 cm-2 Å-1 and represent the average continuum flux density measured 5100 Å, rest-frame, from spectroscopic observations or the photometric -band flux. Spectroscopic and photometric fluxes were scaled to a uniform scale as described in Section 2.3. All fluxes have been corrected for host starlight contamination. | JDaaJulian Dates are and include the following observatory code to indicate the origin of the observation: MDM — m, MAGNUM — g, CrAO spectroscopy — c, CrAO photometry — p, UNebr. — n, and DAO — d. | bbContinuum fluxes are in units of ergs s-1 cm-2 Å-1 and represent the average continuum flux density measured 5100 Å, rest-frame, from spectroscopic observations or the photometric -band flux. Spectroscopic and photometric fluxes were scaled to a uniform scale as described in Section 2.3. All fluxes have been corrected for host starlight contamination. | JDaaJulian Dates are and include the following observatory code to indicate the origin of the observation: MDM — m, MAGNUM — g, CrAO spectroscopy — c, CrAO photometry — p, UNebr. — n, and DAO — d. | bbContinuum fluxes are in units of ergs s-1 cm-2 Å-1 and represent the average continuum flux density measured 5100 Å, rest-frame, from spectroscopic observations or the photometric -band flux. Spectroscopic and photometric fluxes were scaled to a uniform scale as described in Section 2.3. All fluxes have been corrected for host starlight contamination. |
| 4180.47p | 1.0830.015 | 4180.44p | 4.6210.038 | 4180.28p | 3.9590.064 | 4181.33p | 6.4330.104 | 4180.41p | 2.8000.055 |
| 4181.54p | 1.0700.015 | 4181.52p | 4.6220.036 | 4181.32p | 3.9710.057 | 4182.39p | 6.1350.126 | 4181.50p | 2.8780.058 |
| 4184.97m | 1.1020.047 | 4185.02g | 4.6540.048 | 4181.90g | 3.2500.052 | 4184.74m | 5.5740.364 | 4182.06g | 3.1280.032 |
| 4185.96m | 1.1090.047 | 4185.92m | 4.6020.078 | 4182.36p | 3.8360.059 | 4185.66m | 5.8970.369 | 4184.92m | 2.9120.118 |
| 4186.61p | 1.1020.033 | 4186.60p | 4.7440.060 | 4184.68m | 3.3630.149 | 4186.47p | 5.7530.162 | 4185.86m | 2.6430.114 |
| 4186.94m | 1.1940.048 | 4186.87m | 4.5520.077 | 4185.61m | 3.6230.153 | 4187.36p | 5.8230.139 | 4186.58p | 2.7090.062 |
| 4187.48p | 1.1840.021 | 4187.46p | 4.8340.052 | 4186.45p | 3.8570.058 | 4188.35p | 5.5790.185 | 4186.83m | 2.6240.113 |
| 4187.96m | 1.2420.049 | 4188.49p | 4.7780.046 | 4187.35p | 3.9150.079 | 4188.66m | 6.0650.373 | 4188.47p | 2.6270.060 |
| 4188.52p | 1.1940.018 | 4188.91m | 4.5610.077 | 4187.61m | 3.5020.151 | 4189.36p | 5.6070.134 | 4188.86m | 2.8520.117 |
| 4188.95m | 1.1880.048 | 4189.52p | 4.8300.055 | 4188.34p | 4.0440.076 | 4189.71m | 6.6410.379 | 4189.50p | 2.6080.068 |
| 4189.54p | 1.2010.023 | 4189.86m | 4.6020.078 | 4188.61m | 4.0030.159 | 4190.39p | 5.6200.113 | 4189.81m | 2.5560.113 |
| 4189.90m | 1.2290.049 | 4190.55p | 4.7200.082 | 4190.61m | 3.9940.158 | 4190.66m | 5.8470.371 | 4189.88g | 2.5690.038 |
| 4190.56p | 1.1670.025 | 4191.13g | 4.8350.136 | 4191.36p | 3.9610.104 | 4190.78g | 5.4240.108 | 4190.53p | 2.6760.081 |
| 4190.93m | 1.2740.050 | 4191.53p | 4.7460.072 | 4191.66m | 4.0120.159 | 4191.31p | 5.7220.137 | 4190.88m | 2.4130.111 |
| 4191.55p | 1.2250.033 | 4191.86m | 4.7960.080 | 4192.42p | 4.0530.096 | 4191.71m | 5.2050.359 | 4191.50p | 2.4870.112 |
| 4191.95m | 1.2050.048 | 4192.56p | 4.7560.059 | 4192.61m | 4.4950.165 | 4192.40p | 5.6910.179 | 4191.81m | 2.7710.116 |
| 4192.58p | 1.1870.026 | 4192.90m | 4.7340.079 | 4193.66m | 4.0960.160 | 4192.66m | 4.7380.351 | 4191.86g | 2.4370.036 |
| 4192.94m | 1.2700.050 | 4194.92m | 4.7720.080 | 4193.80g | 3.7370.031 | 4193.75m | 4.6860.351 | 4192.54p | 2.4140.125 |
| 4194.96m | 1.2490.049 | 4200.55p | 4.7860.042 | 4194.62m | 3.8920.157 | 4194.68m | 4.7440.352 | 4192.85m | 2.6600.114 |
| 4197.97m | 1.1490.047 | 4201.12g | 4.8220.222 | 4195.37n | 4.3320.053 | 4195.43n | 5.1880.160 | 4193.71m | 2.7780.116 |
| 4199.40n | 1.1810.043 | 4201.43p | 4.7760.052 | 4195.69m | 4.4300.164 | 4196.67m | 4.7840.352 | 4194.10g | 2.2030.078 |
| 4199.98m | 1.2190.049 | 4201.90m | 4.8030.080 | 4196.38p | 3.8430.225 | 4197.70m | 5.1880.355 | 4194.87m | 2.5820.113 |
| 4200.36g | 1.1850.026 | 4202.52p | 4.8210.049 | 4196.81m | 3.9100.157 | 4198.44n | 5.1960.150 | 4197.81g | 2.3550.051 |
| 4200.57p | 1.1280.016 | 4204.51p | 4.9580.110 | 4197.64m | 3.8360.156 | 4198.69m | 5.9520.373 | 4197.92m | 2.4170.111 |
| 4201.46p | 1.1400.017 | 4204.85m | 4.7910.080 | 4197.96g | 3.8970.036 | 4198.90g | 5.9270.083 | 4198.60n | 2.4910.130 |
| 4201.95m | 1.2170.049 | 4205.46p | 4.9360.039 | 4198.40n | 3.9110.072 | 4199.34p | 5.8860.096 | 4198.84m | 2.3380.109 |
| 4202.54p | 1.1530.019 | 4205.86m | 5.0020.082 | 4198.64m | 4.0870.160 | 4199.40n | 5.7510.110 | 4199.06g | 2.3530.043 |
| 4204.50p | 1.1100.017 | 4206.50p | 4.8740.058 | 4199.32p | 4.2010.057 | 4200.37p | 5.7660.125 | 4199.51p | 2.3370.068 |
| 4204.90m | 1.0630.046 | 4207.11g | 5.1740.214 | 4199.39n | 4.1510.072 | 4200.67m | 5.3860.362 | 4199.93m | 2.3260.109 |
| 4205.49p | 1.0900.019 | 4207.92m | 5.0460.082 | 4199.63m | 4.2350.161 | 4201.29p | 5.9640.134 | 4200.53p | 2.3670.056 |
| 4205.96m | 1.0590.046 | 4208.48p | 5.0430.053 | 4200.36p | 4.2780.059 | 4201.67m | 6.5230.382 | 4200.83m | 2.4610.111 |
| 4206.40n | 1.0710.064 | 4208.88m | 4.9830.081 | 4200.62m | 4.5970.166 | 4202.35p | 5.7540.121 | 4201.05g | 2.3680.029 |
| 4207.97m | 1.0130.045 | 4209.53p | 5.1640.048 | 4200.84g | 4.4830.045 | 4204.69m | 5.9530.372 | 4201.41p | 2.3410.055 |
| 4208.44p | 1.0430.015 | 4209.89m | 5.0500.082 | 4201.28p | 4.4510.071 | 4205.31p | 6.0190.138 | 4201.85m | 2.3030.108 |
| 4208.92m | 0.9780.044 | 4210.89m | 5.0120.082 | 4201.62m | 4.6060.167 | 4205.71m | 6.2670.374 | 4202.49p | 2.3700.055 |
| 4209.55p | 1.0240.017 | 4212.51p | 5.1300.045 | 4202.34p | 4.4820.061 | 4205.90g | 5.7800.239 | 4203.02g | 2.3630.029 |
| 4209.94m | 0.9750.044 | 4212.88m | 5.1080.083 | 4203.84g | 4.4330.025 | 4206.34p | 5.8950.138 | 4204.47p | 2.4180.065 |
| 4210.96m | 1.0300.045 | 4213.48p | 5.1770.039 | 4204.31p | 4.4890.057 | 4206.40n | 5.7800.181 | 4204.79m | 2.3620.109 |
| 4212.52p | 1.0640.024 | 4213.89m | 5.1100.083 | 4204.64m | 4.4020.164 | 4206.73m | 5.6450.363 | 4205.54p | 2.2370.052 |
| 4212.58g | 1.0850.007 | 4214.48p | 5.2080.050 | 4205.27p | 4.3810.055 | 4207.40n | 6.2150.140 | 4205.82m | 2.2550.108 |
| 4212.95m | 1.0650.046 | 4214.88m | 5.1780.084 | 4205.67m | 4.5320.166 | 4208.39p | 6.1120.155 | 4206.45p | 2.3050.051 |
| 4213.50p | 1.0370.015 | 4215.89m | 5.2310.085 | 4206.32p | 4.2650.062 | 4208.40n | 6.2770.181 | 4206.60n | 2.0640.156 |
| 4213.96m | 1.0410.045 | 4216.49p | 5.1470.042 | 4206.39n | 4.2710.086 | 4208.72m | 5.6560.369 | 4206.82m | 2.2120.107 |
| 4214.43p | 1.0700.017 | 4216.88m | 5.2100.084 | 4206.67m | 4.1980.161 | 4209.38p | 6.1890.127 | 4207.87m | 2.2790.108 |
| 4214.95m | 1.0780.046 | 4217.48p | 5.0590.066 | 4207.39n | 4.1280.072 | 4209.73m | 5.6590.367 | 4208.37p | 2.4370.053 |
| 4215.96m | 1.0340.045 | 4217.89m | 5.0130.082 | 4207.77m | 4.3460.163 | 4210.40n | 6.8250.150 | 4208.83m | 2.2190.107 |
| 4216.54p | 1.0760.014 | 4218.51p | 5.1720.043 | 4207.82g | 4.0090.056 | 4210.72m | 6.6370.385 | 4208.99g | 2.1140.069 |
| 4216.95m | 1.0980.046 | 4218.90m | 5.1060.083 | 4208.32p | 4.3010.059 | 4211.38p | 5.9420.098 | 4209.50p | 2.2590.051 |
| 4217.50p | 1.1080.018 | 4219.03g | 5.2080.026 | 4208.36n | 4.2030.119 | 4212.32p | 5.9040.096 | 4209.84m | 2.1600.107 |
| 4217.93m | 1.1020.047 | 4219.52p | 5.2800.047 | 4208.67m | 4.0770.160 | 4212.67m | 6.5560.383 | 4210.08g | 2.2080.049 |
| 4218.53p | 1.1120.017 | 4220.45p | 5.1170.059 | 4209.37p | 4.2040.058 | 4213.28p | 5.9210.111 | 4210.84m | 2.2140.107 |
| 4218.95m | 1.0940.046 | 4220.91m | 5.0790.083 | 4209.65m | 4.1140.160 | 4213.69m | 5.4460.365 | 4211.53p | 2.2840.060 |
| 4220.40n | 1.0670.043 | 4221.48p | 5.1920.073 | 4210.30n | 4.3320.072 | 4213.77g | 6.2830.114 | 4212.83m | 2.2030.107 |
| 4220.48p | 1.0840.024 | 4222.90m | 5.2000.084 | 4210.67m | 4.2910.162 | 4214.31p | 5.8840.128 | 4212.89g | 2.2570.035 |
| 4220.96m | 1.1390.047 | 4223.50p | 5.3160.065 | 4210.90g | 4.0440.091 | 4214.68m | 5.9570.371 | 4213.45p | 2.2380.053 |
| 4221.57g | 1.0730.050 | 4223.90m | 5.4210.087 | 4211.34p | 4.1500.055 | 4215.69m | 5.7400.368 | 4213.85m | 2.0750.105 |
| 4221.98m | 1.1310.047 | 4224.48p | 5.4070.071 | 4212.30p | 3.9630.055 | 4216.31p | 5.6940.129 | 4214.40p | 2.2500.056 |
| 4222.53p | 1.0670.025 | 4224.90m | 5.2870.085 | 4212.62m | 3.8920.157 | 4216.68m | 6.3420.377 | 4214.84m | 2.1210.105 |
| 4222.95m | 1.1370.047 | 4225.49p | 5.4080.058 | 4213.33p | 3.9240.059 | 4217.37p | 6.0170.137 | 4215.45p | 2.1550.095 |
| 4223.53p | 1.0980.024 | 4226.06g | 5.5110.081 | 4214.29p | 3.8680.067 | 4217.68m | 5.6160.368 | 4215.85m | 2.0810.105 |
| 4223.94m | 1.1190.047 | 4226.44p | 5.4470.064 | 4214.63m | 3.9200.157 | 4218.44p | 5.6870.107 | 4216.46p | 2.0890.057 |
| 4224.45p | 1.0940.024 | 4226.89m | 5.5690.089 | 4215.37p | 4.1300.066 | 4218.75m | 4.7920.353 | 4216.84m | 2.0200.104 |
| 4224.94m | 1.1950.048 | 4227.53p | 5.4470.085 | 4215.64m | 4.0490.159 | 4219.28p | 5.8510.110 | 4217.44p | 2.0410.061 |
| 4225.52p | 1.0350.026 | 4227.90m | 5.5420.089 | 4216.63m | 3.9010.157 | 4219.40n | 6.1570.201 | 4217.84m | 2.1150.105 |
| 4225.92m | 1.1340.047 | 4228.91m | 5.7180.091 | 4217.31p | 4.4270.071 | 4219.79m | 5.2350.360 | 4218.47p | 1.9840.060 |
| 4226.42p | 1.0550.019 | 4229.53p | 5.5000.066 | 4217.63m | 4.8660.171 | 4220.27p | 5.5060.130 | 4218.77g | 2.0450.069 |
| 4226.94m | 1.0200.045 | 4229.88m | 5.5450.089 | 4218.29p | 4.2690.058 | 4220.40n | 5.9190.160 | 4218.86m | 2.0660.105 |
| 4227.95m | 0.9880.044 | 4230.91m | 5.5240.088 | 4218.30n | 4.4170.086 | 4220.69m | 5.5470.367 | 4219.50p | 1.8300.066 |
| 4228.94m | 0.9650.044 | 4231.45p | 5.3850.063 | 4218.70m | 4.3370.163 | 4221.33p | 6.0510.199 | 4219.88m | 2.1360.105 |
| 4229.45p | 0.9530.014 | 4231.91m | 5.3170.086 | 4219.30p | 4.4190.106 | 4221.69m | 5.4360.365 | 4220.41p | 2.0170.095 |
| 4229.93m | 0.9410.043 | 4232.02g | 5.4940.210 | 4219.30n | 4.2390.068 | 4221.84g | 6.4620.146 | 4220.60n | 1.9680.143 |
| 4230.95m | 0.8960.043 | 4232.43p | 5.2750.039 | 4219.74m | 4.6060.167 | 4222.38p | 5.6010.149 | 4220.86m | 1.8850.101 |
| 4231.43p | 0.9270.017 | 4232.90m | 5.4490.087 | 4219.93g | 4.0660.051 | 4222.69m | 5.9160.371 | 4221.07g | 2.0630.034 |
| 4231.50g | 0.8800.035 | 4233.44p | 5.2750.052 | 4220.29p | 4.2320.075 | 4223.34p | 5.8670.168 | 4221.46p | 1.9970.090 |
| 4231.95m | 0.8820.043 | 4233.89m | 5.4070.087 | 4220.31n | 4.5000.099 | 4223.69m | 5.7860.371 | 4221.84m | 2.0550.104 |
| 4232.38p | 0.8600.014 | 4234.43p | 5.2150.040 | 4220.64m | 4.4110.164 | 4224.35p | 5.7250.149 | 4222.51p | 1.8900.095 |
| 4232.94m | 0.8320.042 | 4234.89m | 5.3160.086 | 4221.32p | 4.3200.080 | 4224.69m | 5.7060.370 | 4222.85m | 2.0420.104 |
| 4233.47p | 0.8630.014 | 4235.44p | 5.2700.046 | 4221.35n | 4.3510.073 | 4226.39p | 5.7090.155 | 4223.05g | 1.9420.094 |
| 4233.94m | 0.8160.042 | 4235.90m | 5.3580.086 | 4221.64m | 4.2540.161 | 4226.71m | 5.3760.362 | 4223.48p | 2.0290.073 |
| 4234.46p | 0.8240.014 | 4236.45p | 5.1990.045 | 4222.37p | 4.3450.073 | 4227.41p | 5.4860.134 | 4223.85m | 1.8770.101 |
| 4234.94m | 0.9040.043 | 4236.90m | 5.3450.086 | 4222.63m | 4.5320.166 | 4227.69m | 5.3850.364 | 4224.41p | 2.0330.064 |
| 4235.46p | 0.8430.013 | 4237.44p | 5.1540.055 | 4223.36p | 4.3580.068 | 4229.42p | 5.7830.150 | 4224.85m | 2.0620.105 |
| 4235.94m | 0.8180.042 | 4237.90m | 5.4510.087 | 4223.64m | 4.4390.164 | 4229.73m | 5.4900.363 | 4225.06g | 1.9710.034 |
| 4236.95m | 0.8510.043 | 4239.90m | 5.4910.088 | 4223.83g | 4.4100.055 | 4230.27p | 5.3820.125 | 4225.46p | 2.0000.111 |
| 4237.42p | 0.8230.013 | 4239.93g | 5.3460.040 | 4224.33p | 4.3650.061 | 4230.69m | 5.3400.362 | 4225.89m | 1.9080.103 |
| 4237.95m | 0.7840.042 | 4240.48p | 5.3420.050 | 4224.63m | 4.4760.165 | 4231.41p | 5.6220.131 | 4226.37p | 2.0490.057 |
| 4238.49g | 0.8440.015 | 4240.89m | 5.2260.085 | 4225.33p | 4.3960.064 | 4231.70m | 6.1470.374 | 4226.83m | 1.9430.103 |
| 4239.57n | 0.8040.043 | 4241.44p | 5.2400.041 | 4226.26p | 4.3460.071 | 4232.35p | 5.7730.115 | 4227.50p | 1.8590.116 |
| 4239.94m | 0.8180.042 | 4241.89m | 5.3090.086 | 4226.64m | 4.3460.163 | 4232.68m | 5.7800.370 | 4227.86m | 2.0540.104 |
| 4240.44p | 0.8730.024 | 4242.49p | 5.2130.050 | 4226.81g | 4.4470.045 | 4233.42n | 5.8340.231 | 4228.86m | 1.9320.103 |
| 4240.93m | 0.8580.043 | 4243.51p | 5.2620.051 | 4227.64m | 4.2070.161 | 4233.68m | 6.7660.382 | 4229.40p | 2.0460.049 |
| 4241.47p | 0.8640.015 | 4243.90m | 5.3030.086 | 4228.75m | 4.6530.167 | 4234.30p | 5.8540.120 | 4229.84m | 2.0780.105 |
| 4241.93m | 0.8760.043 | 4244.90m | 5.2020.084 | 4229.34p | 4.2570.061 | 4234.68m | 6.8760.388 | 4230.86m | 1.9540.103 |
| 4242.45p | 0.8710.018 | 4245.45p | 5.1940.041 | 4229.68m | 4.3840.163 | 4235.29p | 5.7560.118 | 4231.38p | 1.9770.052 |
| 4242.94m | 0.8990.043 | 4245.90m | 5.2200.085 | 4230.64m | 4.5600.166 | 4235.44n | 6.3200.301 | 4231.84g | 1.8730.079 |
| 4243.46p | 0.9220.014 | 4246.51p | 5.1960.044 | 4231.32p | 4.3750.057 | 4235.68m | 6.1840.377 | 4231.86m | 1.8870.101 |
| 4243.95m | 0.9660.044 | 4246.89m | 5.0960.083 | 4231.65m | 4.3460.163 | 4236.27p | 6.1860.118 | 4232.33p | 2.0580.047 |
| 4244.94m | 0.9440.044 | 4247.84g | 5.2060.020 | 4232.27p | 4.3030.058 | 4236.68m | 6.7850.386 | 4232.85m | 1.9850.104 |
| 4245.48p | 0.9340.016 | 4247.88m | 5.1580.084 | 4232.63m | 4.2720.162 | 4237.38p | 5.8840.101 | 4233.43p | 2.0240.048 |
| 4245.95m | 0.8890.043 | 4248.89m | 5.1200.083 | 4233.30p | 4.3900.057 | 4237.50n | 6.2350.251 | 4233.85m | 2.0020.104 |
| 4246.49p | 0.9150.014 | 4249.51p | 5.1270.047 | 4233.38n | 4.6500.133 | 4237.69m | 6.2120.378 | 4234.41p | 1.9020.048 |
| 4246.50n | 0.9940.043 | 4249.89m | 5.0280.082 | 4233.63m | 4.7270.168 | 4238.46n | 5.3750.271 | 4234.85m | 2.0670.105 |
| 4246.94m | 0.8890.043 | 4250.89m | 5.0490.082 | 4234.29p | 4.4740.058 | 4238.68m | 5.9970.373 | 4234.93g | 2.0410.027 |
| 4247.93m | 0.9180.043 | 4251.48p | 5.1350.064 | 4234.64m | 4.5230.165 | 4239.48p | 5.6760.154 | 4235.41p | 1.9970.049 |
| 4248.94m | 0.9140.043 | 4251.89m | 4.8220.080 | 4234.81g | 4.7640.035 | 4239.70m | 5.4000.363 | 4235.85m | 2.0030.104 |
| 4249.53p | 0.8750.019 | 4252.54p | 5.0360.111 | 4235.27p | 4.5430.057 | 4240.33p | 5.4260.119 | 4236.41p | 2.1150.047 |
| 4250.94m | 0.8290.042 | 4252.88m | 5.0820.083 | 4235.46n | 4.8740.113 | 4240.52n | 5.7410.261 | 4236.85m | 2.0200.104 |
| 4251.44p | 0.7910.026 | 4253.01g | 5.1190.058 | 4235.64m | 4.4760.165 | 4240.68m | 6.1800.376 | 4237.35p | 1.9550.047 |
| 4252.49g | 0.7700.015 | 4253.89m | 4.9870.082 | 4236.29p | 4.5200.055 | 4241.27p | 5.5570.120 | 4237.60n | 1.9600.195 |
| 4252.49p | 0.7630.022 | 4254.85m | 4.9240.081 | 4236.63m | 4.5690.166 | 4241.45n | 5.6150.281 | 4237.85m | 1.9420.103 |
| 4252.57n | 0.7160.085 | 4255.48p | 4.9580.057 | 4237.26p | 4.5010.058 | 4241.68m | 6.2310.377 | 4237.92g | 2.0470.027 |
| 4252.93m | 0.7950.042 | 4255.86m | 4.7800.080 | 4237.64m | 4.4670.165 | 4242.35p | 5.5180.106 | 4238.57n | 2.1670.182 |
| 4253.94m | 0.7640.041 | 4256.50p | 5.0610.052 | 4238.63m | 4.4670.165 | 4242.40n | 5.5580.311 | 4239.45p | 2.0620.057 |
| 4254.90m | 0.7340.041 | 4256.87m | 4.8680.080 | 4238.79g | 4.7640.024 | 4242.70m | 5.9730.372 | 4239.85m | 1.9900.104 |
| 4255.51p | 0.7230.020 | 4257.49p | 4.9510.044 | 4239.30p | 4.3740.061 | 4243.35p | 5.1100.136 | 4239.96g | 2.0410.027 |
| 4255.91m | 0.5840.038 | 4258.51p | 5.0070.062 | 4239.33n | 4.2040.120 | 4243.69m | 5.8610.371 | 4240.40p | 2.0320.053 |
| 4256.47p | 0.7150.017 | 4258.88m | 5.0940.083 | 4239.66m | 4.6160.167 | 4244.75m | 5.0830.357 | 4240.84m | 1.9120.103 |
| 4256.91m | 0.6280.039 | 4259.42p | 4.9510.039 | 4240.31p | 4.5420.059 | 4245.30p | 4.9780.136 | 4241.38p | 2.0160.068 |
| 4257.46p | 0.7250.015 | 4259.89m | 5.0120.082 | 4240.63m | 4.7830.169 | 4245.69m | 4.5210.349 | 4241.50n | 2.1760.195 |
| 4257.94m | 0.6100.038 | 4259.99g | 4.9350.094 | 4241.29p | 4.6410.058 | 4246.36n | 4.4670.171 | 4241.84m | 2.2360.108 |
| 4258.48p | 0.7240.015 | 4260.49p | 4.9590.043 | 4241.63m | 4.9120.171 | 4246.37p | 5.1930.117 | 4241.97g | 2.0430.053 |
| 4258.93m | 0.6650.039 | 4260.89m | 4.7880.080 | 4242.33p | 4.9030.061 | 4246.69m | 4.2620.343 | 4242.38p | 2.0780.049 |
| 4259.45p | 0.6960.014 | 4261.41p | 4.9240.038 | 4242.64m | 4.8290.170 | 4247.69m | 4.1520.342 | 4242.92m | 1.9600.103 |
| 4259.47g | 0.6360.014 | 4261.89m | 4.8200.080 | 4243.31p | 4.7260.069 | 4247.86g | 5.1910.127 | 4243.38p | 2.0630.049 |
| 4259.94m | 0.6890.040 | 4262.42p | 4.9520.038 | 4243.64m | 5.0240.173 | 4248.36p | 4.9390.134 | 4243.85m | 1.9710.103 |
| 4260.44p | 0.6890.012 | 4263.44p | 4.9780.041 | 4244.68m | 5.1910.174 | 4248.69m | 4.7310.353 | 4244.85m | 2.0330.104 |
| 4260.94m | 0.6120.038 | 4263.86m | 4.8400.080 | 4245.33p | 4.9010.122 | 4249.30p | 4.8790.129 | 4245.43p | 2.0760.065 |
| 4261.44p | 0.6650.012 | 4264.86m | 5.0050.082 | 4245.65m | 5.1260.174 | 4249.69m | 5.0830.359 | 4245.85m | 2.1330.105 |
| 4261.93m | 0.5940.038 | 4264.92g | 4.8750.037 | 4246.34n | 4.9920.080 | 4250.28p | 5.3020.199 | 4245.89g | 2.0070.066 |
| 4262.45p | 0.6250.014 | 4265.44c | 4.8700.094 | 4246.64m | 5.0330.173 | 4250.69m | 4.8220.354 | 4246.40p | 2.1720.057 |
| 4262.45g | 0.6670.014 | 4265.88m | 4.9670.081 | 4246.76g | 4.9190.057 | 4251.34p | 5.1790.156 | 4246.85m | 2.0230.104 |
| 4262.84d | 0.6030.057 | 4266.44c | 5.1250.097 | 4247.65m | 4.8200.170 | 4251.69m | 4.2580.345 | 4247.84m | 2.0420.104 |
| 4263.50p | 0.6790.014 | 4266.86m | 5.0410.082 | 4248.30p | 4.6080.084 | 4252.37p | 4.8970.145 | 4248.41p | 2.1940.164 |
| 4263.91m | 0.6360.039 | 4267.42c | 4.9850.095 | 4248.64m | 4.7180.168 | 4252.49n | 4.3600.160 | 4248.85m | 2.1400.105 |
| 4264.92m | 0.6450.039 | 4267.86m | 4.9850.082 | 4249.32p | 4.5220.086 | 4252.69m | 4.5360.347 | 4249.48p | 1.9850.074 |
| 4265.93m | 0.6810.040 | 4268.48c | 5.2060.098 | 4249.64m | 4.6430.167 | 4253.68m | 5.0220.353 | 4249.85m | 2.2410.108 |
| 4266.48c | 0.7280.057 | 4268.85m | 4.8990.080 | 4249.80g | 4.7490.066 | 4253.81g | 5.0440.064 | 4249.94g | 2.1530.034 |
| 4266.91m | 0.7030.040 | 4269.85m | 4.8520.080 | 4250.31p | 4.5130.122 | 4254.42n | 4.5580.211 | 4250.84m | 2.1880.107 |
| 4267.44c | 0.7040.056 | 4269.88g | 4.9220.025 | 4250.64m | 4.3740.163 | 4255.43p | 4.1990.120 | 4251.38p | 2.2120.079 |
| 4267.91d | 0.7710.041 | 4270.47c | 4.9090.095 | 4251.64m | 4.2540.161 | 4255.51n | 4.3680.291 | 4251.84m | 2.1100.105 |
| 4267.91m | 0.7130.060 | 4271.42c | 4.8000.093 | 4252.34p | 4.2190.072 | 4255.71m | 4.0810.341 | 4252.43p | 2.1160.088 |
| 4268.90m | 0.7620.041 | 4272.45c | 4.8460.094 | 4252.40n | 4.2140.067 | 4256.33p | 4.2950.116 | 4252.51n | 1.9670.156 |
| 4269.46c | 0.7550.058 | 4272.93g | 4.8490.055 | 4252.64m | 4.0960.160 | 4256.44n | 4.6330.251 | 4252.84m | 2.2580.108 |
| 4269.87d | 0.7980.062 | 4273.42c | 4.9560.095 | 4253.65m | 3.8730.157 | 4257.37p | 4.5420.087 | 4252.96g | 2.2210.048 |
| 4270.85d | 0.8410.063 | 4274.48c | 4.8700.094 | 4254.40n | 3.8440.080 | 4257.69m | 3.5440.333 | 4253.84m | 2.0770.105 |
| 4273.45c | 0.9960.063 | 4275.93g | 4.9000.031 | 4254.76g | 4.5960.050 | 4258.29p | 4.3650.143 | 4254.81m | 2.0930.105 |
| 4274.44c | 0.9460.062 | 4276.40c | 4.9410.095 | 4255.32p | 4.6030.058 | 4258.40n | 4.3780.181 | 4254.96g | 2.2490.042 |
| 4274.47g | 0.8470.020 | 4277.39c | 4.9020.095 | 4255.67m | 4.4020.164 | 4258.71m | 4.1110.341 | 4255.41p | 2.2150.062 |
| 4276.43g | 0.8630.012 | 4278.41p | 4.8910.056 | 4256.30p | 4.5980.058 | 4259.32p | 4.0730.099 | 4255.53n | 2.1590.182 |
| 4277.43c | 0.9360.062 | 4278.42c | 4.9190.095 | 4256.66m | 4.1790.161 | 4259.70m | 4.0910.336 | 4255.82m | 2.3050.109 |
| 4277.89d | 0.8910.064 | 4278.87g | 4.8090.037 | 4257.64m | 3.9940.158 | 4260.33p | 4.1040.098 | 4256.39p | 2.3880.056 |
| 4278.45p | 0.8800.018 | 4280.45p | 4.7340.097 | 4258.31p | 4.3620.084 | 4260.71m | 3.8710.334 | 4256.41n | 2.3920.130 |
| 4278.46c | 0.8790.061 | 4281.43p | 4.8020.059 | 4259.30p | 4.2030.054 | 4261.28p | 4.1080.121 | 4256.82m | 2.4920.112 |
| 4281.47p | 0.9120.024 | 4281.48c | 4.5100.089 | 4259.65m | 3.6500.153 | 4261.69m | 3.1270.323 | 4257.32p | 2.4270.047 |
| 4282.37g | 0.8920.014 | 4282.39p | 4.7380.054 | 4259.76g | 3.8480.111 | 4262.33p | 3.5660.116 | 4257.81m | 2.6540.114 |
| 4282.42p | 0.8850.027 | 4282.50c | 4.5350.089 | 4260.31p | 4.1160.060 | 4262.69m | 3.1470.321 | 4258.39n | 2.3890.182 |
| 4282.46c | 0.8810.061 | 4282.94g | 4.5960.053 | 4260.66m | 4.1520.161 | 4263.33p | 3.6380.098 | 4258.44p | 2.4310.056 |
| 4282.81d | 0.9960.067 | 4283.39c | 4.6940.092 | 4261.65m | 3.8360.156 | 4263.68m | 3.2640.323 | 4258.83m | 2.5570.113 |
| 4283.42c | 0.8480.060 | 4283.44p | 4.7010.041 | 4262.28p | 3.9650.061 | 4264.70m | 2.7460.319 | 4259.40p | 2.4590.052 |
| 4283.47p | 0.9410.026 | 4284.38c | 4.5820.090 | 4262.65m | 3.6130.153 | 4265.72m | 1.9460.301 | 4259.84m | 2.5230.112 |
| 4284.41c | 0.8370.060 | 4284.40p | 4.7880.044 | 4263.30p | 4.0180.056 | 4266.36c | 2.0370.345 | 4259.88g | 2.5500.021 |
| 4284.42p | 0.8950.024 | 4285.92g | 4.5740.100 | 4263.37n | 3.9630.060 | 4266.69m | 2.3770.310 | 4260.36p | 2.5500.049 |
| 4285.86d | 0.8160.062 | 4290.41c | 4.9250.095 | 4263.76g | 3.8310.089 | 4267.69m | 1.9460.303 | 4260.84m | 2.3630.109 |
| 4286.86d | 0.8220.062 | 4291.38c | 4.8050.093 | 4264.65m | 3.7520.155 | 4268.34c | 1.7320.339 | 4261.39p | 2.5430.049 |
| 4287.86d | 0.8350.063 | 4293.39p | 5.0780.038 | 4265.67m | 4.1610.161 | 4268.69m | 1.6040.296 | 4261.53n | 2.8660.195 |
| 4288.44g | 0.8070.015 | 4294.42p | 5.0050.046 | 4266.65m | 4.4300.164 | 4269.29c | 2.2260.348 | 4261.84m | 2.7740.116 |
| 4288.86d | 0.6860.060 | 4295.40p | 5.0460.057 | 4267.64m | 4.9680.172 | 4269.69m | 1.1650.288 | 4261.93g | 2.4880.056 |
| 4289.42c | 0.8700.061 | 4296.41p | 5.0890.041 | 4268.64m | 4.9500.172 | 4271.37c | 1.9180.342 | 4262.40p | 2.4300.095 |
| 4290.44c | 0.8130.059 | 4297.43c | 5.1900.098 | 4268.78g | 4.6450.105 | 4271.79g | 1.9640.297 | 4262.80m | 2.4950.112 |
| 4290.85d | 0.8000.062 | 4298.34p | 5.1940.034 | 4270.35n | 4.9010.100 | 4272.37c | 1.7000.338 | 4263.41p | 2.4180.051 |
| 4291.41c | 0.8260.059 | 4298.45c | 5.2190.099 | 4273.77g | 4.8960.048 | 4273.36c | 1.7440.339 | 4263.81m | 2.6090.113 |
| 4293.43p | 0.8260.014 | 4299.38c | 5.0700.096 | 4274.33c | 2.7630.358 | 4263.94g | 2.4620.042 | ||
| 4296.42c | 0.8460.060 | 4299.46p | 5.2180.074 | 4274.80g | 2.8950.084 | 4264.82m | 2.2840.108 | ||
| 4296.43p | 0.8600.017 | 4300.36c | 5.1750.098 | 4277.33c | 3.3740.370 | 4265.81m | 2.3330.109 | ||
| 4297.48c | 0.9830.063 | 4300.85g | 5.2660.059 | 4277.77g | 2.8430.141 | 4266.82m | 2.1770.107 | ||
| 4298.42c | 1.0340.064 | 4301.43c | 5.2170.099 | 4278.32c | 3.6720.376 | 4267.81m | 2.1690.107 | ||
| 4298.43p | 0.9050.016 | 4305.84g | 5.2700.117 | 4279.29c | 3.3710.370 | 4268.86g | 2.1990.040 | ||
| 4300.38g | 0.9200.033 | 4311.83g | 5.6550.027 | 4279.29p | 3.2530.187 | 4270.43n | 2.3090.182 | ||
| 4300.40c | 0.9940.063 | 4314.83g | 5.6560.041 | 4280.29c | 2.9740.362 | 4270.90g | 2.3320.021 | ||
| 4301.46c | 1.0210.064 | 4319.83g | 5.4160.053 | 4280.41p | 3.1170.199 | 4272.89g | 2.3070.027 | ||
| 4306.36g | 0.9750.046 | 4330.77g | 5.5780.048 | 4281.30p | 2.8600.132 | 4274.87g | 2.3350.021 | ||
| 4310.33g | 1.0490.022 | 4281.42c | 2.7610.358 | 4276.84d | 2.0890.118 | ||||
| 4318.33g | 1.1260.015 | 4282.31p | 2.8160.130 | 4276.87g | 2.3790.027 | ||||
| 4321.33g | 1.0790.013 | 4283.29c | 2.6650.356 | 4277.80d | 2.2760.122 | ||||
| 4283.31p | 3.0870.112 | 4278.35p | 2.3180.104 | ||||||
| 4284.29p | 2.8220.109 | 4278.83d | 2.5960.127 | ||||||
| 4284.33c | 2.5480.354 | 4279.36p | 2.3480.082 | ||||||
| 4290.28c | 2.6760.357 | 4281.37p | 2.2070.111 | ||||||
| 4291.32c | 2.3860.351 | 4282.37p | 2.3370.086 | ||||||
| 4293.29p | 3.0440.099 | 4282.76d | 2.5920.127 | ||||||
| 4294.34p | 2.7120.092 | 4282.85g | 2.4740.027 | ||||||
| 4295.35p | 2.7080.099 | 4283.41p | 2.2760.084 | ||||||
| 4296.29p | 2.5610.102 | 4284.33p | 2.2210.066 | ||||||
| 4296.31c | 2.5120.354 | 4284.90g | 2.4190.027 | ||||||
| 4298.31p | 2.7970.087 | 4285.77d | 2.3110.122 | ||||||
| 4299.33c | 2.7610.358 | 4286.76d | 2.2380.121 | ||||||
| 4299.34p | 2.9860.097 | 4287.76d | 2.3410.122 | ||||||
| 4300.30c | 3.3470.369 | 4288.76d | 2.3870.123 | ||||||
| 4288.85g | 2.5410.021 | ||||||||
| 4289.39n | 2.3630.117 | ||||||||
| 4290.75d | 2.7160.130 | ||||||||
| 4290.85g | 2.6620.035 | ||||||||
| 4292.84d | 2.6170.127 | ||||||||
| 4293.36p | 2.5880.056 | ||||||||
| 4293.77d | 2.6860.129 | ||||||||
| 4294.82g | 2.7580.036 | ||||||||
| 4296.38p | 2.5390.056 | ||||||||
| 4298.38p | 2.5130.058 | ||||||||
| 4299.38p | 2.6520.053 | ||||||||
| 4299.83g | 2.6660.035 | ||||||||
| 4304.81g | 2.9400.051 | ||||||||
| 4307.84g | 3.0940.068 | ||||||||
| 4309.80g | 3.0120.036 | ||||||||
| 4311.81g | 2.9400.036 | ||||||||
| 4313.81g | 2.7260.070 | ||||||||
| 4318.81g | 2.6840.042 | ||||||||
| 4319.81g | 2.5150.048 | ||||||||
| 4320.80g | 2.5540.042 | ||||||||
| 4330.75g | 2.4140.034 | ||||||||
| 4332.77g | 2.3480.060 | ||||||||
| Mrk 290 | Mrk 817 | NGC 3227 | NGC 3516 | NGC 5548 | |||||
|---|---|---|---|---|---|---|---|---|---|
| JDaaJulian Dates are and include the same observatory codes as Table 5. | bbH flux is in units of ergs s-1 cm-2. | JDaaJulian Dates are and include the same observatory codes as Table 5. | bbH flux is in units of ergs s-1 cm-2. | JDaaJulian Dates are and include the same observatory codes as Table 5. | bbH flux is in units of ergs s-1 cm-2. | JDaaJulian Dates are and include the same observatory codes as Table 5. | bbH flux is in units of ergs s-1 cm-2. | JDaaJulian Dates are and include the same observatory codes as Table 5. | bbH flux is in units of ergs s-1 cm-2. |
| 4184.97m | 2.2030.049 | 4185.92m | 2.4910.082 | 4184.68m | 3.5590.103 | 4184.74m | 5.8330.185 | 4184.92m | 2.2850.212 |
| 4185.96m | 2.2530.050 | 4186.87m | 2.5150.083 | 4185.61m | 3.5760.104 | 4185.66m | 6.1700.195 | 4185.86m | 2.2980.213 |
| 4186.94m | 2.2300.049 | 4188.91m | 2.3400.077 | 4187.61m | 3.5060.102 | 4188.66m | 6.1500.195 | 4186.83m | 2.2270.207 |
| 4187.96m | 2.1960.048 | 4189.86m | 2.1690.071 | 4188.61m | 4.0660.118 | 4189.71m | 6.1300.193 | 4188.86m | 2.1840.203 |
| 4188.95m | 2.1830.048 | 4191.86m | 2.5180.083 | 4190.61m | 3.6900.107 | 4190.66m | 5.7820.184 | 4189.81m | 1.9410.181 |
| 4189.90m | 2.1580.047 | 4192.90m | 2.4500.080 | 4191.66m | 3.8530.111 | 4191.71m | 5.6330.179 | 4190.88m | 1.8300.170 |
| 4190.93m | 2.2510.050 | 4194.92m | 2.2610.075 | 4192.61m | 3.7740.110 | 4192.66m | 5.4950.175 | 4191.81m | 1.7300.161 |
| 4191.95m | 2.2850.051 | 4201.90m | 2.4160.080 | 4193.66m | 3.9450.114 | 4193.75m | 5.5340.176 | 4192.85m | 1.5170.142 |
| 4192.94m | 2.2170.049 | 4204.85m | 2.3890.079 | 4194.62m | 4.0150.116 | 4194.68m | 5.6740.181 | 4193.71m | 1.5720.146 |
| 4194.96m | 2.2210.049 | 4205.86m | 2.5370.083 | 4195.69m | 3.8400.111 | 4196.67m | 5.4660.174 | 4194.87m | 1.7640.164 |
| 4197.97m | 2.2610.050 | 4207.92m | 2.3510.078 | 4196.81m | 4.0100.116 | 4197.70m | 5.6640.178 | 4197.92m | 1.6590.155 |
| 4199.98m | 2.3230.051 | 4208.88m | 2.3900.079 | 4197.64m | 4.0520.118 | 4198.69m | 6.2800.200 | 4198.84m | 1.3530.126 |
| 4201.95m | 2.3150.051 | 4209.89m | 2.3800.079 | 4198.64m | 4.3190.125 | 4200.67m | 5.6210.179 | 4199.93m | 1.6720.156 |
| 4204.90m | 2.2330.049 | 4210.89m | 2.3120.077 | 4199.63m | 3.9400.114 | 4201.67m | 5.8400.186 | 4200.83m | 1.7300.161 |
| 4205.96m | 2.2740.050 | 4212.88m | 2.3140.077 | 4200.62m | 4.1380.120 | 4204.69m | 5.8040.185 | 4201.85m | 1.5870.148 |
| 4207.97m | 2.2400.049 | 4213.89m | 2.5350.083 | 4201.62m | 4.1380.120 | 4205.71m | 5.8990.186 | 4204.79m | 1.5130.140 |
| 4208.92m | 2.2810.050 | 4214.88m | 2.4360.080 | 4204.64m | 4.4810.130 | 4206.73m | 5.4550.172 | 4205.82m | 1.4270.133 |
| 4209.94m | 2.1980.048 | 4215.89m | 2.5310.083 | 4205.67m | 4.4160.128 | 4208.72m | 5.8860.188 | 4206.82m | 1.3920.130 |
| 4210.96m | 2.1690.048 | 4216.88m | 2.3670.078 | 4206.67m | 4.5390.132 | 4209.73m | 6.0350.192 | 4207.87m | 1.4560.135 |
| 4212.95m | 2.1690.048 | 4217.89m | 2.2930.076 | 4207.77m | 4.5730.133 | 4210.72m | 6.3050.201 | 4208.83m | 1.5810.147 |
| 4213.96m | 2.2200.049 | 4218.90m | 2.5360.083 | 4208.67m | 4.6360.135 | 4212.67m | 6.3850.204 | 4209.84m | 1.5220.142 |
| 4214.95m | 2.2140.049 | 4220.91m | 2.5380.083 | 4209.65m | 4.6720.135 | 4213.69m | 5.7320.183 | 4210.84m | 1.6290.152 |
| 4215.96m | 2.2140.049 | 4222.90m | 2.3750.079 | 4210.67m | 4.7080.136 | 4214.68m | 6.4380.204 | 4212.83m | 1.4140.131 |
| 4216.95m | 2.1290.047 | 4223.90m | 2.4860.082 | 4212.62m | 4.6580.135 | 4215.69m | 5.9800.190 | 4213.85m | 1.2970.121 |
| 4217.93m | 2.1490.047 | 4224.90m | 2.3690.079 | 4214.63m | 4.2490.123 | 4216.68m | 6.3250.200 | 4214.84m | 1.5000.139 |
| 4218.95m | 2.2530.050 | 4226.89m | 2.5660.084 | 4215.64m | 4.0410.117 | 4217.68m | 6.2180.199 | 4215.85m | 1.3090.122 |
| 4220.96m | 2.2650.050 | 4227.90m | 2.3950.079 | 4216.63m | 4.1690.121 | 4218.75m | 5.7530.184 | 4216.84m | 1.3480.125 |
| 4221.98m | 2.3310.052 | 4228.91m | 2.5190.083 | 4217.63m | 4.1280.120 | 4219.79m | 5.6990.181 | 4217.84m | 1.3050.121 |
| 4222.95m | 2.2510.050 | 4229.88m | 2.6180.086 | 4218.70m | 4.0370.117 | 4220.69m | 5.8700.188 | 4218.86m | 1.1260.105 |
| 4223.94m | 2.2340.049 | 4230.91m | 2.6390.087 | 4219.74m | 3.9140.113 | 4221.69m | 5.9300.189 | 4219.88m | 0.8810.082 |
| 4224.94m | 2.2120.049 | 4231.91m | 2.5380.083 | 4220.64m | 3.9610.115 | 4222.69m | 6.1440.196 | 4220.86m | 0.9870.092 |
| 4225.92m | 2.2460.050 | 4232.90m | 2.5120.083 | 4221.64m | 3.8990.113 | 4223.69m | 6.4660.207 | 4221.84m | 0.8450.078 |
| 4226.94m | 2.3140.051 | 4233.89m | 2.5160.083 | 4222.63m | 4.0250.117 | 4224.69m | 6.5180.209 | 4222.85m | 0.9570.088 |
| 4227.95m | 2.3030.051 | 4234.89m | 2.3860.079 | 4223.64m | 4.3110.125 | 4226.71m | 6.1450.195 | 4223.85m | 1.0870.101 |
| 4228.94m | 2.2560.050 | 4235.90m | 2.6100.086 | 4224.63m | 4.4670.130 | 4227.69m | 6.2340.199 | 4224.85m | 0.9760.091 |
| 4229.93m | 2.2910.051 | 4236.90m | 2.6550.088 | 4226.64m | 4.0220.117 | 4229.73m | 6.0500.192 | 4225.89m | 1.0840.101 |
| 4230.95m | 2.3130.051 | 4237.90m | 2.5170.083 | 4227.64m | 4.0010.116 | 4230.69m | 6.0790.194 | 4226.83m | 1.1220.104 |
| 4231.95m | 2.1080.046 | 4239.90m | 2.6270.087 | 4228.75m | 4.0690.118 | 4231.70m | 6.1810.196 | 4227.86m | 1.1600.108 |
| 4232.94m | 2.2140.049 | 4240.89m | 2.5470.084 | 4229.68m | 3.8580.112 | 4232.68m | 6.2540.200 | 4228.86m | 1.0100.094 |
| 4233.94m | 2.1690.048 | 4241.89m | 2.5610.084 | 4230.64m | 3.8880.113 | 4233.68m | 6.3710.201 | 4229.84m | 1.0270.095 |
| 4234.94m | 2.0740.045 | 4243.90m | 2.5610.084 | 4231.65m | 3.8470.111 | 4234.68m | 6.3980.204 | 4230.86m | 1.1920.111 |
| 4235.94m | 2.1640.048 | 4244.90m | 2.5840.085 | 4232.63m | 3.9120.113 | 4235.68m | 6.3950.204 | 4231.86m | 1.0090.094 |
| 4236.95m | 2.2340.049 | 4245.90m | 2.5270.083 | 4233.63m | 3.8890.113 | 4236.68m | 6.5220.208 | 4232.85m | 0.8900.083 |
| 4237.95m | 2.1760.048 | 4246.89m | 2.5650.084 | 4234.64m | 3.8550.111 | 4237.69m | 6.2560.200 | 4233.85m | 1.0700.100 |
| 4239.94m | 2.1640.048 | 4247.88m | 2.6090.086 | 4235.64m | 3.8560.111 | 4238.68m | 6.1960.197 | 4234.85m | 0.9970.092 |
| 4240.93m | 2.1430.047 | 4248.89m | 2.6150.086 | 4236.63m | 3.8300.111 | 4239.70m | 6.1310.195 | 4235.85m | 1.0100.094 |
| 4241.93m | 2.1150.046 | 4249.89m | 2.4210.080 | 4237.64m | 3.7180.108 | 4240.68m | 6.3040.201 | 4236.85m | 0.8750.082 |
| 4242.94m | 2.0740.045 | 4250.89m | 2.5710.085 | 4238.63m | 3.7560.109 | 4241.68m | 6.4930.207 | 4237.85m | 0.9530.088 |
| 4243.95m | 2.1140.046 | 4251.89m | 2.5210.083 | 4239.66m | 3.9910.116 | 4242.70m | 6.3230.201 | 4239.85m | 0.9050.084 |
| 4244.94m | 2.0780.046 | 4252.88m | 2.5510.084 | 4240.63m | 3.9300.114 | 4243.69m | 6.6620.213 | 4240.84m | 0.9520.088 |
| 4245.95m | 2.0730.045 | 4253.89m | 2.4800.081 | 4241.63m | 4.0280.117 | 4244.75m | 6.2230.198 | 4241.84m | 0.9810.091 |
| 4246.94m | 2.1410.047 | 4254.85m | 2.4050.080 | 4242.64m | 3.8160.110 | 4245.69m | 6.2080.198 | 4242.92m | 0.9500.088 |
| 4247.93m | 2.0430.045 | 4255.86m | 2.6700.088 | 4243.64m | 4.3630.126 | 4246.69m | 6.1390.195 | 4243.85m | 1.0370.096 |
| 4248.94m | 2.1140.046 | 4256.87m | 2.5660.084 | 4244.68m | 4.0490.118 | 4247.69m | 5.7490.183 | 4244.85m | 0.9840.091 |
| 4250.94m | 2.1670.048 | 4258.88m | 2.6000.086 | 4245.65m | 4.2070.122 | 4248.69m | 6.1030.195 | 4245.85m | 0.9920.092 |
| 4252.93m | 2.1810.048 | 4259.89m | 2.4340.080 | 4246.64m | 4.2180.122 | 4249.69m | 6.1680.197 | 4246.85m | 0.7410.069 |
| 4253.94m | 2.1570.047 | 4260.89m | 2.5440.084 | 4247.65m | 4.2200.122 | 4250.69m | 5.9140.189 | 4247.84m | 0.9580.090 |
| 4254.90m | 2.0550.045 | 4261.89m | 2.5030.082 | 4248.64m | 4.2600.123 | 4251.69m | 5.6980.182 | 4248.85m | 0.7400.069 |
| 4255.91m | 2.0270.044 | 4263.86m | 2.3190.077 | 4249.64m | 4.2730.124 | 4252.69m | 5.8050.184 | 4249.85m | 0.8460.079 |
| 4256.91m | 2.1480.047 | 4264.86m | 2.3350.077 | 4250.64m | 4.1390.120 | 4253.68m | 5.8980.186 | 4250.84m | 0.6590.061 |
| 4257.94m | 2.0020.044 | 4265.44c | 2.1570.080 | 4251.64m | 4.2680.123 | 4255.71m | 5.9730.190 | 4251.84m | 0.6150.057 |
| 4258.93m | 2.0050.044 | 4265.88m | 2.3460.078 | 4252.64m | 4.0340.117 | 4257.69m | 5.5760.178 | 4252.84m | 0.8010.074 |
| 4259.94m | 1.9280.043 | 4266.44c | 2.3260.086 | 4253.65m | 3.8730.112 | 4258.71m | 6.0620.193 | 4253.84m | 0.8270.077 |
| 4260.94m | 2.0330.044 | 4266.86m | 2.3410.078 | 4255.67m | 3.6950.107 | 4259.70m | 5.8870.185 | 4254.81m | 0.8700.081 |
| 4261.93m | 1.9080.042 | 4267.42c | 2.3920.089 | 4256.66m | 3.8570.112 | 4260.71m | 5.6310.178 | 4255.82m | 1.0700.100 |
| 4262.84d | 1.9150.060 | 4267.86m | 2.3600.078 | 4257.64m | 3.4730.101 | 4261.69m | 5.4930.174 | 4256.82m | 0.9880.092 |
| 4263.91m | 1.9200.043 | 4268.48c | 2.4350.090 | 4259.65m | 3.8720.112 | 4262.69m | 5.1940.163 | 4257.81m | 1.0930.101 |
| 4264.92m | 1.8560.041 | 4268.85m | 2.4470.080 | 4260.66m | 3.4760.101 | 4263.68m | 5.4310.171 | 4258.83m | 1.0280.096 |
| 4265.93m | 1.8180.040 | 4269.85m | 2.3380.077 | 4261.65m | 3.5370.103 | 4264.70m | 5.4170.173 | 4259.84m | 1.1740.109 |
| 4266.48c | 1.8200.061 | 4270.47c | 2.2340.082 | 4262.65m | 3.1830.092 | 4265.72m | 5.0040.156 | 4260.84m | 0.9840.091 |
| 4266.91m | 1.8450.041 | 4271.42c | 2.1050.078 | 4264.65m | 3.3940.098 | 4266.36c | 5.2130.369 | 4261.84m | 1.3060.121 |
| 4267.44c | 1.8870.062 | 4272.45c | 2.2540.083 | 4265.67m | 3.4710.100 | 4266.69m | 5.2380.165 | 4262.80m | 1.2000.112 |
| 4267.91d | 1.8940.042 | 4273.42c | 2.1660.080 | 4266.65m | 3.5190.102 | 4267.69m | 5.1610.163 | 4263.81m | 1.1210.104 |
| 4267.91m | 1.7700.055 | 4274.48c | 2.1700.080 | 4267.64m | 3.6610.106 | 4268.34c | 4.9340.349 | 4264.82m | 1.0890.101 |
| 4268.90m | 1.8760.042 | 4276.40c | 2.0820.077 | 4268.64m | 3.8920.113 | 4268.69m | 5.1010.160 | 4265.38c | 1.2530.120 |
| 4269.46c | 1.8660.062 | 4277.39c | 2.0670.077 | 4269.29c | 5.0470.357 | 4265.81m | 1.1140.104 | ||
| 4269.87d | 1.8940.060 | 4278.42c | 2.1820.080 | 4269.69m | 4.7680.149 | 4266.41c | 0.9870.094 | ||
| 4270.85d | 1.8050.057 | 4281.48c | 2.1480.080 | 4271.37c | 4.0180.284 | 4266.82m | 1.0950.101 | ||
| 4273.45c | 1.8650.062 | 4282.50c | 2.1850.080 | 4272.38c | 3.5860.254 | 4267.39c | 1.2750.121 | ||
| 4274.44c | 1.8590.062 | 4283.39c | 2.3870.088 | 4273.36c | 3.5210.249 | 4267.81m | 1.2770.118 | ||
| 4277.43c | 1.9820.066 | 4284.38c | 2.2880.084 | 4274.33c | 3.9110.277 | 4268.36c | 1.2480.118 | ||
| 4277.89d | 1.9420.061 | 4290.41c | 2.2110.081 | 4277.34c | 3.9740.281 | 4269.40c | 1.0880.104 | ||
| 4278.46c | 1.8930.062 | 4291.38c | 2.1590.080 | 4278.32c | 4.5000.319 | 4271.39c | 1.0670.101 | ||
| 4282.46c | 1.8720.062 | 4297.43c | 2.1800.080 | 4279.29c | 3.7760.267 | 4272.41c | 1.0060.096 | ||
| 4282.81d | 2.0080.063 | 4298.45c | 2.3240.086 | 4280.29c | 3.6190.256 | 4273.38c | 1.0390.099 | ||
| 4283.42c | 1.9430.064 | 4299.38c | 2.2190.082 | 4281.42c | 3.8890.275 | 4274.35c | 1.0720.101 | ||
| 4284.41c | 1.9740.065 | 4300.36c | 2.2660.084 | 4283.29c | 3.9020.276 | 4276.84d | 1.0590.082 | ||
| 4285.86d | 1.9500.062 | 4301.43c | 2.2560.083 | 4284.33c | 4.0700.288 | 4277.36c | 1.1470.109 | ||
| 4286.86d | 2.0930.066 | 4290.28c | 4.1500.294 | 4277.80d | 1.0400.081 | ||||
| 4287.86d | 2.0410.064 | 4291.32c | 3.6580.259 | 4278.39c | 1.0310.098 | ||||
| 4288.86d | 2.0610.065 | 4296.31c | 3.8230.271 | 4278.83d | 1.0780.083 | ||||
| 4289.42c | 2.0710.069 | 4299.33c | 3.6550.259 | 4282.76d | 1.1610.090 | ||||
| 4290.44c | 1.9350.064 | 4300.30c | 3.4410.244 | 4283.35c | 1.2230.116 | ||||
| 4290.85d | 2.1340.067 | 4284.35c | 0.9330.088 | ||||||
| 4291.41c | 2.0920.070 | 4285.77d | 1.1090.086 | ||||||
| 4296.42c | 1.9770.066 | 4286.76d | 0.9190.070 | ||||||
| 4297.48c | 1.9850.066 | 4287.76d | 0.9260.071 | ||||||
| 4298.42c | 1.8680.062 | 4288.76d | 1.0170.078 | ||||||
| 4300.40c | 1.9770.065 | 4289.34c | 1.0580.100 | ||||||
| 4301.46c | 2.0010.066 | 4290.38c | 1.0850.103 | ||||||
| 4290.75d | 1.1530.088 | ||||||||
| 4291.35c | 1.1180.107 | ||||||||
| 4292.84d | 1.1010.084 | ||||||||
| 4293.77d | 1.1430.088 | ||||||||
| 4296.33c | 1.2150.116 | ||||||||
| 4299.35c | 1.2860.122 | ||||||||
| 4300.32c | 1.2510.118 | ||||||||
| 4301.38c | 1.2770.121 | ||||||||
| Continuum Statistics | H Line Statistics | |||||||||
|---|---|---|---|---|---|---|---|---|---|---|
| Sampling(days) | Mean | Sampling(days) | Mean | |||||||
| Objects | FluxaaFluxes are the same units as Table 5. | FluxbbFluxes are the same units as Table 6. | ||||||||
| (1) | (2) | (3) | (4) | (5) | (6) | (7) | (8) | (9) | (10) | (11) |
| Mrk 290 | 0.77 | 0.52 | 0.94 | 0.18 | 1.18 | 1.00 | 2.09 | 0.07 | ||
| Mrk 817 | 0.84 | 0.56 | 5.06 | 0.05 | 1.33 | 1.00 | 2.41 | 0.05 | ||
| NGC 3227 | 0.55 | 0.45 | 3.27 | 0.10 | 1.13 | 1.00 | 3.99 | 0.08 | ||
| NGC 3516 | 0.60 | 0.54 | 4.86 | 0.28 | 1.26 | 1.00 | 5.54 | 0.15 | ||
| NGC 4051 | 0.56 | 0.45 | 4.49 | 0.09 | 1.08 | 1.00 | 4.67 | 0.07 | ||
| NGC 5548 | 0.70 | 0.48 | 2.29 | 0.11 | 1.09 | 1.00 | 1.20 | 0.26 | ||
| FWHM | aaUsing Onken et al. (2004) calibration (except Mrk 817, see below). | log | ||||||
|---|---|---|---|---|---|---|---|---|
| Objects | (days) | (days) | (km/s) | (km/s) | () | () | (ergs s-1) | |
| (1) | (2) | (3) | (4) | (5) | (6) | (7) | (8) | (9) |
| Mrk 290 | 0.632 | |||||||
| Mrk 817bbThe weak and poorly defined, triple-peaked profile of the H emission in the rms spectrum necessitated the use of the line width measured from the mean spectrum for Mrk 817 (Columns 5 and 6) and a black hole mass (Column 8) calculated with the scale factor determined by Collin et al. (2006) for the use of this line width measurement, , instead of the standard Onken et al. (2004) value of that was used for all other objects. | 0.614 | |||||||
| NGC 3227 | 0.547 | |||||||
| NGC 3516 | 0.894 | |||||||
| NGC 4051 | 0.583 | |||||||
| NGC 5548 | 0.708 |