Star formation history and X-ray binary populations: the case of the Small Magellanic Cloud
Abstract
Using Chandra, XMM-Newton and optical photometric catalogs we study the young X-ray binary (XRB) populations of the Small Magellanic Cloud. We find that the Be/X-ray binaries (Be-XRBs) are observed in regions with star formation rate bursts 25-60 Myr ago. The similarity of this age with the age of maximum occurrence of the Be phenomenon (40 Myr) indicates that the presence of a circumstellar decretion disk plays a significant role in the number of observed XRBs in the 10-100 Myr age range. We also find that regions with strong but more recent star formation (e.g., the Wing) are deficient in Be-XRBs. By correlating the number of observed Be-XRBs with the formation rate of their parent populations, we measure a Be-XRB production rate of 1 system per M⊙ /yr. Finally, we use the strong localization of the Be-XRB systems in order to set limits on the kicks imparted on the neutron star during the supernova explosion.
1 Introduction
Nearby star-forming galaxies offer a unique environment to study the young (100 Myr) X-ray binary (XRB) populations. One of the best cases is the Small Magellanic Cloud (SMC), which at 60 kpc is our second nearest star-forming galaxy (Hilditch et al. 2005). Its proximity, well mapped extinction (Zaritsky et al. 2002), moderate Galactic foreground absorption (; Dickey & Lockman 1990), small line-of-sight depth of its young, central stellar populations (10 kpc; Crowl et al. 2001; Harries et al. 2003), and its well-determined recent star formation history (SFH; Harris & Zaritsky 2004 [HZ04]) make the SMC the ideal environment for directly studying the link between XRB populations and star formation (SF). Furthermore, the wealth of multi-wavelength data allows us to clarify the X-ray sources and obtain an even more precise picture of their population.
Several studies have compared the number of Be/X-ray binaries (Be-XRBs) in the Magellanic Clouds and the Galaxy (e.g., Majid et al. 2004, Haberl & Pietsch 2004, Coe et al. 2005), concluding that the SMC hosts an unusually large number of these systems. There is only one identified supergiant XRB located in the SMC Wing (SMC X-1; Webster et al. 1972) in a population of 100 High-Mass XRBs (HMXBs; e.g., Liu et al. 2005, Antoniou et al. 2009b [Paper II]). However, only few of those HMXBs have determined spectral types (e.g., out of the 92 listed in Liu et al. 2005, 53 are cited as Be-XRBs but only 19 have been confirmed spectroscopically). Later works by Antoniou et al. (2009a [Paper I]), Haberl et al. (2008), McBride et al. (2008), Shtykovskiy & Gilfanov (2005), Coe et al. (2005) and others have increased the number of known Be-XRBs to 67 to date. Nevertheless, this overabundance can be partly explained by the enhanced SMC SFH 40 Myr ago (e.g., Majid et al. 2004, Shtykovskiy & Gilfanov 2007 [SG07]). However, Antoniou et al. (2009b) show that even after accounting for the difference in the star formation rate (SFR) between the SMC and the Galaxy, the SMC hosts 1.5 times more Be-XRBs than the Galaxy down to a limiting luminosity of erg s-1. This residual excess can be explained by the different metallicity of these galaxies, as justified by population synthesis models (Dray 2006) and recent observations of Be stars (e.g., Wisniewski & Bjorkman 2006, Martayan et al. 2007). The work of Antoniou et al. (2009b) also indicated spatial variations of the Be-XRB populations within the SMC Bar, which could be evidence for small supernova (SN) kicks.
The SMC Bar hosts stellar populations with ages 100 Myr [HZ04] and the vast majority of the SMC pulsars (Galache et al. 2008). [SG07] found that the age distribution of the HMXBs peaks at 20-50 Myr after the SF event, while McSwain and Gies (2005) observed a strong evolution in the fraction of Be stars with age up to 100 Myr, with a maximum at 25-80 Myr. These results motivated us to investigate the connection between the spatially resolved SFH in and around the SMC Bar and the number and spatial distribution of the XRBs. In this study, we use the results from our Chandra survey of the central, most actively star forming, SMC Bar (A. Zezas et al. 2010, in preparation; Papers I, II), and data from our XMM-Newton survey of the outer SMC regions which host young and intermediate age stellar populations (10-500 Myr; [HZ04]).
2 X-ray observations and data analysis
Using the ACIS-I detector on board Chandra we observed five fields in the central part of the SMC (the so called SMC Bar), with typical exposure times of 8-12 ks. These observations yielded a total of 158 sources, down to a limiting luminosity of erg s-1(0.5-7.0 keV band), reaching the luminosity range of quiescent HMXBs (typically erg s-1 ; van Paradijs & McClintock 1995). The analysis of the data, the source-list and their X-ray luminosity functions are presented in A. Zezas et al. (2010, in preparation), while their optical counterparts and resulting classification are given in Papers I, II.
Our XMM-Newton survey consists of five observations in the outer SMC Bar, performed with the three EPIC (MOS1, MOS2, and PN) detectors in full frame mode. One of these fields was affected by high background flares and it is not included in this work. The data were analyzed with the XMM-Newton Science Analysis System (SAS) version 7.0.0. After processing the raw data with the epchain and emchain tasks, we filtered any bad columns/pixels and high background flares (excluding times when the total count rate deviated more than from the mean), resulting in 5-18 ks net exposures. We only kept events of patterns 0-4 for the PN and 0-12 for the MOS detectors. Source detection was performed simultaneously in five energy bands (0.2-0.5, 0.5-1.0, 1.0-2.0, 2.0-4.5, and 4.5-12.0 keV), and the three EPIC detectors with the maximum likelihood method (threshold set to 7) of the edetect_chain task. The detected sources were visually inspected for spurious detections. We detected 186 sources down to a limiting luminosity of erg s-1 (0.2-12 keV), out of which 4-8 sources are expected to be spurious based on the calibration of Watson et al. (2009).
In Table 1, we give the ID and the coordinates of the X-ray fields, along with the properties of the dominant SF event in each field (see §3).
2.1 X-ray source classification
New HMXBs and candidate Be-XRBs are identified based on their X-ray and optical properties. Hardness ratios between the soft (0.5-1.0 keV), medium (1.0-2.0 keV), and hard (2.0-4.5 keV) bands were used as an initial measurement of their X-ray spectral properties. A hard X-ray spectrum or hardness ratio (equivalent to a photon index of 1) is indicative of a pulsar binary (e.g.,Haberl et al. 2008). For the identification of the optical counterparts of the XMM-Newton sources we followed the analysis of Antoniou et al. (2009b). We cross-correlated their coordinates with the OGLE-II (Udalski et al. 1998) and MCPS (Zaritsky et al. 2002) catalogs, and searched for optical matches in a 5″ radius around each X-ray source (which includes the boresight error of XMM-Newton; e.g.,Brusa et al. 2007). Given the small number of X-ray sources with independently known optical counterparts, we cannot correct these observations for boresight errors. Based on the position of these counterparts on the color-magnitude diagram, we identify sources with early OB-type counterparts, while from hardness ratio or spectral analysis we identified those hard X-ray sources (1), strongly suggesting they are XRB pulsars. Although Monte-Carlo simulations indicate a significant number of spurious sources in these fields, the identification of a hard X-ray source with an early-type counterpart suggests that this is a true match.
We find that 15 XMM-Newton sources have O- or B-type counterparts, while only 8 of those are hard X-ray sources, suggesting they are HMXBs. Since all but one of the confirmed SMC HMXBs are Be-XRBs, they are also candidate Be-XRBs. Their properties are presented in Table 2. The X-ray luminosity is derived assuming a power-law spectrum of and H I column density equal to 4.81, 6.63, and for fields 1, 2, and 3, respectively (based on Dickey & Lockman 1990). The X-ray spectra of two sources with 200 counts were fitted with an absorbed power law, resulting in a photon index of and , and a column density of cm-2 and cm-2, for sources 2-1 (by simultaneously fitting its MOS1 and MOS2 spectra) and 3-1 (from its PN spectrum), respectively. Source 2-1 in particular is a known Be-XRB pulsar with a period of 169.3 s (Lochner et al. 1998) associated with emission-line object [MA93]623 (Meyssonnier & Azzopardi 1993; 3.3″ away), source 3-1 remained unclassified in Sasaki et al. 2000 (ROSAT HRI src ID 11), while source 3-3 is the only one not included in the pipeline EPIC detection list.
If we include to the above sources the confirmed and candidate Be-XRBs that lie within the Chandra and XMM-Newton fields (from this work and those mentioned in §1), we have a total of 54 (39) and 11 (2) HMXBs (Be-XRBs), respectively. For Chandra fields this is the sum of unique Be-XRBs, i.e., sources detected in two overlapping fields are counted once.
3 SFH and XRB populations
The
recent SFH in our Chandra and XMM-Newton fields is derived by averaging the spatially resolved SFH of the MCPS
regions (′; [HZ04]) encompassed by them. We find that:
(i) For the Chandra fields, the most recent major burst peaked
42 Myr ago, and it had a duration of 40 Myr. Moreover,
there were older SF episodes (0.4 Gyr ago) with lower intensity
but longer duration, besides a more recent episode (7 Myr)
observed only in Chandra field 4.
(ii) For XMM-Newton field 3, the most recent major burst occurred
67 Myr ago. We also observed two fields with very young
populations (most recent major burst at 11 and 17 Myr ago
for fields 1 and 2, respectively). XMM-Newton field 2 had an additional
intense burst 67 Myr ago (Table 1).
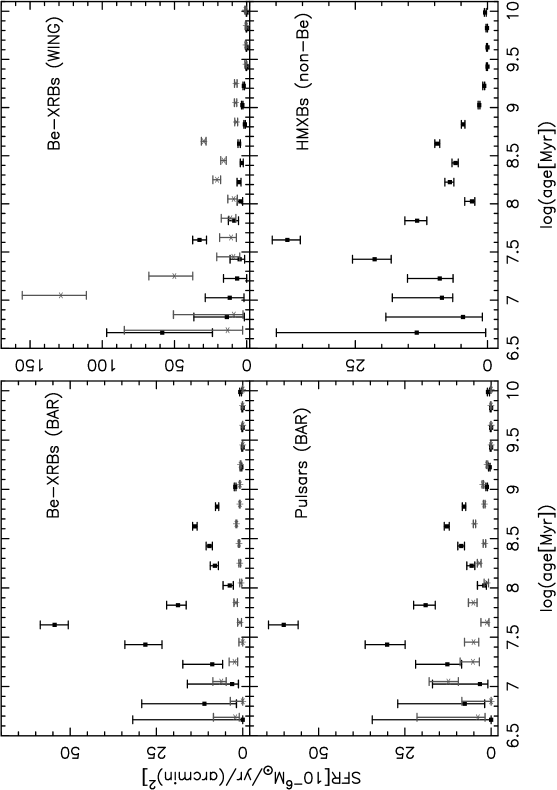
In order to investigate the link between stellar and XRB populations, we calculate the average SFH for the MCPS regions (; [HZ04]) that host one or more Be-XRBs (candidate and confirmed) detected in our Chandra and XMM-Newton surveys (39 and 2, respectively; see §2.1). The SFH in each region is weighted by the encompassed number of Be-XRBs, and the error bars are derived based on the upper and lower limits of [HZ04]. We repeat this exercise for the 15 MCPS regions without any known Be-XRB in our surveys. The two SFHs are presented in Figure 1. The SFH of the Be-XRBs (black points) is strongly peaked at 42 Myr, while fields without any Be-XRB (gray points) have minimal SFR at this age. This underscores the difference between the fields with and without Be-XRBs, and suggests a clear connection between an SF event and the observed Be-XRBs.
Following the above comparison, we also construct the SFH of the MCPS regions hosting one or more known X-ray pulsars within any of our fields111Based on the on-line census of Malcolm Coe (http://www.astro.soton.ac.uk/mjc/smc/ as of 2009 June 18). (Figure 1; black points), and for those that do not host such sources (gray points). A large fraction of these pulsars (60%; Liu et al. 2005) also appears in the Be-XRBs sample, since the vast majority of their companions are Be stars. This link is reinforced by the fact that all the counterparts of these X-ray sources lie on the region of the color-magnitude diagram consistent with main-sequence stars of age 40 Myr (Paper II). For completeness we present both, since the pulsar and the Be-XRB samples are selected on the basis of their timing and optical properties, respectively. In total, in the MCPS regions that overlap with the Chandra fields lie 30 X-ray pulsars, while in the XMM-Newton fields only 2 (sum of unique sources as in Section 2.1). As expected, the pattern in their SFH is very similar to that of Be-XRBs. For regions rich in X-ray pulsars the SF peaks at 42 Myr, while for regions without pulsars there is no peak at this age.
The average SFH of the MCPS regions with and without any Be-XRBs detected in the Chandra Wing survey (P.I. M. Coe; McGowan et al. 2008) is presented in Figure 1, top right (black and gray points, respectively). This survey covered 20 fields (3 of which are not used in this study because they do not overlap with any MCPS region), and discovered 4 Be-XRB pulsars (Schurch et al. 2007). Repeating the same analysis, we find an SF peak at 42 Myr for fields with one or more known Be-XRBs. For regions in the Wing without Be-XRBs there is no SF burst at this age; however, we see an intense burst at 11 Myr. For completeness, we also present (Figure 1) the average SFH of the MCPS regions with candidate (i.e., non spectroscopically confirmed) Be-XRBs from the census of Liu et al. (2005), which also shows that they are produced from the same SF burst as the pulsars and confirmed Be-XRBs. The above comparisons are summarized in Table 3.
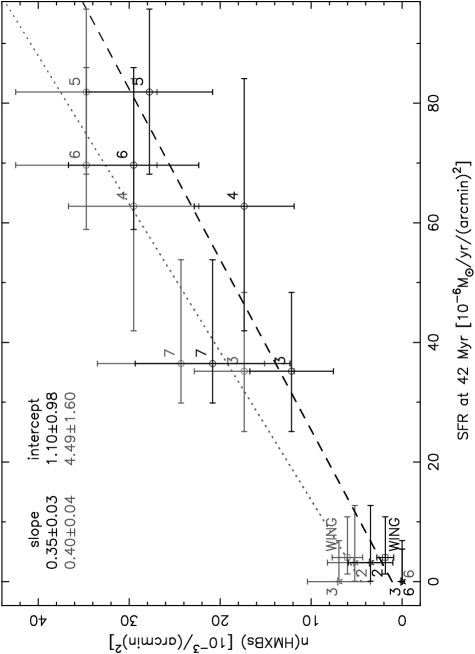
The strong correlation between the number of XRBs and the age of the stellar populations at their location allows us to measure for the first time the XRB formation rate per unit SFR of their parent populations. The number of Be-XRBs (or HMXBs) per unit area detected in our Chandra and XMM-Newton surveys versus the SFR at 42 Myr for the different fields is plotted in Figure 2. In order to have a homogenous sample we used Be-XRBs detected only in these surveys. The best fit bisector line was calculated using the “Linear Regression Software” (Akritas & Bershady 1996), which takes into account heteroscedastic errors. We find a slope of Be-XRBs/SFR (or HMXBs/SFR), where SFR is in units of M⊙ /yr. This is the first direct calibration of the XRB formation rate and the fact that it is based on the source population in a single galaxy minimizes systematic effects related to metallicity. For the same reason, this reflects the Be-XRB formation rate for a low metallicity (Z⊙; Luck et al. 1998).
4 Discussion
From the above analysis we find that the number of SMC XRBs peaks for stellar populations of ages 25-60 Myr. In Figure 1, we also see two additional peaks at 11 and 422 Myr. The one at 11 Myr is too early to produce any pulsar XRBs, but could result in a population of black-hole binaries (Belczynski et al. 2008) with O or early B-type donors which due to their massive companion evolve fast. The second SFR peak (at 422 Myr) cannot result in HMXB formation, since by that time all OB stars have ended their lives.
The large number of Be-XRBs observed at ages 25-60 Myr is consistent with the work of McSwain & Gies (2005), who find that Be stars develop their decretion disks at ages of 25-80 Myr, with a peak at 40 Myr. OB stars formed 40 Myr ago are expected to reach the maximum rate of decretion disk formation at the current epoch.
A study of the evolution of XRBs by [SG07] also found their maximum number at ages of 20-50 Myr after the SF event, which however does not account for the Be phenomenon. They interpret this peak in the HMXB numbers as the result of (1) the pulsar spin-period evolution, (2) the nuclear evolution of the binary system, and (3) the luminosity cutoff ( erg s-1) due to the sensitivity of the observations. However, the luminosity cutoff (e.g.,Linden et al. 2009) and evolution of the binary system may well result in variations of the observed number of binaries at different ages.
Another factor which may result in the excess of SMC HMXBs stems from the similarity between the epoch of the maximum occurrence of Be stars and the ages of the stellar populations hosting XRBs, and the fact their majority have Be-star donors. This indicates that the development of a decretion disk plays a major role in the overall statistics of the X-ray source populations by (1) increasing the number of active objects and (2) by increasing their observed luminosities due to the higher density and lower velocity of the outflow (Waters et al. 1988).
This is also supported by the deficit of Be-XRBs in the SMC Wing. Figure 1 shows that the Wing has a weaker SF burst at the age of enhanced formation of Be stars (i.e., at 42 Myr) than the Bar, while its most recent SF burst occurred only 11 Myr ago. Thus, based on the above scenario, we do not expect a significant number of SMC Wing Be-XRBs. Indeed, the number of observed sources is lower than that in the SMC Bar, but consistent if we account for the SFR difference at 42 Myr (Figure 2). On the other hand, an SF burst at these early ages (11 Myr ago) suggests that supergiant HMXBs should dominate over Be-XRBs in the Wing. We also note that by comparing the number of binaries against the SFR (or the number of stars) in the same region any projection effects cancel out.
The strong correlation between the number of XRBs and the
localized SF event can be used to constrain the kick velocity () imparted
on the compact object during the SN explosion. In the case of large
kicks the XRBs would be scattered over
larger scales, diluting the correlation with their parent stellar
populations and resulting in lower contrast between the SFR of
regions with and without XRBs. Given an SF burst at 42 Myr and assuming a minimum pulsar birth
timescale of 10 Myr after the burst (e.g.,
Belczynski et al. 2008), the elapsed time since the kick is 30
Myr. In order to contain the XRBs within the spatial scale of the
star-forming regions (40′; [HZ04]), we require a maximum
velocity of 15-20 km s-1. This is in agreement
with measured velocities of Be-XRBs in the Galaxy ( km s-1;
van den Heuvel et al. 2000) and estimations derived from the mean distance
between a few pulsars and their nearest clusters in the SMC (30 km s-1; Coe
2005b). Although these center of mass velocities are consistent with
typical SN kicks of 100 km s-1 (Cordes & Chernoff 1998), they could be much smaller given that the
XRBs show indication of local concentrations within the Bar associated with SFR enhancements in much smaller scales
(10′-15′; Paper II). This suggests at least a
factor of two lower which would be consistent
with enhanced fraction of electron-capture SNe, which impart very low , as predicted
by Linden et al. (2009) for the SMC metallicity.
In this Letter, we discuss the importance of Be-XRBs as a dominant component of young XRBs, based on a study of the connection between X-ray source populations and their parent stellar populations. We find that a significant number of Be-XRBs and/or pulsars are connected with a burst of SF 25-60 Myr ago, while regions with weak SFR at 42 Myr, such as the SMC Wing, are deficient in Be-XRBs. We argue that the very strong similarity between the age of maximum occurrence of Be stars and the age of the parent populations of XRBs in the SMC indicates that the Be phenomenon plays a significant role in the number of XRBs in this age range. Finally, based on the spatial correlation between the SF activity and the XRBs, we set a limit on their of 15-20 km s-1 while there is strong indication for velocities of even a factor of two lower, and we estimate a Be-XRB production rate of 1 system per M⊙ /yr.
References
- Akritas & Bershady (1996) Akritas, M. G., & Bershady, M. A. 1996, ApJ, 470, 706
- Antoniou et al. (2009) Antoniou, V., Hatzidimitriou, D., Zezas, A., & Reig, P. 2009a, ApJ, 707, 1080 (Paper I)
- Antoniou et al. (2009) Antoniou, V., Zezas, A., Hatzidimitriou, D., & McDowell, J. C. 2009b, ApJ, 697, 1695 (Paper II)
- Belczynski et al. (2008) Belczynski, K., Kalogera, V., Rasio, F. A., Taam, R. E., Zezas, A., Bulik, T., Maccarone, T. J., & Ivanova, N. 2008, ApJS, 174, 223
- Brusa et al. (2007) Brusa, M., et al. 2007, ApJS, 172, 353
- Coe (2005) Coe, M. J. 2005, MNRAS, 358, 1379
- Coe et al. (2005) Coe, M. J., Edge, W. R. T., Galache, J. L., & McBride, V. A. 2005, MNRAS, 356, 502
- Cordes & Chernoff (1998) Cordes, J. M., & Chernoff, D. F. 1998, ApJ, 505, 315
- Crowl et al. (2001) Crowl, H. H., Sarajedini, A., Piatti, A. E., Geisler, D., Bica, E., Clariá, J. J., & Santos, J. F. C., Jr. 2001, AJ, 122, 220
- Dickey & Lockman (1990) Dickey, J. M., & Lockman, F. J. 1990, ARA&A, 28, 215
- Dray (2006) Dray, L. M. 2006, MNRAS, 370, 2079
- Galache et al. (2008) Galache, J. L., Corbet, R. H. D., Coe, M. J., Laycock, S., Schurch, M. P. E., Markwardt, C., Marshall, F. E., & Lochner, J. 2008, ApJS, 177, 189
- Haberl et al. (2008) Haberl, F., Eger, P., & Pietsch, W. 2008, A&A, 489, 327
- Haberl & Pietsch (2004) Haberl, F., & Pietsch, W. 2004, A&A, 414, 667
- Harries et al. (2003) Harries, T. J., Hilditch, R. W., & Howarth, I. D. 2003, MNRAS, 339, 157
- Harris & Zaritsky (2004) Harris, J., & Zaritsky, D. 2004, AJ, 127, 1531
- Hilditch et al. (2005) Hilditch, R. W., Howarth, I. D., & Harries, T. J. 2005, MNRAS, 357, 304
- Linden et al. (2008) Linden, T., Sepinsky, J. F., Kalogera, V., & Belczynski, K. 2009, ApJ, 699, 1573
- Liu et al. (2005) Liu, Q. Z., van Paradijs, J., & van den Heuvel, E. P. J. 2005, A&A, 442, 1135
- Lochner et al. (1998) Lochner, J. C., Marshall, F. E., Whitlock, L. A., & Brandt, N. 1998, IAU Circ., 6814, 1
- Luck et al. (1998) Luck, R. E., Moffett, T. J., Barnes, T. G., III, & Gieren, W. P. 1998, AJ, 115, 605
- Majid et al. (2004) Majid, W. A., Lamb, R. C., & Macomb, D. J. 2004, ApJ, 609, 133
- Martayan et al. (2007) Martayan, C., Frémat, Y., Hubert, A.-M., Floquet, M., Zorec, J., & Neiner, C. 2007, A&A, 462, 683
- McBride et al. (2008) McBride, V. A., Coe, M. J., Negueruela, I., Schurch, M. P. E., & McGowan, K. E. 2008, MNRAS, 388, 1198
- McGowan et al. (2008) McGowan, K. E., et al. 2008, MNRAS, 383, 330
- McSwain & Gies (2005) McSwain, M. V., & Gies, D. R. 2005, ApJS, 161, 118
- Meyssonnier & Azzopardi (1993) Meyssonnier, N., & Azzopardi, M. 1993, A&AS, 102, 451
- Sasaki et al. (2000) Sasaki, M., Haberl, F., & Pietsch, W. 2000, A&AS, 147, 75
- Schurch et al. (2007) Schurch, M. P. E., et al. 2007, MNRAS, 381, 1561
- Shtykovskiy & Gilfanov (2005) Shtykovskiy, P., & Gilfanov, M. 2005, MNRAS, 362, 879
- Shtykovskiy & Gilfanov (2007) Shtykovskiy, P. E., & Gilfanov, M. R. 2007, Astron. Lett., 33, 437
- Udalski etal. (1998) Udalski, A., Szymanski, M., Kubiak, M., Pietrzynski, G., Wozniak, P., & Zebrun, K. 1998, Acta Astron., 48, 147
- van den Heuvel et al. (2000) van den Heuvel, E. P. J., Portegies Zwart, S. F., Bhattacharya, D., & Kaper, L. 2000, A&A, 364, 563
- van Paradijs & McClintock (1995) van Paradijs, J., & McClintock, J. E. 1995, X-ray Binaries, eds. W.H.G. Lewin, J. van Paradijs, and E.P.J. van den Heuvel (Cambridge: Cambridge Univ. Press), p. 58, 58
- Waters et al. (1988) Waters, L. B. F. M., van den Heuvel, E. P. J., Taylor, A. R., Habets, G. M. H. J., & Persi, P. 1988, A&A, 198, 200
- Watson et al. (2009) Watson, M. G., et al. 2009, A&A, 493, 339
- Webster et al. (1972) Webster, B. L., Martin, W. L., Feast, M. W., & Andrews, P. J. 1972, Nature, 240, 183
- Wisniewski & Bjorkman (2006) Wisniewski, J. P., & Bjorkman, K. S. 2006, ApJ, 652, 458
- Zaritsky et al. (2002) Zaritsky, D., Harris, J., Thompson, I. B., Grebel, E. K., & Massey, P. 2002, AJ, 123, 855
| Fields | Dominant SF Burst | Number | ||||||
|---|---|---|---|---|---|---|---|---|
| ID | R.A.(J2000.0) | Dec.(J2000.0) | Age | Duration | SFR | HMXBs (Be-XRBs) | OB Stars | Pulsars |
| (h m s) | (∘ ′ ″) | (Myr) | (Myr) | ( M⊙ /yr/arcmin2) | ||||
| [1] | [2] | [3] | [4] | [5] | [6] | [7] | [8] | [9] |
| Chandra 3 | 00 56 46.14 | -72 18 10.78 | 66.8 | 68 | 10 (7) | 2220 | 6 | |
| Chandra 4 | 00 49 30.74 | -73 16 52.34 | 42.2 | 36 | 17 (10) | 4060 | 8 | |
| Chandra 5 | 00 53 11.45 | -72 26 29.92 | 42.2 | 28 | 20 (16) | 2730 | 12 | |
| Chandra 6 | 00 53 04.40 | -72 42 18.22 | 42.2 | 36 | 20 (17) | 3040 | 12 | |
| Chandra 7 | 00 49 25.00 | -72 44 22.80 | 26.6 | 30 | 7 (6) | 1670 | 3 | |
| XMM-Newton 1 | 01 07 52.00 | -72 53 41.60 | 10.6 | 8 | 4 (0) | 3780 | 0 | |
| XMM-Newton 2 | 00 51 56.63 | -72 02 53.20 | 16.8 | 15 | 3 (2) | 3715 | 2 | |
| XMM-Newton 3 | 00 42 25.45 | -73 36 29.40 | 66.8 | 39 | 4 (0) | 1500 | 0 | |
| XMM-Newton 6 | 00 40 05.19 | -72 47 57.40 | 668.3 | 1200 | 0 (0) | 445 | 0 | |
| Src | Source Name | R.A.(J2000.0) | Dec.(J2000.0) | Net | S/N | Optical | Off. (Unc.) | V | B-V | |
|---|---|---|---|---|---|---|---|---|---|---|
| ID | XMMU J | (h m s) | (∘ ′ ″) | Counts | () | (erg/s) | src ID | () | (mag) | (mag) |
| [1] | [2] | [3] | [4] | [5] | [6] | [7] | [8] | [9] | [10] | [11] |
| 1-1⋆⋆footnotemark: | 010835.5-724308 | 01 08 35.54 | -72 43 08.4 | (1) | 5.75 | O-11-104405 | 3.82 (1.12) | 17.82(2) | -0.03(2) | |
| Z-4467654 | 3.73 | 17.86(3) | -0.04(4) | |||||||
| 1-2⋆⋆footnotemark: | 010519.9-724943 | 01 05 19.90 | -72 49 43.1 | (3) | 2.96 | O-10-78741 | 3.73 (1.43) | aaDetected only in the and -bands: =16.87(1) mag, =16.76(2) mag. | ||
| Z-4119599 | 4.01 | 16.98(3) | -0.09(4) | |||||||
| 1-3⋆⋆footnotemark: | 010620.0-724049 | 01 06 20.01 | -72 40 49.1 | (3) | 4.10 | O-10-118866 | 4.20 (1.59) | 16.35(1) | -0.02(2) | |
| O-11-13325 | ||||||||||
| Z-4232476 | 4.53 | 16.38(3) | 0.02(3) | |||||||
| 2-1 | 005255.1-715809 | 00 52 55.10 | -71 58 08.7 | (2) | 40.12 | Z-2430066 | 2.82 (0.10)bbThese offsets are within 2-3 above the positional uncertainty, but the (R.A.,Decl.) separations are in the same direction indicating a boresight error, which however, cannot be corrected (§2.1). | 15.53(2) | -0.05(4) | |
| 2-2⋆⋆footnotemark: | 005149.3-720057 | 00 51 49.28 | -72 00 56.5 | (1) | 7.76 | Z-2274521 | 3.46 (0.80)bbThese offsets are within 2-3 above the positional uncertainty, but the (R.A.,Decl.) separations are in the same direction indicating a boresight error, which however, cannot be corrected (§2.1). | 18.38(3) | -0.01(5) | |
| 3-1 | 004208.0-734502 | 00 42 08.01 | -73 45 01.9 | (1) | 11.76 | O-2-79541 | 0.59 (0.46) | 16.78(2) | -0.05(5) | |
| Z-1132154 | 0.40 | 16.78(4) | -0.10(8) | |||||||
| 3-2⋆⋆footnotemark: | 004357.6-732840 | 00 43 57.57 | -73 28 39.7 | (2) | 3.87 | O-3-122430 | 0.65 (1.08) | 18.31(2) | -0.03(4) | |
| Z-1324298 | 0.57 | 18.18(4) | 0.12(5) | |||||||
| 3-3⋆⋆footnotemark: | 004514.7-733601 | 00 45 14.73 | -73 36 00.7 | (1) | 2.94 | O-3-178149 | 2.73 (1.74) | 15.17(1) | -0.24(2) | |
| Z-1466431 | 2.62 | 15.19(10) | -0.23(11) |
Note. — Column 1: source ID as (field number)-(source ID in this field). Asterisks denote sources discovered within the XMM-Newton observations presented here); Column 2: source name; Column 3: right ascension. Column 4: declination; Column 5: number of net source counts (0.2-12.0 keV; EPIC camera–1=PN; 2=MOS1; 3=MOS2); Column 6: source significance; Column 7: absorption corrected X-ray luminosity (0.2-12.0 keV; see §2.1); Column 8: optical counterparts from OGLE-II as O-(field ID)-(source number) and MCPS as Z-(line number of the source in Table 1 of Zaritsky et al. 2002); Column 9: distance between the counterpart and the X-ray source (followed by the positional uncertainty of the X-ray sources given by the edetect_chain task); Columns 10-11: apparent -band magnitude and color (with errors on the last significance digit).
| Region | Populations | Dominant SF Burst | SFR | ||
|---|---|---|---|---|---|
| Age | Duration | of Most Intense Peak | at 42.2 Myr | ||
| (Myr) | ( M⊙ /yr/(arcmin)2) | ||||
| [1] | [2] | [3] | [4] | [5] | [6] |
| SMC Bar | Be-XRBs | 42.2 | 33 | ||
| Non Be-XRBs | 10.6 | 7 | |||
| SMC Bar | Pulsars | 42.2 | 33 | ||
| Non Pulsars | 10.6 | 5 | |||
| SMC Wing | Be-XRBs | 4.6 | 8 | ||
| 42.2aaAdditional burst at ages 100 Myr. | 31 | ||||
| Non Be-XRBs | 10.6 | 25 | |||
| SMC Bar | Candidate Be-XRBs | 42.2 | 31 | ||
Note. — Column 1: SMC region; Column 2: source populations; Column 3: age of the most intense SF burst; Column 4: FWHM of burst’s time evolution; Column 5: SFR of most intense peak; Column 6: SFR at 42 Myr.