Distinct core and halo stellar populations and the formation history of the bright Coma cluster early-type galaxy NGC 4889
Abstract
We study the stellar population far into the halo of one of the two brightest galaxies in the Coma cluster, NGC 4889, based on deep medium resolution spectroscopy with FOCAS at the Subaru 8.2m telescope. We fit single stellar population models to the measured line-strength (Lick) indices (H, Mgb, [MgFe]’ and Fe). Combining with literature data, we construct radial profiles of metallicity, [/Fe] element abundance ratio and age for NGC 4889, from the center out to 60 kpc (). We find evidence for different chemical and star formation histories for stars inside and outside kpc radius. The inner regions are characterized by a steep [Z/H] gradient and high [/Fe] at 2.5 times solar value. In the halo, between and kpc, the [Z/H] is near-solar with a shallow gradient, while [/Fe] shows a strong negative gradient, reaching solar values at kpc. We interpret these data in terms of different formation histories for both components. The data for the inner galaxy are consistent with a rapid, quasi-monolithic, dissipative merger origin at early redshifts, followed by one or at most a few dry mergers. Those for the halo argue for later accretion of stars from old systems with more extended star formation histories. The half-light radius of the inner component alone is estimated as kpc, suggesting a significantly smaller size of this galaxy in the past. This may be the local stellar population signature of the size evolution found for early-type galaxies from high-redshift observations.
keywords:
galaxies: halos — galaxies: individual (NGC 4889) — galaxies: abundances — galaxies: elliptical and lenticular, cD — galaxies: formation1 Introduction
Brightest cluster galaxies (BCGs) are the largest and most luminous galaxies located in galaxy clusters. The merger, star formation and chemical enrichment history of these galaxies are imprinted in their kinematics and chemical abundances. Spatially extended measurements for such quantities can therefore constrain their evolution and formation, believed to be closely related to the formation of the cluster (e.g., Dubinski 1998) and the presence of the diffuse intra-cluster light (e.g., Napolitano et al. 2003; Murante et al. 2007).
In the cold dark matter-based scenario, early-type galaxies (ETGs) form via merging of subclumps with various masses. According to Kobayashi (2004), their merging histories can vary between spherical infall of gas-rich subunits at high redshift, and a sequence of merging events at different epochs and masses. Galaxies of the former assembly history are created via a process that is similar to the classical monolithic collapse. This dissipative process gives rise to high metallicity in the galaxy center, and to significant logarithmic metallicity ([Z/H]) gradients that can be steeper than and correlate strongly with galaxy mass (e.g., Chiosi & Carraro 2002; Kobayashi 2004; Pipino et al. 2008). Gas-rich binary mergers, on the other hand, produce only shallow gradients () with weak mass dependence (Bekki & Shioya, 1999). Merging events that take place after most of the stars are in place reduce, but do not erase completely the pre-existing gradients, because of the way in which stars of different metallicities are redistributed in both energy and radius (White, 1980; di Matteo et al., 2009). In case of a later gas rich merger with a central starburst, a metallicity gradient can form again, but is confined to the central regions after a few Gyr (Hopkins et al., 2009).
Stellar population studies in ETGs based on spectral indices show metallicities higher than solar in their nuclei, negative logarithmic metallicity ([Z/H]) gradients ranging from to , and nearly constant [/Fe] element abundances with radius (e.g., Kobayashi & Arimoto 1999; Sánchez-Blázquez et al. 2006b; Reda et al. 2007; Annibali et al. 2007). For BCGs, several studies provide information on the chemical abundances reaching up to kpc radius (Carter et al., 1999; Brough et al., 2007; Loubser et al., 2009). No significant gradients of [/Fe] are observed, as in the case of normal early-type galaxies, while the range of [Z/H] gradients is somewhat wider, with values from down to . Stellar ages are determined to be mostly old, Gyr.
In this paper we analyse Lick absorption line indices from deep spectra for NGC 4889, one of the two central BCGs in the Coma cluster (see, e.g. Gerhard et al., 2007), reaching unprecedented radii of kpc ( 4 ) in its outer halo (Section 2). We then derive age, [Z/H] and [/Fe] radial distributions using single stellar population models (Section 3). Finally, we discuss the implication of these stellar populations properties for the formation history of the core and halo of this galaxy (Section 4). In what follows we adopt a distance of Mpc (NASA/IPAC Extragalactic Database) and effective radius = 15.23 kpc (Jørgensen et al., 1995) for NGC 4889.
2 Line-strength index profiles for NGC 4889
Combining new data for the outer halo of NGC 4889 with literature data we first construct radial Lick index profiles extending from the center to 60 kpc radius (); see Figure 1.
The outer halo measurements are taken from Coccato et al. (2010, paper I). These data cover the radius range kpc to kpc and are based on 8 hr (run 1, PA=, ) and 5.5 hr (run 2, PA=, ) exposures, long-slit spectra obtained with FOCAS@Subaru on Mauna Kea. Typical signal to noise ratios range from 60 to 10 for the innermost and outermost spectra, respectively.
The data analysis is described in Paper I and includes wavelength- and flux-calibration, convolution to the spectral resolution of the Lick system, correction for line-of-sight velocity broadening and correction for the offset to the Lick system. The sky background is evaluated from both offset sky exposures and dark regions in the scientific frames, using the former to identify regions of the slit in the latter that are free from stellar light continuum. Then we used the sky spectra from these regions (56 from the galaxy center in run , and 29 in run ); they have the same continuum as in the offset sky, and ensure the best removal of the variable sky emission lines. After sky subtraction, residual unresolved emission lines are still present in the MgI bandpass (run 2) and H blue pseudo continuum (run 1). They are possibly caused by internal reflection in the spectrograph and are removed via a Gaussian fit (Paper I). Scattered light is measured in regions of the CCDs not illuminated by the slit. It amounts to 4.5–5.0 ADUs (20% of sky), also in the offset sky images, and is nearly uniform across the detectors in both runs; it is subtracted off the science frames together with the sky background.
On the final spectra, H, Mg1, Mg2, Mgb, Fe5270 and Fe5335 line-strength indices are measured (see Worthey et al., 1994), from which we determine Fe = and [MgFe]’ = . Their errors are determined by Monte Carlo simulations which accounted also for the errors in the radial velocities. Special care is taken to quantify possible systematic errors caused by sky subtraction. Residual contributions of up to 2% of the subtracted sky spectrum are added to the galaxy spectrum. Larger residuals are excluded because they would produce detectable line features in the spectra (see Paper I). New index values are then determined for these new spectra. The systematic deviations of the new values are found to be no larger than the error bars, except for Mg2, which we therefore do not use to derive stellar population parameters.
For the inner regions of NGC 4889, we use spatially resolved Lick index measurements along the major axis from Mehlert et al. (2000), and along the minor axes from Corsini et al. (2008). These authors provide [MgFe]= instead of [MgFe]’. We also include central aperture measurements from Jørgensen (1999); Moore et al. (2002); Sánchez-Blázquez et al. (2006a); Loubser et al. (2009). For each index, all halo and inner data are combined in a single radial profile (see Fig. 1), by projecting the minor axis data points onto the major axis using constant ellipticity (Bender et al., 1989).
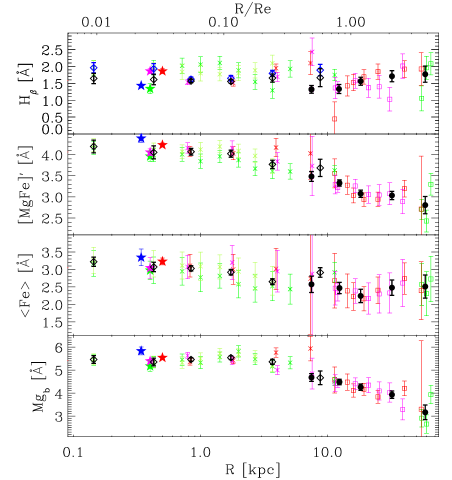
Average profiles are constructed by grouping and averaging the data points in radial bins. For the halo data, we use 5 radial bins centered at 7, 12, 18, 32 and 59 kpc from the galaxy center. The inner literature data are similarly grouped in 6 bins, with average radii 0.14, 0.43, 0.84, 1.7, 3.7, and 8.7 kpc. Errors for the average values are determined from the errors in the individual points and from the scatter in the bins. This scatter derives partially from observational errors, but also from systematic differences between major and minor axis and between both sides of the same long-slit spectrum. To take these systematic effects into account, we compute the of the weighted mean with respect to the error bars of the individual points in each bin. In case it is larger than , the error of the weighted mean is increased accordingly.
Within the final errors, the inner and outer datasets agree in the region of overlap (7-15 kpc), except in H where the more accurate newer data give lower values. Trager et al. (2008) show that the H linestrengths measured by Mehlert et al. (2000) for several Coma galaxies including the second cD galaxy NGC 4874 are stronger by an average 0.38Å than all other literature values, possibly due to a too short slit leading to incorrect sky subtraction. For NGC 4889 we also find that the H aperture value determined by Mehlert et al. (2003) is larger by 0.32Å than the four aperture measurements shown in Fig. 1, while the metal indices agree within the errors. We therefore construct a second, offset-corrected set of inner average points for H only, using the data from Mehlert et al. (2000, corrected downward by 0.32Å ) and Corsini et al. (2008, uncorrected). These averaged radial profiles are shown in Fig. 1 along with the individual measurements.
3 Single stellar population (SSP) parameters: [Z/H], [/Fe] and age
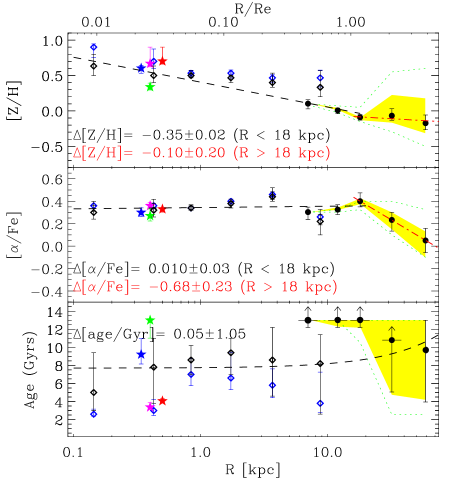
In all bins of the radial average profiles in Fig. 1, we determine luminosity-weighted metallicity [Z/H], [/Fe] abundance ratio, and population age from fitting single stellar population models of Thomas et al. (2003) to the line-strength indices H, Mgb, Fe and [MgFe]’ or [MgFe]. Their grid of models covers age values from 0.1 to 15 Gyr, [Z/H] from to and [/Fe] from to . We interpolated this model grid so that we have steps of 0.4 Gyr in age, dex in [Z/H] and in [/Fe]. For one of the central data points and a few error bars we had to extrapolate to metallicities up to 0.9.
For each radial bin, we determine the best fit model from the measured H, Mgb [MgFe]’ and Fe values by minimizing . Errors for [Z/H], [/Fe] and ages are computed by means of Monte Carlo simulations. The results are shown in Figure 2 and are listed in Table 1. Logarithmic gradients of the SSP parameters are determined from standard linear regression fits in log-log-diagrams. For given parameter (denoting either [Z/H], [/Fe], or ), its logarithmic gradient is defined through . The derived stellar population gradients are shown in Fig. 2.
3.1 Results
Over the entire radial range from the centre to kpc, the metallicity and [/Fe] profiles in Fig. 2 can no longer be described as single power-laws. Rather, they show a “break” at kpc (1.2 ): in the inner regions, the logarithmic [Z/H] gradient is negative and steep: () using the corrected (uncorrected) inner H data, with metallicity that decreases from 5 times solar in the centre to 0.8 solar at kpc. The [/Fe] abundance ratio in the inner 1.2 is nearly constant at a value of , i.e., 2.5 times solar. By contrast, in the halo outside 1.2 , the logarithmic [Z/H] gradient flattens, , and the [/Fe] profile shows a steep negative gradient, [/Fe], reaching solar values at 60 kpc. No peculiar features corresponding to this ”break” are seen in the surface brightness profile (Thomas et al., 2007).
The robustness of the “break” in the abundance profiles to possible systematic errors caused by sky subtraction has been quantified as follows. New SSP models are computed using Lick indices derived from spectra including up to 2% residual sky contribution (Section 2). The corresponding range of SSP parameters is shown by the yellow regions in Fig. 2 and approximately corresponds to the detection limit for the “break” in the [Z/H] radial profile. Residuals of (unrealistic) 8% of the subtracted sky spectrum would be required to remove also the “break” in [/Fe] (green lines in Fig. 2).
The inferred SSP ages show an almost bimodal pattern. The halo of NGC 4889 at radii kpc is uniformly old, with SSP ages ranging between and Gyr. Younger ages are determined for the inner regions of NGC 4889: using the original H values results in average SSP ages between and Gyr, with the lowest values inferred in the central kpc. With the offset correction to the average literature H scale, average ages in the inner regions increase to Gyr, but some of the aperture data still imply quite young ages ( Gyr; Fig. 2).
Young inferred SSP ages for BCG centers are not uncommon (Fisher et al. 1995, Pipino et al. 2009). However, such young SSP ages, if real for NGC 4889 and not caused by the heterogeneous nature of the inner measurements, do not necessarily indicate that the main bulk of stars are young but can also be due to a contamination of a small percentage of young stars. In fact, a component with age 1 Gyr and 10% mass fraction can bring the inferred SSP age of an otherwise old population down to 3 Gyr (Trager et al. 2000, Table 8), similar to the lowest central values in NGC 4889. Conversely, the inferred SSP [Z/H] and [/Fe] of a composite stellar population follow approximately its V-band luminosity weighted values (Serra & Trager, 2007), i.e., are only moderately sensitive to the [Z/H] of a minor young component (correspondingly less than the difference between the black and blue points in the top panel of Fig. 2). Thus the steep [Z/H] gradient and high [/Fe] characterize the dominant stellar population in the inner half of NGC 4889.
4 Discussion
From measurements at large radii combined with previous literature data, we find evidence for distinct stellar populations in the inner half and outer halo of the nearby BCG NGC 4889. These point to a rapid formation process for the core and a more extended accretion phase building the halo, as we now discuss.
Within kpc, all [/Fe] measurements give high values, implying a flat profile at times solar abundance ratio. This implies rapid conversion of the gas into stars. Using a formula derived by Thomas et al. (2005) from simple chemical evolution models would predict that most of the stars within 18 kpc radius were formed in less than 0.1 Gyr. This is about one dynamical time at 18 kpc. However, given the current uncertainties about SNIa progenitors and delay time distributions (e.g. Pritchet et al., 2008), this timescale of 0.1 Gyr is not very secure. At the same time, the combined measurements support a steep inner [Z/H] gradient (at least dex), while the published SSP age values inside 18 kpc show considerable scatter, including both old (10-13 Gyr) and intermediate age (3-6 Gyr) values. These data are consistent with a superposition of a dominant old population with a minor, younger component (see previous section).
The rapid formation and steep [Z/H] gradient of the stars in the inner half of NGC 4889 are reminiscent of predictions of a quasi-monolithic dissipative collapse model, in which stars form in a rapid burst progressing from the outside in, while the gas collapsing to the center is continuously enriched (Carlberg, 1984; Arimoto & Yoshii, 1987; Thomas et al., 1999). In this process, logarithmic gradients of can be reached. The chemical properties of the inner NGC 4889 population are consistent with a scenario in which a dominant, old population formed rapidly at high redshift in quasi-monolithic, dissipative merger collapse, as described by Kobayashi (2004) in the context of hierarchical models. Subsequently, several of such units could have been involved in one or at most a few dry mergers, such that the original steep [Z/H] gradients are only partially erased - a major dry merger between two ellipticals with identical gradients already reduces the gradient by a factor 0.6 (di Matteo et al., 2009) - and such that at most a small fraction of more iron-enriched stars is added to the stellar population.
By contrast, the halo of NGC 4889 at radii larger than kpc is characterized by near-solar metallicities with shallow gradient, a steep [/Fe] gradient reaching solar values at 60 kpc radius, and old ages (9-13 Gyr, possibly decreasing towards the outermost radii). The old ages and lower but still enhanced [/Fe] indicate that the stars in the halo were formed at early times, but over longer time scales than the stars in the core, out of gas that was already iron-enriched by exploding type Ia supernovae (Matteucci, 1994; Bekki & Shioya, 1999).
While galactic winds powered by supernova and/or AGN feedback from the collapsing central galaxy could explain early truncation of the star formation in the halo due to removal of the gas, they cannot explain the longer star formation timescale for the halo regions with respect to the inner galaxy. On the other hand, the properties of the stellar population in the halo of NGC4889 are consistent with the idea that these stars were accreted from shredded satellite galaxies (Abadi et al., 2006; Naab et al., 2009).
These satellites could have formed in lower density regions and sustained their star formation histories for longer times, until infall into denser environments and interactions truncated star formation. The more extended star formation would enable SN Ia to contribute iron to the gas and allow the build-up of near-solar metallicities and -enhancement. The merger of these satellites with NGC 4889 could have happened long after the star formation was truncated. The total luminosity in the NGC 4889 halo is , integrating the surface photometry for . This light is equivalent to a few Milky-Way size galaxies. The merging of a few such satellites with a BCG is expected in merger trees computed for BCGs in massive clusters like Coma (e.g. Murante et al., 2007).
The bi-modal nature of the stellar populations in the core ( kpc) and halo (18 kpc kpc) of NGC 4889 is also consistent with recent results on the size evolution of early-type galaxies with redshift (e.g Daddi et al., 2005; Trujillo et al., 2007; Cimatti et al., 2008), such that ETGs at () have sizes a factor of 2 (3-5) smaller than ETGs with similar mass today (van der Wel et al., 2008; van Dokkum et al., 2008; Saracco et al., 2009). Recently, van Dokkum et al. (2010) find from stacked rest-frame R-band images that massive ETGs have nearly constant mass within 5 kpc with redshift, but increase their envelope mass by a factor since , with effective radius evolving as . Scaling the present of NGC 4889 with this relation would predict kpc at . An estimate for the size of the inner [/Fe]-enhanced population in this galaxy is the radius enclosing half of the current luminosity within 18 kpc, obtained by truncating the surface brightness profile (Thomas et al., 2007) at that radius; this is also 6 kpc. The consistency of these numbers suggests that we may have found local stellar population signatures of the observed ETG size evolution.
In general, BCG galaxies have a range of [Z/H] gradients and [/Fe] (see Introduction), thought to arise from the relative influence of the early collapse component and subsequent mergers (Kobayashi, 2004; De Lucia & Blaizot, 2007). In NGC 4889, a relatively large (50%) fraction of the galaxy light appears to have been involved in the early collapse. Because of the steep [Z/H] gradient and high [/Fe] this galaxy may be a particularly good case for distinguishing the different core and halo populations. It will be important to obtain similarly extended [/Fe] and [Z/H] profiles for a larger sample of bright ETGs and to connect their analysis with the properties of the high-redshift ETG population.
Acknowledgments
The authors thank T. Hattori, S. Okamura, G. Ventimiglia, N. Yasuda for support and help with the observations and preparations, R. Bender, K. Freeman, H. Kuntschner, C. Maraston, F. Matteucci, L. Morelli, R. Saglia, D. Thomas and J. Thomas for useful discussions in the course of this project, and the anonymous referee for helpful comments.
| H | Mgb | [MgFe] | Fe | Age | [Z/H] | [/Fe] | GAL/BKG | ||
|---|---|---|---|---|---|---|---|---|---|
| (kpc) | (Å) | (Å) | (Å) | (Å) | [Gyr] | [arcsec] | |||
| (1) | (2) | (3) | (4) | (5) | (6) | (7) | (8) | (9) | (10) |
| 0.14 | 1.640.15 | 5.460.17 | 4.190.11 | 3.220.13 | – | – | |||
| 0.43 | 1.610.16 | 5.350.17 | 4.050.11 | 3.070.13 | – | – | |||
| 0.84 | 1.570.05 | 5.460.08 | 4.070.06 | 3.030.08 | – | – | |||
| 1.73 | 1.550.06 | 5.540.08 | 4.020.06 | 2.920.08 | – | – | |||
| 3.67 | 1.660.12 | 5.360.11 | 3.770.07 | 2.650.08 | – | – | |||
| 8.74 | 1.670.27 | 4.660.30 | 3.690.15 | 2.910.14 | – | – | |||
| [MgFe]’ | |||||||||
| 7 | 1.320.12 | 4.680.17 | 3.480.12 | 2.570.11 | 4.7 | 8 (1) | |||
| 12 | 1.330.13 | 4.480.12 | 3.330.07 | 2.470.08 | 1.9 | 7 (6) | |||
| 18 | 1.560.12 | 4.260.14 | 3.070.09 | 2.240.09 | 0.9 | 13 (4) | |||
| 32 | 1.710.16 | 3.930.16 | 3.030.10 | 2.480.12 | 0.4 | 30 (5) | |||
| 59 | 1.770.24 | 3.160.32 | 2.790.17 | 2.520.16 | 0.2 | 32 (4) |
Notes: Upper part of the table based on data from Mehlert et al. (2000); Corsini et al. (2008); lower part based on data from Paper I. Values for literature data refer to the case in which the Mehlert et al. H values are offset-corrected by 0.32Å, and provide [MgFe] rather than [MgFe]’ (see Section 2 for details). Col. 1: Mean distance of the radial bins from the galaxy center, projected along the major axis. Cols. 2-5: average values for indices and errors in the bins. Cols. 6-8: Corresponding best fit age, metallicity and -enhancement with errors. Col. 9: ratio between counts from galaxy and background (both sky and scattered light), collected from all pieces of the slit that contribute to that bin. These counts are obtained in the wavelength range 5000 Å – 5150 Å, which is free from intense spectral lines, and therefore representative of the galaxy and background continua. Col. 10: total radial extent covered by the bin. The number of slit portions (data points in Fig. 1) used for this bin is given in parentheses.
References
- Abadi et al. (2006) Abadi M. G., Navarro J. F., Steinmetz M., 2006, MNRAS, 365, 747
- Annibali et al. (2007) Annibali F., Bressan A., Rampazzo R., Zeilinger W. W., Danese L., 2007, A&A, 463, 455
- Arimoto & Yoshii (1987) Arimoto N., Yoshii Y., 1987, A&A, 173, 23
- Bekki & Shioya (1999) Bekki K., Shioya Y., 1999, ApJ, 513, 108
- Bender et al. (1989) Bender R., Surma P., Doebereiner S., Moellenhoff C., Madejsky R., 1989, A&A, 217, 35
- Brough et al. (2007) Brough S., Proctor R., Forbes D. A., Couch W. J., Collins C. A., Burke D. J., Mann R. G., 2007, MNRAS, 378, 1507
- Carlberg (1984) Carlberg R. G., 1984, ApJ, 286, 416
- Carter et al. (1999) Carter D., Bridges T. J., Hau G. K. T., 1999, MNRAS, 307, 131
- Chiosi & Carraro (2002) Chiosi C., Carraro G., 2002, MNRAS, 335, 335
- Cimatti et al. (2008) Cimatti A., Cassata P., Pozzetti L., Kurk J., Mignoli M., et al. 2008, A&A, 482, 21
- Coccato et al. (2010) Coccato L., Arnaboldi M., Gerhard O., Freeman K. C., Ventimiglia G., Yasuda N., 2010, ArXiv:1006.1894 (paper I)
- Corsini et al. (2008) Corsini E. M., Wegner G., Saglia R. P., Thomas J., Bender R., Thomas D., 2008, ApJS, 175, 462
- Daddi et al. (2005) Daddi E., Renzini A., Pirzkal N., Cimatti A., Malhotra S., et al. 2005, ApJ, 626, 680
- De Lucia & Blaizot (2007) De Lucia G., Blaizot J., 2007, MNRAS, 375, 2
- di Matteo et al. (2009) di Matteo P., Pipino A., Lehnert M. D., Combes F., Semelin B., 2009, A&A, 499, 427
- Dubinski (1998) Dubinski J., 1998, ApJ, 502, 141
- Fisher et al. (1995) Fisher D., Franx M., Illingworth G., 1995, ApJ, 448, 119
- Gerhard et al. (2007) Gerhard O., Arnaboldi M., Freeman K. C., Okamura S., Kashikawa N., Yasuda N., 2007, A&A, 468, 815
- Hopkins et al. (2009) Hopkins P. F., Cox T. J., Dutta S. N., Hernquist L., Kormendy J., Lauer T. R., 2009, ApJS, 181, 135
- Jørgensen (1999) Jørgensen I., 1999, MNRAS, 306, 607
- Jørgensen et al. (1995) Jørgensen I., Franx M., Kjaergaard P., 1995, MNRAS, 273, 1097
- Kobayashi (2004) Kobayashi C., 2004, MNRAS, 347, 740
- Kobayashi & Arimoto (1999) Kobayashi C., Arimoto N., 1999, ApJ, 527, 573
- Loubser et al. (2009) Loubser S. I., Sánchez-Blázquez P., Sansom A. E., Soechting I. K., 2009, MNRAS, 398, 133
- Matteucci (1994) Matteucci F., 1994, A&A, 288, 57
- Mehlert et al. (2000) Mehlert D., Saglia R. P., Bender R., Wegner G., 2000, A&AS, 141, 449
- Mehlert et al. (2003) Mehlert D., Thomas D., Saglia R. P., Bender R., Wegner G., 2003, A&A, 407, 423
- Moore et al. (2002) Moore S. A. W., Lucey J. R., Kuntschner H., Colless M., 2002, MNRAS, 336, 382
- Murante et al. (2007) Murante G., Giovalli M., Gerhard O., Arnaboldi M., Borgani S., Dolag K., 2007, MNRAS, 377, 2
- Naab et al. (2009) Naab T., Johansson P. H., Ostriker J. P., 2009, ApJ, 699, L178
- Napolitano et al. (2003) Napolitano N. R., Pannella M., Arnaboldi M., Gerhard O., Aguerri J. A. L., et al. 2003, ApJ, 594, 172
- Pipino et al. (2008) Pipino A., D’Ercole A., Matteucci F., 2008, A&A, 484, 679
- Pipino et al. (2009) Pipino A., Kaviraj S., Bildfell C., Babul A., Hoekstra H., Silk J., 2009, MNRAS, 395, 462
- Pritchet et al. (2008) Pritchet C. J., Howell D. A., Sullivan M., 2008, ApJ, 683, L25
- Reda et al. (2007) Reda F. M., Proctor R. N., Forbes D. A., Hau G. K. T., Larsen S. S., 2007, MNRAS, 377, 1772
- Sánchez-Blázquez et al. (2006a) Sánchez-Blázquez P., Gorgas J., Cardiel N., González J. J., 2006a, A&A, 457, 787
- Sánchez-Blázquez et al. (2006b) Sánchez-Blázquez P., Gorgas J., Cardiel N., González J. J., 2006b, A&A, 457, 809
- Saracco et al. (2009) Saracco P., Longhetti M., Andreon S., 2009, MNRAS, 392, 718
- Serra & Trager (2007) Serra P., Trager S. C., 2007, MNRAS, 374, 769
- Thomas et al. (1999) Thomas D., Greggio L., Bender R., 1999, MNRAS, 302, 537
- Thomas et al. (2003) Thomas D., Maraston C., Bender R., 2003, MNRAS, 339, 897
- Thomas et al. (2005) Thomas D., Maraston C., Bender R., Mendes de Oliveira C., 2005, ApJ, 621, 673
- Thomas et al. (2007) Thomas J., Saglia R. P., Bender R., Thomas D., Gebhardt K., et al. 2007, MNRAS, 382, 657
- Trager et al. (2008) Trager S. C., Faber S. M., Dressler A., 2008, MNRAS, 386, 715
- Trager et al. (2000) Trager S. C., Faber S. M., Worthey G., González J. J., 2000, AJ, 120, 165
- Trujillo et al. (2007) Trujillo I., Conselice C. J., Bundy K., Cooper M. C., Eisenhardt P., Ellis R. S., 2007, MNRAS, 382, 109
- van der Wel et al. (2008) van der Wel A., Holden B. P., Zirm A. W., Franx M., Rettura A., Illingworth G. D., Ford H. C., 2008, ApJ, 688, 48
- van Dokkum et al. (2008) van Dokkum P. G., Franx M., Kriek M., Holden B., Illingworth G. D., et al. 2008, ApJ, 677, L5
- van Dokkum et al. (2010) van Dokkum P. G., Whitaker K. E., Brammer G., Franx M., Kriek M., et al. 2010, ApJ, 709, 1018
- White (1980) White S. D. M., 1980, MNRAS, 191, 1P
- Worthey et al. (1994) Worthey G., Faber S. M., Gonzalez J. J., Burstein D., 1994, ApJS, 94, 687