Quasi-Periodic Formaldehyde Maser Flares in the Massive Protostellar Object IRAS 18566+0408
Abstract
We report results of an extensive observational campaign of the 6 cm formaldehyde maser in the young massive stellar object IRAS 18566+0408 (G37.55+0.20) conducted from 2002 to 2009. Using Arecibo, VLA, and GBT, we discovered quasi-periodic formaldehyde flares (P 237 days). Based on Arecibo observations, we also discovered correlated variability between formaldehyde (H2CO) and methanol (CH3OH) masers. The H2CO and CH3OH masers are not spatially coincident, as demonstrated by different line velocities and high angular resolution MERLIN observations. The flares could be caused by variations in the infrared radiation field, possibly modulated by periodic accretion onto a young binary system.
1 Introduction
IRAS 18566+0408 (G37.55+0.20) is a massive star forming region located at a kinematic distance of 6.7 kpc (Araya et al. 2004). The region is visible in Spitzer GLIMPSE infrared data (Benjamin et al. 2003), and shows an outflow that has been detected in CO, SiO and in the 4.5m IRAC band (Araya et al. 2007c; Beuther et al. 2002; Zhang et al. 2007). At smaller scales, Very Large Array (VLA, NRAO)111The National Radio Astronomy Observatory is a facility of the National Science Foundation operated under cooperative agreement by Associated Universities, Inc. observations reveal a radio continuum source, possibly an ionized jet (Araya et al. 2007c). The bolometric luminosity of the object is L⊙ (equivalent to an O8 ZAMS star; Zhang et al. 2007; Sridharan et al. 2002).
IRAS 18566+0408 harbors one of the few known 6 cm formaldehyde (H2CO) masers in the Galaxy (Araya et al. 2008). The H2CO maser in IRAS 18566+0408 showed a strong flare in 2002 (Araya et al. 2007b). Here we report results of a monitoring program of the H2CO maser intended to investigate the nature of the flare.
2 Observations
2.1 Arecibo Observations
Using the 305 m Arecibo Telescope222The Arecibo Observatory is part of the National Astronomy and Ionosphere Center, which is operated by Cornell University under a cooperative agreement with the National Science Foundation., we monitored the 6 cm H2CO maser (, MHz) in IRAS 18566+0408. The pointing position was R.A. = 18h59m09.98s, decl. = 04∘12′15.6′′(J2000; Araya et al. 2005). The monitoring program had three intervals: May 2006 to April 2007, January 2008 to May 2008, and October 2008 to November 2009. A total of 48 runs were conducted (Figure 1; see Table 1, online version).
We observed in position switching mode; 5 minutes on-source integration per scan with typically one or two scans per run. Observations prior to June 2008 were conducted with the Interim autocorrelator, dual linear polarization, 1.56 MHz bandwidth and 2048 channels (0.047 km s-1 per channel). The data reduction was done using the CLASS program.333CLASS is part of the GILDAS software package developed by IRAM. The WAPP spectrometer was used since October 2008, with 3.125 MHz bandwidth and 2048 channels (0.095 km s-1 channel width). The calibration of the WAPP data was done in IDL using Arecibo-IDL routines. The data were smoothed to a channel width of 0.19 km s-1. We observed B1857+129 in most of the runs to check the pointing and measure the telescope gain. The pointing error was less than 12′′ in general, and the gain varied between 5 and 9 K/Jy in the 48 runs. The system temperature was typically 26 K. The Arecibo half power beam width (HPBW) is ′ at 4860 MHz. We detected no significant variability of the linewidth or peak velocity of the maser.
The 6.7 GHz CH3OH line (, MHz) was also observed with integration times on-source between 1 and 2 minutes. The same Interim and WAPP configurations described above were used for the CH3OH observations. The spectra were smoothed to a channel width of 0.07 km s-1 (see Figure 2). The Arecibo HPBW is ′ at 6600 MHz. A detailed description of all CH3OH observations together with results from an ongoing monitoring program will be reported in the future.
2.2 VLA Observations
We used the VLA to observe the 6 cm H2CO maser in IRAS 18566 +0408 at seven epochs after 2006 (see Table 1, online version). The pointing positions were R.A. = 18h59m10.10s, decl. = 04∘12′12.0′′(J2000) for the A and B array observations, and R.A. = 18h59m10.00s, decl. = 04∘12′25.0′′(J2000) for the C array observations. The seven observations, together with two previous VLA observations from the literature (Araya et al. 2007b), are shown in Figure 1. We used a 2IF mode with bandwidth of 1.56 MHz (97 km s-1) and 255 channels (6.104 kHz, 0.38 km s-1 channel width). We observed 3C286 and 3C48 as flux density calibrators, with assumed flux densities of 7.52 Jy and 5.47 Jy, respectively. We observed J1824+107 for amplitude and phase calibration. We measured flux densities between 0.74 and 0.79 Jy for J1824+107 in the seven runs, i.e., a dispersion of which includes flux density calibration uncertainties and intrinsic variability of the quasar. All data reduction was done with the NRAO software package AIPS following standard spectral-line procedures. The H2CO maser positions measured with the VLA (A configuration) in 2003 and 2007 agree within mas.
2.3 GBT Observations
The Green Bank Telescope (GBT) was used on five dates in 2008 to observe the H2CO maser (see Table 1, online version). The GBT H2CO flux density measurements from 2008, together with prior GBT observations from the literature (Araya et al. 2007b) are shown in Figure 1.
The quasar J1851+005 was observed for pointing and focus adjustments. The pointing corrections were less than 8′′. The observations of April 07 and 15, 2008, were done in standard position switching mode with integration times on-source between 5 to 10 min. The observations in May and October 2008 were conducted in frequency switching mode, with integration time on-source between 10 and 30 min. We used the GBT spectrometer, with a bandwidth of 12.5 MHz (775 km s-1), 8192 channels (0.094 km s-1 channel width) and dual circular polarization. The system temperature was K in all runs. After checking for RFI and consistency between the two circular polarizations, the data were averaged and smoothed to a channel width of 0.38 km s-1. All data reduction was done in IDL using the GBTIDL procedures.444http://gbtidl.nrao.edu/
2.4 MERLIN Observations
High angular resolution observations of the 6.7 GHz CH3OH masers in IRAS 18566+0408 were conducted with Multi-Element Radio Linked Interferometer Network (MERLIN)555MERLIN is a National Facility operated by the University of Manchester at Jodrell Bank Observatory on behalf of STFC. on April 03, 04, and 20, 2008, to determine the location of the CH3OH masers with respect to the H2CO maser. The pointing position was R.A. = 18h59m09.98s, decl. = 04∘12′15.6′′(J2000). The CH3OH masers were observed with a bandwidth of 0.5 MHz and 255 channels (1.96 kHz, 0.088 km s-1 channel width). Each observing run lasted approximately 10 hours. The quasar 1904+013 was observed as complex gain calibrator with a broad bandwidth (13 MHz) during approximately 2 minutes for every minutes observation of the CH3OH masers. We observed 3C84 in the narrow (0.5 MHz) and wide (13 MHz) setups to determine the solutions needed to transfer the phase calibration from the wide to the narrow band. 3C84 was also used as bandpass and flux density calibrator (a flux density of 15.7 Jy was assumed).
Poor phase tracking affected the observations of April 03 and 04, 2008, thus the astrometry of the MERLIN observations discussed in this paper comes from the phase referenced observations of April 20, 2008. To increase signal to noise, we combined all MERLIN data and used the position of the brightest CH3OH maser from the 2008 April 20 observations as initial model for self-calibration. The synthesized beam of the self-calibrated data is 73 42 mas, 22∘ position angle; the final rms is mJy b-1. The self-calibrated data were used to create Figure 3. Including uncertainties in the phase reference source position, the telescope positions, and phase transfer errors, we estimate that the total astrometric uncertainty of our MERLIN data is 35 mas.
3 Results
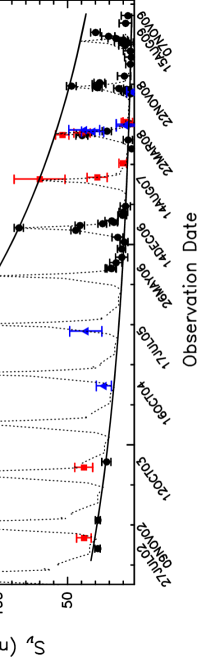
We detected five new flare events and discovered periodicity (see Figure 1); IRAS 18566 +0408 is the only (quasi)periodic H2CO maser system known. The flares have a periodicity of 237 days, a duration (at half-maximum) of 30 days, and an order of magnitude increase in flux density. The peak flare intensity and maser intensity during the quiescent state show a monotonic decay (Figure 1). Possible causes of the decay include changes in maser pumping and gas motions affecting beaming.
The flares are not strictly periodic. The period derived from the December 2006 and November 2008 flares is 2384 days, and the period derived from the December 2006 and March 2008 flares is 2341 days. The flare of August 2009 was well-sampled during the rising part of the flare, but we do not have a good determination of its peak. Assuming that the measurement of August 15, 2009 corresponds to the maximum of the flare, then the period would be 2444 days. If the 2002 flare were part of a periodic cycle of outbursts, then the period would be 2485 days (the uncertainties are 3 errors from autocorrelation analysis). Most of the recent flares have a shorter period than the one estimated from the data prior to 2007.
The combined effect of (quasi)periodic flares, monotonic flux density decay, and tendency toward decreasing period as a function of time are exemplified by the dotted-line in Figure 1. The dotted-line was generated as follows: 1) the light-curve from May 2006 to January 2007 was used as a template; 2) the template was extrapolated assuming an exponential decrease in the interval between consecutive flare peaks (days, where for the interval between the December 2006 and August 2007 flares, for the interval between the August 2007 and March 2008 flares, etc.), and an exponential decay in the maser flux density (mJy, where is the Julian date of the December 2006 flare peak). This simple extrapolation (representative fit) based on the 2006 – 2007 observations roughly reproduces the peak date and variability profile of the flares, as well as the flux density measurements between 2003 and 2005. The flare of August 2009 shows that the period is neither constant nor strictly monotonically decreasing. Nevertheless, the occurrence of the flares has been regular enough to successfully predict the approximate date of the 2008 and 2009 flares to schedule observations. Indeed, the MERLIN observations were scheduled to coincide with the predicted flare of April 2008 (Figure 2).
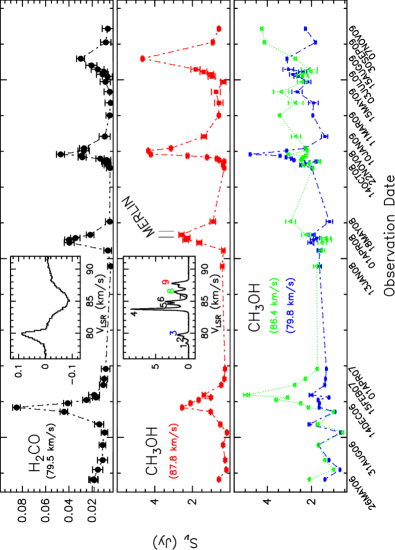
We also monitored the 6.7 GHz CH3OH transition with Arecibo. The 6.7 GHz CH3OH spectrum shows a group of nine maser components spread between 78 and 88 km s-1. Figure 2 shows the H2CO and CH3OH spectra obtained on December 14, 2006, and the light curve of the H2CO maser and three CH3OH maser components. We discovered that the CH3OH maser component at 87.8 km s-1 (hereafter component 9) shows flares that are similar to the H2CO maser flares. Specifically, the peaks of all CH3OH (component 9) flares were simultaneous (within 10 days) to the peaks of the H2CO flares.666The 2008 March flare is a possible exception. Two CH3OH measurements separated by 14 days gave the same flux density within 3, which implies an uncertainly on the peak flare of 14 days. IRAS 18566+0408 is thus the first system where (quasi)periodic correlated maser flares of CH3OH and H2CO molecules have been detected, and one of only a few CH3OH periodic flare systems known (e.g., Goedhart et al. 2004, 2009).
The other CH3OH maser components also show variability but not as well-correlated to the H2CO maser (see for example Figure 2, bottom panel). We discuss briefly the implications of the variability of the other CH3OH masers in 4, but an in-depth discussion of the variability of all CH3OH masers is beyond the scope of this work.
4 Discussion
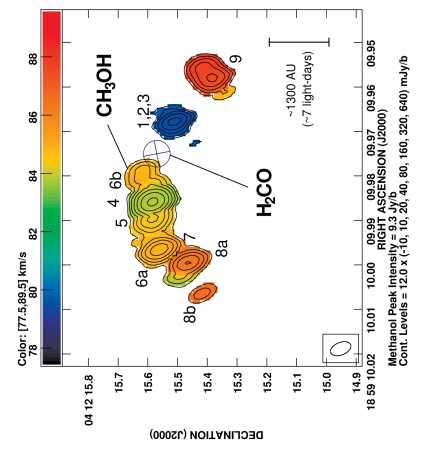
The velocities of the CH3OH maser component 9 and the H2CO maser (Figure 2, insets) differ by 8.3 km s-1, and the masers are separated by 2000 AU (12 light-days, 0.32′′) in projection (Figure 3). Given that the two masers showed simultaneous flares, the origin of the flares is not located in either one of the maser regions, otherwise one component would have always flared before the other. The different variability behavior of the different CH3OH components shows that the flares are not caused by an homogeneous and large-scale change in the background radio continuum, e.g., in the flare of 2006, the CH3OH component 3 did not show a flare even though it is located in between H2CO and CH3OH masers that showed a flare (compare the position of the masers shown in Figure 3 with the light curves of Figure 2). We therefore find unlikely that the flares are caused by a change in the background radio continuum.
It is also unlikely that the flares are triggered by a propagating sound/density wave or shock front. For example, assuming that the CH3OH component 9 and H2CO masers are located at the same distance from the source that triggers the variability (explaining simultaneous flares), then the minimum distance between the driving source and the masers is AU (i.e., masers and driving source located in the plane of the sky; see Figure 3). This minimum distance implies that the travel time of a 10 km s-1 wave from its origin to the maser regions is yr, which is far greater than the time scale of the flares (i.e., 30 days flare duration, 237 days periodicity). Faster (J-)shocks (100 km s-1 and greater) are unlikely because the molecules would disassociate with the passing of a single shock front (e.g., Hollenbach & McKee 1989, Garay et al. 2002), instead of showing periodic variability. The absence of significant changes in line peak velocity and linewidth, as well as the smooth decay of the maser emission during the quiescent phase argue against the J-shock hypothesis.
In contrast, a radiative origin of the flares appears more likely. If the two maser regions are in the plane of the sky with the source of pumping radiation between them (assumed hereafter to be the massive protostar or its surroundings), then the radiation front would take only about 6 days to reach the maser regions. This travel time provides a better match to the time scales of the flares. In addition, changes in maser gain due to variability of the radiation field are consistent with the excitation mechanism of Class II CH3OH masers (i.e., infrared pumping, Cragg et al. 2005).
Given that the CH3OH and H2CO masers show correlated variability, the excitation mechanism of the two maser species must be similar. The excitation mechanism of H2CO masers has been a controversial topic (Araya et al. 2006, 2007c; Hoffman et al. 2003); our discovery of correlated H2CO and CH3OH masers shows that the excitation mechanism of H2CO masers is probably infrared pumping.
The periodic behavior of the flares could be caused by a variety of astrophysical processes; chief among these are stellar pulsations and binary induced variability. Some types of pulsating variable stars have periods of hundreds of days (e.g., Eyer et al. 2008). Nevertheless, the light curves of such pulsating stars are significantly different from the flare-like periodic variability of the H2CO and CH3OH masers. Pulsations of massive protostars (and/or inner accretion disks) cannot be ruled out until detailed numerical modeling is conducted.
An alternative possibility appears more likely: variability modulated by a binary system. Binarity and multiplicity are ubiquitous characteristics of massive stars on both theoretical and observational grounds (e.g., Krumholz et al. 2009; Kraus et al. 2007). The orbital periods of visual and spectroscopic massive binaries range between a few days to many years (e.g., Zinnecker & Yorke 2007), encompassing the time scale of the periodic maser flares in IRAS 18566+0408. In addition, the observed misalignment between an ionized jet, a Spitzer IRAC 4.5m excess, and a SiO outflow could be caused by precession due to a binary system (Araya et al. 2007c, Zhang et al. 2007).
Recently, van der Walt et al. (2009) proposed that the CH3OH flares in G9.62+0.20E (which have a periodicity very similar to the H2CO and CH3OH flares in IRAS 18566+0408) are modulated by variability from a colliding wind binary, responsible for a change in the background radio continuum and/or pumping radiation. Even though such a colliding wind model reproduces the variability of the CH3OH maser flares in G9.62+0.20E, we consider the model unlikely in the case of IRAS 18566+0408. The H2CO flares are not strictly periodic (Figure 1), thus, an additional, stochiastic mechanism is implicated. Minor local turbulence could superimpose irregularities on the response to a periodic cause but does not explain the combination of decay and irregularity.
Here we propose an alternative scenario for the maser flares in IRAS 18566+0408: periodic accretion of circumbinary disk material. This process has been predicted and has observational evidence in the case of some young, low mass binaries (Artymowicz & Lubow 1996; Jensen et al. 2007; Günther & Kley 2002; Mundt et al. 2010). In this scenario, material from the circumbinary disk is accreted onto the protostars or accretion disks, heating the dust and increasing the infrared radiation field, resulting in higher microwave amplification due to greater maser gain. For example, the smoothed particle hydrodynamics simulations by Artymowicz & Lubow (1996) show that a binary system with mass ratio 0.79 and eccentricity , will experience bursts of accretion onto the binary components with a dimensionless time-dependence that is quite similar to the H2CO light-curve. In a binary with mass ratio 0.8 (e.g., a 20 and 16 M⊙ binary) and , a periodicity of 240 days is expected if the semimajor axis of the most massive component is 1.1 AU. The short flare events traced by H2CO and CH3OH masers in IRAS 18566+0408 (this work) and CH3OH masers in G9.62+0.20E (Goedhart et al. 2004) could be caused by an orbital configuration similar to the one discussed above. Less flare-like (more undulated and/or aperiodic) variability seen in other CH3OH maser sources (Goedhart et al. 2004) would be expected from binary systems with lower eccentricities (see Artymowicz & Lubow 1996). This is, the model of Artymowicz & Lubow (1996) could explain not only the time scale for the periodicity, but also the duration of the flaring events, depending essentially on the eccentricity of the binary system. Thus, periodic maser flares could trace the properties of young massive binaries that are actively accreting. Moreover, accretion of circumbinary material may cause mass equalization in massive binaries. For example, in the model of Artymowicz & Lubow (1996), the lower mass component of the binary is the one with a higher accretion rate (see however Günther & Kley 2002).
5 Summary
We detected the first (quasi)periodic H2CO maser flare system. The maser is coincident with a massive protostellar candidate (IRAS 18566+0408). The periodicity of the flares is approximately 237 days. We also detected 6.7 GHz CH3OH flares that are correlated to the H2CO outbursts. Regardless of whether the H2CO maser flares reported in this work unveil tight massive binaries still undergoing accretion or some other process, our discovery shows that short time-scale changes (weeks to months) in physical conditions surrounding massive protostars are not random, but that underlying (semi)harmonic mechanisms are at work during the process of massive star formation.
References
- Araya et al. (2006) Araya, E., Hofner, P., Goss, W. M., Kurtz, S., Linz, H., & Olmi, L. 2006, ApJL, 643, 33
- Araya et al. (2008) Araya, E. D., Hofner, P., Goss, W. M., Linz, H., Kurtz, S., & Olmi, L. 2008, ApJS, 178, 330
- Araya et al. (2007a) Araya, E., Hofner, P., Goss, W. M., Linz, H., Kurtz, S., Olmi, L. 2007a, ApJS, 170, 152
- Araya et al. (2007b) Araya, E., et al. 2007b, ApJL, 654, 95
- Araya et al. (2007c) Araya, E. et al. 2007c, ApJ, 669, 1050
- Araya et al. (2005) Araya, E., et al. 2005, ApJ, 618, 339
- Araya et al. (2004) Araya, E., et al. 2004, ApJS, 154, 579
- Artymowicz & Lubow (1996) Artymowicz, P., & Lubow, S. H. 1996, ApJL, 467, 77
- Benjamin et al. (2003) Benjamin, R. A., et al. 2003, PASP, 115, 953
- Beuther et al. (2002) Beuther, H., Schilke, P., Sridharan, T. K., Menten, K. M., Walmsley, C. M., & Wyrowski, F. 2002, A&A, 383, 892
- Cragg et al. (2005) Cragg, D. M., Sobolev, A. M., & Godfrey, P. D. 2005, MNRAS, 360, 533
- Eyer et al. (2008) Eyer, L., & Mowlavi, N. 2008, Journal of Physics. Conf. Ser., 118, 2010
- Garay et al. (2002) Garay, G., Mardones, D., Rodríguez, L. F., Caselli, P., & Bourke, T. L. 2002, ApJ, 567, 980
- Goedhart et al. (2004) Goedhart, S., Gaylard, M. J., & van der Valt, D. J. 2004, MNRAS, 355, 553
- Goedhart et al. (2009) Goedhart, S., Langa, M. C., Gaylard, M. J., & van der Walt, D. J. 2009, MNRAS, 398, 995
- Günther & Kley (2002) Günther, R., & Kley, W. 2002, A&A, 387, 550
- Hoffman et al. (2003) Hoffman, I. A., Goss, W. M., Palmer, P., & Richards, A. M. S. 2003, ApJ, 598, 1061
- Hollenbach & McKee (1989) Hollenbach, D., & McKee, C. F. 1989, ApJ, 342, 306
- Jensen et al. (2007) Jensen, E. L. N., et al. 2007, AJ, 134, 241
- Kraus et al. (2007) Kraus, S., et al. 2007, A&A, 466, 649
- Krumholz et al. (2009) Krumholz, M. R., Klein, R. I., McKee, C. F., Offner, S. S. R., & Cunningham, A. J. 2009, Science, 323, 754
- Mundt et al. (2010) Mundt, R., Hamilton, C. M., Herbst, W., Johns-Krull, C. M. & Winn, J. N. 2010, ApJL, 708, 5
- Sridharan et al. (2002) Sridharan, T. K., Beuther, H., Schilke, P., Menten, K. M., & Wyrowski, F. 2002, ApJ, 566, 931
- van der Walt et al. (2009) van der Walt, D. J., Goedhart, S., & Gaylard, M. J. 2009, MNRAS, 398, 961
- Zhang et al. (2007) Zhang, Q., Sridharan, T. K., Hunter, T. R., Chen, Y., Beuther, H., & Wyrowski, F. 2007, A&A, 470, 269
- Zinnecker & Yorke (2007) Zinnecker, H., & Yorke, H. W. 2007, ARA&A, 45, 481
| Date | Sν (mJy) | RMS (mJy) | Telescope |
|---|---|---|---|
| 27 Jul. 2002 | 28.5 | 1.3 | Arecibo |
| 18 Sep. 2002 | 38.3 | 3.5 | VLA-CnB |
| 09 Nov. 2002 | 118 | 10 | GBT |
| 15 Nov. 2002 | 146.2 | 8.2 | GBT |
| 16 Dec. 2002 | 28.3 | 1.2 | Arecibo |
| 05 Sep. 2003 | 38.4 | 4.3 | VLA-A |
| 12 Oct. 2003 | 22.1 | 2.2 | Arecibo |
| 16 Oct. 2004 | 23.9 | 3.6 | GBT |
| 17 Jul. 2005 | 36.9 | 7.7 | GBT |
| 25 May 2006 | 18.4 | 2.2 | Arecibo |
| 26 May 2006 | 19.0 | 2.7 | Arecibo |
| 27 May 2006 | 19.0 | 2.4 | Arecibo |
| 23 Jun. 2006 | 15.3 | 2.9 | Arecibo |
| 20 Jul. 2006 | 11.2 | 2.9 | Arecibo |
| 31 Aug. 2006 | 11.2 | 1.9 | Arecibo |
| 05 Oct. 2006 | 9.5 | 1.9 | Arecibo |
| 28 Oct. 2006 | 14.1 | 2.6 | Arecibo |
| 02 Dec. 2006 | 44.3 | 2.2 | Arecibo |
| 14 Dec. 2006 | 85.1 | 2.2 | Arecibo |
| 26 Dec. 2006 | 41.2 | 2.2 | Arecibo |
| 04 Jan. 2007 | 25.1 | 2.1 | Arecibo |
| 11 Jan. 2007 | 16.9 | 1.9 | Arecibo |
| 18 Jan. 2007 | 18.4 | 3.1 | Arecibo |
| 15 Feb. 2007 | 10.7 | 2.1 | Arecibo |
| 04 Mar. 2007 | 9.9 | 2.1 | Arecibo |
| 01 Apr. 2007 | 8.5 | 2.5 | Arecibo |
| 14 Aug. 2007 | 70 | 12 | VLA-A |
| 24 Aug. 2007 | 28.7 | 4.8 | VLA-A |
| 01 Nov. 2007 | 10.4 | 1.8 | VLA-B |
| 13 Jan. 2008 | 4.2 | 1.8 | Arecibo |
| 26 Feb. 2008 | 6.7 | 2.2 | Arecibo |
| 19 Mar. 2008 | 39.8 | 2.9 | Arecibo |
| 22 Mar. 2008 | 53.8 | 3.2 | VLA-C |
| 27 Mar. 2008 | 40.0 | 2.5 | Arecibo |
| 01 Apr. 2008 | 39.6 | 3.9 | VLA-C |
| 01 Apr. 2008 | 34.5 | 2.7 | Arecibo |
| 07 Apr. 2008 | 32.0 | 5.3 | GBT |
| 11 Apr. 2008 | 21.8 | 2.2 | Arecibo |
| 15 Apr. 2008 | 38.0 | 7.4 | GBT |
| 05 May 2008 | 5.0 | GBT | |
| 14 May 2008 | 5.0 | GBT | |
| 18 May 2008 | 5.1 | 2.3 | Arecibo |
| 23 May 2008 | 7.4 | 2.7 | VLA-C |
| 26 May 2008 | 7.9 | 1.5 | VLA-C |
| 14 Oct. 2008 | 4.8 | 1.9 | Arecibo |
| 22 Oct. 2008 | 2.5 | GBT | |
| 23 Oct. 2008 | 6.8 | 2.0 | Arecibo |
| 27 Oct. 2008 | 7.9 | 2.2 | Arecibo |
| 02 Nov. 2008 | 8.7 | 2.2 | Arecibo |
| 06 Nov. 2008 | 7.7 | 2.4 | Arecibo |
| 10 Nov. 2008 | 13.3 | 2.4 | Arecibo |
| 14 Nov. 2008 | 28.7 | 2.3 | Arecibo |
| 18 Nov. 2008 | 29.4 | 1.7 | Arecibo |
| 22 Nov. 2008 | 47.3 | 2.3 | Arecibo |
| 02 Dec. 2008 | 27.4 | 3.3 | Arecibo |
| 09 Dec. 2008 | 27.1 | 2.6 | Arecibo |
| 10 Jan. 2009 | 9.4 | 3.2 | Arecibo |
| 11 Mar. 2009 | 5.1 | 2.1 | Arecibo |
| 14 Apr. 2009 | 3.1 | Arecibo | |
| 15 May 2009 | 3.2 | Arecibo | |
| 12 Jun. 2009 | 8.8 | 2.9 | Arecibo |
| 27 Jun. 2009 | 7.0 | 2.9 | Arecibo |
| 03 Jul. 2009 | 11.3 | 3.4 | Arecibo |
| 09 Jul. 2009 | 10.1 | 2.1 | Arecibo |
| 17 Jul. 2009 | 15.4 | 3.7 | Arecibo |
| 27 Jul. 2009 | 20.8 | 3.2 | Arecibo |
| 15 Aug. 2009 | 30.0 | 2.3 | Arecibo |
| 30 Sep. 2009 | 8.4 | 3.0 | Arecibo |
| 07 Nov. 2009 | 6.8 | 3.1 | Arecibo |
Note. — Data prior 2006 is from Araya et al. (2004, 2005, 2007a, 2008). The synthesized beams of our VLA observations in A, B, and C configurations were approximately 0.5′′, 1.7′′, and 5′′, respectively.