Long-term & large-scale viscous evolution of dense planetary rings.
Abstract
Planetary rings are common in the outer Solar System but their origin and long-term evolution is still a matter of debate. It is well known that viscous spreading is a major evolutionary process for rings, as it globally redistributes the disk’s mass and angular momentum, and can lead to the disk’s loosing mass by infall onto the planet or through the Roche limit. However, describing this process is highly dependent on the model used for the viscosity. In this paper we investigate the global and long-term viscous evolution of a circumplanetary disk. We have developed a simple 1D numerical code, but we use a physically realistic viscosity model derived from N-body simulations (Daisaka et al., 2001), and dependent on the disk’s local properties (surface mass density, particle size, distance to the planet). Particularly, we include the effects of gravitational instabilities (wakes) that importantly enhance the disk’s viscosity. This method allows to study the global evolution of the disk over the age of the Solar System.
Common estimates of the disk’s spreading time-scales with constant viscosity significantly underestimate the rings’ lifetime. We show that, with a realistic viscosity model, an initially narrow ring undergoes two successive evolutionary stages: (1) a transient rapid spreading when the disk is self-gravitating, with the formation of a density peak inward and an outer region marginally gravitationally stable, and with an emptying time-scale proportional to (where is the disk’s initial mass) (2) an asymptotic regime where the spreading rate continuously slows down as larger parts of the disk become not-self-gravitating due to the decrease of the surface density, until the disk becomes completely not-self-gravitating. At this point its evolution dramatically slows down, with an emptying time-scale proportional to , which significantly increases the disk’s lifetime compared to the case with constant viscosity. We show also that the disk’s width scales like with the realistic viscosity model, while it scales like in the case of constant viscosity, resulting in much larger evolutionary time-scales in our model. We find however that the present shape of Saturn’s rings looks like a 100 million-years old disk in our simulations. Concerning Jupiter’s, Uranus’ and Neptune’s rings that are faint today, it is not likely that they were much more massive in the past and lost most of their mass due to viscous spreading alone.
keywords:
Disks , Planetary rings , Saturn, rings1 Introduction
Saturn’s rings are one of the most puzzling object of the Solar System. They’ve been studied for over 400 years since their discovery by Galileo in the early 17th century, but still many key questions remain unanswered. In particular, how old the rings are is still a matter of debate. While published scenarios for their origin suggest an early formation in the history of the Solar System: (1) remnant of Saturn’s sub-nebula disk (Pollack et al., 1973), (2) tidal disruption of a comet (Dones, 1991; Charnoz et al., 2009b), (3) destruction of a satellite inside Saturn’s Roche zone (Pollack et al., 1973; Harris, 1984; Charnoz et al., 2009b), observations and theoretical arguments such as the viscous spreading of the A ring in a few hundred million years (Esposito, 1986), or the low meteoritic pollution of the rings (Cuzzi and Estrada, 1998), lead to the conclusion that they must be quite young. Thus we are in a paradoxical situation.
The rings’ evolution is regulated through 3 main physical processes. (1) Viscous spreading: particle collisions dissipate energy while conserving the total angular momentum, resulting in the spreading of the disk with the mass being transferred inward and the angular momentum outward (Lynden-Bell and Pringle, 1974; Goldreich and Tremaine, 1982), (2) Interactions with the planet’s satellites at resonances (Goldreich and Tremaine, 1979), and (3) Meteoritic bombardment (Cuzzi and Estrada, 1998). All these processes modify the disk’s angular momentum and transport material, which can thus leave the disk when it reaches the planet’s radius or crosses the Roche limit where it can start to be accreted into small moons (Charnoz et al., , In press). These processes can then cause a drop of the disk’s mass. Seeing how they strongly influence the possible lifetime of the rings, the paradox stated above must come from an insufficient understanding of these processes on the long term and from a lack of models. A more detailed and global study of these processes over long time-scales is needed.
While process (3) is specific to Saturn’s rings, processes (1) and (2) are common to other disks in the universe, for instance protoplanetary disks, accretion disks, or galaxies. But Saturn’s rings are particular in the sense that they are devoid of gas and composed only of macroscopic particles, so that pressure and radiative effects can be neglected compared to gravitational effects. Consequently, while the approach remains valid, results on the evolution of a gaseous disk under the aforementioned processes cannot be directly transposed to Saturn’s rings but have to be studied considering their specificities.
The viscous spreading of a disk has already been studied, particularly accretion disks (Lynden-Bell and Pringle, 1974; Bath and Pringle, 1981; Pringle, 1981). However, this process is highly dependent on the model used to describe the disk’s viscosity. Several important works have been published on local properties of the rings (Wisdom and Tremaine, 1988; Salo, 1992; Richardson, 1994; Daisaka and Ida, 1999; Ohtsuki and Emori, 2000; Daisaka et al., 2001), resulting in precise estimates of the viscosity dependence on the disk’s parameters (surface density, particle properties, …), but these local properties have not been studied yet on large spatial and temporal scales. In this paper we focus our study on the viscous spreading of the disk considering a physically realistic viscosity model and the evolution of the whole disk. Eventually, constrain the evolution of the rings will require to consider many different physical processes, but this is for now well beyond current computer capacity. Moreover, questions such as the spreading rate of the rings, the amount of material falling onto the planet or leaving the rings through their outer limit, are important issues that still need to be addressed.
Published estimates of the rings’ viscous age are viscous time-scales that give the time needed for a ring with constant viscosity to reach the width . However, we can expect the viscosity of the rings to be a rapidly varying function of the disk’s local properties (surface mass density, ring particle’s radius, distance to the planet), so that such time-scales might be substantially inaccurate.
In this work we study the effects of a time-dependent and space-dependent viscosity model on the long term viscous evolution of the complete ring system. We perform 1-dimensional numerical simulations, along the radial direction, of the disk’s viscous evolution. This implies simplifications of the physics but allows for simulations over many dynamical times (typically the age of the Solar System). As a consequence, our results will be a first-order study of the global viscous evolution of dense planetary rings. However, it may give us clues to understand what has led to the rings we can observe today. Moreover, this approach has already been used with important results in the study of protoplanetary disks (e.g. Takeuchi et al., 1996; Alibert et al., 2005).
In section 2 we describe the viscosity model and the numerical procedure. In section 3 we study the viscous evolution of an initially narrow ring over 5 billion years using two models: constant viscosity (hereafter CV) and non constant viscosity (hereafter NCV), and develop analytical time-scales to describe the disk’s evolution. In section 4 we analyse the influence of ring parameters. In section 5 we summarize the results and discuss the evolution of today’s rings of Saturn in the light of these results.
2 Numerical method and viscosity model
In this section we present the hydrodynamical equations describing the evolution of the rings, the viscosity model we use, and the principles of the numerical code we have developed. While adopting a very general approach, we present our results for the case of Saturn’s rings.
2.1 Basic equations
We use a 1-dimensional approach to study the viscous evolution of a Keplerian pressureless disk. To compute the evolution of the surface density of an elementary annulus of the rings located at distance R from the planet and at time t, we use the same approach as Pringle (1981). The equation of mass conservation reads:
| (1) |
where is the radial velocity. The angular momentum conservation reads:
| (2) |
where is the orbital frequency, with G the gravitational constant and M the planet’s mass, and is the kinematic viscosity. Combining Eqs. (1) and (2) and replacing by its expression we get a single equation for the temporal evolution of the surface density:
| (3) |
2.2 Viscosity model
2.2.1 Description of the model
The viscosity of a disk is related to angular momentum transport through particle interactions. The angular momentum flux reads (Lynden-Bell and Pringle, 1974)
| (4) |
Using the Boltzmann equation, one can derive this angular momentum flux as (Takeda and Ida, 2001)
| (5) |
where is the mean tangential velocity averaged azimuthally. The viscosity can then be computed by estimating the angular momentum flux and inverting Eq. (4).
Angular momentum transport can be divided in three components, each one related to a specific viscosity. The translational viscosity is related to the transport of angular momentum due to the random motion of particles (usually referred to as the “local” component, see Goldreich and Tremaine (1978)). Due to their finite size, angular momentum is also transported via sound waves travelling between the centres of colliding particles (usually referred to as the “non-local” component). This is represented by the collisional viscosity (Araki and Tremaine, 1986; Wisdom and Tremaine, 1988). Finally, angular momentum is transported by gravitational scattering of particles due to the presence of self-gravity wakes (Salo, 1992, 1995; Richardson, 1994; Daisaka and Ida, 1999; Ohtsuki and Emori, 2000). This is represented by the gravitational viscosity .
The self-gravity wakes are gravitational aggregates induced by the effects of both self-gravity and collisional damping of particles. Outside of a wake, particles move randomly, but inside their motion becomes coherent, which yields systematic motion with large bulk viscosity (Salo, 1995; Daisaka and Ida, 1999). The wakes modify the angular momentum transport, and thus the viscosity, through the gravitational torque (Larson, 1984) and the wake motion (Lin and Pringle, 1987). Two regimes must then be considered, whether the disk is gravitationally stable (no wakes) or not. This is measured by the Toomre Q parameter (Toomre, 1964)
| (6) |
where is the particle radial velocity dispersion. Even though Toomre showed that the disk is gravitationally unstable for , N-body simulations by Salo (1995) showed that wakes start to form for .
In our simulations, we use the following formulations for the viscosity components. We set the transition between the two regimes, self-gravitating and not-self-gravitating (hereafter SG and NSG), strictly at .
| (7) |
with
| (8) |
| (9) |
| (10) |
where is the optical depth with and the particle’s radius and density. is a dimensionless parameter equal to the ratio of the particle’s Hill radius to its physical diameter: with , and is the particle’s mass. It’s basically a dimensionless measure of the distance to the planet, while the optical depth serves as a dimensionless measure of the disk’s surface mass density.
In the NSG regime (), the translational viscosity is an analytical result from Goldreich and Tremaine (1978) (Eq. (8), top), and the collisional viscosity is an analytical result from Araki and Tremaine (1986) (Eq. (9)). In the SG regime () (Eqs. 8, bottom & 10, bottom), we use the results of Daisaka et al. (2001), as they are the first to include the effects of the wakes in the calculation of the viscosity. They performed multiple 3D shearing box N-body simulations, including the effects of self-gravity wakes, with 1m-radius particles. Their set of parameters includes high and low densities, which is suitable to track the rings’ evolution in a large variety of physical conditions. Note that although the collisional viscosity is also enhanced in the presence of wakes, its value is about one order of magnitude smaller than the translational and gravitational viscosity in that case, according to the simulation results of Daisaka et al. (2001). Thus we use the same prescription for the collisional viscosity whether the disk is gravitationally stable or not.
The parameter is also expressed in Daisaka et al. (2001) as , where is the self-gravity force between particles, and is the impulsive force exerted on particles during collisions. This can be used to evaluate the velocity dispersion . If , dominates and the velocity dispersion is the relative Keplerian velocity between particles . Conversely, if , dominates and the velocity dispersion is regulated to be the particle’s surface escape velocity (Salo, 1995; Daisaka and Ida, 1999; Ohtsuki, 1999). For Saturn’s rings we have so in the following we always consider that . Note that we do not consider here the effects of thermal conduction that could modify the velocity dispersion.
Toomre’s Q parameter depends on the disk’s local properties: it decreases with surface mass density and distance to the planet R. Some parts of the disk may then be gravitationally stable while others are not, and we can expect theses regions to undergo distinct evolutions. As the disk evolves, the surface density will decrease because of the disk’s spreading, and the Toomre Q parameter will increase. Then regions initially self-gravitating may become not-self-gravitating as the disk evolves, leading to local modifications of the viscosity. Note that with the adopted prescription of the velocity dispersion, Q is also proportional to . So a disk with bigger particles will be more likely to become not-self-gravitating.
2.2.2 Viscosity dependence on ring parameters
The viscosity components depend on several parameters that are likely to vary within the rings: particle radius, surface mass density and distance to the planet (Eqs. (8) and (9)). Even though this model may be used for any planetary ring, we are most interested in Saturn’s rings. Here we discuss the resulting viscosity for the specific case of Saturn. As an example, we plot in Fig. 1 the variation of and , for a constant value of the surface density (, the surface density of today’s A ring, Tiscareno et al., 2007), with respect to R and for different values of .
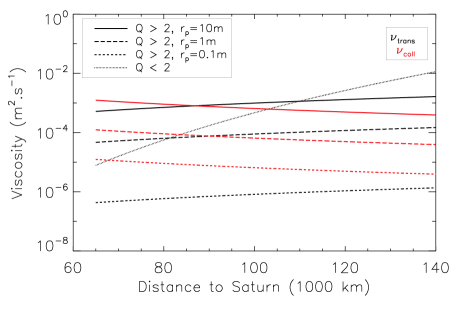
Both translational and collisional viscosities increase with particle radius, but they have opposite dependences on the distance to the planet: the collisional (translational) viscosity decreases (increases) with R. In the SG regime, the particle radius does not modify the value of the viscosity itself, but it impacts Toomre’s Q parameter which controls the areas of the rings that are in the SG regime.
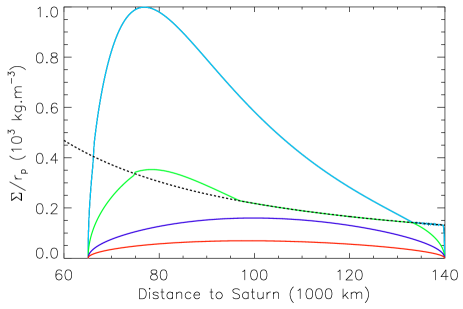
As the disks spreads, its surface density will decrease. Transitions from SG to NSG regimes might thus occur, leading to important variations of the viscosity. To identify the effect of a self-gravity regime transition on the viscosity, we study the relative magnitude of the theoretical viscosities in the two regimes, and analyse the position of the transition in the space of parameters . The result is plotted in Fig. 2, for particles with .
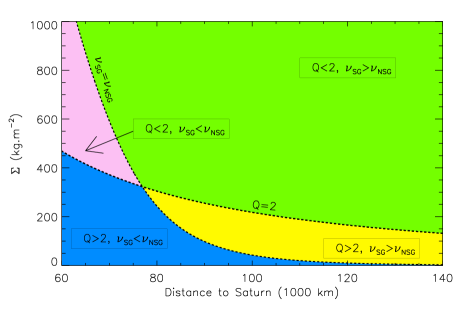
A transition between the SG to the NSG regime will occur at a given distance R when the surface density goes below the limit represented by the dashed-black curve for which . Close to the planet, the transition from the pink to the dark blue region will lead to an increase of the viscosity, because in these regions . Far from the planet, the transition from the green to the yellow region will lead to a decrease of the viscosity, because in these regions . The transitions between the two behaviours occurs at .
This might be explained by looking into the particle velocity dispersion. Inside a wake, this velocity is the escape velocity: . In the absence of wakes, the velocity dispersion is the difference of orbital speed between two particle distant by : . Far from the planet, the velocity in a wake is greater, while close to the planet the difference of orbital velocity dominates. Equalizing the two expressions shows a transition around , which is in good agreement with the transition observed in Fig. 2.
2.3 A simple code
2.3.1 Numerical procedure
We have developed a 1D finite elements code on a staggered mesh: the surface density is estimated on a regular grid, and its evolution is computed by estimating the mass fluxes at the inner and outer edges of each bin of the grid. This allows a second order accuracy in space derivatives.
By integrating Eq. (3) over the bin width dR, the variation over a time step dt of the surface density in the bin i is given by:
| (11) |
The flux at time t reads:
| (12) |
It is estimated using a second-order (in space and time) explicit Runge-Kutta scheme.
As in any numerical procedure we can’t study scales smaller than the grid resolution ( per bin). As a result we don’t expect to see small-scale instabilities such as self-gravity wakes, or viscous overstabilities (Latter and Ogilvie, 2009), appear in our simulations. Moreover, as we use a constant value for the velocity dispersion, we do not satisfy the conditions for viscous instabilities to appear. Anyway the purpose of this work is to study the rings evolution on large scales, and even though the full resolution of the hydrodynamics equations in 2 or 3D would be desirable (e.g. like in Baruteau and Masset, 2008; Masset and Casoli, 2009), such codes are limited to short time-scales. We keep the main physical ingredients in this 1D model, allowing us to perform simulations over 5 billion years.
2.3.2 Validation
To validate numerically the behaviour of our code we check that the system’s mass is numerically conserved. We perform a simulation starting with an initially narrow ring with Gaussian shape and an arbitrary initial mass. The boundary conditions are set so that material cannot pass through the limits of the domain: the disk is “trapped” inside the domain. We let the ring evolve viscously and compute the total mass of the disk using the output surface density. The initial viscous time-scale is years for . After 100 million years of evolution (about 9000 viscous time-scales), the mass is equal to its original value down to the machine precision (). Our code numerically conserves the system’s mass.
Equation 3 includes the equation of angular momentum conservation, so by construction our code should also conserves angular momentum, as long as the disk has not reached the domain’s limits where the boundary conditions cause modification of the disk’s angular momentum. During the period where the disk spreads freely between the domain’s limits, we have checked that angular momentum is also numerically conserved down to machine precision.
In order to validate the general behaviour of the code, we investigated the solution given by Pringle (1981) for the viscous spreading of an accretion disk with constant viscosity. Our numerical results are in good agreement with the analytical solution, even though slightly different because the width of the radial grid does not allow to define an initial ring with a perfect Dirac distribution.
3 Viscous spreading with variable viscosity
Here we study the viscous evolution of a “standard model” using CV and NCV models. We present first the disk initial conditions, then the viscous evolution over 5 billions years, and finally we focus on the evolution of the disk’s mass.
3.1 Description of the standard model
3.1.1 Initial profile
The initial state of Saturn’s rings is dimly constrained, as it depends on the formation scenario, which is still subject to discussions. For instance the scenario based on the destruction of a satellite via a cometary impact implies that the satellite that created the rings must be outside the synchronous orbit and inside the Roche limit for ice at the time of the impact (Charnoz et al., 2009b). But we have no further constraints on the initial rings width, position, surface mass density, particle size distribution… For the sake of simplicity and generality, the initial conditions are defined as follows:
Initial surface density profile
We consider at that the disk is a narrow ring wide with Gaussian profile. This is useful to study its evolution over several viscous time-scales. The ring centre is set slightly outside the synchronous orbit , which is more or less the middle of today’s ring system. The influence of the initial profile is studied in section 4.
Particle radius
The particle radius of today’s rings ranges from a few centimetres to several metres. There are also radial variations, and on the same orbit different sizes of particles may coexist (Cuzzi and Pollack, 1978; Cuzzi et al., 1980; Porco et al., 2008). Particle sizes should also evolve through collisions (Albers and Spahn, 2006). Unfortunately the viscosity model developed by Daisaka et al. (2001) does not include a particle size distribution, but a fixed particle radius . Marouf et al. (1983) showed that particles in Saturn’s rings follow a power law with for . Shu and Stewart (1985) then computed that this distribution can be represented by a single equivalent particle radius given by . For we get . Goldreich and Tremaine (1982) suggests an equivalent radius , which is also a common value in many N-body simulations. Considering the uncertainty around an equivalent particle size, we choose for our standard model, and discuss the effect of particle size in section 4.
Initial disk mass
Considering that today’s rings mass is estimated to be about Mimas’ mass (Esposito et al., 1983), one can assume that the initial disk mass was at least Mimas’ mass. But on the other hand meteoritic bombardment is believed to bring a large amount of mass into the rings (Cuzzi and Estrada, 1998), which could substantially modify the rings’ mass. For these reasons we use in our standard model an initial mass equal to Mimas’ mass, and study the initial mass influence in section 3.3.

3.1.2 Constant viscosity values
To analyse our results with the NCV model, we also perform simulations with a constant and uniform viscosity model. Assuming that the rings were denser in the past, which would increase their viscosity, we choose a value of , which is about ten times the viscosity of today’s A ring (Tiscareno et al., 2007). Anyway, in the CV case, the value of the viscosity does not modify the density profile, but only the viscous time-scales.
3.1.3 Boundary conditions
The radial domain ranges from to ( is the centre of Saturn). The boundary conditions are set as follows: material is released from the disk when it passes the domain’s limits. For the inner boundary we consider that the material falls onto the planet and is destroyed, and for the outer boundary we consider that the material crosses the Roche limit and starts to be accreted in small moons that do not interact viscously with the disk. They should however interact with the disk at resonances, but this is beyond the scope of this paper. This has been investigated by Charnoz et al. (In press).
We remove the material passing through the domain’s limits, and the corresponding angular momentum, by setting the surface density of the first and last bins to zero at , and at each time step we equalize the inward and outward fluxes in these bins. As a result, the total flux on the first and last bins is 0, and all material entering these bins is immediately removed, along with the corresponding angular momentum. No torque is exerted on the ring by the boundary.
3.2 Viscous spreading over 5 billion years
In this section we study the evolution of the standard model, using constant and variable viscosities, over the age of the Solar System .
3.2.1 Relevant parameters
To analyse our results we study the evolution of three quantities:
-
1.
the surface density profile;
-
2.
the total mass of the disk, derived from the surface density, in order to track the mass lost during the viscous spreading;
-
3.
the total mass passing through the left and right limits of the domain.
3.2.2 Early evolution ( - years)
In Fig. 3 the surface density at different times for both CV and NCV models is plotted: at 0 and after , and years of evolution. As in section 2.3.2, the initial spreading time-scale is .
In the CV case, the disk edges remain smooth during the spreading, while steep edges are created in the NCV case (Fig. 3b). In this latter case, being an increasing function of , the viscosity is high in the centre and low at the edges. Thus the centre spreads faster than the edges. As a result, a lot of material is transported from the core towards the edges, but the edge itself fails to spread this great amount of material and is “overwhelmed” by material coming from the core (Fig. 3b, solid line). As a result, the surface density rapidly increases close to the edges, which become steep.

At the beginning the NCV disk appears to spread faster than the CV disk: after years of evolution (Fig. 3d), the disk width is about km in the NCV case, and km in the CV case. This can be explained by the fact that the initial value for the CV model is too small. The computed viscosity at the rings centre is initially , much larger than the value we use for the CV model. But after years of evolution the viscosity drops to . Thus whereas the initial spreading of the NCV disk is very rapid due to high viscosity, as soon as the disk has spread, the viscosity drops and the evolution slows down dramatically.
3.2.3 Evolution over 5 billion years
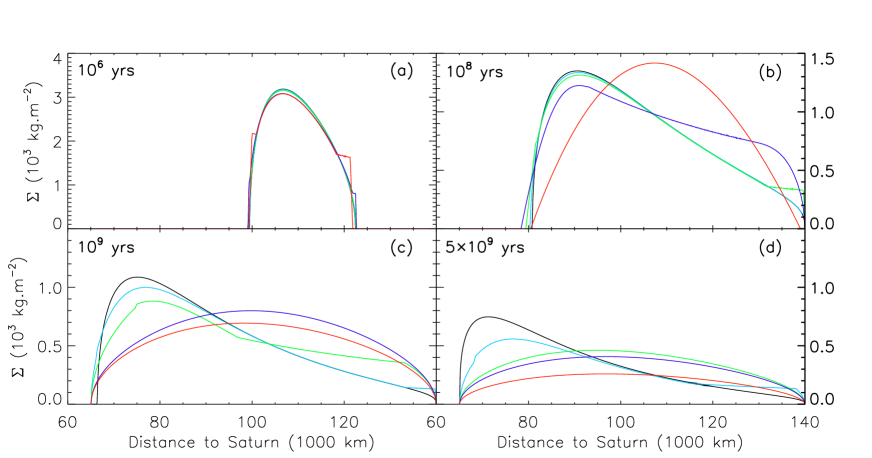
In Fig. 4 the surface mass density at , , and years is plotted.
We see here that the CV disk has spread much faster than the NCV disk (Fig. 4a). After 1 billion years, the CV disk is no longer visible because almost all material has been spread out of the rings (Fig. 4 (c) and (d)). Its average surface density is . The NCV disk has evolved significantly, and memory of the Gaussian initial conditions has been completely lost.
The NCV disk evolves only very little from 1 to 5 billion years. This is due to a drop of the viscosity because of the surface mass density being now much lower than initially, resulting in a much slower evolution. After 1 billion years of evolution, the rings viscosity is .
In conclusion, this study illustrates that spreading time-scales estimated using only with a constant viscosity (Goldreich and Tremaine, 1982; Esposito, 1986), are quite inaccurate when compared with our numerical simulations that include a realistic viscosity model. As a result the viscous spreading rate of the rings is far from being linear.
3.2.4 Evolution of the disk’s edges
Initially, due to the Gaussian shape we use, the disk’s edges are smooth. Due to a low surface density, the region close to the edges is initially in the non-self-gravitating regime. When the disk starts to spread, material is transported from the core toward the less viscous edges. This increases the surface density close to the edges, which then become self-gravitating. As the disk continues to spread, the surface density close to the edges decreases. Eventually, the edges become non-self-gravitating again.
As mentioned in section 2, the transitions from SG to NSG areas should lead to changes in the spreading of the disk, with different behaviours depending on the distance to the planet. Close to the planet, this leads to an increase of the viscosity (see Fig. 1 black dashed and dotted lines), which becomes inversely proportional to R: the closer to the planet, the higher the viscosity (as it is in this case dominated by the collisional component). As a result, the inner edge is smoothed (Fig. 5, top).

Far from the planet, the opposite process occurs. Here, the transition from SG to NSG results in the viscosity dropping by a factor . The material flux is proportional to (Eq. (3)). When the viscosity is constant, this can be rewritten as , so that the flux depends only on the surface density gradient. With variable viscosity, this simplification is no longer valid: the flux depends on the gradient of both the viscosity and the surface density: .
Firstly, in the NSG regime, the viscosity dependence on R is and , while in the SG regime (Eqs 8 and 9). As a result, the viscosity gradient is much lower in the NSG regime than in the SG regime. Secondly, due to the presence of a steep edge, the density gradient is larger close to the edge than in the core. However, when the edge enters the NSG regime, the viscosity significantly decreases and damps the large surface density gradient. Globally, the material flux is greater close to the outer edge than at the edge, which causes material to accumulates and creates the observed plateau (Fig. 5, bottom).
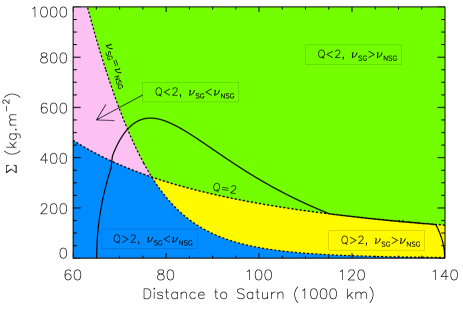
These opposite behaviours can be more appreciated using the self-gravity-regime-transition diagram presented in section 2.2.2. In Fig. 6 the disk’s surface density at is plotted over the map of the different viscosity regimes as a function of R and . It shows in particular that the outer plateau closely follows the limit . Note that this marginally gravitationally stable plateau is similar to Saturn’s A ring, which is known to be slightly gravitationally unstable, with the regular appearance and disappearance of self-gravity wakes (Ferrari et al., 2009).
3.2.5 Spreading time-scales
We look for semi-analytical solutions of Eq. (3) to address the difference of spreading time-scales between the disk with constant and variable viscosities. In a classical mass diffusion process the standard deviation of the mass distribution , increases linearly with time, so that is proportional to time. In Fig. 7 we plot this quantity for the CV and NCV disks. In order to avoid any boundary effect, we restrict the analysis to the where the disk has not yet reached the domain’s limits.

The width of the ring is defined as
| (13) |
where is the “centre” of the disk defined by
| (14) |
For the disk with variable viscosity, we have used the mean viscosity, weighted by the bin’s mass
| (15) |
where is the bin’s mass and dR is the bin’s width.
It is remarkable that despite the change of viscosity by several orders of magnitude during the evolution of the system, remains closely proportional to time at any instant (Fig. 7). However, this expression can no longer be used as a “rule of thumb” to estimate, with the initial disk’s parameters, the spreading time-scales as the viscosity drops sharply during the ring’s evolution.
For a disk in the self-gravitating regime, the viscosity is dominated by the translational and gravitational components, and can be expressed as . In a rough description we assume that the disk is a slab of material of width L and centred on . In that case, the surface density can be expressed as , where is the disk’s initial mass. Using we can then write . To check the validity of this relation, the disk’s width evolution against time is plotted in Fig. 8. We obtain a perfect proportionality relation.

For a disk with constant viscosity, we directly get . Inverting this relation we get that the width of a disk with constant viscosity increases as , while with variable viscosity it increases as . The spreading time-scale of a disk with variable viscosity is then much smaller than that of a disk with constant viscosity.
3.3 Mass evolution
Once the disk reaches the domain’s limits (either inner or outer), it empties out. We describe below the emptying time-scale and show that it is strongly dependant on the disk’s initial mass and self-gravitating regime.
3.3.1 Disk mass
The total mass of the disk is given by:
| (16) |
On a discrete grid, this equation becomes
| (17) |
where N is the number of bins in the grid.
In Fig. 9 is plotted the evolution of the disk’s mass over 5 billion years, with the CV and NCV models. The NCV case can be divided into 3 successive steps. First the disk’s mass remains constant as no material has yet reached the domain’s limits. Second, at years the disk reaches the domain’s outer limit and its mass starts to decrease. As seen in the previous section, the disk spreads with a lot of material being stacked close to the stiff outer edge. As a result, a lot of mass is rapidly lost by the disk when it reaches the domain’s outer limit. Third, at years, the disk reaches the domain’s inner limit and the mass loss is increased.

While the disk is completely emptied in a few 100 million years in the CV case, the disk mass is still after 5 billion years in the NCV case. It seems then possible for planetary rings to survive viscously over the age of the Solar System in the dynamical environment of Saturn when considering a physically realistic viscosity model.
3.3.2 Initial mass influence
One can argue that the survival of of material at the end of the disk’s evolution is only valid for the set of initial parameters considered here, in particular the initial mass of . With a lower initial mass, there would be less material to evacuate from the disk. But it would also decrease the surface density and the viscosity, and thus would slow down the loss of material. The opposite behaviour would occur with a higher initial mass. Then it raises the question: how does the disk’s final mass depend on the initial mass ?
Today’s mass of Saturn’s rings have been evaluated to be similar to Mimas’ mass, or probably more (Esposito et al., 1983). Even if meteoritic flux is expected to bring a significant amount of material to the disk (Cuzzi and Estrada, 1998), it seems natural to assume that the rings initial mass was larger than their present mass. Anyway, to address this question we performed a series of simulations starting with initial masses ranging from 1 to 10 Mimas masses. Results are plotted in Fig. 10.

The disk that starts with 10 Mimas masses (i.e. ) loses in the first 100 million years: that’s 80 % of its initial mass ! So the initial mass of the disk does modify the spreading speed and the amount of material ejected: adding more mass to the initial disk enhances the viscosity and a large amount of material is then ejected from the disk very rapidly. In particular, it is interesting to note that in order to form rings with a mass close to Mimas’ mass (i.e. ), they should not be older than 1 billion years old, starting from 10 Mimas masses.
On a larger time-scale, the loss rate drops. Interestingly, the emptying rate of all disks slows down significantly during the ring’s evolution. After 4 billion years, no further significant evolution is seen, and at 5 billion years, all disk masses are .
3.3.3 Analytical insight
We investigate whether asymptotic laws can be used to describe the evolution of the mass lost by the disk, in the self-gravitating and non-self-gravitating regime.
Self-gravitating regime
Initially the disk is fully self-gravitating. As showed in section 3.2.5 we can then write that . Finally we get .
We can use the above law to estimate the mass lost by the disk. Assuming that the disk fills the entire area available for its spreading, we get L = constant and the further “widening” of the rings is equivalent to a loss of mass, because all material passing through the domain’s boundaries is removed from the disk. Using the above expression we can express a time-scale for the emptying of the disk .
To compare this law with our simulations, the time needed for the disk’s mass to be half the initial mass, against , is plotted in Fig. 11 for initial masses of 1, 2, 5 and 10 masses of Mimas. We obtain a relation of proportionality that confirms the above analytical study: in the self-gravity regime, the disk is emptied on a time-scale inversely proportional to the square of its initial mass. Is this relation still valid for a disk in the non-self-gravitating regime ?

Non-self-gravitating regime
In the NSG regime, the gravitational viscosity is 0 and the collisional and translational viscosities have comparable magnitudes (see Fig. 1). Their dependence on is with , and with . The total viscosity is then
| (18) |
where and . Using the same simple approximation and using (K is a proportionality constant) we get
| (19) |
where , and .
For standard parameters of Saturn’s rings (, , , ) we get , , . We can then simplify Eq. (19) as:
| (20) |
Finally the emptying time-scale verifies . As a result the emptying time-scale is much larger in the NSG regime than in the SG regime. In the following section we investigate the transitions between these two regimes, in terms of disk’s mass.
3.3.4 Mass of a fully non self-gravitating disk
As the disk spreads, the surface density drops down and larger parts of the disk (near the edges) become marginally self-gravitating. We should then see the emptying time-scale drop significantly over time. Fig. 10 shows indeed an initial rapid emptying of the disk, which then considerably slows down. All disk’s mass even seem to converge toward a limiting mass.
We have shown in the previous paragraph that the emptying time-scale is much increased when the disk is in the NSG regime. In order to find the transition between the SG and NSG regimes, we look for a condition on the disk’s mass for a disk to be self-gravitating or not. We investigate this condition in the case where the disk fills the entire area available for its spreading (that is from the planet’s radius to the Roche limit). We then use the Toomre’s Q parameter to describe the self-gravitating regime of the disk.
This parameter is a measure of the gravitational stability of the disk. As mentioned earlier we consider here that the transition between the SG and NSG regimes occurs for . The disk is then fully non-self-gravitating if :
| (21) |
Using and we find that the disk is completely NSG if the surface density verifies
| (22) |
Then using (16) and for the specific case of Saturn, we find that the disk is completely in the non-self-gravitating regime if its total mass verifies
| (23) |
In the simulations presented in this section, the disk’s mass at t=5 Gyrs is for initial masses of 1 to 10 Mimas’ masses. Theses masses are larger than which should indicate that they are still in the self-gravitating regime (at least partially). This is indeed the case as seen in Fig. 6
In conclusion, it seems that whatever the initial mass, the disk undergoes an initial rapid evolution when it is self-gravitating. This evolution continuously slows down as larger parts of the disk become marginally self-gravitating. Eventually, the disk will becomes entirely NSG, and will undergo a very slow evolution. The wakes observed in Saturn’s A ring (Ferrari et al., 2009) indicate that the ring is still self-gravitating, at least in some regions.
3.3.5 Mass fluxes through boundaries
In this section, we consider again the previous standard model with constant and variable viscosities, starting with 1 mass of Mimas. We investigate the mass lost by the disk through the inner and outer domain’s limits, and whether theses two quantities are comparable or not. This can give clues on the mass falling onto the planet or crossing the Roche zone, the latter being for instance available for accretion into satellites (Charnoz et al., , In press).
At each time step, the mass fluxes at the limits of the domain are tracked. Results are plotted in Fig. 12. The dashed line, representing the mass flow for the CV model, is truncated at billion years of evolution, because at that point the disk was almost emptied out of its material (see Fig. 9), which caused the numerical code to stop.

NCV and CV models behave very differently. For the CV disk, both limits of the domain are reached at about the same time, . For the NCV disk, both limits are reached much later and not simultaneously: the outer limit is reached after 20 million years, while the inner limit is reached only after 800 million years. This is due to the much larger viscosity far from the planet, as the translational component scales like in the self-gravitating regime.
Another feature, not visible in the log-log format, is the very sudden release of material through the outer limit (due to the stiff outer edge, see section 3.2.4) compared to a smoother and more progressive release through the inner edge (due to the smooth inner edge).
4 Influence of ring parameters
In order to validate our results of section 3, we now perform additional simulations, varying the disk parameters. In the following, only the variable viscosity model (see section 2.2) is considered.
4.1 Influence of ring particles radius
The viscosity model, and our 1-dimensional approach requires the fixing of the value of the particle size. In this section, we study the influence of this parameter. We perform several simulations of the “standard model”, with single particle sizes ranging from 0.01 to 10 metres, and investigate the impact on the evolution of the surface density and the disk’s mass, and on the mass fluxes through the boundaries.
4.1.1 Influence on surface density evolution
For a NSG disk, the viscosity increases with particle radius (see section 2.2.2.). For a SG disk, the translational viscosity does not depend on the particle radius. However, the particle radius increases Toomre’s Q parameter. As a result the disk is more likely to become NSG with bigger particles in regions with lower surface densities, i.e. close to the edges. Thus, different spreading regimes may then be expected whether the disk remains SG during spreading or not. In Fig. 13 the surface mass density of the disk at different times, and for several particle sizes, is plotted.
At 1 million years (Fig. 13a), the surface density is not significantly affected by particle size, except the disk with 10 m-radius particles (red curve). The ramps close to the disk extremities are due to transitions from the SG regime to the NSG regime (see section 3.2.4).
At years (Fig. 13b) the disk with 10 m-radius particles has evolved very differently from the other disks. This disk has a parabolic shape whereas the disks with smaller particles have a surface density peak inward and lower densities in the outer regions. This latter shape is specific of a disk that is still partially self-gravitating (in the peak region).
At years (Fig. 13c), the disk with 5 m-radius particles is also completely in the NSG regime and its shape is very similar to the disk with 10 m-radius particles. The disk with 2.5 m-radius particles is in the SG regime only in the region located between the discontinuity at and the beginning of the outer ramp at . The surface density of each disk, normalized by the , is plotted on Fig. 14, along with the transition between the SG and NSG regimes , also normalized to (black dashed line).
The dark blue and red curves, corresponding to the disks with 5 m and 10 m-radius particles, are below the dashed line, indicating that they are entirely no longer in the SG regime. The light blue and green curves, corresponding to the disks with 1 m and 2.5 m-radius particles, are still partially in the SG regime, in the regions where the surface density is above the black dashed line. At (Fig. 13d), only the disks with 0.01 m-radius and 1m-radius particles are still partially self-gravitating.
Two spreading regimes clearly appear. In particular, the inner peak of the surface density is characteristic of a disk that is still partially self-gravitating, whereas a parabolic shape is characteristic of a fully not-self-gravitating disk.
Increasing the particles size slows down the initial outer spreading, but when all disks are completely NSG, the disks with the larger particles spread faster, as viscosities in the NSG regime are an increasing function of . As a result, Fig. 13d can be interpreted as different evolutionary steps in the disk’s life.
4.1.2 Influence on disk mass evolution
The final disk mass for all particle radii is indicated in Table 1.
. Particle Final Mass through Mass through radius disk mass inner edge outer edge (m) 0.01 1.45 0.46 1.84 1 1.34 0.61 1.80 2.5 1.63 0.61 1.51 5 1.46 0.69 1.60 10 0.93 0.93 1.89
The final mass of the disk is not much affected by the change of particles size, except the disk with 10 m-radius particles because of the strong enhancement of the translational and collisional viscosities in the NSG regime. The disk with 2.5 m-radius particles is intermediate between a disk whose viscosity remains high because it remains in the SG regime (for ), and one that rapidly enters the NSG regime, but whose viscosity is supported by large particles (for ).
The inner mass flux increases with the particle radius because of the increase of the collisional viscosity. The outer mass flux increases when the disk enters rapidly the NSG regime (), because of the increase of the translational viscosity with in the NSG regime. Here again the intermediate state of the disk with 2.5 m-radius particles can be pointed out.
4.2 Influence of the initial surface density profile
In this section we study the influence of different initial surface-density profiles. We modify one parameter at a time, and analyse its influence on the viscous spreading over 5 billion years, and on the evolution of the disk’s mass.
4.2.1 Influence of initial mean radius
First we change the initial position of the disk by shifting the surface density maximum. While our standard model is defined with a mean radius of 110,000 km, we study two other cases: 90,000 km and 130,000 km, which more or less covers the total area of today’s rings.
The surface density at and at 5 billion years is plotted in Fig. 15. The final disk masses are listed in Table 2.

At 5 billion years, the disks starting at 90,000 km and 110,000 km have reached a similar surface-density profile, and comparable disk mass. The mass fluxes through the disk’s boundaries have opposite behaviours: while the disk starting at 90,000 km loses its mass preferentially through its inner boundary, the disk starting at 110,000 km loses quite the same amount of mass but through the outer boundary (Table 2).
The disk that starts at 130,000 km reaches the outer boundary very rapidly, in about years, and loses a larger amount of mass than the other two. This is due to the fact that when the disk is SG, the translational viscosity is greatly increased at high radius, and also to the fact that the disk starts closer to the Roche limit. As a result its final surface density is globally lower than that of the other two disks. This disk never reaches the planet within 5 billion years.
| Initial | Final | Mass through | Mass through |
|---|---|---|---|
| position | disk mass | inner edge | outer edge |
| (km) | |||
| 90,000 | 1,39 | 1,58 | 0,78 |
| 110,000 | 1.34 | 0.61 | 1.79 |
| 130,000 | 0.92 | 2.83 |
Eventually, all disks still have a mass close to , much like in the standard model of section 3. The main effect of changing the disk’s initial position is to modify the material fluxes through the boundaries, and increasing the initial radius increases the mass loss through the outer edge.
4.2.2 Influence of initial width
In this section we change the initial width of the disk by adjusting , the standard deviation of the Gaussian. We compare the results of our standard model to simulations with standard deviations , and .
The modification of the initial width of the disk has no significant impact on the evolution over 5 billion years. The most narrow disk, that starts with the highest surface density, spreads more rapidly than the others and catches them up in a few ten thousand years of evolution.
4.2.3 Influence of initial mass repartition
Here we study a scenario where the initial material is distributed in two ringlets instead of one. We assume a Gaussian profile for both of them and use initial positions symmetrical with respect to R = 110,000 km. We choose to put the exact same mass in both ringlets, so their initial maximal surface density is different (because the surface of a bin increases with R). The two sub-rings are distant of 10,000 km (peak to peak). The first million years of the evolution of the disk is plotted in Fig. 16.

The two sub-rings merge in a few hundred thousand years, and then the evolution goes on very similarly to the case with only one initial ring. The final mass of the disk after 5 billion years of evolution is , very close to what we obtained in section 3. The mass passing through the boundaries is unaffected. The initial shape of the rings seems then to have very little effect on their long-term evolution.
5 Summary and discussion
5.1 Viscous age of the rings
We have investigated the effect of a non-constant realistic viscosity model on the global viscous spreading of dense planetary rings over 5 billion years. Our main result is that using a physically realistic viscosity model introduces important changes in the disk’s spreading over time. We identified two distinctively different spreading regimes, whether the disk is self-gravitating or not. When the disk is self-gravitating, it develops a surface density peak inward and an outward tail with lower surface density and which is marginally gravitationally stable (), whereas a totally non self-gravitating disk has a parabolic profile with a central maximum. The disk’s spreading is only significantly affected through modification of the particle radius, because bigger particles increase the Toomre’s Q parameter.
Contrary to a continuous spreading of the disk with constant viscosity, resulting in an emptying in Myrs (depending on the constant viscosity value), the spreading rate of the non-constant viscosity (NCV) disk significantly decreases over time, allowing for a survival of an important part of the disk over 5 billion years. We have shown in particular that with variable viscosity in the self-gravitating regime, the disk’s width increases like , much slower than in a constant viscosity case where the width increases like .
The final state of the disk seems somewhat independent of various initial parameters such as initial width, position, and surface density profile. Moreover, it appears that whatever the initial mass of the disk, the disk always undergo a rapid initial emptying, which progressively slows down. We showed that this evolution can be related to the disk’s self-gravitating regime, with emptying time-scales proportional to in the self-gravitating regime, and in the non-self-gravitating regime. The disk’s mass drops continuously until it reaches the mass of a disk filling the area from the planet’s radius up to the Roche limit, and with a surface density so that every part of the disk is marginally gravitationally stable (), yielding . We computed that for the specific case of Saturn this mass is , in good agreement with our simulation results (Fig. 10). Afterwards, the disk evolves very slowly because of the very low viscosity in the NSG regime, compared to the SG regime, for meter-sized particles.
In all our simulations starting with a disk mass about one Mimas’ mass or more, we could not achieve a total emptying of the rings in 5 billion years. Most of the mass is lost through the Roche limit, except when the initial disk is located below , where most of the mass is lost via infall onto the planet. The survival of Saturn’s rings against viscous spreading over the age of the Solar System seems then possible, and during its evolution a lot of material would have been made available for the accretion of satellites (Charnoz et al., , In press).
The rings of Jupiter, Uranus and Neptune are today much less dense and massive than Saturn’s rings. Moreover, they are composed mainly of dust, while Saturn’s rings have typical particle sizes of . For instance, the normal optical depth of the Jovian ring system is , while the optical depth of Saturn’s A-ring is (Ockert-Bell et al., 1999; Ferrari et al., 2009). In our simulations, we showed that under viscous spreading an initially massive ring system remains massive over time because of the very slowly evolving asymptotic regime when the disk becomes marginally self-gravitating. Under these considerations, it seems unlikely that the rings of the other giant planets could have been dense enough to be self gravitating in their past.
5.2 Comparison with observation
It is interesting to compare the current rings of Saturn with the surface-density profiles we obtain in our simulations. We have plotted in Fig. 17 the ring optical depth from the Voyager photo-polarimeter spectrum (PPS), as it may be proportional to the surface mass density in low regions. We have also plotted the disk surface density at for the disk with 5 m-radius particles. Apart from the Cassini Division, which is thought to have been created by Mimas’ 2:1 resonance (Goldreich and Tremaine, 1978) and the C ring, we note several similarities.


Firstly, the global shape is in good agreement, with a maximum inward and lower surface densities toward the outer limits of the rings, with the peak corresponding to the B ring and the outer plateau to the A ring. This plateau is marginally gravitationally stable (), which is coherent with the several observations of wakes in the A ring (Ferrari et al., 2009). The position of the maximum is much more inward later in our simulations at . This favours the hypothesis that Saturn’s rings are young, but this could also be explained by the imperfections of the viscosity model we use (the mass has been transferred inward too rapidly), or also to other physical effects we have not considered in our study, or to unknown initial conditions. A change in the particle radius would also modify significantly the optical depth profile.
We can note also that in our simulations we never recover anything similar to the C ring. This could be due to an important modification of the particle size in this region, but this is unlikely as particle size distributions show a greater power index for the C-ring than for the B-ring, so that there should be less large particles in the C-ring than in the B-ring (Charnoz et al., 2009a, Section 17.2.1.1). Moreover this modification of the ring particle size would not explain the very steep transition from the B ring to the C ring. This transition may however suggest that the C ring is a product of another physical process. For instance, meteoritic bombardment is though to be capable of projecting large amounts of material over significant distances (Cuzzi and Estrada, 1998). The C-ring could then be ejecta from the bombardment of the B-ring. This would in turn agree with the observed similarities in the spectral signatures of the B and C-rings as observed by Cassini VIMS (Nicholson et al., 2008)
Although today’s rings mostly resemble a 100 million-years old disk when compared to our simulations, their formation so recently in the history of the Solar System is yet to be explained. In this work we have considered only the viscous torque, so that we can only say that today’s rings viscously look like a 100 million-years old disk. Other important physical effects have to be included in order to fully constrain the evolution time-scales of the rings. For instance, a satellite located between the planet and the initial rings could importantly slow down the inward spreading of the rings via resonant interactions, which apply a repulsive torque to the disk (Meyer-Vernet and Sicardy, 1987). Conversely, outer satellites could also substantially reduce the rings outward spreading. These interactions would consequently reduce the mass lost by the disk through its outer boundary. Considering that in our simulations, most of the mass is lost through this boundary, satellite interactions appear as a process that could significantly increase the survival of the rings. However these interactions should increase the mass lost by the disk from its inner boundary, because of the repulsive torque applied by the satellite on the disk. Inclusion of satellite interactions would then be important to quantify the impact on the mass lost by the disk.
5.3 Viscous spreading of current rings
While the aim of our work was not to reproduce today’s rings but to understand the effects of a realistic viscosity model over long time-scales, we applied our model to an initial set of parameters that roughly reproduces today’s rings of Saturn: a first slab from 74,000 km to 92,000 km with (the C ring), a second slab from 92,000 km to 117,000 km with (the B ring), a gap from 117,000 km to 122,000 km (the Cassini Division) and a third slab from 122,000 km to 136,000 km with (the A ring). We choose a particle radius of 1m. Results are plotted in Fig. 18.
In this configuration, the total rings’ mass is and only the A and B rings are self-gravitating, the C ring being not dense enough. The average initial viscosities are for the C ring, and for the B and A rings, which is in good agreement with observational results (Tiscareno et al., 2007).
The Cassini Division is filled in about 4 million years, because of a rapid outward spreading of the B ring (Fig. 18b). This emphasizes the role of the 2:1 Mimas resonance in the existence of the Cassini Division (Schwartz, 1981; Esposito et al., 1987). The inner spreading of the B ring is much slower. The C ring, because of its very low viscosity, evolves very little. It is completely “eaten” by the B ring in approximately 600 million years (Fig. 18c).
It is interesting to note that the shape of the surface density at years is very similar to what we obtain with our standard model (Fig. 13c-d, light-blue curve, and 18d), even though the initial surface density profiles where very different in the two simulations. The final state of the rings seems then very independent of the initial conditions.
After 1 billion years of evolution, the mass of the disk is still . It seems then, as we have seen in section 3, that Saturn’s rings could very well be viscously old, but they are also not likely to disappear in the next billion years.
5.4 Perspectives
An important improvement to this work would be to include a particle size distribution in the viscosity model. Indeed, we have seen in section 4 that only the ring-particle radius significantly affects the spreading of the rings as it impacts the positions of the transitions between the self-gravitating and non-self-gravitating regimes, for a given surface density. This means that if particle segregation occurs in the rings, this could lead to modification of the viscous behaviour of some regions of the rings.
While viscous spreading is a key physical phenomenon for the evolution of Saturn’s rings, it will be affected by other effects such as resonant torques with satellite. Many structures of the rings are known to be the result of resonant interactions with the satellites of Saturn (Esposito et al., 1987). The repulsive torque exerted by outer satellites could also significantly alter the spreading of the disk (Salmon et al., 2009)
These structures, for instance density waves, locally modify the density and thus the viscosity. How material is transported through these waves could gives us clues on the suggested “recycling” of the rings, which could be responsible for the apparent low meteoritic pollution of the rings (Cuzzi and Estrada, 1998). It would also be important to constrain the long term influence of these resonant interactions, and see if they increase the possible lifetime of Saturn’s rings or if they contribute to their destruction.
Acknowledgements
We would like to thank Dr. Anais Rassat for her careful reading of this paper and her very useful comments and suggestions. We would like also to thank Pierre-Yves Longaretti, and an anonymous referee, for their very useful review that contributed to increase the quality of this paper. This work was supported by the Commissariat à l’Énergie Atomique and Université Paris Diderot.
References
- Albers and Spahn (2006) Albers, N., Spahn, F., 2006. The influence of particle adhesion on the stability of agglomerates in Saturn’s rings. Icarus 181, 292–301.
- Alibert et al. (2005) Alibert, Y., Mousis, O., Benz, W., 2005. Modeling the Jovian subnebula. I. Thermodynamic conditions and migration of proto-satellites. A&A 439, 1205–1213. arXiv:astro-ph/0505367.
- Araki and Tremaine (1986) Araki, S., Tremaine, S., 1986. The dynamics of dense particle disks. Icarus 65, 83–109.
- Baruteau and Masset (2008) Baruteau, C., Masset, F., 2008. Type I Planetary migration in a self-gravitating disk. ApJ 678, 483–497. 0801.4413.
- Bath and Pringle (1981) Bath, G.T., Pringle, J.E., 1981. The evolution of viscous discs. I - Mass transfer variations. MNRAS 194, 967–986.
- Charnoz et al. (2009a) Charnoz, S., Dones, L., Esposito, L.W., Estrada, P.R., Hedman, M.M., 2009a. Origin and evolution of Saturn’s ring system. pp. 537–573.
- Charnoz et al. (2009b) Charnoz, S., Morbidelli, A., Dones, L., Salmon, J., 2009b. Did Saturn’s rings form during the Late Heavy Bombardment? Icarus 199, 413–428. 0809.5073.
- (8) Charnoz, S., Salmon, J., Crida, A., . The recent formation of Saturn’s moonlets from viscous spreading of the main rings. Nature, In press.
- Cuzzi and Estrada (1998) Cuzzi, J.N., Estrada, P.R., 1998. Compositional evolution of Saturn’s rings due to meteoroid bombardment. Icarus 132, 1–35.
- Cuzzi and Pollack (1978) Cuzzi, J.N., Pollack, J.B., 1978. Saturn’s rings: particle composition and size distribution as constrained by microwave observations. I - Radar observations. Icarus 33, 233–262.
- Cuzzi et al. (1980) Cuzzi, J.N., Pollack, J.B., Summers, A.L., 1980. Saturn’s rings - particle composition and size distribution as constrained by observations at microwave wavelengths. II - Radio interferometric observations. Icarus 44, 683–705.
- Daisaka and Ida (1999) Daisaka, H., Ida, S., 1999. Spatial structure and coherent motion in dense planetary rings induced by self-gravitational instability. Earth, Planets, and Space 51, 1195–1213. arXiv:astro-ph/9908057.
- Daisaka et al. (2001) Daisaka, H., Tanaka, H., Ida, S., 2001. Viscosity in a dense planetary ring with self-gravitating particles. Icarus 154, 296–312.
- Dones (1991) Dones, L., 1991. A recent cometary origin for Saturn’s rings? Icarus 92, 194–203.
- Esposito (1986) Esposito, L.W., 1986. Structure and evolution of Saturn’s rings. Icarus 67, 345–357.
- Esposito et al. (1987) Esposito, L.W., Harris, C.C., Simmons, K.E., 1987. Features in Saturn’s rings. ApJS 63, 749–770.
- Esposito et al. (1983) Esposito, L.W., Ocallaghan, M., West, R.A., 1983. The structure of Saturn’s rings - Implications from the Voyager stellar occultation. Icarus 56, 439–452.
- Ferrari et al. (2009) Ferrari, C., Brooks, S., Edgington, S., Leyrat, C., Pilorz, S., Spilker, L., 2009. Structure of self-gravity wakes in Saturn’s A ring as measured by Cassini CIRS. Icarus 199, 145–153.
- Goldreich and Tremaine (1978) Goldreich, P., Tremaine, S., 1978. The formation of the Cassini division in Saturn’s rings. Icarus 34, 240–253.
- Goldreich and Tremaine (1979) Goldreich, P., Tremaine, S., 1979. The excitation of density waves at the Lindblad and corotation resonances by an external potential. ApJ 233, 857–871.
- Goldreich and Tremaine (1982) Goldreich, P., Tremaine, S., 1982. The dynamics of planetary rings. ARA&A 20, 249–283.
- Harris (1984) Harris, A.W., 1984. The origin and evolution of planetary rings, in: R. Greenberg & A. Brahic (Ed.), IAU Colloq. 75: Planetary Rings, pp. 641–659.
- Larson (1984) Larson, R.B., 1984. Gravitational torques and star formation. MNRAS 206, 197–207.
- Latter and Ogilvie (2009) Latter, H.N., Ogilvie, G.I., 2009. The viscous overstability, nonlinear wavetrains, and finescale structure in dense planetary rings. Icarus 202, 565–583. 0904.0143.
- Lin and Pringle (1987) Lin, D.N.C., Pringle, J.E., 1987. A viscosity prescription for a self-gravitating accretion disc. MNRAS 225, 607–613.
- Lynden-Bell and Pringle (1974) Lynden-Bell, D., Pringle, J.E., 1974. The evolution of viscous discs and the origin of the nebular variables. MNRAS 168, 603–637.
- Marouf et al. (1983) Marouf, E.A., Tyler, G.L., Zebker, H.A., Simpson, R.A., Eshleman, V.R., 1983. Particle size distributions in Saturn’s rings from Voyager 1 radio occultation. Icarus 54, 189–211.
- Masset and Casoli (2009) Masset, F.S., Casoli, J., 2009. On the horseshoe drag of a low-mass planet. II. Migration in adiabatic disks. ApJ 703, 857–876. 0907.4676.
- Meyer-Vernet and Sicardy (1987) Meyer-Vernet, N., Sicardy, B., 1987. On the physics of resonant disk-satellite interaction. Icarus 69, 157–175.
- Nicholson et al. (2008) Nicholson, P.D., Hedman, M.M., Clark, R.N., Showalter, M.R., Cruikshank, D.P., Cuzzi, J.N., Filacchione, G., Capaccioni, F., Cerroni, P., Hansen, G.B., Sicardy, B., Drossart, P., Brown, R.H., Buratti, B.J., Baines, K.H., Coradini, A., 2008. A close look at Saturn’s rings with Cassini VIMS. Icarus 193, 182–212.
- Ockert-Bell et al. (1999) Ockert-Bell, M.E., Burns, J.A., Daubar, I.J., Thomas, P.C., Veverka, J., Belton, M.J.S., Klaasen, K.P., 1999. The structure of Jupiter’s ring system as revealed by the Galileo Imaging Experiment. Icarus 138, 188–213.
- Ohtsuki (1999) Ohtsuki, K., 1999. Evolution of particle velocity dispersion in a circumplanetary disk due to inelastic collisions and gravitational interactions. Icarus 137, 152–177.
- Ohtsuki and Emori (2000) Ohtsuki, K., Emori, H., 2000. Local N-body simulations for the distribution and evolution of particle velocities in planetary rings. AJ 119, 403–416.
- Pollack et al. (1973) Pollack, J.B., Summers, A., Baldwin, B., 1973. Estimates of the sizes of the particles in the rings of Saturn and their cosmogonic implications. Icarus 20, 263–278.
- Porco et al. (2008) Porco, C.C., Weiss, J.W., Richardson, D.C., Dones, L., Quinn, T., Throop, H., 2008. Simulations of the dynamical and light-scattering behavior of saturn’s rings and the derivation of ring particle and disk properties. AJ 136, 2172–2200.
- Pringle (1981) Pringle, J.E., 1981. Accretion discs in astrophysics. ARA&A 19, 137–162.
- Richardson (1994) Richardson, D.C., 1994. Tree code simulations of planetary rings. MNRAS 269, 493–+.
- Salmon et al. (2009) Salmon, J., Charnoz, S., Crida, A., Brahic, A., 2009. Simulations of Saturn’s rings evolution over 5 billion years with variable viscosity & satellite interactions, in: AAS/Division for Planetary Sciences Meeting Abstracts, pp. #25.08–+.
- Salo (1992) Salo, H., 1992. Gravitational wakes in Saturn’s rings. Nature 359, 619–621.
- Salo (1995) Salo, H., 1995. Simulations of dense planetary rings. III. Self-gravitating identical particles. Icarus 117, 287–312.
- Schwartz (1981) Schwartz, M.P., 1981. Clearing the Cassini division. Icarus 48, 339–342.
- Shu and Stewart (1985) Shu, F.H., Stewart, G.R., 1985. The collisional dynamics of particulate disks. Icarus 62, 360–383.
- Takeda and Ida (2001) Takeda, T., Ida, S., 2001. Angular momentum transfer in a protolunar disk. ApJ 560, 514–533. arXiv:astro-ph/0108133.
- Takeuchi et al. (1996) Takeuchi, T., Miyama, S.M., Lin, D.N.C., 1996. Gap formation in protoplanetary disks. ApJ 460, 832–+.
- Tiscareno et al. (2007) Tiscareno, M.S., Burns, J.A., Nicholson, P.D., Hedman, M.M., Porco, C.C., 2007. Cassini imaging of Saturn’s rings. II. A wavelet technique for analysis of density waves and other radial structure in the rings. Icarus 189, 14–34. arXiv:astro-ph/0610242.
- Toomre (1964) Toomre, A., 1964. On the gravitational stability of a disk of stars. ApJ 139, 1217–1238.
- Wisdom and Tremaine (1988) Wisdom, J., Tremaine, S., 1988. Local simulations of planetary rings. AJ 95, 925–940.