An XMM-Newton view of Planetary Nebulae in the Small Magellanic Cloud
During an X-ray survey of the Small Magellanic Cloud, carried out with the XMM-Newton satellite, we detected significant soft X-ray emission from the central star of the high-excitation planetary nebula SMP SMC 22. Its very soft spectrum is well fit with a non local thermodynamical equilibrium model atmosphere composed of H, He, C, N, and O, with abundances equal to those inferred from studies of its nebular lines. The derived effective temperature of 1.5 K is in good agreement with that found from the optical/UV data. The unabsorbed flux in the 0.1–0.5 keV range is erg cm-2 s-1, corresponding to a luminosity of erg s-1 at the distance of 60 kpc. We also searched for X-ray emission from a large number of SMC planetary nebulae, confirming the previous detection of SMP SMC 25 with a luminosity of (0.2–6) erg s-1 (0.1-1 keV). For the remaining objects that were not detected, we derived flux upper limits corresponding to luminosity values from several tens to hundreds times smaller than that of SMP SMC 22. The exceptionally high X-ray luminosity of SMP SMC 22 is probably due to the high mass of its central star, quickly evolving toward the white dwarf’s cooling branch, and to a small intrinsic absorption in the nebula itself.
Key Words.:
planetary nebulae: individual: SMP SMC 22, SMP SMC 25 - Magellanic Clouds - X-rays: general1 Introduction
Planetary nebulae (PNe) are a common stage in the evolution of low and intermediate mass stars, leading to the formation of white dwarfs. They appear when the fast wind from the central star interacts with the matter of the denser wind that was previously ejected during the asymptotic giant branch (AGB) phase, and are characterized by Hα line emission. Since the advent of imaging X-ray telescopes a number of PNe have been detected in the soft X-ray range (see, e.g., Chu et al. 2003), but due to their relatively low fluxes, detailed studies with the XMM–Newton and Chandra satellites have been carried out only for a few objects (Gruendl et al. 2006; Kastner 2007; Montez et al. 2009). X-ray emission from PNe can originate from their central star or from the hot gas shocked in the interaction between the two stellar winds. Usually one of these two processes, characterized by different spectral and spatial signatures, is dominant, but there are also PNe in which both components have been detected. There is also the possibility that some X-ray emission observed from PNe is actually due to coronal emission from a companion star (see, e.g., Soker & Kastner 2002).
SMP SMC 22 (hereinafter SMP 22) is a high-excitation planetary nebula located in the Small Magellanic Cloud (SMC) (Sanduleak et al. 1978; Aller et al. 1987) and characterized by a very high X-ray luminosity (Wang 1991). Its large X-ray flux led to an early detection of this source in the soft X-ray range with the Einstein Observatory (Seward & Mitchell 1981) and to its inclusion in the class of super-soft X-ray sources (SSS), a rather heterogeneous group of luminous (1036–1038 erg s-1) sources characterized by thermal-like emission corresponding to blackbody temperatures of –106 K (see, e.g., Kahabka & van den Heuvel 2006). Most SSS are binary systems containing accreting white dwarfs, but a few of them have been identified with the nuclei of PNe. Here we report on recent X-ray observations of SMP 22 obtained with the XMM–Newton satellite, as well as on a systematic search for X-ray emission from a large sample of PNe in the SMC.
2 Observations and data analysis
The field of SMP 22 has been observed in three separate occasions with XMM–Newton (see Table 1). The two 2009 pointings were obtained as part of our Large Program aimed at a complete survey of the SMC (Haberl & Pietsch 2008). For completeness we also analyzed the 2007 observation available in the public archive. The data discussed here were obtained with the EPIC instrument, consisting of one pn and two MOS cameras (Strüder et al. 2001; Turner et al. 2001) covering a field of view of about 30′ diameter in the energy range 0.1–12 keV. In all the observations they were operated in full frame mode, yielding a time resolution of 73 ms for the pn and 2.6 s for MOS1 and MOS2. We processed the data with the standard XMM-Newton Science Analysis Software (SAS, Version 8.0). We filtered out time intervals affected by high background, induced by soft protons, resulting in the net exposure times listed in Table 1.
| Id. | Date | Duration | Net exposure | Off axis angle | Count rate | Tot. counts |
|---|---|---|---|---|---|---|
| (ks) | (ks) | (arcmin) | (cts s-1) | |||
| 0501470101 | 2007/06/04 | 31.8 | 7.7 | 5.58 | 0.400 | 3100 |
| 0601210101 | 2009/05/14 | 26.7 | 16.54 | 7.20 | 0.309 | 5167 |
| 0601210501 | 2009/09/25 | 48.7 | 32.3 | 14.06 | 0.153 | 5442 |
To extract spectra and light curves we selected only single and double events with energy between 0.1 and 12 keV. For the first and second observation we used circular extraction regions with radii of and , respectively. In the third observation, due to the large off-axis angle, SMP 22 appears with an elongated shape; for this reason we chose an elliptical region to extract the source events. In all cases the background spectrum was obtained from events extracted in a large area with no sources in the same CCD containing SMP 22. We generated the response matrices (rmf) and the ancillary files (arf) using the SAS tasks rmfgen and arfgen. All source spectra extracted from the event lists were rebinned in order to have a minimum of 30 counts per energy bin and fitted using the XSPEC program. A systematic error of 5% was included in the spectral fits to account for the known uncertainties111EPIC status of calibration and data analysis, http://xmm2.esac.esa.int/docs/documents/CAL-TN-0018.pdf in the response matrices below 0.5 keV.
The light curves extracted for SMP 22 are consistent with a constant flux in each data set and the source count rates in the three observations, when corrected for the different off-axis angle, do not show any evidence for long term variability.
The two MOS together provide only about 10% of the total counts detected from the source and the addition of their spectra does not significantly improve the results. Therefore, in the following we report only the results obtained with the pn. The spectra from the three observations were fitted simultaneously, forcing common parameters (except for the relative normalization, whose values resulted always within 1%).
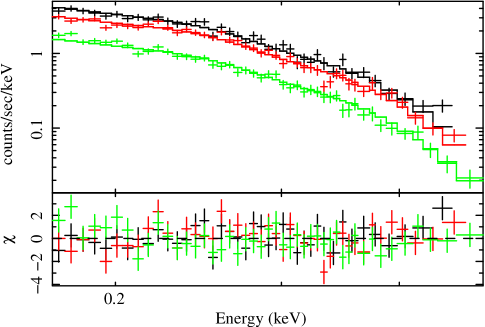
The results obtained with a few single component models confirm that the source spectrum is very soft (see Table 2). In fact, practically no source counts were detected above 0.5 keV. The blackbody and the thermal plasma model (Mekal in XSPEC) provide the best fits, with temperatures of the order of (3–5) K and absorption N cm-2. A power law, besides giving an unacceptable , yields an unrealistic photon index. The best fit blackbody model is shown in Fig. 1, and the corresponding confidence contours of temperature and absorption in Fig. 2. At a distance of 60 kpc (adopted hereinafter; see, e.g., Deb & Singh 2010), the blackbody emitting surface corresponds to a star radius of and the bolometric luminosity is erg s-1.
| Mod. | /dof | NH | R | Z | ||||
|---|---|---|---|---|---|---|---|---|
| () | ( K) | ( cm) | ( ) | ( | ||||
| Blackbody | 0.98/124 | - | - | |||||
| Brems. | 1.10/124 | - | - | - | ||||
| Mekal | 0.93/123 | - | - | |||||
| Pow. law | 1.69/124 | - | - | - | - |

We also explored fits with model atmospheres computed under non local thermodynamic equilibrium (NLTE) conditions. A small grid of model atmospheres was calculated with TMAP222http://astro.uni-tuebingen.de/rauch/TMAP/TMAP.html, the Tübingen Model-Atmosphere Package (Werner et al. 2003; Rauch & Deetjen 2003). These models, that for a given chemical composition have and as free parameters, were converted to the XSPEC atable format for spectral fitting. In the framework of the Virtual Observatory, the spectral energy distributions (SEDs) of these models are available via the German Astrophysical Virtual Observatory (GAVO) service TheoSSA333http://vo.ari.uni-heidelberg.de/ssatr-0.01/TrSpectra.jsp?.
Adopting a pure H composition, good fits could be obtained for effective temperatures of (0.7–1.1) K, but with unconstrained values of gravity in the wide range 5 9 covered by the models. Equally good fits were given by a He atmosphere with =(1–1.2) K and in this case the surface gravity could be constrained in the range 5.50.5. The best fit effective temperatures of the H and He NLTE model fits imply source emitting radii of 1–10 , in order to provide the observed source luminosity. Such radii, coupled to the corresponding values, lead to unrealistically high values for the mass of the star (100 ). We thus conclude that, although the H and He NLTE model atmospheres give formally good fits to the EPIC data, they are physically unacceptable.
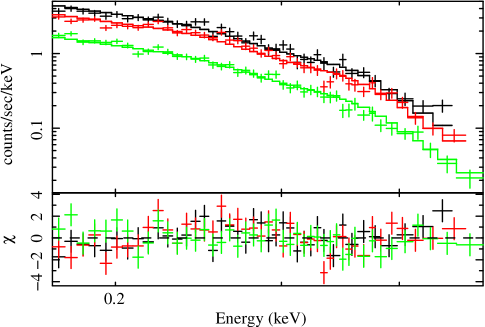
We finally considered a NLTE model atmosphere including other elements. Considering that the limited spectral resolution of our data does not allow a detailed determination of the elemental composition and abundances, we restricted the analysis to a single model, based on the results of optical/UV spectroscopy of the SMP 22 nebular emission. We adopted therefore a model composed of H, He, C, N, and O with the abundances fixed to the values determined by Leisy & Dennefeld (1996), and reported in Table 3. The results obtained with this model are summarized in Table 4, where, for three fixed values of , we report the interstellar absorption, effective temperature, and radius of the emission surface derived from the fit (columns 3, 4,5), as well as the star’s mass implied by the and R values (column 6).
In all cases an effective temperature of K is obtained. Although formally the best fit is found for =7, the =6 case (Fig. 3) is to be preferred since it is only marginally worse but gives more plausible values of mass (1 ) and radius (0.2 ). We checked that the flux in the visible band predicted by this model is smaller (30%) than the current upper limit obtained with the Hubble Space Telescope for the PN central star (Villaver et al. 2004).
| Mass fraction | |
|---|---|
| H | |
| He | |
| C | |
| N | |
| O | |
| /dof | NH | T | R | M | |||
|---|---|---|---|---|---|---|---|
| (cm sec-2) | () | ( K) | ( cm) | ( g) | ( ) | ( | |
| 6.0 | 1.17/124 | ||||||
| 6.5 | 1.11/124 | ||||||
| 7.0 | 1.09/124 |
| Name(1) | Rate(2) | L | L | Observation Date |
|---|---|---|---|---|
| ( cts s-1) | ( erg s-1) | ( erg s-1) | ||
| SMP SMC 5 | 3.7 | 67.5 | 2.5 | 2006/03/27 |
| SMP SMC 7 | 1.1 | 20.5 | 0.8 | 2009/10/20 |
| SMP SMC 8 | 2.2 | 40.6 | 1.5 | 2009/11/09 |
| SMP SMC 9 | 1.5 | 27.5 | 1.0 | 2009/10/03 |
| SMP SMC 10 | 2.9 | 53.5 | 2.0 | 2009/09/27 |
| SMP SMC 12∗ | 3.2 | 93.9 | 2.7 | 2007/10/28 |
| SMP SMC 13∗ | 1.7 | 50.6 | 1.5 | 2007/10/28 |
| SMP SMC 14∗ | 2.6 | 75.0 | 2.2 | 2007/10/28 |
| SMP SMC 16 | 2.5 | 45.2 | 1.7 | 2007/06/23 |
| SMP SMC 18 | 2.3 | 43.2 | 1.6 | 2007/04/11 |
| SMP SMC 19 | 1.6 | 29.5 | 1.1 | 2006/11/01 |
| SMP SMC 21 | 1.7 | 31.4 | 1.2 | 2009/10/09 |
| SMP SMC 23 | 1.9 | 35.0 | 1.3 | 2009/10/11 |
| SMP SMC 25 | 58.5 | 2.2 | 2007/06/04 | |
| SMP SMC 27 | 1.2 | 22.9 | 0.9 | 2009/06/29 |
| J2 | 1.8 | 33.9 | 1.3 | 2009/10/03 |
| J4∗ | 3.5 | 102.3 | 3.0 | 2007/10/28 |
| J5 | 2.8 | 51.6 | 1.9 | 2009/10/03 |
| J9 | 3.0 | 56.2 | 2.1 | 2007/04/11 |
| J10 | 1.9 | 34.7 | 1.3 | 2009/09/27 |
| J12 | 1.8 | 33.7 | 1.3 | 2009/09/27 |
| J13 | 7.0 | 129.1 | 4.8 | 2007/06/23 |
| J15 | 2.3 | 42.4 | 1.6 | 2007/06/23 |
| J16 | 2.5 | 46.1 | 1.7 | 2007/06/23 |
| J17 | 2.1 | 39.3 | 1.5 | 2007/04/11 |
| J18 | 2.0 | 36.7 | 1.4 | 2006/11/01 |
| J21 | 1.6 | 28.6 | 1.1 | 2009/11/04 |
| J22 | 3.2 | 58.5 | 2.2 | 2007/06/23 |
| J23 | 12.7 | 234.2 | 8.7 | 2009/10/11 |
| J24 | 4.4 | 80.8 | 3.0 | 2009/10/11 |
| J25 | 1.7 | 30.8 | 1.1 | 2009/10/11 |
| J27 | 2.4 | 43.5 | 1.6 | 2009/10/11 |
| MG8 | 1.6 | 29.1 | 1.1 | 2009/09/27 |
| MG9 | 3.6 | 66.9 | 2.5 | 2007/06/06 |
| MG10 | 3.2 | 59.4 | 2.2 | 2006/10/03 |
| MG11 | 1.6 | 29.1 | 1.1 | 2009/11/30 |
| MA14 | 2.1 | 38.0 | 1.4 | 2009/10/20 |
| MA44 | 1.8 | 33.0 | 1.2 | 2009/10/18 |
| MA406∗ | 3.0 | 86.9 | 2.5 | 2007/10/28 |
| MA891 | 4.0 | 74.5 | 2.8 | 2002/03/30 |
| MA1357 | 4.2 | 76.9 | 2.9 | 2009/10/16 |
| MA1714 | 1.6 | 29.0 | 1.1 | 2009/11/16 |
| MA1762 | 2.6 | 47.4 | 1.8 | 2009/11/19 |
| M7 | 1.9 | 36.0 | 1.3 | 2009/06/29 |
| JD29 | 1.7 | 31.5 | 1.2 | 2009/10/18 |
| JD51 | 2.8 | 51.8 | 1.9 | 2009/10/09 |
| JD53 | 3.5 | 64.2 | 2.4 | 2007/06/06 |
| JD57 | 1.3 | 24.2 | 0.9 | 2009/09/25 |
2.1 Search for X-ray emission from other SMC planetary nebulae
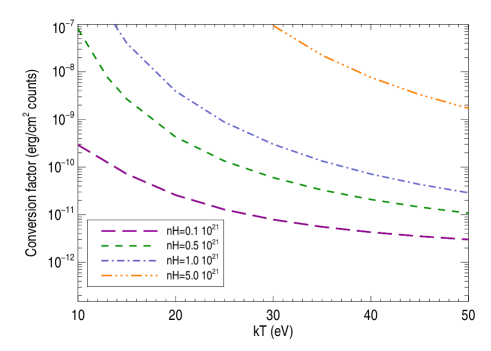
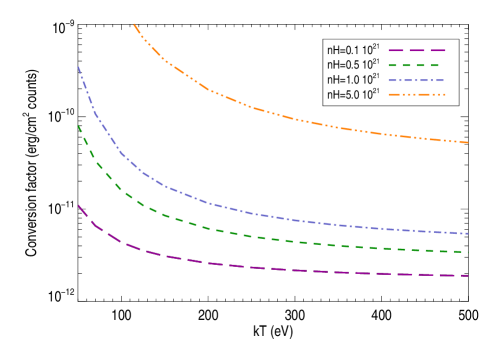
Based on several compilations (see references in Table 5) we selected all the PNe in the SMC that were observed by XMM–Newton in our survey or in other observations in the public archive. Using the data from the EPIC pn camera, we searched for X-ray emission from these objects in the 0.1-1 keV energy band applying the SAS maximum likelihood source detection task emldetect. with the threshold parameter mlmin set to the value 6. For PNe observed in more than one pointing, typically with different off-axis angles and net exposure times, we used the data giving the best sensitivity at the source position. With the exception of SMP SMC 25 (see below), none of the sources in our sample was significantly detected. We report in Table 5 the upper limits on their 0.1–1 keV count rates, that take into account the vignetting correction due to the different off-axis angles. The conversion of these values to physical units requires some assumption on the source spectra. Conversion factors from count rate to flux, for different values of temperature and hydrogen column density, are plotted in Fig. 4 for the case of thin optical filter (that was used in most observations). As representative examples, we report in Table 5 the luminosity upper limits for a blackbody model with eV and for a bremsstrahlung plasma model with eV (in both cases cm-2). For comparison, the corresponding values for SMP 22 would be LBB=1.9 erg s-1 and LTB=2.2 erg s-1.
The detection of SMP SMC 25 with XMM–Newton confirms the association of the low luminosity SSS source RX J0059.6–7138, discovered with ROSAT (Kahabka et al. 1999), with this planetary nebula, also known as LIN357 (Meyssonnier & Azzopardi 1993). The coordinates derived with EPIC (R.A.= 0h 59m 40.3s, Dec.= –71∘ 38′ 17′′, with a 1 uncertainty of 2.5′′) are consistent with the optical position of SMP SMC 25. For comparison, the 90% c.l. error radius obtained for RX J0059.67138 with ROSAT was 14.5′′ (Haberl et al. 2000). The EPIC and ROSAT count rates, considering the uncertainties due to the small statistics and poorly constrained spectrum, are consistent with a constant source flux.
3 Discussion
Due to its location in the SMC, SMP 22 has angular dimensions too small to be spatially resolved with EPIC: 0.710.54′′ (Stanghellini et al. 2003; Vassiliadis et al. 1998). However, the very soft spectrum and high luminosity derived with our spectral analysis imply that its X-ray emission originates from the central star, without any significant contribution from the diffuse gas. The blackbody fit gives a bolometric luminosity Lbol erg s-1, while the more realistic atmosphere model with the nebular abundances yields L erg s-1. Such a value is orders of magnitude higher than the luminosity that can be produced in the surrounding shock-heated gas. The same conclusion was reached by Wang (1991), who, due to the lack of adequate X-ray spectral information, assumed a blackbody with T=3105 K.
Previous spectral analysis of SMP 22 were carried out with the Einstein Observatory by Brown et al. (1994) and with ROSAT by Kahabka et al. (1994). A blackbody model was used in both cases, yielding best fit parameters consistent with, but much less constrained, than those derived here in our analysis. The comparison of these data, spanning almost 30 years, does not give any evidence for long term variability of the source luminosity and/or spectrum. Heise et al. (1994) fitted the ROSAT spectrum of SMP 22 with models of H-rich and He-rich white dwarf atmospheres computed with the LTE assumption. They found that these models, appropriate for H- or He-burning accreting white dwarfs, yield a bolometric luminosity of erg s-1, more than one order of magnitude smaller than the super-Eddington value implied by the blackbody fit to the same data. However, the lack of variability and the upper limit (V20.7) on the optical counterpart (Villaver et al. 2004), do not favor a binary nature, contrary to the case of other SSS. The good fit provided by our NLTE model supports instead the interpretation of SMP 22 as a single, very hot star on its way to become a relatively massive (1 ) white dwarf. Another hint for a high mass star comes from the high N/O ratio (see Table 3) consistent with a Type I PN, implying a massive progenitor (see, e.g. Stanghellini 2007).
It is interesting to compare the temperature of the central star derived from our X-ray spectral analysis (T K) with the values obtained from the modeling of nebular emission lines observed at optical/UV wavelengths. Based on the Zanstra method, which assumes a blackbody spectrum for the ionizing radiation from the central star (Zanstra 1927), Villaver et al. (2004) derived T K and T K, using the He II 4686Å and Hβ lines, respectively. A temperature T=1.15 K was instead obtained from IUE spectroscopy, by adopting NLTE model atmospheres (Aller et al. 1987). These values are in good agreement with our results, considering the unavoidable uncertainties intrinsic in all these model-dependent estimates.
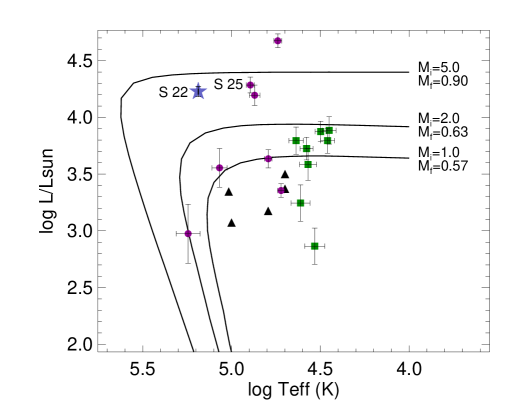
The X-ray detection of SMP 22 is not surprising, considering that all the studies based on optical/UV data indicate that this PN hosts one of the hottest central stars. On the other hand, the same studies also show the presence in the SMC of other PNe with similarly high temperature, as illustrated by the H-R diagram plotted in Fig. 5. Based on this plot we would expect other objects with a soft X-ray emission comparable to, or slightly lower than, that of SMP 22. Instead, our results (Table 5) indicate that most of these PNe are more than two orders of magnitude less luminous in the X-ray band than SMP 22. This applies also to SMP SMC 25, which has a Zanstra temperature about a factor two lower than that of SMP 22 (Villaver et al. 2004), accounting for the large difference of soft X-ray flux between these two PNe. Thus, the X-ray faintness of SMC PNe with hot central stars is likely due to the combination of absorption in the nebula and of the strong dependence of the flux in the EPIC soft X-ray band on the temperature (see Fig. 4). The small value of absorption derived from our fits of SMP 22 is consistent with the Galactic value in the SMC direction, indicating only little or no intrinsic absorption in the nebula itself. The high temperature and luminosity of SMP 22 are also the likely explanation for the absence of dust related features in the Spitzer infrared data (Bernard-Salas et al. 2009). SMP 22 is one of the really energetic PNe with high excitation lines ([O IV] and [Ne V]) as the IR Spitzer spectra show. However, it is not a unique object, as several of the SMC PNe in the Bernard-Salas et al. (2009) study show these lines. This also supports our argument that the absorption may play a major role in hiding other massive PNe across the whole SMC. Recently, Filipović et al. (2009) and Payne et al. (2008) detected four radio-continuum PNe in the SMC which also appear to have very large and massive central stars. They even tentatively called them ”Super PNe” implying their extraordinary nature. We have searched all available radio-continuum images and catalogues at various radio frequencies and found no emission from SMP 22 and SMP SMC 25 down to a 3 limit of 0.3 mJy (Filipović et al. 1997, 1998, 2002).
PNe in our Galaxy have been observed with X-ray luminosity reaching at most 1032 erg s-1 (Kastner 2007), but the detection of Super Soft Sources such as SMP 22 and SMP SMC 25 in the Galactic plane direction is hampered by interstellar absorption. Not surprisingly, the PN most resembling SMP 22 in its X-ray properties has been found in the Large Magellanic Cloud: XMM–Newton observations reported by Kahabka et al. (2008) showed that SMP LMC 29 has a soft X-ray spectrum well fit by a blackbody with T in the range (3–6) K and a bolometric luminosity of (0.1–30) erg s-1.
4 Conclusions
The first X-ray observations of the SMC planetary nebula SMP 22 obtained with a modern high-throughput satellite have allowed us to study its X-ray emission with unprecedented statistics. No evidence for a binary nature, such as long or short term variability, as seen in other SSS was found. It is remarkable that, despite different spectral models can fit the data, a self-consistent picture in terms of temperature, mass and radius of the central star can be obtained with a NLTE model atmosphere with the same elemental abundances seen in the nebula. The inferred mass for the central star, of the order of 1 , implies that SMP 22 is the descendent of a relatively massive progenitor (see Fig. 5). This may explain its exceptional luminosity, as well as the apparent rarity of such objects that evolve very quickly toward the cooling white dwarfs sequence.
Acknowledgements.
This work is based on observations obtained with XMM–Newton, an ESA science mission with instruments and contributions directly funded by ESA Member States and NASA. The XMM–Newton data analysis is supported by the Italian Space Agency (ASI). TR is supported by the German Aerospace Center (DLR) under grant 05 OR 0806.References
- Aller et al. (1987) Aller, L. H., Keyes, C. D., Maran, S. P., et al. 1987, ApJ, 320, 159
- Bernard-Salas et al. (2009) Bernard-Salas, J., Peeters, E., Sloan, G. C., et al. 2009, ApJ, 699, 1541
- Brown et al. (1994) Brown, T., Cordova, F., Ciardullo, R., Thompson, R., & Bond, H. 1994, ApJ, 422, 118
- Chu et al. (2003) Chu, Y., Guerrero, M. A., & Gruendl, R. A. 2003, in IAU Symposium, Vol. 209, Planetary Nebulae: Their Evolution and Role in the Universe, ed. S. Kwok, M. Dopita, & R. Sutherland, 415
- Deb & Singh (2010) Deb, S. & Singh, H. P. 2010, MNRAS, 402, 691
- Filipović et al. (2002) Filipović, M. D., Bohlsen, T., Reid, W., et al. 2002, MNRAS, 335, 1085
- Filipović et al. (2009) Filipović, M. D., Cohen, M., Reid, W. A., et al. 2009, MNRAS, 399, 769
- Filipović et al. (1998) Filipović, M. D., Haynes, R. F., White, G. L., & Jones, P. A. 1998, A&AS, 130, 421
- Filipović et al. (1997) Filipović, M. D., Jones, P. A., White, G. L., et al. 1997, A&AS, 121, 321
- Gruendl et al. (2006) Gruendl, R. A., Guerrero, M. A., Chu, Y., & Williams, R. M. 2006, ApJ, 653, 339
- Haberl et al. (2000) Haberl, F., Filipović, M. D., Pietsch, W., & Kahabka, P. 2000, A&AS, 142, 41
- Haberl & Pietsch (2008) Haberl, F. & Pietsch, W. 2008, in X-rays From Nearby Galaxies, ed. S. Carpano, M. Ehle, & W. Pietsch, 32–37
- Heise et al. (1994) Heise, J., van Teeseling, A., & Kahabka, P. 1994, A&A, 288, L45
- Jacoby (1980) Jacoby, G. H. 1980, ApJS, 42, 1
- Jacoby & De Marco (2002) Jacoby, G. H. & De Marco, O. 2002, AJ, 123, 269
- Kahabka et al. (2008) Kahabka, P., Haberl, F., Pakull, M., et al. 2008, A&A, 482, 237
- Kahabka et al. (1999) Kahabka, P., Pietsch, W., Filipović , M. D., & Haberl, F. 1999, A&AS, 136, 81
- Kahabka et al. (1994) Kahabka, P., Pietsch, W., & Hasinger, G. 1994, A&A, 288, 538
- Kahabka & van den Heuvel (2006) Kahabka, P. & van den Heuvel, E. P. J. 2006, Super-soft sources, ed. Lewin, W. H. G. & van der Klis, M., 461–474
- Kastner (2007) Kastner, J. H. 2007, ArXiv e-prints, 0709.4136
- Leisy & Dennefeld (1996) Leisy, P. & Dennefeld, M. 1996, A&AS, 116, 95
- Meyssonnier & Azzopardi (1993) Meyssonnier, N. & Azzopardi, M. 1993, A&AS, 102, 451
- Montez et al. (2009) Montez, R., Kastner, J. H., Balick, B., & Frank, A. 2009, ApJ, 694, 1481
- Morgan (1995) Morgan, D. H. 1995, A&AS, 112, 445
- Morgan & Good (1985) Morgan, D. H. & Good, A. R. 1985, MNRAS, 213, 491
- Payne et al. (2008) Payne, J. L., Filipovic, M. D., Millar, W. C., et al. 2008, Serbian Astronomical Journal, 177, 53
- Rauch & Deetjen (2003) Rauch, T. & Deetjen, J. L. 2003, in Astronomical Society of the Pacific Conference Series, Vol. 288, Stellar Atmosphere Modeling, ed. I. Hubeny, D. Mihalas, & K. Werner, 103
- Sanduleak et al. (1978) Sanduleak, N., MacConnell, D. J., & Philip, A. G. D. 1978, PASP, 90, 621
- Seward & Mitchell (1981) Seward, F. D. & Mitchell, M. 1981, ApJ, 243, 736
- Soker & Kastner (2002) Soker, N. & Kastner, J. H. 2002, ApJ, 570, 245
- Stanghellini (2007) Stanghellini, L. 2007, in Astronomical Society of the Pacific Conference Series, Vol. 378, Why Galaxies Care About AGB Stars: Their Importance as Actors and Probes, ed. F. Kerschbaum, C. Charbonnel, & R. F. Wing, 456
- Stanghellini et al. (2003) Stanghellini, L., Shaw, R. A., Balick, B., et al. 2003, ApJ, 596, 997
- Strüder et al. (2001) Strüder, L., Briel, U., Dennerl, K., et al. 2001, A&A, 365, L18
- Turner et al. (2001) Turner, M. J. L., Abbey, A., Arnaud, M., et al. 2001, A&A, 365, L27
- Vassiliadis et al. (1998) Vassiliadis, E., Dopita, M. A., Meatheringham, S. J., et al. 1998, ApJ, 503, 253
- Vassiliadis & Wood (1994) Vassiliadis, E. & Wood, P. R. 1994, ApJS, 92, 125
- Villaver et al. (2004) Villaver, E., Stanghellini, L., & Shaw, R. A. 2004, ApJ, 614, 716
- Wang (1991) Wang, Q. 1991, MNRAS, 252, 47P
- Werner et al. (2003) Werner, K., Deetjen, J. L., Dreizler, S., et al. 2003, in Astronomical Society of the Pacific Conference Series, Vol. 288, Stellar Atmosphere Modeling, ed. I. Hubeny, D. Mihalas, & K. Werner, 31
- Zanstra (1927) Zanstra, H. 1927, ApJ, 65, 50