Suzaku Observations of Luminous Quasars:
Revealing the Nature of High-Energy Blazar Emission
in Low-level activity States
Abstract
We present the results from the Suzaku X-ray observations of five flat-spectrum radio quasars (FSRQs), namely PKS 0208512, Q 0827+243, PKS 1127145, PKS 1510089 and 3C 454.3. All these sources were additionally monitored simultaneously or quasi-simultaneously by the Fermi satellite in gamma-rays and the Swift UVOT in the UV and optical bands, respectively. We constructed their broad-band spectra covering the frequency range from Hz up to Hz, and those reveal the nature of high-energy emission of luminous blazars in their low-activity states. The analyzed X-ray spectra are well fitted by a power-law model with photoelectric absorption. In the case of PKS 0208512, PKS 1127145, and 3C 454.3, the X-ray continuum showed indication of hardening at low-energies. Moreover, when compared with the previous X-ray observations, we see a significantly increasing contribution of low-energy photons to the total X-ray fluxes when the sources are getting fainter. The same behavior can be noted in the Suzaku data alone. A likely explanation involves a variable, flat-spectrum component produced via inverse-Compton (IC) emission, plus an additional, possibly steady soft X-ray component prominent when the source gets fainter. This soft X-ray excess is represented either by a steep power-law (photon indices ) or a blackbody-type emission with temperatures keV. We model the broad-band spectra spectra of the five observed FSRQs using synchrotron self-Compton (SSC) and/or external-Compton radiation (ECR) models. Our modeling suggests that the difference between the low- and high-activity states in luminous blazars is due to the different total kinetic power of the jet, most likely related to varying bulk Lorentz factor of the outflow within the blazar emission zone.
1 Introduction
Observations with the EGRET instrument ( MeV to GeV; Thompson et al. 1993) on board the Compton Gamma-Ray Observatory (CGRO) have resulted in detection of -ray emission from a few hundred astrophysical sources, 66 of which were securely associated with active galactic nuclei (AGNs; e.g., Hartman et al. 1999). Most of the AGNs detected by EGRET show characteristics of the blazar class. Observationally, this class include flat-spectrum radio quasars (FSRQs) and BL Lac objects. FSRQs have strong and broad optical emission lines, while the lines are weak or absent in BL Lacs. During the first three months of the Fermi Large Area Telescope’s (LAT) all-sky-survey, 132 bright sources at high Galactic latitudes () were detected at a confidence level greater than (Abdo et al. 2009a). As expected from the EGRET observations, a large fraction (106) of these sources have been associated with known AGNs (Abdo et al. 2009b). This includes two radio galaxies (Centaurus A and NGC 1275; Abdo et al. 2009c) and 104 blazars consisting of 58 FSRQs, 42 BL Lac objects, and 4 blazars with unknown classification based on their Spectral Energy Distribution (SED).
The radio-to-optical emission of luminous blazars of the FSRQ type is known to be produced by the synchrotron radiation of relativistic electrons accelerated within the outflow, while the inverse Compton (IC) scattering of low-energy photons by the same relativistic electrons is most likely responsible for the formation of the high energy X-ray-to--ray component. In addition, it is widely believed that the IC emission from FSRQs is dominated by the scattering of soft photons external to the jet (external Compton radiation, ECR). These photons, in turn, are produced by the accretion disk, and interact with the jet either directly or indirectly, after being scattered or reprocessed in the broad-line region (BLR) or a dusty torus (DT; see, e.g., Dermer & Schlickeiser 1993; Sikora et al. 1994; Błażejowski et al. 2000). Other sources of seed photons can also contribute to the observed IC radiation, and these are in particular jet synchrotron photons through the synchrotron self-Compton process (hereafter SSC; Maraschi et al. 1992; Sokolov & Marscher 2005).
In this context, detailed X-ray studies offer a unique possibility for discriminating between different proposed jet emission models, since those scenarios predict distinct components to be prominent in blazar spectra around keV photon energies. For example, in the soft X-ray range a break is expected in the ECR/BLR model, tracking the low-energy end of the electron energy distribution (Tavecchio et al. 2000; Sikora et al. 2009). Indeed, both the XMM-Newton and the Suzaku X-ray data of RBS 315 show “convex” spectra (Tavecchio et al. 2007). Such a curvature, on the other hand, can be alternatively accounted for by an excess absorption below 1 keV over the Galactic value, or by an intrinsic curvature in the electron energy distribution. Furthermore, the situation can be more complex, with the simultaneous presence of yet additional components, such as the high-energy tail of the synchrotron continuum, SSC emission, or the narrow-band spectral feature originating from the “bulk Comptonization” of external UV (disk) radiation by cold electrons within the innermost parts of relativistic outflow (Begelman & Sikora 1987; Sikora & Madejski 2000; Moderski et al. 2004; Celotti et al. 2007).
Ghisellini et al. (1998) have studied the spectral energy distribution of 51 EGRET-detected -ray loud blazars and have applied the SSC+ECR model to the spectra of these sources. Although most of the broadband data collected by Ghisellini et al (1998) corresponded to non-simultaneous measurements, those authors discovered clear trends and correlations among the physical quantities obtained from the model calculations. In particular, they found an evidence for a well-defined sequence such that the observed spectral properties of different blazar classes (BL Lacs and FSRQs) can be explained by an increasing contribution of an external radiation field towards cooling jet electrons (thus producing the high-energy emission) with the increasing jet power. As a result, while the SSC process alone may account for the entire high-energy emission of low-power sources (BL Lacs), a significant contribution from the ECR is needed to explain the observed spectra of high-power blazars (FSRQs). Meanwhile, when focusing on one particular object, Mukherjee et al. (1999) reported that they found a similar trend in the different spectral states of PKS 0528+134. They studied the sequence of flaring and low-flux states of the source and found that the SSC mechanism plays a more important role when the source is in a low state, and the ECR mechanism is the dominant electron cooling mechanism when the source is in a high -ray state (see in this context also Sambruna et al. 1997).
In order to understand the blazar phenomenon and the differences between BL Lacs and FSRQs, as well as the origin of spectral transitions in a particular object, one has to obtain truly simultaneous coverage across the entire spectrum, during both flaring and low-activity states. However, past -ray observations in low-activity states have been limited to only a few extremely luminous objects, such as PKS 0528-134 or 3C 279. Only now, with the successful launch of the Fermi satellite and the excellent performance of the Suzaku instruments, do we have an opportunity to study high-energy spectra of blazars with substantially improved sensitivity, and therefore can probe the different states of the sources’ activity.
In this paper, we report the high-sensitivity, broadband Suzaku observations of five FSRQs, namely PKS 0208512, Q 0827+243, PKS 1127145, PKS 1510089, and 3C 454.3, which were bright gamma-ray sources detected by EGRET. Additionally, all of these sources were monitored simultaneously or quasi-simultaneously by the Fermi LAT and Swift Ultraviolet/Optical Telescope (UVOT; Roming et al. 2005). These broadband and high-sensitivity observations allow us to reveal the characteristics of the high-energy IC continuum in the low-activity states of luminous blazars. The paper is organized as follows: in 2, we describe observation and data reduction in the X-ray (Suzaku), UV-optical (Swift UVOT) and -ray (Fermi LAT) domains. In 3, we present the broad-band analysis results. Finally, in 4 we discuss the constraints on the jet parameters and speculate on the the origin of different activity states in luminous blazars. Throughout the paper we adopt the cosmological parameters km s-1 Mpc-1, , and .
2 Observation and Data Reduction
2.1 Suzaku
Five FSRQs were observed by Suzaku (Mitsuda et al. 2007) for ks each as one of the long-category projects between 2008 October and 2009 January. Table 1 summarizes the start time, end time, and the exposures for each observation. Suzaku carries four sets of X-ray telescopes (Serlemitsos et al. 2007), each with a focal-plane X-ray CCD camera (XIS, X-ray Imaging Spectrometer; Koyama et al. 2007) that is sensitive over the keV band, together with a non-imaging Hard X-ray Detector (HXD; Takahashi et al. 2007; Kokubun et al. 2007), which covers the keV energy band by utilizing Si PIN photo-diodes and GSO scintillation detectors. All of the sources were focused on the nominal center position of the XIS detectors.
For the XIS, we used data sets processed using the software of the data processing pipeline (ver. 2.2.11.22). Reduction and analysis of the data were performed following the standard procedure using the HEADAS v6.5 software package. The screening was based on the following criteria: (1) only ASCA-grade 0,2,3,4,6 events were accumulated, while hot and flickering pixels were removed using the CLEANSIS script, (2) the time interval after the passage of South Atlantic Anomaly was greater than s, and (3) the object was at least and above the rim of the Earth (ELV) during night and day, respectively. In addition, we also selected the data with a cutoff rigidity (COR) larger than GV. The XIS events were extracted from a circular region with a radius of centered on the source peak, whereas the background was accumulated in an annulus with inner and outer radii of and , respectively. We checked that the use of different source and background regions did not affect the analysis results. The response and auxiliary files were produced using the analysis tools xisrmfgen and xissimarfgen developed by the Suzaku team, which are included in the software package HEAsoft version 6.5.
The HXD/PIN data (version 2.0) were processed with basically the same screening criteria as those for the XIS, except that we required ELV through night and day and COR GV. The HXD/PIN instrumental background spectra were provided by the HXD team for each observation (Kokubun et al. 2007; Fukazawa et al. 2006). Both the source and background spectra were made with identical good time intervals and the exposure was corrected for detector deadtime of . We used the response files, version ae_hxd_pinhxdnom5_20080716.rsp, provided by the HXD team. In our analysis, the hard X-ray emission of PKS 1510089 and 3C454.3 were detected in the energy range from 12 keV to 40 keV and 50 keV, respectively. For other objects, the sources were not detected in the HXD/PIN data. We also note here that all of the objects, the sources were not detected in the HXD/GSO data.
| Object | Start time | Stop time | XIS/HXD exposures | |
|---|---|---|---|---|
| (UT) | (UT) | (ks) | ||
| 0208512 | 1.003 | 2008 Dec 14 07:33 | 2008 Dec 15 11:30 | 50.3/39.3 |
| 0827+243 | 0.939 | 2008 Oct 27 05:11 | 2008 Oct 28 08:04 | 35.3/36.3 |
| 1127145 | 1.187 | 2008 Nov 29 18:10 | 2008 Nov 30 22:51 | 42.2/29.0 |
| 1510089 | 0.361 | 2009 Jan 27 04:32 | 2009 Jan 28 05:25 | 38.5/36.2 |
| 3C 454.3 | 0.859 | 2008 Nov 22 09:19 | 2008 Nov 23 16:31 | 39.9/40.4 |
2.2 Swift
Four analyzed FSRQs (PKS 0208512, Q 0827+243, PKS 1510089, and 3C 454.3) were observed with Swift between 2008 October and 2009 January, as part of Swift “target of opportunity” observations. We analyzed the data taken within or near the time of the Suzaku observations. For the case of PKS 1127145, however, the observations were made only once in 2007 March. We focused on analysis of the UVOT data, since Suzaku provides much better photon statistics in X-rays than Swift X-ray Telescope (XRT; Burrows et al. 2005) and Burst Alert Telescope (BAT; Barthelmy et al. 2005), thanks to the long Suzaku exposures. We used the XRT data primarily for a consistency check regarding the spectral properties. Table 2 summarizes the start time, exposure time, and filters used for each observation.
The UVOT observing mode commonly takes an exposure in each of the six optical and ultraviolet filters (, , , uvw1, uvm2, and uvw2) per Swift pointing. The list of UVOT observations is given in Table 2. For the screening, reduction and analysis of the Swift data, we used standard procedures within the HEASoft v.6.5 software package with the calibration database updated as of 2009 February 28. For this analysis, Level 2 sky-corrected image data were used. Since all sources were relatively bright, the source aperture sizes were chosen to correspond to those used to determine the UVOT zero points: for the optical and UV filters (Poole et al. 2008). The background was extracted from a nearby source-free circular region with radius. All image data were corrected for coincidence loss. The observed magnitudes were converted into flux densities by the standard procedures (Poole et al. 2008).
The XRT data were all taken in Photon Counting mode (PC mode; Hill et al. 2004). The data were reduced by the XRT data analysis task xrtpipline version 0.12.0. Photons were selected from the event file by xselect version 2.4. The auxiliary response file was created by the XRT task xrtmkarf and the standard response file swxpc0to12s6_20010101v011.rmf. All spectra were analyzed in the 0.310.0 keV band using XSPEC version 11.3.2.
| Object | obsID | Start time | Exposurea | Exposureb | Filterb |
|---|---|---|---|---|---|
| (UT) | (ks) | (ks) | |||
| 0208512 | 00035002024 | 2008 Dec 14 15:25 | 0.99 | 0.94 | all |
| 0827+243 | 00036375004 | 2008 Dec 08 13:42 | 1.72 | 1.71 | |
| 1127145 | 00036380001 | 2007 Mar 24 00:32 | 14.6 | 14.2 | all |
| 1510089 | 00031173010 | 2009 Jan 25 18:40 | 3.46 | 3.40 | , w1, m2 |
| 3C 454.3 | 00035030030 | 2008 Oct 26 20:28 | 0.43 | 0.40 | all |
2.3 Fermi LAT
During the first year of Fermi Large Area Telescope (LAT; Atwood et al. 2009) operation, most of the telescope’s time has been dedicated to “survey mode” observing, where Fermi points away from the Earth, and nominally rocks the spacecraft axis north and south from the orbital plane to enable monitoring of the entire sky every hours (or 2 orbits). We analyzed the LAT’s observations of the five blazar regions using data collected during the first 4-5 months centered around Suzaku observations. Little variability indicated by the LAT lightcurves for the studied objects during this time implies that the constructed broad-band spectra, even though not exactly simultaneous, are representative for the low-activity states of all five blazars.
The data used here comprise all scientific data obtained between 4 August and 19 December 2008 for PKS 0208512, Q 0827+243, PKS 1127145 and 3C 454.3 (interval runs from Mission Elapsed Time (MET) 239557417 to 251345942), and 4 August 2008 and 30 January 2009 for 1510089 (MET 239557417 to 254966035), respectively . We have applied the zenith angle cut to eliminate photons from the Earth’s limb, at . This is important in pointed mode observations, but also important for survey mode due to overshoots and sun avoidance maneuvers. In addition, we excluded the time intervals when the rocking angle was more than 43∘. We use the “Diffuse” class events (Atwood et al. 2009), which, of all reconstructed events have the highest probability of being photons.
In the analysis presented here, we set the lower energy bound to a value of MeV, since the bin counts for photons with energies of MeV and lower are systematically lower than expected based on extrapolations of a reasonable functions. Science Tools version v9r14 and IRFs (Instrumental Response Functions) P6_V3 were used.
3 Results
3.1 Suzaku
3.1.1 Temporal analysis
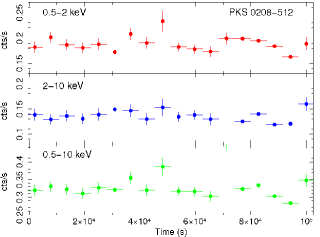
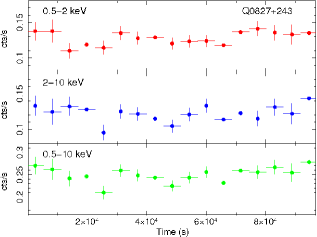
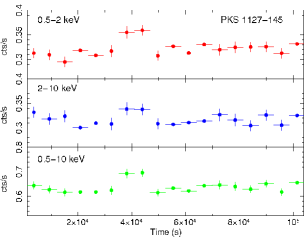
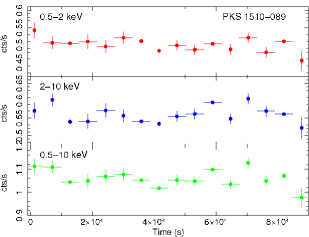
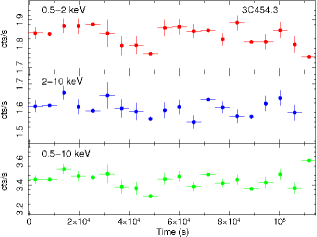
Figure 1 shows the count rate variations of the five observed FSRQs. The summed XISs (XIS0,1,3) light curves are shown separately in different energy bands: 0.52 keV (upper panel), 210 keV (middle panel), and 0.510 keV (bottom panel), respectively. Since the count rate variations of the HXD/PIN detector were less clear due to limited photon statistics and uncertainty of the modeling of the non-X-ray background, we only concentrate on the temporal variability of the XIS data below 10 keV. We evaluate the fractional variability by calculating the variability amplitude relative to the mean count rate corrected for effects of random errors (e.g., Edelson et al. 2002): , where is the total variance of the light curve, is the mean error squared and is the mean count rate. The variability amplitude in the XIS bands are for 0208512, for 1127145, and for 1510089, respectively. 0827+243 and 3C454.3 show only weak variability, which is not significant.
3.1.2 Time-averaged spectral analysis
In the following we report the analysis procedure and results for each object. The background-subtracted spectra were fitted using XSPEC ver.11.3.2. All errors are quoted at the confidence level for the parameter of interest unless otherwise stated. All the fits in this paper are restricted to the energy ranges of keV (XIS0,3: the FI chips), keV (XIS1: the BI chip), keV for PKS 1510089, and keV for 3C 454.3 (HXD/PIN). We fixed the relative normalization of the XISs and HXD/PIN at 1.13, which is carefully determined from the XIS calibration using nominal pointings of the Crab Nebula. Serlemitsos et al. (2007) reported that spectral normalizations are slightly different (a few percent) among the CCD sensors based on a contemporaneous fit of the Crab spectra. Therefore, we adjusted the normalization factor among the three XISs relative to XIS0. The results of the spectral fits with a simple absorbed power-law model are summarized in Table 3 (with Galactic absorption) and Table 4.
| Object | aa XRT | bb UVOT | constant | ||
|---|---|---|---|---|---|
| (XIS0,1,3,HXD/PIN) | (dof) | ||||
| 0208512 | 3.08 (fixed) | 1.680.03 | 1.370.06 | 1,1.040.05,1.040.05,None | 0.91 (250) |
| 0827+243 | 3.62 (fixed) | 1.460.04 | 1.370.07 | 1,0.900.05,1.040.06,None | 0.84 (194) |
| 1127145 | 3.83 (fixed) | 1.410.02 | 3.450.08 | 1,1.030.03,1.050.03,None | 1.01 (331) |
| 1510089 | 7.88 (fixed) | 1.370.01 | 6.310.12 | 1,1.000.02,1.020.02,1.13 | 1.06 (407) |
| 3C 454.3 | 7.24 (fixed) | 1.580.01 | 16.70.2 | 1,1.040.01,1.020.01,1.13 | 1.00 (1090) |
| Object | ModelaaFixed value indicates the Galactic absorption column density in units of cm-2. | bbFlux in units of erg cm-2 s-1. | ccDifferential spectral photon index at the low-energy X-ray band, when fitted with a double power-law function. | ddFlux in units of erg cm-2 s-1. | kT | ||
|---|---|---|---|---|---|---|---|
| (keV) | |||||||
| 0208512 | PL | 3.08 (fixed) | 1.680.03 | - | 1.370.06 | - | 0.91 (250) |
| 0827+243 | PL | 3.62 (fixed) | 1.460.04 | - | 1.370.07 | - | 0.84 (194) |
| 1127145 | PL | 10.8 | 1.520.03 | - | 3.360.08 | - | 0.82 (330) |
| 1510089 | PL+BB | 7.88 (fixed) | 1.320.03 | - | 6.420.13 | 0.150.03 | 0.97 (405) |
| PL+PL | 7.88 (fixed) | 1.26 | 2.85 | 6.30 | - | 0.96 (405) | |
| 3C 454.3 | PL | 9.07 | 1.620.01 | - | 16.60.2 | - | 0.97 (1089) |
PKS 0208512
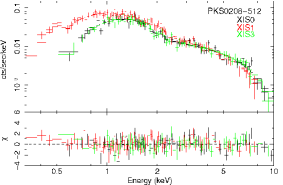
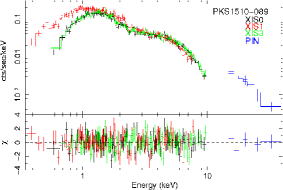
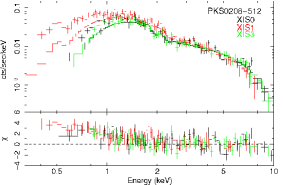
The time averaged, background subtracted three XIS spectra of PKS 0208512, when fitted jointly, are well described by a single absorbed power-law model, and the absorption column is consistent with the Galactic value cm-2 (Dickey & Lockman 1990). We obtained the best fit photon index and the keV flux erg cm-2 s-1 with a chi-squared value of for dof. Figure 2 shows the spectra obtained with the XISs with residuals plotted against the best-fit power-law model with Galactic absorption. Although statistically acceptable, we notice that the residuals of the fits show moderate excess feature at low energies, below keV.
In the previous observation with BeppoSAX during a high flux state (Tavecchio et al. 2002), erg cm-2 s-1 - which is a factor of three larger than in our Suzaku observations - the X-ray spectrum is well described by a power-law with photon index , similar to the Suzaku result. However, Tavecchio et al. reported that the spectrum was heavily absorbed below keV, indicating a column density of cm-2. Figure 4 shows the Suzaku spectrum with residuals assuming such an increased value of . The residuals indicate significant soft excess emission below keV, if is the same as found in the previous BeppoSAX observation.
The variable soft X-ray emission of PKS 0208512 may indicate that the convex spectrum observed by BeppoSAX reflects an intrinsic IC continuum shape, while the soft excess observed by Suzaku reflects the presence of an additional spectral component which becomes prominent when the source gets fainter (see Tavecchio et al. 2007; Kataoka et al. 2008). Therefore, to model in more detail the observed X-ray spectrum, we first considered a double power-law fit (PL + PL) in which the soft X-ray excess is represented by a steep power-law component. The absorption column is fixed at cm-2, as given by Tavecchio et al. (2002). We obtained the photon indices and . This provides an acceptable fit, with /dof = 0.90/248. We also considered an alternative fit consisting of a power-law function and a blackbody component. This model also gives a similarly good representation of the data with /dof = 0.90/248, implying and the temperature of the introduced thermal component of keV. Both fits appear to be as good as a single power-law with free absorption, and do not improve the goodness of fit.
Q 0827+243
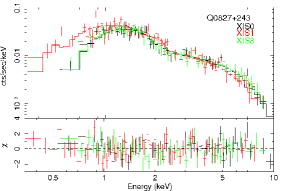
The time averaged spectra of Q 0827+243 collected with the XISs are well fitted by an absorbed power-law model with a photon index ( for 194 dof). The absorption column is consistent with the Galactic value of cm-2 (Dickey & Lockman 1990), and the flux over keV is erg cm-2 s-1. As shown in Figure 2, there is no evidence for any additional spectral feature in the soft band. This result is in good agreement with previous Chandra observations of the core (Jorstad & Marscher 2004), revealing that the X-ray continuum is well described by a power-law model () with Galactic absorption.
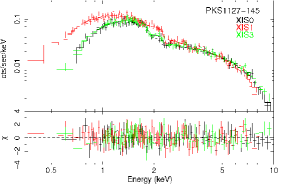
PKS 1127145
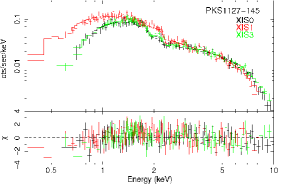
We first fitted the XISs spectra with a single power-law model with a Galactic absorption of cm-2 (Murphy et al. 1996). We obtained the photon index of for 331 dof), but the residuals show a substantial deficit of photons at low energies (Figure 2). To investigate this deficit in more detail, we fitted the spectra with a single power-law and a free absorption model. This model represents well the spectra with the best chi-squared value of 0.82 for 330 dof (Figure 3), indicating that the column density is higher than the Galactic value at the confidence level. For this model the photon index is and the unabsorbed X-ray flux is erg cm-2 s-1. The best-fit column density is cm-2, which is similar to the one found in previous Chandra and XMM-Newton observations ( cm-2) during a high state with erg cm-2 s-1 (Bechtold et al. 2001; Foschini et al. 2006). We note that the Galactic absorption and a broken power-law model also well represents the spectra with /dof of 0.81/329. In this model, the spectrum below keV is rather hard (), and the high energy photon index is .
PKS 1510089
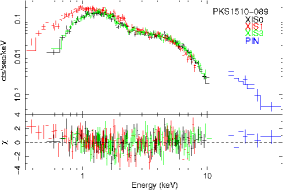
Figure 2 shows the XISs and HXD/PIN spectra of PKS 1510089 (including residuals), plotted against the best-fit power-law model with Galactic absorption, using the overall X-ray data between and keV. The best fit photon index is and the unabsorbed X-ray flux is erg cm-2 s-1. However, this model did not represent the spectra well yielding a chi-squared value of 1.06 for 407 dof. The residuals indicate some excess emission at low energies.
To represent the observed X-ray spectra, we tried the same analysis as for PKS 0208512. We first fitted the data by a double power-law model with Galactic absorption. We obtained the photon indices and . This provides an acceptable fit, with /dof = 0.96/405. The improvement of the chi-squared statistic is significant at more than the confidence level when compared to the single power-law model. Next, we considered an alternative fit consisting of a power-law function and a blackbody component. This model also gives a good representation of the data, with of 0.97 for 405 dof, indicating that the photon index is and the temperature of the introduced thermal component is keV. This result is consistent with previous Suzaku (; Kataoka et al. 2008) and BeppoSAX observations (; Tavecchio et al. 2000).
3C 454.3
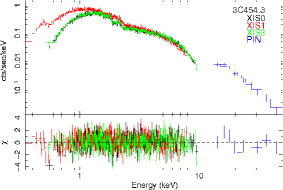
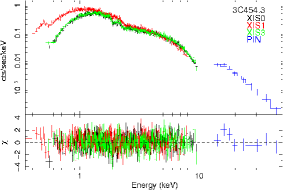
We first fitted the XISs and PIN spectra with a single power-law model with a Galactic absorption of cm-2 (Murphy et al. 1996). We obtained the photon index of ( for 1090 dof), but the residuals show some scatter around 1 keV. To investigate this scatter in more detail, we fitted the spectra with a single power-law and a free absorption model. This model represents well the spectra with the best chi-squared value of 0.97 for 1089 dof, indicating that the column density is higher than the Galactic value at the confidence level. For this model the photon index is and the unabsorbed X-ray flux is erg cm-2 s-1.
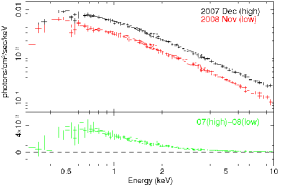
In the case of 3C 454.3 we obtained the best fit to the XISs and HXD/PIN spectra assuming an absorbed power-law model with a photon index of and a column density of cm-2, which is larger than the Galactic value at the confidence level. The unabsorbed keV flux is erg cm-2 s-1 (Figure 2). The spectra can be fitted with both the Galactic absorption and a broken power-law model as well as the above model (/dof of 0.96/1088). In the former case, the photon indices are and , while the break energy is keV. In addition, we reanalyzed the previous Suzaku data collected in December 2007 during the high state (Donnarumma et al. 2010). The time averaged XISs and HXD/PIN spectra was well described by a single absorbed power-law model with , implying the flux erg cm-2 s-1, which is larger by a factor of two than the one found in our 2008 observations. The absorption column also shows a higher value of cm-2.
Figure 5 shows the unfolded spectra obtained in 2007 (high state) and 2008 (this work; low state). The bottom panel shows the residuals by subtracting the spectra in the high state from those in the low state. The excess emission at low energies is clearly visible in the residuals.
The previous X-ray observations of 3C 454.3 often indicated some additional absorption in excess to the Galactic value. For example, Villata et al. (2006) reported cm-2 in the Chandra data collected in May 2005, during the outburst phase ( erg cm-2 s-1, which is times higher than in our observation). An even higher hydrogen column density was found by Giommi et al. (2006), when fitting the April-May 2005 data taken by the Swift XRT ( cm-2), and by Atari et al. (2007, 2008), using the July and December 2006, and May 2007 data taken by XMM-Newton. Assuming that the intrinsic absorption in 3C 454.3 is the same as reported in Villata et al. (2006), we fit our Suzaku data first by a double power-law function, obtaining and . This provides an acceptable fit, with /dof = 0.97/1088. Next we consider an alternative fit consisting of a power-law and a blackbody component. This model gives a good representation of the data, with /dof = 1.00/1088, a photon index of , and a temperature of keV. However, the fitting results do not improve the goodness of fit compared with the single power-law model with free absorption.
3.1.3 Time-resolved spectral analysis
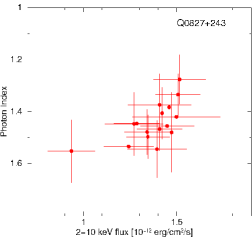
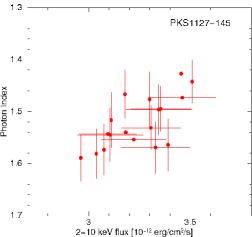
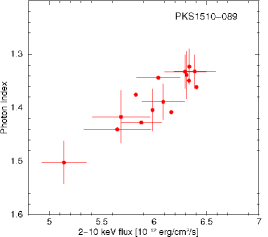
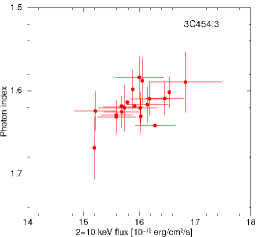
In order to investigate the X-ray spectral evolution of each object, we divided the total exposure into one-orbit intervals ( s). We fitted the overall XIS spectra between and keV with an absorbed simple power-law function. The photoelectric absorbing column densities were fixed at the values derived in 3.1.2. Figure 6 shows the relation between the keV fluxes versus the photon indices measured by the Suzaku XISs. Significant spectral variation is seen in PKS 0208512 (), Q 0827+243 (), PKS 1127145 (), and PKS 1510089 (). In the case of 3C 454.3, the X-ray photon index is only weakly variable around the mean value . Figure 6 clearly reveals a spectral evolution with the X-ray spectra hardening as the sources become brighter. Such a trend is often observed in high-frequency-peaked BL Lac objects (e.g., Kataoka et al. 1999), but it has never been observed so clearly in FSRQs (but see Kataoka et al. 2008 for PKS 1510089).
3.2 Swift
Since the effective area of the XRT is less than 10% of the XIS in the 0.510 keV range, detailed spectral modeling is difficult using data. Furthermore, the average exposure for the observation was only a few kiloseconds, which was much less than the exposure. We therefore fit the XRT data simply with a power-law model with Galactic absorption in the energy range 0.310 keV for the cross-calibration between the two instruments. The results of the spectral fits are summarized in Table 5. We can see that the results obtained with and are consistent within the range of error except PKS 1127145.
| Object | aaSpectral fitting models. PL, power-law function; PL+PL, double power-law function; PL+BB, power-law + blackbody model. | bbDifferential spectral photon index. | ||
|---|---|---|---|---|
| (dof) | ||||
| 0208512 | 3.08 (fixed) | 1.960.24 | 1.370.06 | 0.33 (13) |
| 0827+243 | 3.62 (fixed) | 1.460.35 | 1.13 | 1.12 (8) |
| 1127145 | 3.83 (fixed) | 1.280.03 | 6.140.23 | 1.28 (94) |
| 1510089 | 7.88 (fixed) | 1.380.08 | 6.09 | 0.71 (31) |
| 3C 454.3 | 7.24 (fixed) | 1.530.09 | 17.62.1 | 1.41 (18) |
The UVOT fluxes in each filter were corrected for Galactic extinction following the procedure described in Cardelli et al. (1989). We generated a list of the amount of extinction that needs to be accounted for in each filter, , where and are constants. The Cardelli procedure provides a good approximation to the UV-through-IR Galactic dust extinction as a function of the total-to-selective extinction, , which throughout this paper we assume to be , which is the mean Galactic value. The observed magnitudes and correction factors for each of the filters are summarized in Table 6 and Table 7, respectively.
| Object | uvw1 | uvm2 | uvw2 | E(B-V) | |||
|---|---|---|---|---|---|---|---|
| (mag) | (mag) | (mag) | (mag) | (mag) | (mag) | ||
| 0208512 | 17.64 | 17.94 | 17.17 | 16.840.07 | 16.710.07 | 17.00 | 0.022 |
| 0827+243 | - | - | 16.570.01 | - | - | - | 0.033 |
| 1127145 | 16.480.02 | 16.700.01 | 15.640.01 | 15.510.01 | 15.560.01 | 15.790.01 | 0.037 |
| 1510089 | - | - | 16.010.02 | 16.270.02 | 16.130.02 | - | 0.097 |
| 3C 454.3 | 16.05 | 16.520.06 | 15.720.06 | 15.750.06 | 15.810.08 | 16.060.05 | 0.107 |
| Param | uvw1 | uvm2 | uvw2 | ||||
|---|---|---|---|---|---|---|---|
| aaFixed value indicates the Galactic absorption column density in units of cm-2. | (nm) | 547 | 439 | 346 | 260 | 249 | 193 |
| bbFlux in units of erg cm-2 s-1. | 1.0015 | 0.9994 | 0.9226 | 0.4346 | 0.3494 | 0.0581 | |
| bbParameters for calculating Galactic extinction for optical and UV filters, calculated according to the prescription in Cardelli et al. (1989). The Galactic reddening was taken from Schlegel et al. (1998). | 0.0126 | 1.0171 | 2.1019 | 5.3286 | 6.1427 | 8.4402 | |
| 0208512 | 0.07 | 0.09 | 0.11 | 0.15 | 0.16 | 0.18 | |
| 0827+243 | - | - | 0.16 | - | - | - | |
| bbParameters for calculating Galactic extinction for optical and UV filters, calculated according to the prescription in Cardelli et al. (1989). The Galactic reddening was taken from Schlegel et al. (1998). | 1127145 | 0.12 | 0.15 | 0.18 | 0.25 | 0.27 | 0.31 |
| 1510089 | - | - | 0.48 | 0.65 | 0.70 | - | |
| 3C 454.3 | 0.33 | 0.44 | 0.53 | 0.71 | 0.77 | 0.88 |
3.3 Fermi LAT
To study the average spectra of five objects during the four or five months of observations, we use the standard maximum-likelihood spectral estimator provided with the LAT science tools gtlike. This fits the data to a source model, along with models for the uniform extragalactic and structured Galactic backgrounds. Photons were extracted from a region with a radius centered on the coordinates of the position of each object. The Galactic diffuse background model is the currently recommended version (glliemv02 111This model is available for download from the Fermi Science Support Center, http://fermi.gsfc.nasa.gov/ssc.), with the normalization free to vary in the fit. The response function used is P6_V3_DIFFUSE.
For simplicity, we model the continuum emission from each source with a single power-law. It is likely that such a model might be too simple, as shown in the paper reporting spectra of bright Fermi blazars (Abdo et al. 2010), where the gamma-ray data suggest a steepening of the spectrum with energy, well-described as a broken power-law. However, here, we are reporting cases of blazars in low-level activity states and thus relatively faint, where fits to a broken power-law model would result in poorly constrained spectral parameters for a more complex model; furthermore, we note that the use of such more complex spectral model in the gamma-ray band does not alter our conclusions or significantly change the parameters in Table 10. The extragalactic background is assumed to have a power-law spectrum, with its spectral index and the normalization free to vary in the fit. From an unbinned gtlike fit the best fit photon indices are for PKS 0208512, for Q 0827+243, for PKS 1127145, for PKS 1510089, and for 3C 454.3 (see also Table 8). Here only statistical errors are taken into account, and we report fluxes using spectra extrapolated down to MeV. In the case of bright sources (PKS 1510089 and 3C 454.3), we also analyzed the data collected during the Suzaku observing period to construct the simultaneous broad-band spectra spectra.
Table 9 summarizes the flux in seven energy bands obtained by separately running gtlike for each energy band; 200400 keV, 400800 keV, 8001600 keV, 16003200 keV, 32006400 keV, 640012800 keV, 1280025600 keV, respectively.
| Object | aaCenter wavelength for each optical and UV filter. | TSbbTest statistic: defined as TS , where and are the likelihood when the source is included or not. | |
| 0208512 | 2.330.05 | 0.260.03 | 1484 |
| 0827+243 | 2.620.36 | 0.050.04 | 58 |
| 1127145 | 2.750.14 | 0.150.04 | 234 |
| 1510089 | 2.480.03 | 0.690.04 | 4224 |
| 3C 454.3 | 2.500.02 | 2.550.08 | 25144 |
| 1510089ccCorresponding data collected during the Suzaku observing period. | 2.280.27 | 0.910.51 | 59 |
| 3C 454.3ccCorresponding data collected during the Suzaku observing period. | 2.620.13 | 2.590.58 | 281 |
| Object | Band 1aaFlux in units of 10-6 ph cm-2 s-1. | Band 2aaBand 1: 200400 MeV, Band 2: 400800 MeV, Band 3: 8001600 MeV, Band 4: 16003200 MeV, Band 5: 32006400 MeV, Band 6: 640012800 MeV, and Band 7: 1280025600 MeV | Band 3aaBand 1: 200400 MeV, Band 2: 400800 MeV, Band 3: 8001600 MeV, Band 4: 16003200 MeV, Band 5: 32006400 MeV, Band 6: 640012800 MeV, and Band 7: 1280025600 MeV | Band 4aaBand 1: 200400 MeV, Band 2: 400800 MeV, Band 3: 8001600 MeV, Band 4: 16003200 MeV, Band 5: 32006400 MeV, Band 6: 640012800 MeV, and Band 7: 1280025600 MeV | Band 5aaBand 1: 200400 MeV, Band 2: 400800 MeV, Band 3: 8001600 MeV, Band 4: 16003200 MeV, Band 5: 32006400 MeV, Band 6: 640012800 MeV, and Band 7: 1280025600 MeV | Band 6aaBand 1: 200400 MeV, Band 2: 400800 MeV, Band 3: 8001600 MeV, Band 4: 16003200 MeV, Band 5: 32006400 MeV, Band 6: 640012800 MeV, and Band 7: 1280025600 MeV | Band 7aaBand 1: 200400 MeV, Band 2: 400800 MeV, Band 3: 8001600 MeV, Band 4: 16003200 MeV, Band 5: 32006400 MeV, Band 6: 640012800 MeV, and Band 7: 1280025600 MeV |
|---|---|---|---|---|---|---|---|
| 0208512 | 3.240.25 | 3.690.30 | 4.190.42 | 3.810.61 | 2.880.79 | 1.951.00 | 1.511.49 |
| 0827+243 | 0.730.22 | 1.030.28 | 1.080.36 | 0.920.50 | - | - | - |
| 1127145 | 2.650.34 | 2.500.43 | 3.210.68 | 3.171.05 | - | - | - |
| 1510089 | 9.740.38 | 10.620.48 | 10.190.67 | 11.571.09 | 7.511.47 | 7.152.26 | 5.143.01 |
| 3C 454.3 | 37.220.67 | 39.360.91 | 43.791.42 | 44.202.31 | 26.652.96 | 17.983.99 | 4.553.28 |
4 Discussion
4.1 Broad-Band Spectra spectral fits
We constructed the broad-band spectral energy distribution (SED) ranging from the radio to -ray bands for the five observed FSRQs, and these are shown in Figure 7. Here the filled red circles and solid lines represent simultaneous data from the UV/optical (Swift UVOT), X-ray (Suzaku) and -ray (Fermi LAT) observations. Quasi-simultaneous data are also shown as red open triangles and dashed lines. Historical radio (NED) and -ray (EGRET) data are also plotted as filled blue circles. Green symbols in the SEDs of PKS 1510089 and 3C 454.3 denote the previous simultaneous observations (Kataoka et al. 2008; Donnarumma et al. 2010).
In order to model the constructed SEDs, we applied the synchrotron-inverse Compton (IC) emission model described in Tavecchio & Ghisellini (2008), where both synchrotron and external (BLR and DT) photons are considered as seed radiation fields contributing to the IC process (SSC+ECR). The electron distribution is modeled as a smoothly broken power-law:
| (1) |
where (cm-3) is a normalization factor, and are the energy indices below and above the break Lorentz factor . The electron distribution extends within the limits . We also assume that the ‘blazar emission zone’, with the comoving size and magnetic field intensity , is located at the distance such that , where is the distance below which the photon energy density in the jet rest frame is dominated by the direct radiation of the accretion disk, is the characteristic scale of the broad-line-region, and is the scale of the dusty torus (see the discussion in Tavecchio & Ghisellini 2008 as well as in Sikora et al. 2009). This choice, while somewhat arbitrary, has been validated by a number of authors modeling broad-band spectra of FSRQs. Hence, the comoving energy density of the dominant photon field — provided by the BLR — is
| (2) |
where is the jet bulk Lorentz factor, and the BLR is assumed to reprocess of the disk luminosity . Finally, we assume that the jet viewing angle is in all the cases , so that the jet Doppler factor .
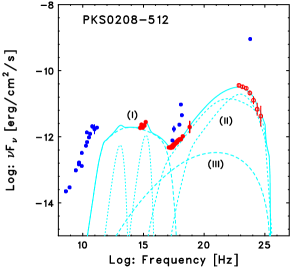
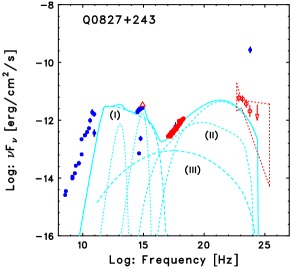
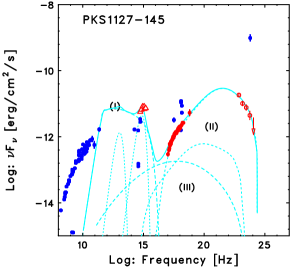
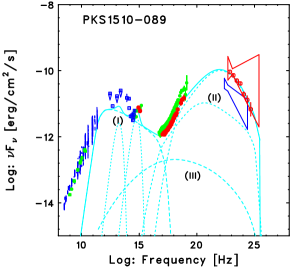
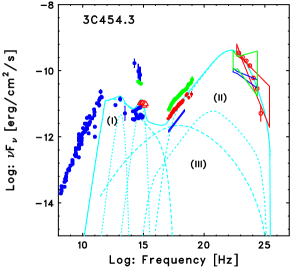
The results of model fitting are shown in different panels of Figure 7, and the resulting parameters are summarized in Table 10. In the context of this model, where we assume the dissipation region to be between the immediate vicinity of the accretion disk but within the BLR, it is clear that in all cases the LAT fluxes are dominated by the IC/BLR component, while in the X-ray band both IC/BLR and IC/DT processes may contribute at a comparable level. In addition, the SSC emission seems negligible, being in particular too weak to account for the soft X-ray excess discussed in the previous sections. This excess, on the other hand, may be well represented by the high-energy tail of the synchrotron continuum, or an additional blackbody-type spectral component.
| Object | ||||||||||||
|---|---|---|---|---|---|---|---|---|---|---|---|---|
| [ cm-3] | [ cm] | [G] | [ erg/s] | [ cm] | [ cm] | |||||||
| 0208512 | 2 | 3.3 | 3.0 | 700 | 4.3 | 2.2 | 15 | 1.8 | 1.1 | 1.5 | 0.76 | 3.0 |
| 0827+243 | 2 | 3.3 | 1.5 | 300 | 1.0 | 8.5 | 10 | 1.8 | 3.8 | 2.0 | 1.3 | 4.2 |
| 1127145 | 2 | 3.4 | 1.2 | 110 | 5.0 | 0.65 | 10 | 6.5 | 4.1 | 10 | 0.8 | 10 |
| 1510089 | 2 | 3.5 | 3.0 | 190 | 4.6 | 0.81 | 13 | 4 | 0.8 | 0.3 | 0.48 | 4 |
| 3C 454.3 | 2 | 3.8 | 1.0 | 290 | 3.0 | 4.5 | 12 | 3.2 | 0.8 | 4.0 | 1.5 | 30 |
Based on the model results, for each object we compute the ratio of the comoving energy densities stored in jet electrons and the magnetic field,
| (3) |
where is the magnetic field intensity in the emission region. In addition, we compute the implied total kinetic jet power as
| (4) |
where is the emission region linear size, and is the energy density of cold protons. The latter parameter is estimated assuming one proton per ten electron-positron pairs (see the discussion in Sikora et al. 2009), namely . The resulting total kinetic power of the outflow is then compared with the accretion luminosity (assuming standard accretion disk with radiative efficiency), by means of the evaluated efficiency parameter , where is the disk luminosity implied by the model fitting (see Table 10). Note that with the above model assumptions and the model parameters inferred by us, the jets of objects considered here are dynamically dominated by cold protons, , since the mean Lorentz factor of the radiating ultra-relativistic electrons is in all the cases (see Table 11).
| Object | ||||
| [ erg/s] | ||||
| 0208512 | 2 | 0.8 | 0.06 | 16 |
| 0827+243 | 0.6 | 2.8 | 0.14 | 8 |
| 1127145 | 0.03 | 5.8 | 0.06 | 5 |
| 1510089 | 0.9 | 1 | 0.35 | 12 |
| 3C 454.3 | 7 | 9.4 | 0.23 | 5 |
Some of the derived jet parameters for five luminous blazars in their low-activity states are significantly different from the analogous parameters claimed for the flaring states, even in the same object. For example, in the case of the high-activity state of PKS 1510089, Kataoka et al. (2008) estimated (under the same assumptions regarding the jet content as in this paper) the total kinetic power of the jet as erg s-1, which is larger than the value derived in this paper, by about a factor of 3. In addition, our model values of the jet bulk Lorentz factors are also systematically lower than the ones given in the literature ( versus ). Interestingly, other jet parameters, such as magnetic field intensity - G - and the equipartition ratio, , or the general spectral shape of the electron energy distribution, are comparable to the ones found for flaring FSRQs, (albeit with a substantial scatter). It should be noted in this context, however, that for the three sources considered in this paper (namely PKS 1127145, PKS 1510089, and 3C 454.3), the flaring states were analyzed in a framework of the IC/DT model (Błażejowski et al. 2004, Kataoka et al. 2008, Sikora et al. 2008, respectively), while here, we argue that the IC/BLR contribution is dominant, as motivated by the detected relatively short (day) variability timescale of the X-ray continua. On the other hand, as discussed recently in Sikora et al. (2009), there is so-called a ‘conspiracy’ between the IC/BLR and IC/DT models, in a sense that the resulting inferred jet parameters are comparable in both cases. Hence, we can safely conclude that the low- and high-activity states of luminous blazar sources are due to the low and high total kinetic power of the jet, respectively, possibly related to varying bulk Lorentz factors within the blazar emission zone. And indeed, keeping in mind that the highly dynamical and complex jet formation processes in the closest vicinity of supermassive black holes – most likely shaped by accretion process subjected to several possible instability of the jet fuel, especially when the accretion rate is close to Eddington – such a significant variation in the total kinetic output of the outflow should not be surprising. Further support for this scenario comes from the fact that the jet efficiency factors estimated here, , are significantly lower than the ones found for powerful blazars in their flaring states (see Sambruna et al. 2006, Ghisellini et al. 2009), even if the difference in the jet proton content adopted by various authors is taken into account.
4.2 Spectral Evolution
As shown in 3.1.3, the X-ray spectra of the FSRQs analyzed here flatten with increasing flux. For and the dominant IC/BLR emission process, the electrons emitting the observed 110 keV photons have Lorentz factor few. The electrons emitting X-ray photons in these sources are very low-energy, so cooling effects cannot play any role in the observed spectral evolution. In particular, it can be easily demonstrated that in a framework of our model (i.e., for the dominant IC/BLR energy losses), a strong cooling regime is expected only for the electrons with Lorentz factors greater than
| (5) | |||||
This, for the fitting parameters as given in Table 10, is typically above or just around the break Lorentz factor, (in agreement with the discussion in Sikora et al. 2009). Adiabatic losses, if present, should not result in changing the slope of the power-law X-ray continua as well. Thus, one may suspect that the revealed spectral changes are shaped by the acceleration process within the blazar emission zone. In the case of relativistic jets the relevant acceleration processes are still quite uncertain, although, as pointed out by Kataoka et al. (2008) and Sikora et al (2009), the repeatedly observed flat X-ray photon indices seem to favor the mechanism discussed by Hoshino et al. (1992) for the low-energy segment of the electron energy distribution. In this model, the low-energy electrons (with Lorentz factors, roughly, ) are accelerated by a resonant absorption of the cyclotron emission generated by cold protons reflected from the shock front. As shown later by Amato & Arons (2006), the power-law slope of these accelerated electrons depends on the relative number of electrons to protons at the shock front. Hence, a larger fraction of the energy carried by jet protons during the higher-activity states should in principle result in a more efficient acceleration of jet electrons and their flatter spectrum, in agreement with the observed X-ray spectral evolution discussed here.
The above interpretation, on the other hand, would imply a significant variability in the -ray frequency range. Indeed, the broken power-law form of the electron energy distribution revealed by our spectral modeling discussed in the previous section implies the -ray flux around the IC spectral peak Hz should be, roughly
| (6) |
where is the monochromatic X-ray flux measured around Hz, and is the observed X-ray photon index. For example, our analysis for PKS 0208512 indicates a photon index for an X-ray flux erg cm-2 s-1 in the lower state, and for erg cm-2 s-1 in the higher state. Thus, if the observed X-ray variability is due to flattening of the electron energy distribution during the acceleration process, one should observe the -ray variability of the order of
| (7) |
However, during the simultaneous Fermi observation, no significant -ray variability was observed for the analyzed sources, at least within one day timescale.
Therefore, the most viable explanation for the observed X-ray spectral evolution is that the IC power-law slope remains roughly constant during the flux variations, but the amount of contamination from the additional soft X-ray component increases at low flux levels, affecting the spectral fitting parameters at higher photon energies ( keV). Note that in such a case the expected gamma-ray variability should be of the same order as the X-ray variability, namely .
We finally note in this context that, as shown in 3.1.2, the previous BeppoSAX data for PKS 0208512 collected during the high state indicated a convex X-ray spectrum, and an excess absorption below keV with a column density of cm-2 exceeding the Galactic value by more than a factor of 5. However, the X-ray photon index was similar to the one implied by our Suzaku observations (). Therefore, the convex spectrum observed by BeppoSAX may reflect an intrinsic shape of the IC emission involving the low-energy cut-off in the electron energy distribution around , as expected in the EC/BLR model (Tavecchio et al. 2007), which is only diluted during the low-activity states due to the presence of an additional soft X-ray spectral component.
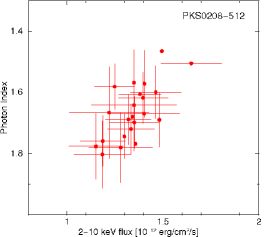
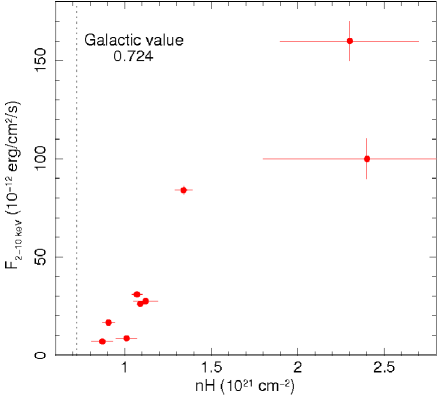
Similar trend has been observed in 3C 454.3. To illustrate this, in Figure 8 we selected the data which have a similar power-law slope () and plotted the absorption column versus keV flux densities derived from the Chandra (Villata et al. 2006), Swift (Giommi et al. 2006), XMM-Newton (Raiteri et al. 2007, 2008), and Suzaku (this work) observations. We can see that there is a trend of increasing the absorption value with source brightness, as previously reported by Raiteri et al. (2007; 2008). These results may again be explained by the soft excess emission being more important when the source gets fainter, and becoming almost completely “hidden” behind the hard X-ray power-law when the source gets brighter.
From the spectral fitting of the Suzaku data, we showed in 3.1.2 that the soft X-ray excess may be represented either by a steep power-law () or a blackbody-type emission ( keV). Since the synchrotron peak of each source is located around optical photon energies (see Figure 7), the high-energy synchrotron tail may possibly account for the observed soft X-ray excess emission, especially if being modified by the Klein-Nishina effects (see the discussion in Sikora et al. 2009 and Kataoka et al. 2008). On the other hand, the bulk-Compton spectral component produced by Comptonization of the UV accretion disk by cold electrons in the innermost parts of relativistic jets (e.g., Begelman & Sikora 1987) is a natural explanation for the apparent soft X-ray excess component.
5 Conclusions
We have presented the observations and analysis of the data for the -ray-loud blazars, PKS 0208512, Q 0827+243, PKS 1127145, PKS 1510089, and 3C 454.3, obtained with the Suzaku, Swift UVOT and Fermi LAT. Observations were conducted between 2008 October and 2009 January. These observations allowed us to construct broadband spectra of the sources in the low -ray activity state, covering optical to GeV photon energy range. Our results are as follows:
-
1.
The X-ray spectra of five FSRQs are well represented by an absorbed hard power-law model (). For PKS 0208512, PKS 1127145, and 3C 454.3, the fitted absorption column is larger than the Galactic value (but we note that the “excess absorption” is not a unique representation of X-ray spectra of those blazars). Compared with previous X-ray observations, we see a trend of increasing apparent X-ray absorption column with increasing high-energy luminosity of the source.
-
2.
Suzaku observations reveal spectral evolution of the X-ray emission: the X-ray spectrum becomes harder as the source gets brighter. Such spectral changes are most likely due to the underlying and steady low-energy spectral component which becomes prominent when the inverse-Compton emission gets fainter. This soft X-ray excess can be explained as a contribution of the high-energy tail of the synchrotron component, or bulk-Compton radiation.
-
3.
We adopt the location of the blazar emission region to be outside of the immediate vicinity of the accretion disk but within the BLR, and within the context of this model, we find that the contribution of the synchrotron self-Compton process to the high-energy radiative output of FSRQs is negligible even in their low-activity states.
-
4.
We argue that the difference between the low- and high-activity states in luminous blazars is due to the different total kinetic power of the jet, most likely related to varying bulk Lorentz factor of the outflow within the blazar emission zone.
References
- (1) Abdo, A. A., et al. 2009a, ApJS, 183, 46
- (2) Abdo, A. A., et al. 2009b, ApJ, 700, 597
- (3) Abdo, A. A., et al. 2009c, ApJ, 699, 31
- Abd (10) Abdo, A. A., et al. 2010, ApJ, 710, 1271
- Ama (06) Amato, E., & Arons, J. 2006, ApJ, 653, 325
- Atw (09) Atwood, W. B., et al. 2009, ApJ, 697, 1071
- Bar (05) Barthelmy, S. D., et al. 2005, Space Sci. Rev., 120, 143
- Bla (00) Błażejowski, M., Sikora, M., Moderski, R., & Madejski, G. M. 2000, ApJ, 545, 107
- (9) Błażejowski, M., Siemiginowska, A., Sikora, M., Moderski, R., & Bechtold, J. 2004, ApJ, 600, L27
- Bur (05) Burrows, D. N., et al. 2005, Space Sci. Rev., 120, 165
- Bec (01) Bechtold, J., Siemiginowska, A., Aldcroft, T. L., Elvis, M., & Dobrzycki, A. 2001, ApJ, 562, 133
- (12) Begelman, M. C., & Sikora, M. 1987, ApJ, 322, 650
- Car (89) Cardelli, J. A., Clayton, G. C., & Mathis, J. S. 1989, ApJ, 345, 245
- Cel (07) Celotti, A., Ghisellini, G., & Fabian, A. C. 2007, MNRAS, 375, 417
- (15) Dermer, C. D., & Schlickeiser, R. 1993, ApJ, 416, 458
- (16) Dickey, J. M., & Lockman, F. J. 1990, ARA&A, 28, 215
- (17) Donato, D., Sambruna, R. M., & Gliozzi, M. 2005, A&A, 433, 1163
- (18) Donnarumma, I., et al. 2010, submitted to ApJ
- (19) Edelson, R., Griffiths, G., Markowitz, A., Sembay, S., Turner, M. J. L., Warwick, R. 2001, ApJ, 554, 274
- Fos (06) Foschini, L., et al. 2006, A&A, 453, 829
- Fuk (06) Fukazawa, Y., et al. 2006, Proc.SPIE, 6266, 75
- (22) Ghisellini, G., Celotti, A., Fossati, G., Maraschi, L., & Comastri, A. 1998, MNRAS, 301, 451
- (23) Ghisellini, G., Tavecchio, F., & Ghirlanda, G. 2009, arXiv:0906.2195
- Gio (06) Giommi, P., et al. 2006, A&A, 456, 911
- (25) Hill, J., et al. 2004, APS, 10005H
- (26) Hoshino, A., Arons, J., Gallant, Y. A., & Langdon, A. B. 1992, ApJ, 390, 454
- Har (99) Hartman, R. C., et al. 1999, ApJS, 123, 79
- Jor (04) Jorstad, S. G., & Marscher, A. P. 2004, ApJ, 614, 615
- Kat (00) Kataoka, J., et al. 1999, ApJ, 514, 138
- kat (08) Kataoka, J., et al. 2008, ApJ, 672, 787
- Kok (07) Kokubun, M. et al. 2007, PASJ, 59, S53
- Koy (07) Koyama, K. et al. 2007, PASJ, 59, S23
- Mar (92) Maraschi, L., Ghisellini, G., and Celotti, A. 1992, ApJ, 397, L5
- Mit (07) Mitsuda, K. et al. 2007, PASJ, 59, S1
- (35) Moderski, R., Sikora, M., Madejski, G. M., & Kamae, T. 2004, ApJ, 611, 770
- Muk (99) Mukherjee, R. et al. 1999, ApJ, 527, 133
- Mur (96) Murphy, E. M., Lockman, F. J., Laor, A., & Elvis, M. 1996, ApJS, 105, 369
- Rai (07) Raiteri, C. M., et al. 2007, A&A, 473, 819
- Rai (08) Raiteri, C. M., et al. 2008, A&A, 491, 755
- Rom (05) Roming, P. W. A., et al. 2005, Spacs Sci. Rev., 120, 95
- Poo (08) Poole, T. S., et al. 2008, MNRAS, 383, 627
- sam (97) Sambruna, R. M., et al. 1997, ApJ, 474, 639
- (43) Sambruna, R. M., Gliozzi, M., Tavecchio, F., Maraschi, L., & Foschini, L. 2006, ApJ, 652, 146
- Ser (07) Serlemitsos, P. J., et al. 2007, PASJ, 59, S9
- (45) Sikora, M., Begelman, M. C., & Rees, M. J., 1994, ApJ, 421, 153
- (46) Sikora, M., & Madejski, G. M. 2000, ApJS, 534, 109
- (47) Sikora, M., Moderski, R., & Madejski, G. M. 2008, ApJ, 675, 71
- (48) Sikora, M., Stawarz, Ł., Moderski, R., Nalewajko, K., & Madejski, G. 2009, ApJ, 704, 38
- (49) Sokolov, A., & Marscher, A.P. 2005, ApJ, 629, 52
- Tak (07) Takahashi, T. et al. 2007, PASJ, 59, S35
- (51) Tavecchio, F., et al. 2000, ApJ, 543, 535
- Tav (02) Tavecchio, F., et al. 2002, ApJ, 575, 137
- Tav (07) Tavecchio, F., Maraschi, L., Ghisellini, G., Kataoka, J., Foschini, L., Sambruna, R. M., & Tagliaferri, G. 2007, ApJ, 665, 980
- (54) Tavecchio, F., & Ghisellini, G. 2008, MNRAS, 386, 945
- Tho (93) Thompson, D. J., et al. 1993, ApJS, 86, 629
- Vil (06) Villata, M., et al. 2006, A&A, 453, 817