11email: luzma; ckehrig; mmroth; pweilbacher@aip.de 22institutetext: Instituto de Astrofísica de Canarias, E-38200 La Laguna, Tenerife, Spain and Departamento de Astrofísica, Universidad de la Laguna, E-38205, La Laguna, Tenerife, Spain
22email: nicola.caon; czurita@iac.es
Mapping the properties of blue compact dwarf galaxies:
Abstract
Context. Blue compact dwarf (BCD) galaxies are low-luminosity, low-metal content dwarf systems undergoing violent bursts of star formation. They present a unique opportunity to probe galaxy formation and evolution and to investigate the process of star formation in a relatively simple scenario. Spectrophotometric studies of BCDs are essential to disentangle and characterize their stellar populations.
Aims. We perform integral field spectroscopy of a sample of BCDs with the aim of analyzing their morphology, the spatial distribution of some of their physical properties (excitation, extinction, and electron density) and their relationship with the distribution and evolutionary state of the stellar populations.
Methods. Integral field spectroscopy observations of the sample galaxies were carried out with the Potsdam Multi-Aperture Spectrophotometer (PMAS) at the 3.5 m telescope at Calar Alto Observatory. An area in size was mapped with a spatial sampling of . We obtained data in the 3590–6996 Å spectral range, with a linear dispersion of 3.2 Å per pixel. From these data we built two-dimensional maps of the flux of the most prominent emission lines, of two continuum bands, of the most relevant line ratios, and of the gas velocity field. Integrated spectra of the most prominent star-forming regions and of whole objects within the FOV were used to derive their physical parameters and the gas metal abundances.
Results. Six galaxies display the same morphology both in emission line and in continuum maps; only in two objects, Mrk 32 and Tololo 1434+032, the distributions of the ionized gas and of the stars differ considerably. In general the different excitation maps for a same object display the same pattern and trace the star-forming regions, as expected for objects ionized by hot stars; only the outer regions of Mrk 32, I Zw 123 and I Zw 159 display higher [S ii]/H values, suggestive of shocks. Six galaxies display an inhomogeneous dust distribution. Regarding the kinematics, Mrk 750, Mrk 206 and I Zw 159 display a clear rotation pattern, while in Mrk 32, Mrk 475 and I Zw 123 the velocity fields are flat.
Key Words.:
galaxies: starburst - galaxies: dwarf - galaxies: stellar content - galaxies: abundances1 Introduction
Blue compact dwarf (BCD) galaxies are narrow emission-line objects, which undergo at the present time violent bursts of star formation (Sargent & Searle 1970). They are compact and low-luminosity objects (starburst diameter kpc; mag), with a low-metal content () and high star-forming (SF) rates, able to exhaust their gas content on a time scale much shorter than the age of the Universe. Initially it was hypothesized that BCDs were truly young galaxies, forming their first generation of stars (Sargent & Searle 1970; Lequeux & Viallefond 1980; Kunth et al. 1988), but the subsequent detection of an extended redder stellar host galaxy in the vast majority of them has shown that most BCDs are actually old systems (Loose & Thuan 1986; Telles 1995; Papaderos et al. 1996; Cairós et al. 2001a, b, 2002, 2003) undergoing recurrent star-formation episodes (Thuan 1991; Mas-Hesse & Kunth 1999).
These galaxies present a unique opportunity to gain insights on central issues in contemporary galaxy research. Chemically unevolved nearby SF dwarfs like BCDs are an important link to the early Universe and the epoch of galaxy formation, as they have been regarded as the local counterparts of the distant subgalactic units (building blocks) from which larger systems are created at high redshifts (Kauffmann et al. 1993; Lowenthal et al. 1997); the study of these systems hence provides important insights into the star-formation process of distant galaxies. Moreover, even though most BCDs are not genuinely young galaxies, their metal deficiency makes them useful objects to constrain the primordial 4He abundance and to monitor the synthesis and dispersal of heavy elements in a nearly pristine environment (Pagel et al. 1992; Masegosa et al. 1994; Izotov et al. 1997; Kunth & Östlin 2000). Blue compact dwarfs are also ideal laboratories for the study of the starburst phenomenon: as they are smaller and less massive than normal galaxies, they cannot sustain a spiral density wave and do not suffer from disk instabilities, which considerably simplifies the study of the star formation process. Besides, the radiation emitted by their SF regions is less diluted by the stellar continuum than in giant spiral galaxies, allowing for more precise studies of element abundance ratios.
However, and in spite of the great effort done during the last two decades on the field of BCDs, fundamental questions like the mechanisms responsible for the ignition of their starburst, their evolutionary status or their SF histories are still far from well understood.
To answer these questions it is of paramount importance to first disentangle and characterize the different components that make up a BCD galaxy. This is a demanding and difficult task. At any location in the galaxy, the emitted flux is the sum of the emission from the local starburst, the flux produced by the nebula surrounding the young stars, and the emission from the underlying, old stellar population, all possibly modulated by dust (Cairós et al. 2002, 2003, 2007). Substantial work in the field has shown that photometry alone does not allow us to distinguish the different components in BCDs (see Kunth & Östlin 2000; Cairós et al. 2002). The properties of the SF knots in the same galaxy may vary widely: accounting for the flux in emission lines through broad-band filters and for the contribution of the stellar host is fundamental to derive the actual broad-band colors of the knots (Cairós et al. 2002, 2007). On the other hand, the dust content (usually assumed to be negligible in BCDs) turned out to be quite significant in several objects (Hunt et al. 2001; Cairós et al. 2003; Vanzi & Sauvage 2004).
The few spectrophotometric studies performed so far have shown indeed that they are the right way to tackle the problem: combining high resolution broad- and narrow-band images with high-quality spatially resolved spectra does allow us to distinguish the young stars from the older stars, derive the history of the SF knots and constrain the evolutionary status of BCDs (Cairós et al. 2002; Guseva et al. 2003a, b, c; Cairós et al. 2007). That very few spectrophotometric analyses can be found in the literature, and virtually all of them focused on one single object, is essentially due to the large amount of observing time that conventional observational techniques require. Acquiring images in several broad-band and narrow-band filters, plus a sequence of long-slit spectra sweeping the region of interest translates into observing times of two or more nights per galaxy. Thus comprehensive analysis of a statistically meaningful sample of BCDs based on traditional imaging and spectroscopic techniques are in terms of observing time just not feasible. Moreover, these observations usually suffer from varying instrumental and atmospheric conditions, which makes combining all these data complicated. Long-slit spectroscopy has also the additional problem of the uncertainty on the exact location of the slit.
On the other hand, it has been recently shown (Izotov et al. 2006; García-Lorenzo et al. 2008; Kehrig et al. 2008; Vanzi et al. 2008; Lagos et al. 2009; James et al. 2009) that the state-of-the-art observational technique of integral field spectroscopy (IFS) offers an alternative way to approach BCDs studies in a highly effective manner. IFS provides simultaneous spectra of each spatial resolution element under identical instrumental and atmospheric conditions. This is not only a more efficient way of observing, but it also guarantees the homogeneity of the dataset. In terms of observing time, IFS observations of BCDs are one order of magnitude more efficient than traditional observing techniques. This implies that now, for the first time, spectrophotometric studies of substantial samples of BCD galaxies have become feasible.
Consequently, we have undertaken a long-term project, which aims to map an extensive and representative sample of BCDs by means of IFS. This galaxy sample, composed of about 40 objects, has been chosen so as to span the large range in luminosities and morphologies found among the galaxies classified as BCDs. The analysis of such a dataset will allow us to get insights into basic questions of BCDs research, i.e. how to effectively disentangle the old and young stellar populations, set constraints of the age and SF history of the galaxies, study the triggering and propagation mechanisms of the star formation and investigate the metal abundance patterns.
In the first two papers of this series (Cairós et al. 2009a, b), we illustrated the full potential of this study by showing results on two representatives BCDs, Mrk 1418 and Mrk 409, both observed with the Potsdam multi-aperture spectrophotometer (PMAS), attached at the 3.5m telescope at Calar Alto Observatory. In this paper, the remaining objects observed with PMAS are studied. The whole sample will be analyzed in a series of future publications.
This paper is structured as follows: In Sect. 2 we describe the observations, the data reduction process and the method employed to build the maps. In Sect. 3 we present the main results of the work, that is, the flux, emission line and velocity maps, as well as the results derived from the analysis of the integrated spectra of the selected galaxy regions. These results are discussed in Sect. 4 and summarized in Sect. 5.
2 Observations and data reduction
2.1 The galaxy sample
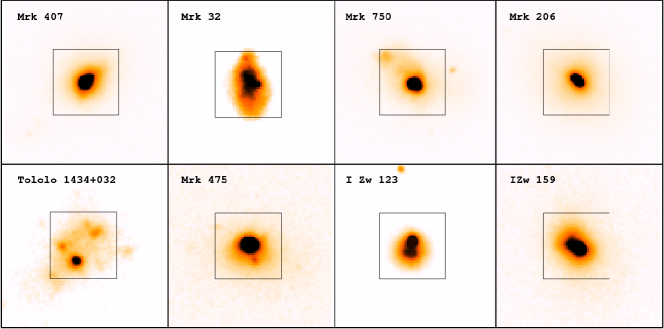
We present and analyze data of eight galaxies, all of them previously classified as BCDs. All objects except Tololo 1434+032 are included in the Thuan & Martin (1981) BCD list, while Tololo 1434+032 appears cataloged as a BCD in Gil de Paz et al. (2003).
Although strictly speaking one of the criteria that a galaxy has to fulfill to be classified as BCD is to have , it is worth mentioning that most BCDs studies (Thuan & Martin 1981; Papaderos et al. 1996; Cairós et al. 2001a, b; Bergvall & Östlin 2002; Kong & Cheng 2002; Gil de Paz et al. 2003) include a relatively high fraction of galaxies with luminosities higher than this limit. Indeed, in practice the term BCD designates a set of objects that have a very wide range in properties as luminosities (), morphologies or chemical abundances (Kunth & Östlin 2000; Cairós et al. 2001b).
We focus on objects that fall strictly within the dwarf galaxy regime; these systems, which tend to be also the more compact and more regular BCDs, are best suited to be observed with PMAS, as their small size makes it possible to map the whole starburst region in only one exposure.
The basic data for the sample galaxies are listed in Table 1. The g-band SDSS images of the sample of galaxies are shown in Fig. 1.
| Galaxy | R.A. | Decl. | ||||
|---|---|---|---|---|---|---|
| (J2000) | (J2000) | (Mpc) | (mag) | (mag) | ||
| Mrk 407 | 09 47 47.6 | +39 05 04 | 27.2 | 0.069 | ||
| Mrk 32 | 10 27 02.0 | +56 16 14 | 16.4 | 0.030 | ||
| Mrk 750 | 11 50 02.7 | +15 01 24 | 05.2 | 0.175 | ||
| Mrk 206 | 12 24 17.0 | +67 26 24 | 24.3 | 0.071 | ||
| Tololo 1434+032 | 14 37 08.9 | +03 02 50 | 29.2 | 0.149 | ||
| Mrk 475 | 14 39 05.4 | +36 48 22 | 11.9 | 0.052 | ||
| I Zw 123 | 15 37 04.2 | +55 15 48 | 15.4 | 0.062 | ||
| I Zw 159 | 16 35 21.0 | +52 12 53 | 43.8 | 0.125 |
Notes: R.A., Decl., and taken from the NED (http://nedwww.ipac.caltech.edu/). Distances were computed using a Hubble constant of 73 km s-1 Mpc-1 and taking into account the influence of the Virgo Cluster, the Great Attractor and the Shapley supercluster. taken from HyperLeda (http://leda.univ-lyon1.fr/; Paturel et al. 2003) and computed from the tabulated values of and .
2.2 Observations
Observations were carried out in 2007 March with the PMAS instrument, attached at the 3.5m telescope in the Observatorio Astronómico Hispano Alemán Calar Alto (CAHA). PMAS is an integral field spectrograph, with a lens array of square elements, each in size in the configuration used, connected to a bundle of 256 optical fibers; the fibers are re-arranged to form a pseudoslit in the focal plane of the spectrograph. The final spectrum is thus composed of 256 spaxels, where by “spaxel” we refer to each element of the 16 x 16 fiber matrix. For a detailed description of the instrument see Roth et al. (2005) and Kelz et al. (2006).
A grating with 300 grooves per mm was used during the observations in combination with a SITe ST002A 2K 4K CCD detector. This setup provides a spectral range of 3590–6996 Å, with a linear dispersion of 3.2 Å per pixel (the CCD was binned in both the spatial and the spectral directions).
Calibration frames were taken before and after the exposures of each galaxy. The calibrations consist of spectra of emission line lamps (HgNe lamp), which are required to perform the wavelength calibration, and spectra of a continuum lamp, necessary to locate the 256 individual spectra on the CCD and to perform the flat-fielding correction. Sky exposures were also obtained, moving the telescope typically several arcmin from the target position. Bias and sky-flats exposures were taken at the beginning and at the end of every night. The spectrophotometric standard stars BD+75325 and BD+332642 were also observed every night. The seeing ranged between 1.2 and 2 arcsec.
A complete log of the observations is provided in Table 2.
| Galaxy | Exposure time | airmass | Seeing |
|---|---|---|---|
| (s) | (arcsec) | ||
| Mrk 407 | 6900 | 1.14–1.01 | 1.4–1.8 |
| Mrk 32 | 6600 | 1.06–1.09 | 1.4–1.5 |
| Mrk 750 | 5400 | 1.20–1.09 | 1.9–2.0 |
| Mrk 206 | 6900 | 1.25–1.16 | 1.5–2.0 |
| Tololo 1434+032 | 6600 | 1.33–1.21 | 1.5–1.8 |
| Mrk 475 | 8400 | 1.03–1.18 | 1.5–1.9 |
| I Zw 123 | 3900 | 1.23–1.05 | 1.8–2.0 |
| I Zw 159 | 5100 | 1.09–1.04 | 1.6–1.8 |
2.3 Data reduction
Although several dedicated software packages have been developed in the last years to reduce 3D-spectroscopic data (Becker 2002; Sánchez 2006), we decided to process our data using standard IRAF111IRAF is distributed by the National Optical Astronomy Observatories, which are operated by the Association of Universities for Research in Astronomy, Inc., under cooperative agreement with the National Science Foundation. tasks. While using IRAF routines has, with respect to the use of dedicated pipelines, the main drawback of requiring a considerable amount of interactive work, which makes the whole process somewhat slower, it has on the other hand the advantage of allowing a complete and precise control of all the parameters involved in each data-reduction step.
The reduction procedure includes the bias subtraction, image trimming, tracing and extraction of the individual spectra, wavelength and distortion calibrations, flat-fielding, combination of the individual galaxy frames, sky-subtraction and flux calibration.
The first step in the data reduction was the bias subtraction. All the bias exposures were averaged to obtain a master bias, which was then subtracted from the rest of the frames. Bad columns were interpolated with the IRAF task fixpix.
Next, apertures were defined and traced on the detector. Defining the apertures means to identify on the detector the spectra produced by the different fibers (that is, to find out how many and which pixels on the detector correspond to each fiber). The apertures are affected by the field distortions and/or by the optics of the system, and therefore each aperture does not line up along the dispersion axis, but has a clear curvature. Hence, after we have defined the apertures at a given spectral position, each of these loci must be traced along the spectral direction.
Apertures were defined on well exposed continuum frames with the IRAF task apall; the task first finds the centers of each fiber (the emission peaks) along the spatial axis at some specified position, and then asks for the size of the extraction window, which we set to 6.4 pixels (the best compromise between including as much signal as possible without contamination by nearby fibers). The apertures were then traced by fitting a polynomial to the centroid along the dispersion axis. A fifth degree Legendre polynomial was found to provide good fits, with a typical RMS of about 0.01 pixels.
Once the apertures were defined and traced in the continuum frames, we again used apall to extract them in all the images. The extraction consists of summing the pixels along the spatial direction into a final one-dimensional spectrum. After that, we had the so-called “collapse” or “row-stacked” spectra: an image , where is the number of pixels in the dispersion direction, and is the number of fibers (256 for PMAS).
Afterwards we performed the wavelength calibration and the dispersion correction. In order to calibrate in wavelength we used the tasks identify and reidentify: i) first, in the comparison spectra (arc) we identified several emission features of a known wavelength in a reference fiber; ii) second, a polynomial was fitted across the dispersion direction; the standard deviation (RMS) of the polynomial fit gives an estimate of the uncertainty in the wavelength calibration. We obtained typical RMS of about 0.01 Å by fitting a fifth degree polynomial. iii) next, with reidentify we identified the emission lines in all the remaining fibers of the arc frame, using the selected one as a reference.
Because of instrumental flexures, there are significant shifts (by up to two pixels) along both the spatial and the spectral directions, even among a sequence of consecutive exposures of the same object. Spatial shifts can be taken care of by measuring the offset between the brightest fiber spectra in the galaxy spectrum and in the corresponding continuum, and applying the correction in apall.
As for the wavelength shifts, first we determined that these shifts were independent of the wavelength itself by comparing arc spectra taken at different times and telescope positions. We also assessed that the relation between pixel coordinate and wavelength were essentially linear, with negligible deviations from linearity.
Then, in each sequence of spectra of a same target we measured the shift in pixel on the spectral axis of the bright sky line at 5577 Å, relative to the first spectrum of the sequence. The transformation in wavelength was done with the task dispcor, by slightly modifying the starting and ending wavelengths so that , where is the starting wavelength, is the starting wavelength of the reference spectrum, is the shift along the spectral direction, in pixels, and is the actual dispersion of the spectra. In this way the sky line ends up at exactly the same position (within a few hundredths of pixels), which ensures that all the wavelength-calibrated spectra of the same object are at the same zeropoint.
The wavelength calibrated data were corrected for response (detector pixel sensitivity variations as well as wavelength-dependent variations in the fibers transmission curves) by using the wavelength-calibrated continuum frames, and for throughput (variations in the whole responsivity of the lenslets and fibers) by using the sky-flat exposures. Both steps were carried out simultaneously by running the task msrep1.
After that the individual galaxy frames were corrected for atmospheric extinction (adopting the “summer extinction coefficients” published by Sánchez et al. 2007) and combined with the task imcombine. The sky was subtracted from the final combined frame. For each object we took an offset sky exposure of a shorter duration (typically 5 minutes). Sky spectra were processed in the same way as galaxy spectra. A one-dimensional sky spectrum was produced by averaging the signal along the spatial direction with a sigma-clipping algorithm. The flux of the three to four brightest sky lines was measured in both the final sky spectrum and in the final galaxy spectrum to determine the appropriate scaling factor (with an accuracy of a few percents) by which to multiply the sky spectrum before subtracting it from the galaxy spectrum.
Because the relative intensity of different sky lines varies noticeably on short time scales (Patat 2003), it is very difficult to find a scaling factor that applies equally well to all the sky lines and the sky continuum, and some fine tuning is required. The final scale factor was found by trial and error; we aimed at a value that minimized overall residuals in the sky lines (especially those close to galaxy emission or absorption lines) even if it left large residuals in sky bright lines that were not affecting any interesting spectral features.
We must say here that minimizing sky-line residuals does not necessarily imply the best match between the sky background in the sky exposure and the sky background in the galaxy exposure. For this reason the uncertainties on the sky-subtracted galaxy continuum may be relatively large (and difficult to estimate), especially in the outer regions of galaxies. While this does not at all affect the emission-line parameters (flux, width, redshift), it can clearly have a significant impact on the equivalent widths of the less luminous SF knots and on the outer, fainter spaxels in the continuum maps.
Spectra of spectrophotometric standards were reduced in the same way, except that the sky spectrum to be subtracted was computed with the median of the outermost fibers. The integrated spectrum of the spectrophotometric standards was obtained by summing all the fibers within a radius of about 2 FWHM (typically 3 to 4 arcsec) from the fiber with the highest signal. The IRAF tasks standard and sensfunc were used to derive the sensitivity curves, after combining the data for the different spectrophotometric stars observed in the same night.
By comparing the sensitivity curves for different nights and stars in this same observing run, we can estimate that the relative uncertainty on the calibration factor is generally equal or less than 2%, except blueward of 4000 Å, where the curve shows a marked change of slope and the uncertainty increases to about 8%.
No corrections for differential atmospheric refraction (DAR) have been applied to our data. For the object observed at the highest airmass (Tololo 1434+032, airmass ), the differential shift between the bluest and the reddest wavelength in our spectral range, measured on our data, is less than 1 arcsec (the shift between the H and the H lines is about 0.3 arcsec). Given the PMAS spaxel size of 1 square arcsec, the seeing , and the fact that the diagnostic line ratios we compute involve emission lines very close to each other in wavelength, we can safely ignore DAR effects.
2.4 Emission line fit
In order to measure the relevant parameters of the emission lines (position, flux and width), they were fitted by a single Gaussian. The fit was carried out by the chi square minimization algorithm implemented by C. B. Markwardt in the mpfitexpr IDL library222URL: http://cow.physics.wisc.edu/ craigm/idl/idl.html. The H line, where an absorption component was present, was fitted by two Gaussians.
The continuum (typically 30–50 Å on both sides) was fitted by a straight line. Lines in a doublet were fitted imposing that they have the same redshift and width.
Criteria like flux, error on flux, velocity and width were used to do a first automatic assessment of whether to accept or reject a fit. For instance, lines with too small (less than the instrumental width) or too large widths were flagged as rejected, as well as lines with a relative error on the flux of more than about 10% (the exact limits depend on the specific line and on the overall quality of the spectrum). These criteria were complemented by a visual inspection of all fits, which led to override in a few cases the automated criteria decision (either accept a fit flagged as rejected, or viceversa).
2.5 Creating the 2D maps
Emission-line maps were constructed in the following way: the emission-line fit-procedure gives for each line and for each line parameter (for instance flux) a table with the fiber ID number, the measured value and the acceptance/rejection flag. This table was then used to produce a 2D map, by using an IRAF script that takes advantage of the fact that PMAS fibers are arranged in a regular 16x16 matrix. The script automatically converts ADU counts into flux (erg s-1 cm-2) by multiplying by a wavelength dependent conversion factor computed by using the sensitivity curve described above.
Continuum maps were obtained by summing the flux within specific wavelength intervals, selected so as to avoid emission lines or strong residuals from the sky spectrum subtraction.
Line ratio maps were simply derived by dividing the corresponding flux maps.
3 Results
3.1 Intensity maps
IFS data provide within the field of view (FOV) of the instrument a simultaneous mapping of the galaxy emission in a broad wavelength range. Therefore we can retrieve monochromatic maps at specific wavelengths or co-added maps equivalent to broad- or narrow-band images. We constructed emission-line intensity and continuum maps for the observed galaxies. Results are shown in Figs. 2–9.
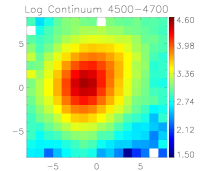
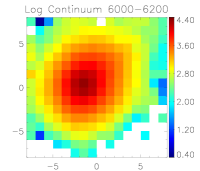
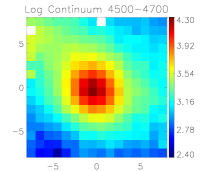
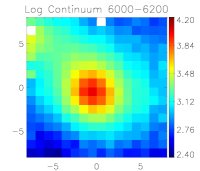
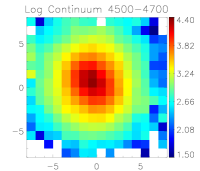
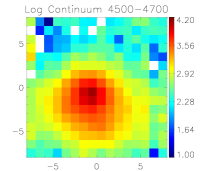
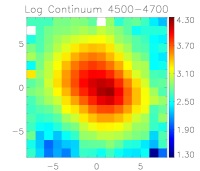
3.1.1 Continuum maps
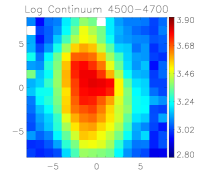
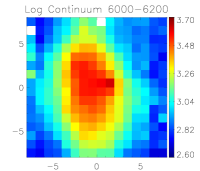
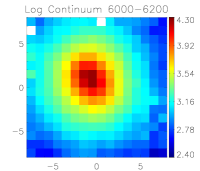
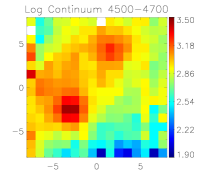
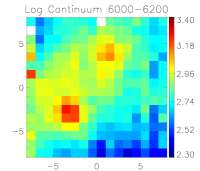
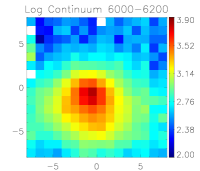
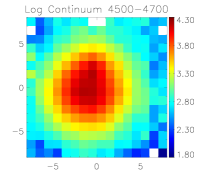
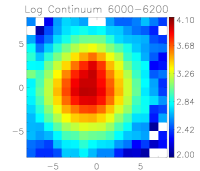
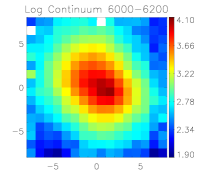
To study the properties of the stellar component, we built continuum maps within selected wavelength intervals free from emission lines (“pure continua”). Figs. 2–9 show the “blue” and “red” continuum maps for the sample galaxies, obtained by integrating the spectrum in the regions 4500–4700 and 6000–6200 Å respectively.
All objects except two show an overall regular morphology in the continuum, with a well defined central peak and roughly circular isophotes. The exceptions are Mrk 750, whose outer isophotes are elongated in the northeast direction, and Tololo 1434+032, which displays a very irregular and clumpy morphology.
3.1.2 Emission line maps
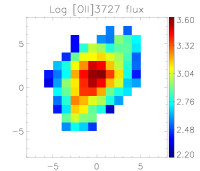
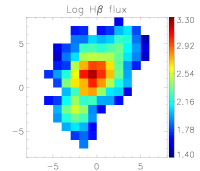
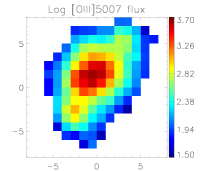
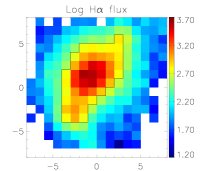
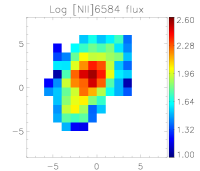
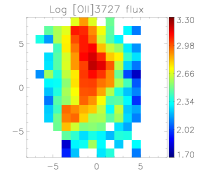
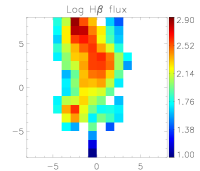
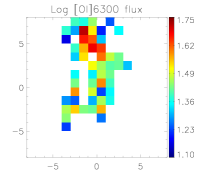
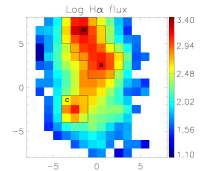
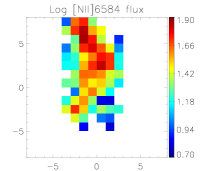
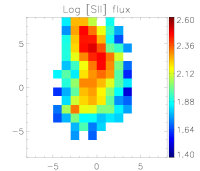
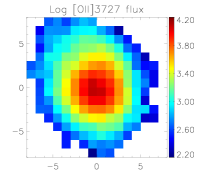
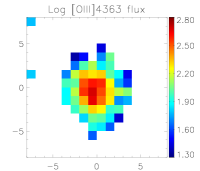
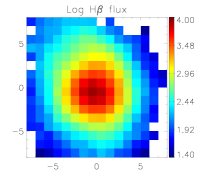
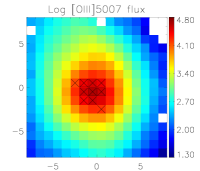
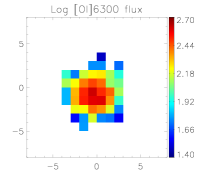
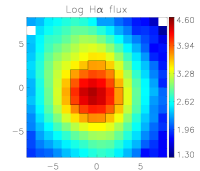
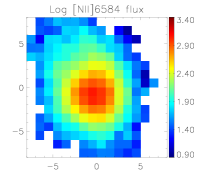
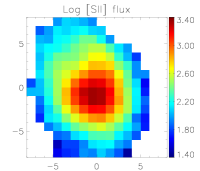
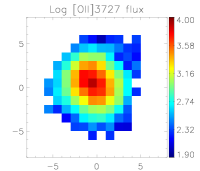
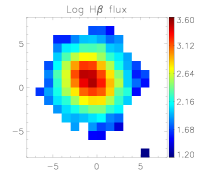
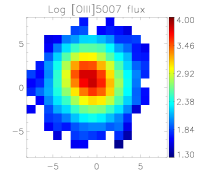
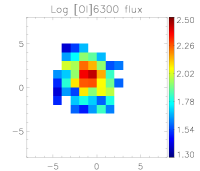
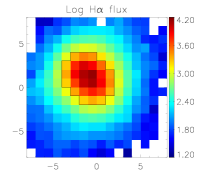
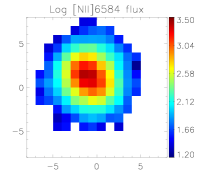
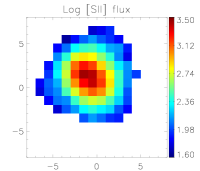
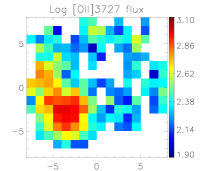
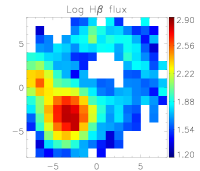
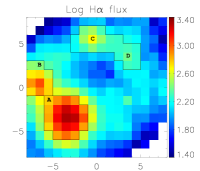
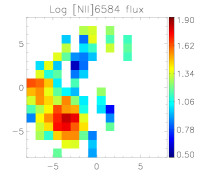
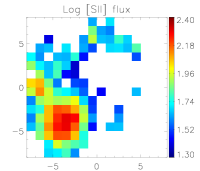
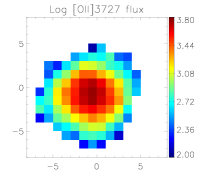
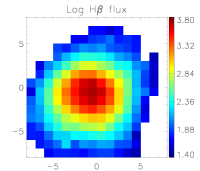
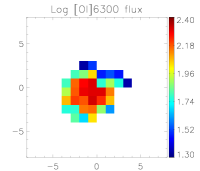
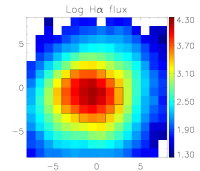
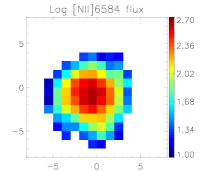
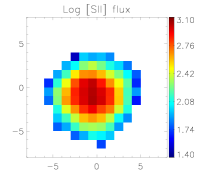
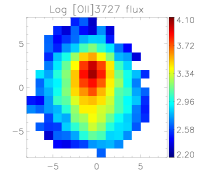
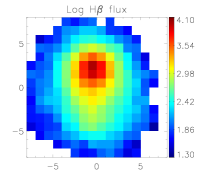
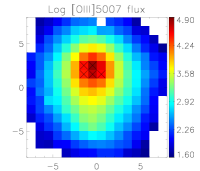
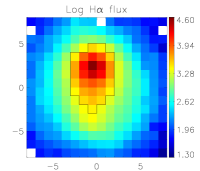
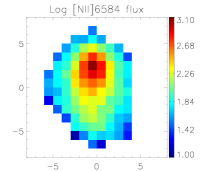
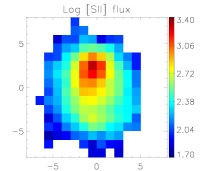
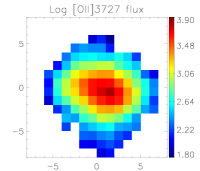
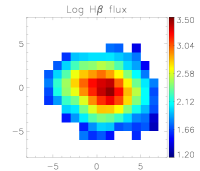
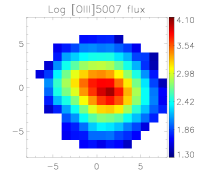
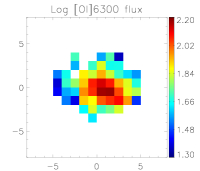
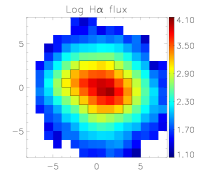
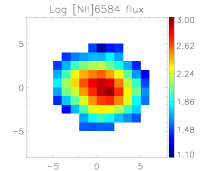
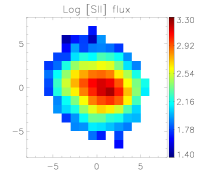
In order to study the ionized gas morphology of the sample galaxies we built continuum-subtracted emission line flux maps for the most prominent emission lines: [O ii] , H, [O iii] , H, [N ii] and [S ii] ).
All the galaxies show a similar morphology in the different emission lines, as expected in objects ionized by stars. Six of the eight galaxies, namely Mrk 407, Mrk 750, Mrk 206, Mrk 475, I Zw 123 and I Zw 159, appear very compact in emission lines and have a single central starburst. In Mrk 32 the starburst is resolved into three smaller SF regions, aligned along a north-south axis, while in Tololo 1434+032 the current star formation activity spreads all over the mapped region.
3.2 Line ratio maps
3.2.1 Ionization sources
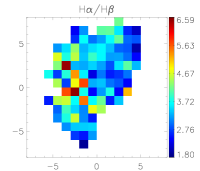
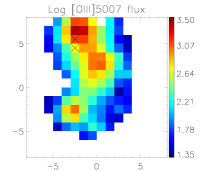
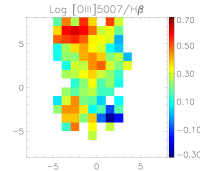
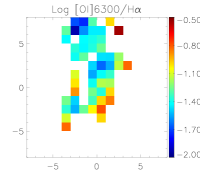
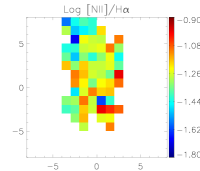
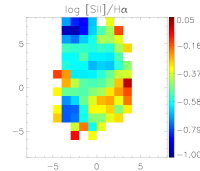
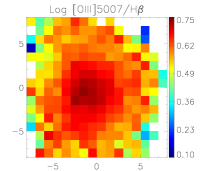
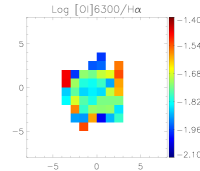
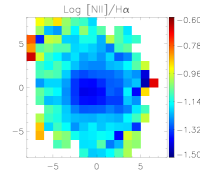
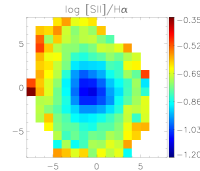
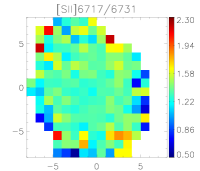
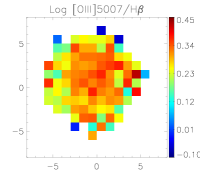
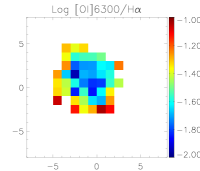
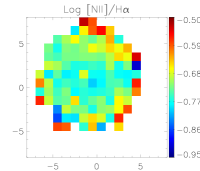
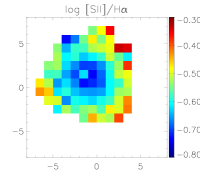
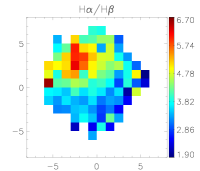
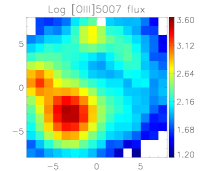
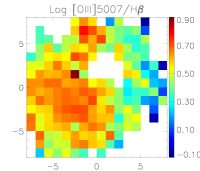
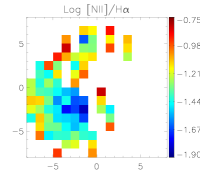
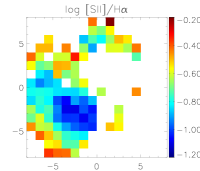
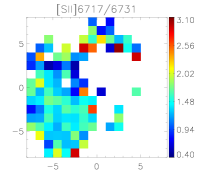
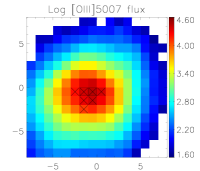
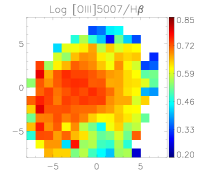
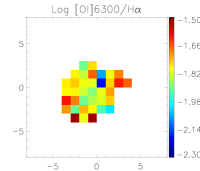
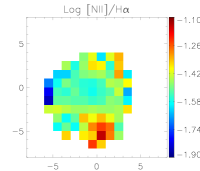
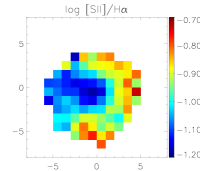
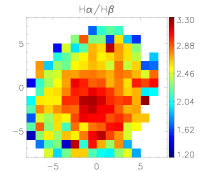
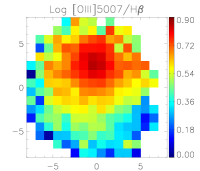
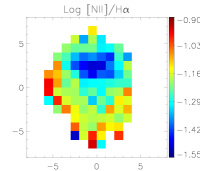
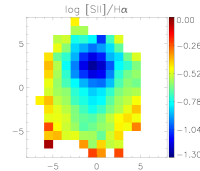
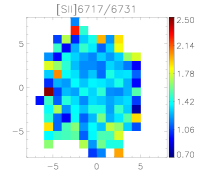
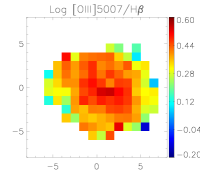
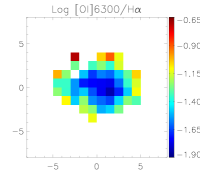
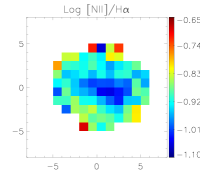
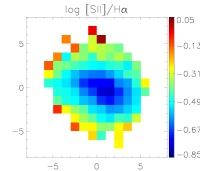
To investigate the excitation mechanisms acting in the galaxies we computed the line ratio maps for [O iii] 5007/H, [N ii] 6584/H, [S ii] /H and, in those cases in which the [O i] 6300 line has a reasonably good signal-to-noise ratio, also for [O i] 6300/H.
High excitation values correspond to high values of the [O iii]/H ratios and to low values of [N ii]/H and [S ii]/H. High values for [O iii]/H are expected when the ionization is produced predominantly by UV photons, especially when the ionization parameter is high. On the other hand, low excitation values can be associated with an ionizing mechanism different from photoionization (Veilleux & Osterbrock 1987).
Excitation maps for the galaxy sample are displayed in Figs. 2–9. All objects show the same pattern in the different ratio maps: they trace the regions of star formation, with [O iii]/H ([N ii]/H, [S ii]/H) peaking (having a minimum) in the SF knots, and decreasing (increasing) with the distance to the center of the region. This is the expected behavior in regions ionized by UV photons coming from massive stars: the metal-to-hydrogen line ratios change as a function of the ionization parameter (), and therefore increasing the distance from the ionization source decreases the value of , lowering the [O iii]/H ratio and increasing the [S ii]/H ratio (Domgorgen & Mathis 1994).
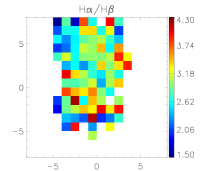
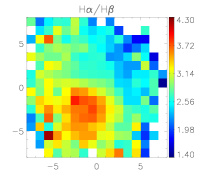
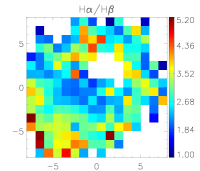
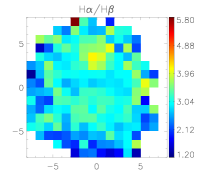
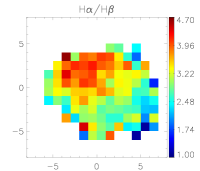
3.2.2 Extinction maps
Interstellar extinction can be probed by comparing the observed ratios of hydrogen recombination lines with their theoretical values (Osterbrock & Ferland 2006). In the optical domain the extinction is derived from the ratio of the different Balmer line series to H. In our case, although the H and H emission lines are usually visible, their weakness and that they are superposed on a strong underlying stellar absorption line make it impossible to obtain reliable measurements of their flux for individual spaxels. Therefore the extinction maps have been derived from the H/H ratio.
For K and electron densities cm-3, the theoretical H/H ratio should be close to 2.86. Because extinction is stronger at H that at H wavelengths, its effect is to increase the observed ratio.
In computing the extinction map, we corrected the H line for underlying stellar absorption by fitting a Gaussian profile to its absorption wings. For the H line, the absence of visible absorption wings makes this decomposition impossible. To account for the H absorption component, several approaches could be adopted in principle. The most popular one is to set the equivalent width of the H absorption, , to the same value as found for H. A second more conservative approach is to set it to some fixed value (for instance 2 Å) or simply to assume that the absorption in H is negligible.
While the first strategy might be appropriate when dealing with with integrated spectra, the relatively high uncertainties on the measurements of makes it unfeasible for a spaxel-to-spaxel correction, thus we adopted here the more conservative approach (setting ). Under this assumption, the computed extinction is actually a lower limit to its actual value.
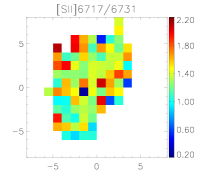
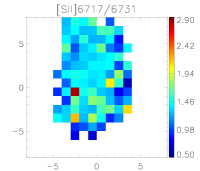
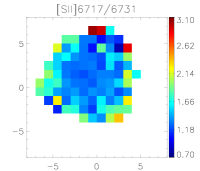
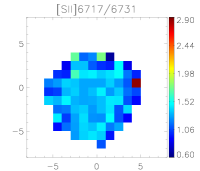
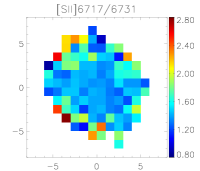
3.2.3 Electron density
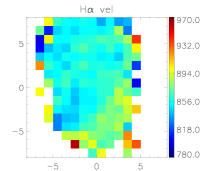
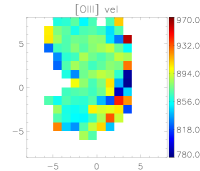
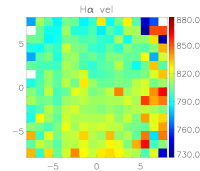
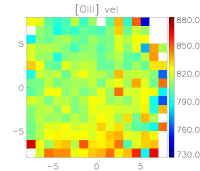
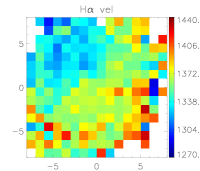
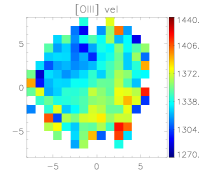
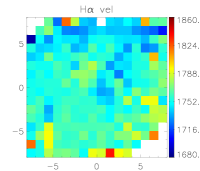
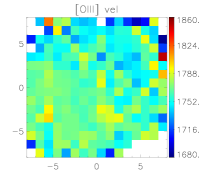
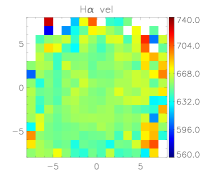
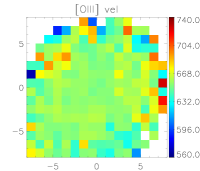
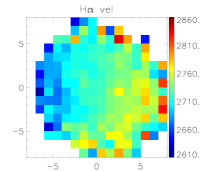
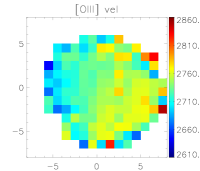
3.3 Kinematics of the ionized gas
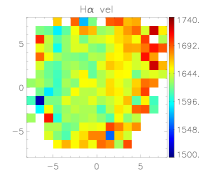
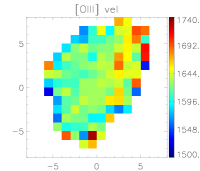
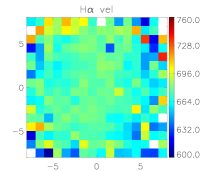
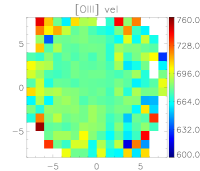
We studied the kinematics of the ionized gas using the [O iii] and H emission lines. We fitted the peak wavelength of the above emission lines with a Gaussian to obtain the radial velocity of the ionized gas at each spaxel. Due to the low spectral resolution of our data (about 6.8 Å FWHM) no reliable velocity dispersion measurements could be obtained.
The velocity fields are shown in Figs. 2–9; in these maps red colors represent redshifts and blue colors blueshifts. The mean uncertainty in the velocity data, estimated from the scatter of velocity maps built on the 5577 Å skyline (which in our spectra has intensities comparable with the H and [O iii] lines in the galaxies brightest parts), is about 10–15 km s-1 in the central regions and increases outwards with decreasing line emission intensity.
3.4 Integrated spectroscopy
In this section we present results of the integrated spectroscopy. For each galaxy we extracted a one-dimensional spectrum of the SF regions in our maps and the integrated spectrum inside the whole mapped FOV. Six galaxies have just one nuclear SF region; only in Mrk 32 and Tololo 1434+032 we identified two or more SF regions.
Because of the heterogeneity of the sample in terms of apparent luminosity, distance, morphology, brightness of the SF regions, and signal-to-noise ratio of the observed spectra, there is no unique, clear-cut criterion for delineating the area of the SF regions. Thus we followed a more pragmatic approach, based on the specific morphology of the SF knots: we integrated within a boundary that follows the shape of the SF knot with a minimum area of square arcsec (that is an equivalent radius of about twice the seeing FHWM). For galaxies with multiple SF knots, the above criterion was relaxed; see the discussion on each individual object (Sect. 4). The SF knots are outlined and labeled in the H maps in Figs. 2–9.
As for the integrated spectrum of a galaxy within the PMAS FOV, in order to not degrade its signal-to-noise ratio unnecessarily by including outer spaxels with no gaseous emission, we only summed those spaxels with measured H emission (that is those shown in the H flux maps).
Figs. 10 and 11 display the spectra of the sample galaxies. In general all spectra are dominated by bright, narrow emission lines, indicating an important contribution of ionizing stars, but with significant differences among the objects: several galaxies display a very high continuum with strong absorption features, whereas some of them show a flat spectrum, characteristic of an OB population. A more detailed description of the spectral characteristics of the individual objects is provided in Sect. 4.
3.4.1 Line fluxes and reddening correction
The higher S/N ratio of the integrated spectra allows us on one hand a more accurate measurement of the Balmer line fluxes, and on the other a more careful and reliable determination of the extinction coefficient.
For each spectrum we measured fluxes and equivalent widths of the emission lines using the Gaussian profile fitting option in the IRAF task splot. In order to obtain reliable values of Balmer fluxes in emission we must take into account the underlying stellar absorption (McCall et al. 1985; Diaz 1988). To do that, we followed two different approaches, depending on the characteristics of the spectra.
When the absorption wings around the Balmer lines were not visible, we assumed that the equivalent width in absorption is the same for all the lines. We first adopted an initial estimate for the absorption equivalent width, EWabs, corrected the measured fluxes, and computed the extinction coefficient (H) through a least-square fit to the Balmer decrement. We then varied the value of EWabs, until we found the one that provided the best match (e.g. the minimum scatter in the fit) between the corrected and the theoretical line ratios. A more detailed description of this method can be found in Izotov et al. (1994) and Cairós et al. (2007).
We adopted the “case B” Balmer recombination decrement for K and cm-3 (Brocklehurst 1971) and the Cardelli et al. (1989) reddening curve.
In those cases where absorption wings around the Balmer lines were visible, we simultaneously fitted an absorption and an emission component. We then applied the same method as before, varying the equivalent width in absorption only in those lines in which it could not be fitted.
In several cases the values of the H and H fluxes are doubtful due to their intrinsic weakness and the large uncertainties in the correction for the underlying stellar absorption. In these cases we computed (H) directly from the H/H ratio: (i) if the absorption in H was fitted, we set ; (ii) if not, following McCall et al. (1985) we set the equivalent width of both lines in absorption to 2 Å.
Reddening-corrected intensity ratios and equivalent widths for the different spatial regions are listed in Tables 3–6.


3.4.2 Physical parameters and abundances
Physical properties and ionic abundances were derived from the reddening-corrected emission line fluxes, following the 5-level atom fivel program in the IRAF nebular package (De Robertis et al. 1987; Shaw & Dufour 1995).
Electron densities were measured from the emission line ratio [S ii]6717/6731; electron temperatures ([O iii]) were derived from the [O iii] 4363/(4959+5007) ratio, in those spectra where [O iii] was measured with high enough S/N. In these cases, [O ii] was calculated from the relation between [O ii] and [O iii] provided in Pilyugin et al. (2006).
We then adopted [O ii] for the calculation of N+, O+ and S+ abundances, and [O iii] for the calculation of O2+ and Ne2+ abundances. We used [Ne iii] to derive the neon abundance, [O ii] and [O iii] for the oxygen abundance, [N ii] for nitrogen abundance and [S ii] for the sulfur abundance. The total neon and nitrogen abundances were obtained as Ne/O = Ne++/O++ and N/O = N+/O+, respectively, and the total oxygen abundance was calculated as O/H = (O+/H+ + O++/H+) .
To obtain oxygen abundances in those knots in which [O iii] could not be measured, we applied the commonly used strong-line method from Pettini & Pagel (2004).
4 Discussion
4.1 Mrk 407
The galaxy Mrk 407 is included in the Petrosian et al. (2007) Atlas of Markarian galaxies, where it appears classified as an S0. , , and NIR surface brightness photometry was published in Cairós et al. (2003), but the quality of these data was insufficient for assessing whether or not this galaxy has an older stellar low surface brightness component underlying the SF regions. The only spectroscopic data available in the literature are its redshift and the equivalent widths and flux ratios of the strongest lines (Ugryumov et al. 1998).
The PMAS FOV covers an area of kpc with a spatial sampling of 130 pc per spaxel. Two-dimensional maps of Mrk 407 are shown in Fig. 2.
Emission line and continuum maps show an overall regular morphology, with the intensity distribution peaking roughly at the center of the outer elliptical isophotes. In the emission line maps the isophotes are elongated along the northwest-southeast axis, whereas in the continuum frames they are of a roughly circular morphology, although in the outer regions they appear slightly distorted and elongated along the northwest-southeast direction — as previously seen in the NIR contour maps published in Cairós et al. (2003).
The excitation maps trace the SF knots, as expected in regions photoionized by stars, with values typical of H ii regions (Veilleux & Osterbrock 1987). The [O iii]/H map also peaks southeast of the central SF region, at the same spatial location as the extinction maximum.
The galaxy has an inhomogeneous extinction pattern, with a dust lane crossing it southwest–northeast, where H/H reaches values of up to 5.5 — which translates into an interstellar reddening of up to 0.6. In the rest of the galaxy, the values of the H/H ratio are closer to the theoretical value of 2.86.
Both the nuclear and the integrated spectra of Mrk 407 display strong emission lines atop a blue continuum, with several absorption features (high order Balmer lines in absorption and pronounced absorption wings in H, H and H; see Fig. 10); the absorption features are indicative of a substantial contribution from older stars. As we could not detect [O iii] , the oxygen abundance was derived from the empirical calibrations. We found a value of , which places Mrk 407 in the high metallicity BCD group.
While the H and [O iii] velocity maps are quite noisy, they both seem to indicate an overall rotation around an axis roughly oriented on the northwest-southeast direction, with a velocity amplitude of about 30–40 km s-1.
4.2 Mrk 32 (= UGCA 211, SBS 1023+565)
With , Mrk 32 is one of the faintest galaxies in our sample. In the Petrosian et al. (2007) Atlas it is classified as an Im/BCD. Broad-band imaging and optical spectroscopy were published in Hunter & Elmegreen (2006) and Hunter & Hoffman (1999), respectively.
The PMAS FOV covers an area of kpc with a sampling of 80 pc per spaxel. Two-dimensional maps of Mrk 32 are shown in Fig. 3.
In the continuum the galaxy shows an overall regular behavior, with elliptical isophotes, much elongated in the north-south direction. Although the intensity distribution clearly increases towards the central regions, there is not a clear peak, but a somehow diffuse maximum, whose position seems to be displaced to the west when moving towards red wavelengths. All the emission-line maps display a similar pattern, with the SF knots roughly aligned in the south-north direction, and all, except [O ii], peak at the northeast knot (A, as labeled in Fig. 3); none of the three SF knots seen in emission-lines coincides with the central intensity peak in the continuum maps.
The excitation maps trace the three SF regions; the maximum in [O iii]/H (the minimum in the other maps) is located in the brightest knot A. Line ratio maps display values typical of H ii regions, aside from the southern regions whose higher values for [O i]/H and [S ii]/H are more characteristic of LINERS/Seyfert galaxies (log[O i]/H , log[S ii]/H ; Veilleux & Osterbrock 1987); this suggests that another mechanism, most probably shocks, is contributing to the gas excitation.
The H/H ratio map displays a noisy pattern, with most of the spaxels showing values close to 2.86; however, several spaxels located in the outer regions and close to knot C have higher values — consistent with the higher reddening values derived for the integrated spectrum of knot C.
We produced the integrated spectrum of knot AB (because of their closeness, knots A and B were lumped together although they seem to be two separate SF regions) and C (whose small size is dictated by the need of keeping it separated from AB), and of the integrated galaxy spectrum. All three spectra are dominated by young stars, with strong emission lines atop a blue continuum; in knot C, and in the integrated spectrum, absorption wings around Balmer lines are detected. We also have a marginal detection of the Wolf-Rayet (WR) bump at Å in the two spaxels marked in Fig. 3. Unfortunately, the S/N ratio of the WR bump is too low for a reliable measurement of its flux.
We found a low interstellar extinction, , considerably lower than the value reported by Hunter & Hoffman (1999).
For knot AB (the only one where we could measure the [O iii] line), we derived an oxygen abundance of (about ), which places Mrk 32 among the extremely metal-deficient BCDs — galaxies having (Papaderos et al. 2008; Kunth & Östlin 2000).
This value is considerably lower (by 0.6 dex) than that derived with the empirical calibrations. This is in line with previous works that found that empirical calibrations yield oxygen abundances systematically higher than the -based abundances (see for instance Shi et al. 2005, where discrepancies on the order of 0.45 dex have been found). However, this considerable disagreement may also arise from the relatively large measurement uncertainties for the faint [O iii] emission line (according to Kobulnicky et al. (1999), Gaussian fits to emission lines with very low S/N ratios are systematically biased towards higher values). Deep spectroscopic observations are required to derive accurate -based abundances.
The velocity field appears essentially flat, with perhaps a hint of a small increase to the southwest.
4.3 Mrk 750
The galaxy Mrk 750 is an extremely faint () BCD, classified as BCD/Im in Petrosian et al. (2007). It belongs to the sample of low metallicity galaxies (Izotov & Thuan 1999; Izotov et al. 2007), and it is also a well-known Wolf-Rayet galaxy: Kunth & Joubert (1985) first pointed out the broad He ii Å emission, and Conti (1991) reported the detection of N iii Å; these results are consistent with those found in Izotov & Thuan (1998); Guseva et al. (2000) also noticed C iv Å. Broad-band optical and H observations were published by Méndez & Esteban (2000). From high spatial resolution H i synthesis observations, van Zee et al. (2001) found that the neutral gas extends to approximately twice the optical diameter of the galaxy, peaking in the central region of star formation.
Our IFU data cover a region of pc, with a sampling of 25 pc per spaxel. Two-dimensional maps of Mrk 750 are shown in Fig. 4.
The galaxy has a similar morphology both in the emission line and in the continuum maps, with roughly circular isophotes and a single central peak, whose position is the same in all maps (emission lines and continuum). However, while in the emission line maps the isophotes are circular at all intensity levels, in the continuum maps the outer ones appear elongated to the north-east, indicating that the central, bigger knot of Mrk 750 is connecting with a continuum source. This peculiar morphology was interpreted as an interaction sign in Méndez & Esteban (2000).
The excitation maps all display the same pattern and all trace the central SF knot. The ratio values in the four maps are consistent with ionization by hot stars.
In the extinction map we clearly distinguish a dust patch dominating the southeast part of the galaxy, with H/H values up to 3.8 — up to 0.27.
The integrated and nuclear spectra are both blue, OB young stars dominated spectra with very prominent emission lines; neither Balmer absorption wings nor absorption lines are visible. In agreement with previous results, we detected the blue Wolf Rayet bump around 4640Å (see Fig. 10); this feature is prominent in ten spaxels, located all in the nuclear region of the galaxy. We also have a marginal detection of C iv Å (the red Wolf-Rayet bump) in three central fibers. The position of the spaxels with the Wolf-Rayet signature is shown in the [O iii] flux map with crosses and squares for the blue and the red bumps respectively (see Fig. 4).
We computed the fluxes and equivalent width of the blue WR bump in the nuclear spectrum by a plain integration of the signal in the corresponding spectral region after fitting and subtracting the underlying continuum. Because the WR bumps are a blend of both genuine WR features and nebular lines, our measurement is actually an upper limit (the S/N ratio and the resolution of the spectrum do not allow us to fit and subtract separately the nebular lines). The extinction-corrected flux is ergs cm-2 s-1, and the equivalent width is .
The oxygen abundance derived for the nuclear spectra using the based method, , excellently agrees with the value reported by Izotov & Thuan (1998). There is also good agreement with the values we derived with empirical calibrations.
Both the H and [O iii] velocity maps, while somewhat noisy, display a rotation pattern around an axis roughly oriented east-west, with an amplitude of about 20 km s-1; this result qualitatively agrees with the H i kinematics published by van Zee et al. (2001).
4.4 Mrk 206 (=UGCA 280, SHOC 371)
The galaxy Mrk 206 is classified as a BCD in Petrosian et al. (2007). Intensities and equivalent widths of hydrogen and oxygen emission lines as well as oxygen abundances are published in Kniazev et al. (2004).
Our IFU data cover a region of kpc with a spatial sampling of 120 pc per spaxel. Fig. 5 displays the two-dimensional maps of Mrk 206.
The galaxy shows a regular morphology both in emission line and continuum maps with a central SF region and roughly circular isophotes.
All the excitation maps trace this central SF region, and in all of them the ratio values are consistent with ionization by young stars.
The extinction pattern on the other hand is highly inhomogeneous, with a substantial amount of dust located on the northeast region of the galaxy, with H/H ratios up to 6 — up to 0.7.
The galaxy displays a flat, typical H ii region spectrum, with no evident absorption features. With a metallicity of about it is the galaxy with the highest metallicity in our sample. However, as we fail to detect [O iii] 4363, only empirical abundances could be obtained. Kniazev et al. (2004) published a based method abundance of , dex lower than that derived here.
The velocity field shows a clear overall rotation along a southeast-northwest axis and interestingly seems much like the extinction pattern seen in the H/H map. The northeast side is approaching, the southwest side is receding; the velocity amplitude inside the mapped region is about 50–60 km s-1.
4.5 Tololo 1434+032 (= SHOC 474)
Tololo 1434+032 is a low-metallicity BCD (Izotov et al. 2007; Kniazev et al. 2004). and broad-band photometry was published in Doublier et al. (1997) and Gil de Paz et al. (2003), and H imaging in Gil de Paz et al. (2003).
The PMAS FOV covers a region of kpc, with a spatial sampling of 140 pc per spaxel. Two-dimensional maps of Tololo 1434+032 are shown in Fig. 6.
The galaxy shows a clumpy morphology both in emission lines and in the continuum. In the continuum maps we resolve two major emission peaks. The strongest is located in the southeast, while the other is displaced about 9 arcsec (1.3 kpc) to the northwest. All emission lines maps have the same structure: four SF knots are distributed in a roughly circular pattern, with the peak of emission located in knot A, whose position coincides with the continuum peak (knots are labeled in the H map in Fig. 6). Northeast of A there is a smaller knot, B, while two fainter knots, C and D, are seen in the north side: neither coincides spatially with the secondary continuum peak. (Because of their small size and luminosity, C and D were lumped together to obtain their integrated spectrum.)
The excitation maps trace the regions of star formation and display in the whole field of view values typical of H ii regions.
The galaxy shows an homogeneous extinction pattern with values close to the theoretical value of 2.86 across the whole FOV.
The spectra of the resolved SF knots are very similar and also resemble well the integrated spectrum: they are all flat, young star-dominated spectra with no evidence of absorption features. The oxygen abundance we found for the brightest knot, using the method, , compares well with the value derived in Kniazev et al. (2004), . The values derived through empirical calibrations are also very similar.
Both the H and the [O iii] velocity maps seem to marginally indicate a low amplitude rotation ( km s-1) around a northeast-southwest axis.
4.6 Mrk 475
The galaxy Mrk 475 is a low luminosity object, included in Izotov’s sample of metal poor galaxies (Izotov et al. 1994, 2007), and is classified as a BCD in Petrosian et al. (2007). and broad-band surface brightness photometry and H imaging were published by Gil de Paz et al. (2003). It is a WR galaxy, where nebular and broad He ii lines and C iv were detected (Conti 1991; Schaerer et al. 1999; Guseva et al. 2000).
Our IFU data cover a region of pc, with a spatial sampling of 58 pc per spaxel. Two-dimensional maps of Mrk 475 are displayed in Fig. 7.
This is a compact, regular object, with a single central SF knot. Emission lines and continuum maps display all the same morphology.
The ionization maps show all the same complex pattern: while in the western galaxy regions the excitation ratio decreases with the distance from the central SF region, in the eastern part it displays a constant value. The four ratio maps show values typical of excitation by hot stars.
The extinction map is inhomogeneous and has a peak in the southwest; extinction values are moderate, with H/H peaking around 3.
The galaxy displays a blue spectrum, with prominent emission lines and no visible absorption features. We detected the blue WR bump in eight spaxels (marked with crosses in Fig. 7); in two of them the red WR bump is also visible (squares in Fig. 7). We measured the flux and equivalent width of both WR bumps in the nuclear spectrum in the same way we did for Mrk 750, finding fluxes of and , and equivalent widths of 15 and 4 Å for the blue and the red bump respectively.
The oxygen abundance we found for the nuclear region, using the method, , agrees well with the value of reported by Izotov et al. (1994). Values derived using the empirical calibrations are slightly higher, but still in good agreement (difference dex).
Both the H and the [O iii] kinematical maps show a flat velocity field.
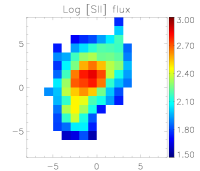
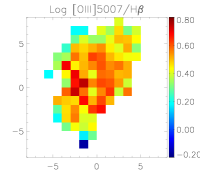
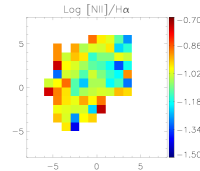
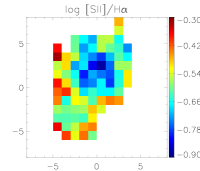
4.7 I Zw 123 (= UGCA 410, Mrk 487)
The galaxy I Zw 123 is classified as a BCD in Petrosian et al. (2007) and belongs also to the metal-poor BCD class (Izotov et al. 1997; Izotov & Thuan 1999). I Zw 123 is a relatively well-studied object: optical surface photometry was published in several papers (Cairós et al. 2001a, b; Gil de Paz et al. 2003; Caon et al. 2005; Amorín et al. 2007), NIR photometry in Cairós et al. (2003). A thorough spectroscopic study, including an analysis of its stellar content in terms of population synthesis models, was published in the series of papers by Kong & Cheng (2002), Kong et al. (2002), Kong et al. (2003), Kong (2004) and Shi et al. (2005).
The PMAS FOV covers an area of kpc, with a spatial sampling of 75 pc per spaxel. Two-dimensional maps of I Zw 123 are shown in Fig. 8.
In the continuum this galaxy is compact, with the intensity peak located in the center of the outer circular isophotes. All the emission-line maps have the same pattern, with a single SF region slightly displaced (2 arcsec or 150 pc) to the north of the continuum peak; the central isophotes are elongated in the south direction, resembling a small tail.
The three excitation maps display the same structure, tracing the SF region; the values are typical of regions photoionized by stars, except in the [S ii]/H map, where the outer regions have relatively high values (log[S ii]/H); this could indicate that shocks are playing a significant role.
The extinction map displays a maximum located in the same position as the SF knot; the peak values of the H/H ratio implies an of about 0.3 mag.
The galaxy exhibits a blue spectrum, with prominent emission lines and no evident absorption features. The oxygen abundance that we find by applying the method, agrees well with the value reported in Izotov & Thuan (1999), .
In both the H and [O III] velocity maps the velocity field appears flat (the higher velocities seen in the outermost spaxels in the [O III] map are most likely due to noise).
4.8 I Zw 159 (= UGCA 412, Mrk 1499)
In Petrosian et al. (2007) I Zw 159 is classified as a BCD/Irr. Optical surface brightness photometry was published in Doublier et al. (1997), Doublier et al. (1999), Gil de Paz et al. (2003) and Gil de Paz & Madore (2005). It is also included in the spectroscopy study of BCDs by Kong & Cheng (2002), Kong et al. (2002), Kong et al. (2003), Kong (2004) and Shi et al. (2005), and is the only object in our sample in common with the sample of galaxies studied by means of IFS by Petrosian et al. (2002).
The PMAS FOV covers a region of kpc, with a spatial resolution of 210 pc per spaxel. Two-dimensional maps of I Zw 159 are shown in Fig. 9.
In the continuum the galaxy shows a central intensity peak and a boxy morphology, with isophotes elongated around a northeast-southwest axis. In all the emission lines we see the same pattern: a central peak, whose position coincides with the continuum peak, surrounded by elongated isophotes.
All the excitation maps trace the SF knot; whereas in the [O iii] /H and [N ii] /H maps the values are consistent with photoionization by young stars in the whole galaxy, in the [S ii]/H and [O i]/H maps the outer regions of the galaxy have higher values (log[O i]/H, log[S ii]/H), indicating that an additional mechanism, probably shocks, is acting there.
The galaxy shows an irregular extinction pattern, with a dust patch located in the northern regions, where is as high as 0.45 mag.
The integrated spectra are blue, with some absorption wings around the Balmer lines. With an oxygen abundance , this galaxy also belongs to the high-metallicity BCDs branch.
The velocity field in the H and [O iii] maps shows a clear overall rotation along an axis roughly oriented south-north, with an amplitude of about 70–80 km s-1, in broad agreement with the velocity field published by Petrosian et al. (2002).
5 Summary and conclusions
We present here what is to our knowledge the most extensive IFS analysis of a sample of BCDs. This study is based on PMAS data, which cover a wavelength range of 3590-6996 Å, with a linear dispersion of 3.2 Åper pixel, and map an area with a spatial sampling of .
For all the sample galaxies we produced an atlas of two-dimensional maps: two continuum bands, the brightest emission lines (i.e. [O ii] , H , [O iii] , [O i] , H, [N ii] and [S ii] ) and the most relevant line ratios (i.e. [O iii]/H, [O i]/H, [N ii]/H, [S ii]/H and H/H) as well as the velocity field of the ionized gas. Integrated spectroscopic properties of the most prominent SF regions and of the whole galaxy have been also derived.
From this work we highlight the following results:
-
1.
All the objects except Mrk 750 and Tololo 1434+032 exhibit a mostly regular morphology in the continuum, with one (or several for Mrk 32 and Tololo 1434+032) central SF regions placed atop a more extended host galaxy. The galaxy Mrk 750 reveals elongated outer isophotes, and Tololo 1434+032 displays a clumpy continuum morphology.
All the galaxies show a similar morphology in the different mapped emission lines, as expected for objects ionized by hot stars, and for most of the galaxies the emission line morphology traces also the stellar component. Only for Mrk 32 and Tololo 1434+032 we found that the distribution of the gaseous emission differs considerably from that of the stellar component. Spatial discrepancies in the distribution of emission lines and continuum are interpreted as signs of a spatial migration of the SF over the history of the galaxies (Petrosian et al. 2002). However, small spatial offsets between continuum and emission line peaks, as those seen in Tololo 1434+032, and which are indeed a common feature in compact starburst galaxies (Hunter & Thronson 1995; Maiz-Apellaniz et al. 1998; Lagos et al. 2007), are likely related to the release of kinetic energy by massive stars and supernova explosions.
-
2.
The different excitation maps produced for the same galaxies display a similar pattern and trace the regions of star formation as expected in objects ionized by hot stars. In three out of the eight sample galaxies, namely Mrk 32, I Zw 123 and I Zw 159, higher values of [S ii]/H in the outer galaxy regions suggest shocks.
-
3.
Six out of the eight objects display inhomogeneous extinction maps, with interstellar reddening values varying across the galaxy from up to 0.7. This result stresses the importance of performing a bidimensional study of the interstellar extinction even when dealing with the less luminous and more compact BCDs as those studied here. Assuming a single, spatially constant value for the extinction, as is usually done in long-slit or single-aperture spectroscopic studies, can lead to large errors in the derivation of fluxes and magnitudes in the different regions of the galaxy.
-
4.
All SF regions in the sample galaxies have low electron densities, ranging from to 320 cm-3, typical of classical H ii regions.
-
5.
The oxygen abundances in the present objects range from to 8.44 ( to ). We measured for the first time the oxygen abundances of Mrk 407 and Mrk 32. The galaxy Mrk 407 is found to be a relatively high metallicity BCD, while the oxygen abundance found for Mrk 32 from the [O iii] line flux would place it in the list of extremely metal-poor galaxies. These systems, with , are excellent laboratories for galaxy formation and evolution studies, as they allow us to study chemical compositions and stellar populations in conditions approaching those of distant protogalactic systems. However, they are also very difficult to find, and at the present time only about 30 extremely metal-deficient BCDs are known (Kunth & Östlin 2000; Kniazev et al. 2004; Papaderos et al. 2008).
-
6.
Wolf-Rayet features were measured in three out of the eight galaxies; a marginal detection was reported for Mrk 32.
-
7.
Three galaxies display a clear rotation pattern (Mrk 750, Mrk 206, I Zw 159); for Mrk 407 and Tololo 1434+032, although the maps are noisier, both seem to indicate a low amplitude rotation around a preferred axis. For Mrk 32, Mrk 475 and I Zw 123 the velocity fields are nearly flat.
This paper is part of a larger project that aims to map of the properties of an externsive and representative sample of BCDs by means of IFS. Results for five luminous BCDs were published in García-Lorenzo et al. (2008), and results for the galaxies Mrk 409 and Mrk 1418, also observed with PMAS, have been shown in Cairós et al. (2009a) and Cairós et al. (2009b) respectively. The global properties of the whole sample will be discussed in a forthcoming publication.
Acknowledgements.
L. M. Cairós and C. Kehrig acknowledge the Alexander von Humboldt Foundation. N. Caon and C. Zurita are grateful for the hospitality of the Astrophysikalisches Institut Potsdam. This research has made use of the NASA/IPAC Extragalactic Database (NED), which is operated by the Jet Propulsion Laboratory, Caltech, under contract with the National Aeronautics and Space Administration. We acknowledge the usage of the HyperLeda database (http://leda.univ-lyon1.fr). This work has been partially funded by the spanish “Ministerio de Ciencia y Innovación” through grants AYA 2007 67965 and HA2006-0032, and under the Consolider-Ingenio 2010 Program grant CSD2006-00070: First Science with the GTC (http://www.iac.es/consolider-ingenio-gtc/).References
- Amorín et al. (2007) Amorín, R. O., Muñoz-Tuñón, C., Aguerri, J. A. L., Cairós, L. M., & Caon, N. 2007, A&A, 467, 541
- Becker (2002) Becker, T. 2002, PhD thesis
- Bergvall & Östlin (2002) Bergvall, N. & Östlin, G. 2002, A&A, 390, 891
- Brocklehurst (1971) Brocklehurst, M. 1971, MNRAS, 153, 471
- Cairós et al. (2007) Cairós, L. M., Caon, N., García-Lorenzo, B., et al. 2007, ApJ, 669, 251
- Cairós et al. (2002) Cairós, L. M., Caon, N., García-Lorenzo, B., Vílchez, J. M., & Muñoz-Tuñón, C. 2002, ApJ, 577, 164
- Cairós et al. (2009a) Cairós, L. M., Caon, N., Papaderos, P., et al. 2009a, ApJ, 707, 1676
- Cairós et al. (2003) Cairós, L. M., Caon, N., Papaderos, P., et al. 2003, ApJ, 593, 312
- Cairós et al. (2001a) Cairós, L. M., Caon, N., Vílchez, J. M., González-Pérez, J. N., & Muñoz-Tuñón, C. 2001a, ApJS, 136, 393
- Cairós et al. (2009b) Cairós, L. M., Caon, N., Zurita, C., et al. 2009b, A&A, 507, 1291
- Cairós et al. (2001b) Cairós, L. M., Vílchez, J. M., González Pérez, J. N., Iglesias-Páramo, J., & Caon, N. 2001b, ApJS, 133, 321
- Caon et al. (2005) Caon, N., Cairós, L. M., Aguerri, J. A. L., & Muñoz-Tuñón, C. 2005, ApJS, 157, 218
- Cardelli et al. (1989) Cardelli, J. A., Clayton, G. C., & Mathis, J. S. 1989, ApJ, 345, 245
- Conti (1991) Conti, P. S. 1991, ApJ, 377, 115
- De Robertis et al. (1987) De Robertis, M. M., Dufour, R. J., & Hunt, R. W. 1987, JRASC, 81, 195
- Diaz (1988) Diaz, A. I. 1988, MNRAS, 231, 57
- Domgorgen & Mathis (1994) Domgorgen, H. & Mathis, J. S. 1994, ApJ, 428, 647
- Doublier et al. (1999) Doublier, V., Caulet, A., & Comte, G. 1999, A&AS, 138, 213
- Doublier et al. (1997) Doublier, V., Comte, G., Petrosian, A., Surace, C., & Turatto, M. 1997, A&AS, 124, 405
- García-Lorenzo et al. (2008) García-Lorenzo, B., Cairós, L. M., Caon, N., Monreal-Ibero, A., & Kehrig, C. 2008, ApJ, 677, 201
- Gil de Paz & Madore (2005) Gil de Paz, A. & Madore, B. F. 2005, ApJS, 156, 345
- Gil de Paz et al. (2003) Gil de Paz, A., Madore, B. F., & Pevunova, O. 2003, ApJS, 147, 29
- Guseva et al. (2000) Guseva, N. G., Izotov, Y. I., & Thuan, T. X. 2000, ApJ, 531, 776
- Guseva et al. (2003a) Guseva, N. G., Papaderos, P., Izotov, Y. I., et al. 2003a, A&A, 407, 75
- Guseva et al. (2003b) Guseva, N. G., Papaderos, P., Izotov, Y. I., et al. 2003b, A&A, 407, 91
- Guseva et al. (2003c) Guseva, N. G., Papaderos, P., Izotov, Y. I., et al. 2003c, A&A, 407, 105
- Hunt et al. (2001) Hunt, L. K., Vanzi, L., & Thuan, T. X. 2001, A&A, 377, 66
- Hunter & Elmegreen (2006) Hunter, D. A. & Elmegreen, B. G. 2006, ApJS, 162, 49
- Hunter & Hoffman (1999) Hunter, D. A. & Hoffman, L. 1999, AJ, 117, 2789
- Hunter & Thronson (1995) Hunter, D. A. & Thronson, Jr., H. A. 1995, ApJ, 452, 238
- Izotov et al. (2006) Izotov, Y. I., Schaerer, D., Blecha, A., et al. 2006, A&A, 459, 71
- Izotov & Thuan (1998) Izotov, Y. I. & Thuan, T. X. 1998, ApJ, 500, 188
- Izotov & Thuan (1999) Izotov, Y. I. & Thuan, T. X. 1999, ApJ, 511, 639
- Izotov et al. (1994) Izotov, Y. I., Thuan, T. X., & Lipovetsky, V. A. 1994, ApJ, 435, 647
- Izotov et al. (1997) Izotov, Y. I., Thuan, T. X., & Lipovetsky, V. A. 1997, ApJS, 108, 1
- Izotov et al. (2007) Izotov, Y. I., Thuan, T. X., & Stasińska, G. 2007, ApJ, 662, 15
- James et al. (2009) James, B. L., Tsamis, Y. G., Barlow, M. J., et al. 2009, MNRAS, 398, 2
- Kauffmann et al. (1993) Kauffmann, G., White, S. D. M., & Guiderdoni, B. 1993, MNRAS, 264, 201
- Kehrig et al. (2008) Kehrig, C., Vílchez, J. M., Sánchez, S. F., et al. 2008, A&A, 477, 813
- Kelz et al. (2006) Kelz, A., Verheijen, M. A. W., Roth, M. M., et al. 2006, PASP, 118, 129
- Kniazev et al. (2004) Kniazev, A. Y., Pustilnik, S. A., Grebel, E. K., Lee, H., & Pramskij, A. G. 2004, ApJS, 153, 429
- Kobulnicky et al. (1999) Kobulnicky, H. A., Kennicutt, Jr., R. C., & Pizagno, J. L. 1999, ApJ, 514, 544
- Kong (2004) Kong, X. 2004, A&A, 425, 417
- Kong et al. (2003) Kong, X., Charlot, S., Weiss, A., & Cheng, F. Z. 2003, A&A, 403, 877
- Kong & Cheng (2002) Kong, X. & Cheng, F. Z. 2002, A&A, 389, 845
- Kong et al. (2002) Kong, X., Cheng, F. Z., Weiss, A., & Charlot, S. 2002, A&A, 396, 503
- Kunth & Joubert (1985) Kunth, D. & Joubert, M. 1985, A&A, 142, 411
- Kunth et al. (1988) Kunth, D., Maurogordato, S., & Vigroux, L. 1988, A&A, 204, 10
- Kunth & Östlin (2000) Kunth, D. & Östlin, G. 2000, A&A Rev., 10, 1
- Lagos et al. (2007) Lagos, P., Telles, E., & Melnick, J. 2007, A&A, 476, 89
- Lagos et al. (2009) Lagos, P., Telles, E., Muñoz-Tuñón, C., et al. 2009, AJ, 137, 5068
- Lequeux & Viallefond (1980) Lequeux, J. & Viallefond, F. 1980, A&A, 91, 269
- Loose & Thuan (1986) Loose, H.-H. & Thuan, T. X. 1986, in Star-forming Dwarf Galaxies and Related Objects, 73–88
- Lowenthal et al. (1997) Lowenthal, J. D., Koo, D. C., Guzman, R., et al. 1997, ApJ, 481, 673
- Maiz-Apellaniz et al. (1998) Maiz-Apellaniz, J., Mas-Hesse, J. M., Munoz-Tunon, C., Vilchez, J. M., & Castaneda, H. O. 1998, A&A, 329, 409
- Mas-Hesse & Kunth (1999) Mas-Hesse, J. M. & Kunth, D. 1999, A&A, 349, 765
- Masegosa et al. (1994) Masegosa, J., Moles, M., & Campos-Aguilar, A. 1994, ApJ, 420, 576
- McCall et al. (1985) McCall, M. L., Rybski, P. M., & Shields, G. A. 1985, ApJS, 57, 1
- Méndez & Esteban (2000) Méndez, D. I. & Esteban, C. 2000, A&A, 359, 493
- Osterbrock & Ferland (2006) Osterbrock, D. E. & Ferland, G. J. 2006, Astrophysics of gaseous nebulae and active galactic nuclei (Astrophysics of gaseous nebulae and active galactic nuclei, 2nd. ed. by D.E. Osterbrock and G.J. Ferland. Sausalito, CA: University Science Books, 2006)
- Pagel et al. (1992) Pagel, B. E. J., Simonson, E. A., Terlevich, R. J., & Edmunds, M. G. 1992, MNRAS, 255, 325
- Papaderos et al. (2008) Papaderos, P., Guseva, N. G., Izotov, Y. I., & Fricke, K. J. 2008, A&A, 491, 113
- Papaderos et al. (1996) Papaderos, P., Loose, H.-H., Thuan, T. X., & Fricke, K. J. 1996, A&AS, 120, 207
- Patat (2003) Patat, F. 2003, A&A, 400, 1183
- Paturel et al. (2003) Paturel, G., Petit, C., Prugniel, P., et al. 2003, A&A, 412, 45
- Petrosian et al. (2007) Petrosian, A., McLean, B., Allen, R. J., & MacKenty, J. W. 2007, ApJS, 170, 33
- Petrosian et al. (2002) Petrosian, A. R., Movsessian, T., Comte, G., Kunth, D., & Dodonov, S. 2002, A&A, 391, 487
- Pettini & Pagel (2004) Pettini, M. & Pagel, B. E. J. 2004, MNRAS, 348, L59
- Pilyugin et al. (2006) Pilyugin, L. S., Vílchez, J. M., & Thuan, T. X. 2006, MNRAS, 370, 1928
- Roth et al. (2005) Roth, M. M., Kelz, A., Fechner, T., et al. 2005, PASP, 117, 620
- Sánchez (2006) Sánchez, S. F. 2006, Astronomische Nachrichten, 327, 850
- Sánchez et al. (2007) Sánchez, S. F., Aceituno, J., Thiele, U., Pérez-Ramírez, D., & Alves, J. 2007, PASP, 119, 1186
- Sargent & Searle (1970) Sargent, W. L. W. & Searle, L. 1970, ApJ, 162, L155+
- Schaerer et al. (1999) Schaerer, D., Contini, T., & Pindao, M. 1999, A&AS, 136, 35
- Shaw & Dufour (1995) Shaw, R. A. & Dufour, R. J. 1995, PASP, 107, 896
- Shi et al. (2005) Shi, F., Kong, X., Li, C., & Cheng, F. Z. 2005, A&A, 437, 849
- Telles (1995) Telles, J. E. 1995, PhD thesis, , Univ. Cambridge, (1995)
- Thuan (1991) Thuan, T. X. 1991, Observations and Models of Blue Compact Dwarf Galaxies (Massive Stars in Starbursts), 183–+
- Thuan & Martin (1981) Thuan, T. X. & Martin, G. E. 1981, ApJ, 247, 823
- Ugryumov et al. (1998) Ugryumov, A. V., Pustilnik, S. A., Lipovetsky, V. A., Izotov, Y. I., & Richter, G. 1998, A&AS, 131, 295
- van Zee et al. (2001) van Zee, L., Salzer, J. J., & Skillman, E. D. 2001, AJ, 122, 121
- Vanzi et al. (2008) Vanzi, L., Cresci, G., Telles, E., & Melnick, J. 2008, A&A, 486, 393
- Vanzi & Sauvage (2004) Vanzi, L. & Sauvage, M. 2004, A&A, 415, 509
- Veilleux & Osterbrock (1987) Veilleux, S. & Osterbrock, D. E. 1987, ApJS, 63, 295
| Ion | Mrk 407 | Mrk 32 | |||||||||
| Nuclear | Integrated | Knot AB | Knot C | Integrated | |||||||
| 3727 | [O ii] | ||||||||||
| 3869 | [Ne iii] | — | — | — | — | — | — | — | — | ||
| 3889 | H8+HeI | — | — | — | — | — | — | — | — | — | — |
| 3968 | [Ne iii] | — | — | — | — | — | — | — | — | — | — |
| 4101 | H | — | — | — | — | — | — | — | — | ||
| 4340 | H | — | — | ||||||||
| 4363 | [O iii] | — | — | — | — | — | — | — | — | ||
| 4471 | He i | — | — | — | — | — | — | — | — | — | — |
| 4861 | H | ||||||||||
| 4959 | [O iii] | ||||||||||
| 5007 | [O iii] | ||||||||||
| 5876 | He i | — | — | — | — | — | — | ||||
| 6300 | [O i] | — | — | — | — | ||||||
| 6548 | [N ii] | — | — | — | — | — | — | — | — | — | — |
| 6563 | H | ||||||||||
| 6584 | [N ii] | ||||||||||
| 6678 | He i | — | — | — | — | — | — | — | — | ||
| 6717 | [S ii] | ||||||||||
| 6731 | [S ii] | ||||||||||
(*) Notes. – Reddening-corrected line fluxes, normalized to . Equivalent widths of Balmer lines are corrected for underlying stellar absorption. The reddening coefficient, (H), (derived as ) and the reddening-corrected H flux, ergs cm-2 s-1) are listed for each region. The quoted uncertainties account for measurement, flux-calibration and reddening coefficient errors.
| Ion | Mrk 750 | Mrk 206 | |||||||
|---|---|---|---|---|---|---|---|---|---|
| Nuclear | Integrated | Nuclear | Integrated | ||||||
| 3727 | [O ii] | ||||||||
| 3869 | [Ne iii] | — | — | — | — | ||||
| 3889 | H8+HeI | — | — | — | — | ||||
| 3968 | [Ne iii] | — | — | — | — | ||||
| 4101 | H | — | — | ||||||
| 4340 | H | ||||||||
| 4363 | [O iii] | — | — | — | — | ||||
| 4471 | He i | — | — | — | — | ||||
| 4861 | H | ||||||||
| 4959 | [O iii] | ||||||||
| 5007 | [O iii] | ||||||||
| 5876 | He i | ||||||||
| 6300 | [O i] | — | — | — | — | ||||
| 6548 | [N ii] | — | — | — | — | ||||
| 6563 | H | ||||||||
| 6584 | [N ii] | ||||||||
| 6678 | He i | — | — | ||||||
| 6717 | [S ii] | ||||||||
| 6731 | [S ii] | ||||||||
| Ion | Tololo 1434+032 | Mrk 475 | |||||||||||
| Knot A | Knot B | Knot CD | Integrated | Nuclear | Integrated | ||||||||
| 3727 | [O ii] | ||||||||||||
| 3869 | [Ne iii] | — | — | ||||||||||
| 3889 | H8+HeI | — | — | — | — | — | — | — | — | ||||
| 3968 | [Ne iii] | — | — | — | — | — | — | ||||||
| 4101 | H | — | — | — | — | ||||||||
| 4340 | H | ||||||||||||
| 4363 | [O iii] | — | — | — | — | — | — | ||||||
| 4471 | He i | — | — | — | — | — | — | — | — | — | — | ||
| 4686 | He ii | — | — | — | — | — | — | — | — | — | — | ||
| 4861 | H | ||||||||||||
| 4959 | [O iii] | ||||||||||||
| 5007 | [O iii] | ||||||||||||
| 5876 | He i | — | — | — | — | — | — | ||||||
| 6300 | [O i] | — | — | — | — | — | — | — | — | — | — | — | — |
| 6548 | [N ii] | — | — | — | — | — | — | — | — | ||||
| 6563 | H | ||||||||||||
| 6584 | [N ii] | ||||||||||||
| 6678 | He i | — | — | — | — | — | — | ||||||
| 6717 | [S ii] | ||||||||||||
| 6731 | [S ii] | ||||||||||||
| Ion | IZw 123 | IZw 159 | |||||||
|---|---|---|---|---|---|---|---|---|---|
| Nuclear | Integrated | Nuclear | Integrated | ||||||
| 3727 | [O ii] | ||||||||
| 3869 | [Ne iii] | — | — | ||||||
| 3889 | H8+HeI | — | — | — | — | — | — | ||
| 3968 | [Ne iii] | — | — | — | — | — | — | ||
| 4101 | H | — | — | — | — | ||||
| 4340 | H | ||||||||
| 4363 | [O iii] | — | — | — | — | — | — | ||
| 4471 | He i | — | — | — | — | — | — | ||
| 4861 | H | ||||||||
| 4959 | [O iii] | ||||||||
| 5007 | [O iii] | ||||||||
| 5876 | He i | — | — | ||||||
| 6300 | [O i] | — | — | — | — | ||||
| 6548 | [N ii] | — | — | — | — | — | — | ||
| 6563 | H | ||||||||
| 6584 | [N ii] | ||||||||
| 6678 | He i | — | — | — | — | ||||
| 6717 | [S ii] | ||||||||
| 6731 | [S ii] | ||||||||
| Parameter | Mrk 407 | Mrk 32 | Mrk 750 | Mrk 206 | |||||
| Nuclear | Integrated | Knot AB | Knot C | Integrated | Nuclear | Integrated | Nuclear | Integrated | |
| ([S ii]) (cm-3) | 188 | 197 | 110 | 154 | 169 | 154 | |||
| ([O ii]) (104 K) | — | — | — | — | — | — | |||
| ([O iii]) ( K) | — | — | — | — | — | — | |||
| – () | — | — | — | — | — | — | |||
| — | — | — | — | — | — | ||||
| — | — | — | — | — | — | ||||
| — | — | — | — | — | — | ||||
| — | — | — | — | — | — | ||||
| – (N2) | 8.26 | 8.24 | 8.16 | 8.24 | 8.22 | 8.17 | 8.17 | 8.44 | 8.48 |
| – (O3N2) | 8.24 | 8.24 | 8.17 | 8.25 | 8.25 | 8.10 | 8.11 | 8.41 | 8.42 |
| — | — | — | — | ||||||
(*) Notes: derived from the relation: found by Pilyugin et al. (2006); ([O iii]): electron temperature measured from [O iii] ; – (): direct O/H abundance derived from ([O iii]); – (N2): O/H derived from the N2 index (Pettini & Pagel 2004); the associated uncertainty is ; – (O3N2): O/H derived from the O3N2 index (Pettini & Pagel 2004); the associated uncertainty is .
| Parameter | Tololo 1434+032 | Mrk 475 | IZw 123 | IZw 159 | ||||||
| Knot A | Knot B | Knot CD | Integrated | Nuclear | Integrated | Nuclear | Integrated | Nuclear | Integrated | |
| ([S ii]) (cm-3) | 150 | 147 | 323 | 287 | 113 | |||||
| ([O ii]) (104 K) | — | — | — | — | — | — | ||||
| ([O iii]) ( K) | — | — | — | — | — | — | ||||
| – () | — | — | — | — | — | — | ||||
| — | — | — | — | — | — | |||||
| — | — | — | — | — | — | |||||
| — | — | — | — | — | — | |||||
| — | — | — | — | — | — | |||||
| – (N2) | 8.13 | 8.14 | 8.23 | 8.15 | 8.06 | 8.07 | 8.15 | 8.17 | 8.32 | 8.34 |
| – (O3N2) | 8.08 | 8.10 | 8.21 | 8.12 | 8.01 | 8.02 | 8.07 | 8.10 | 8.30 | 8.31 |
| — | — | — | — | — | — | — | — | |||