The Pulsar B2224+65 and its Jets: A Two Epoch X-ray Analysis
Abstract
We present an X-ray morphological and spectroscopic study of the pulsar B2224+65 and its apparent jet-like X-ray features based on two epoch Chandra observations. The main X-ray feature, which shows a large directional offset from the ram-pressure confined pulsar wind nebula (Guitar Nebula), is broader in apparent width and shows evidence for spectral hardening (at 95 percent confidence) in the second epoch compared to the first. Furthermore, the sharp leading edge of the feature is found to have a proper motion consistent with that of the pulsar (180 mas yr-1). The combined data set also provides evidence for the presence of a counter feature, albeit substantially fainter and shorter than the main one. Additional spectral trends along the major and minor axes of the feature are only marginally detected in the two epoch data, including softening counter to the direction of proper motion. Possible explanations for the X-ray features include diffuse energetic particles being confined by an organized ambient magnetic field as well as a simple ballistic jet interpretation; however, the former may have difficulty in explaining observed spectral trends between epochs and along the feature’s major axis whereas the latter may struggle to elucidate its linearity. Given the low counting statistics available in the two epoch observations, it remains difficult to determine a physical production scenario for these enigmatic X-ray emitting features with any certainty.
1. Introduction
As pulsars age, they lose their spin-down energy through both radiation and relativistic particle ejection. One may approximate the particle ejection in two forms: anisotropic winds from the pulsar surface and bi-polar jets. Previous X-ray studies have shown the wind component to be primarily equatorial and axisymmetric, producing observed tori in pulsar wind nebulae (PWNe), whereas the jet outflows are only observed in a few, though well studied, young pulsars (e.g. the Crab and Vela pulsars, Weisskopf et al., 2000; Pavlov et al., 2003). Only a few nearby and relatively old pulsars have been shown to have their PWNe, mostly enhanced by ram-pressure confinement (e.g., Wang, Li & Begelman, 1993; Kargaltsev & Pavlov, 2008, and references therein). For a PWN or similar pulsar ejection feature to be observed in X-rays, the synchrotron-emitting particles must have energies on order of 102 TeV, achievable in shocks of the pulsar ejecta as it encounters the local interstellar medium (ISM). X-ray investigations of pulsar outflows are therefore crucial in understanding their origin and particle acceleration, which can in turn provide insight into the origin of other, more exotic and distant, outflows (e.g. from Active Galactic Nuclei).
A particularly striking case is that of the pulsar B2224+65 and its X-ray-emitting “jet”. B2224+65 is one of the fastest pulsars known with a radio proper motion of mas yr-1 (Harrison, Lyne & Anderson, 1993); corresponding to a transverse velocity of , where is the distance to B2224+65 in units of kpc and is uncertain in the range of (Chatterjee & Cordes, 2004). The rapid motion of the pulsar produces a bow shock nebula visible in H (Cordes, Romani & Lundgren, 1993; Chatterjee & Cordes, 2002, 2004) which has been dubbed the “Guitar Nebula” due to its peculiar morphology. Aside from its high proper motion, B2224+65 behaves like a normal radio pulsar, with a modest energy spin-down rate of and period s. X-ray studies of B2224+65 do not reveal significant emission concurrent with the H (however, see Romani, Cordes & Yadigaroglu, 1997) but rather an unusual extended linear feature apparently stemming from B2224+65 and offset from the pulsar’s direction of motion by 118 (Hui & Becker, 2007; Wong et al., 2003; Zavlin & Pavlov, 2004). The feature, extending 2 away from the pulsar, was found to have an apparent non-thermal spectrum though the details as to its origin have thus far remained a mystery. Such a distinct, linear X-ray emitting feature has not been identified anywhere else in the Galaxy with the possible exception of the Galactic Center (e.g. Johnson, Dong, & Wang, 2009, and references therein). It was suggested by Kargaltsev & Pavlov (2008) that the extended feature may not be associated with B2224+65 but rather with a nearby point source, although no physical production scenario was developed for the feature. Through theoretical modeling of the linear X-ray emission by Bandiera (2008), it was proposed that the feature could be produced through highly energetic particles that are accelerated at, and subsequently escape, the pulsar wind terminal shock but are ultimately confined by a large-scale, organized interstellar magnetic field. However, there are a number of observational requirements to the Bandiera (2008) model that have yet to be fulfilled, primarily a proper motion of the feature consistent with B2224+65. The uncertain association with the pulsar, combined with low photon statistics, has made it difficult to establish the physical process responsible for the feature.
| Chandra | R.A. (J2000) | Dec. (J2000) | Exposure | Roll Angle | OBS Date |
|---|---|---|---|---|---|
| OBS. # | (h m s) | (degree arcmin arcsec) | (s) | (degree) | (yyyy-mm-dd) |
| 755 | 22 25 48.439 | +65 35 08.09 | 47865 | 236.8 | 2000-10-21 |
| 6691 | 22 25 51.852 | +65 35 39.19 | 9968 | 182.7 | 2006-08-29 |
| 7400 | 22 25 51.428 | +65 35 35.13 | 35839 | 219.3 | 2006-10-06 |
Note. — The exposure represents the live time (dead time corrected) of cleaned data.
In this study, we examine two epoch data taken by the Chandra X-ray Observatory to determine any association between the extended, linear feature and B2224+65 as well as to place constraints on possible X-ray-emitting particle production scenarios. Throughout this manuscript, we will refer to the feature as the jet or jet-like feature based purely on its apparent morphology, implying no physical interpretation given its still uncertain origin. From the two epoch data, we first correct for any astrometric offset between observations and verify the motion of B2224+65. We then briefly examine the two epoch and combined spectroscopic information for the pulsar to see if there may have been any evolution in its spectrum. A morphological analysis of the jet will serve to detect any shift between epochs, providing evidence for (or against) an association between the jet and pulsar. Spectral analysis of the jet between epochs and across the major/minor axes may aid in identifying possible spectral trends, which can assist in determining the physical models behind the X-ray emission. Finally, we briefly discuss our findings in the context of the Bandiera (2008) model and a simple ballistic jet model similar to that used to explain AGN jet emission.
2. Observations and Data Reduction
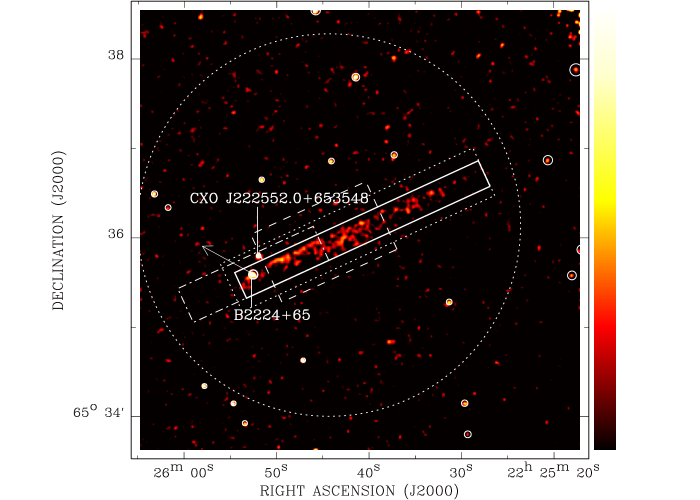
B2224+65 was observed by the Chandra X-ray Observatory over two separate epochs using the Advanced CCD Imaging Spectrometer spectroscopic array (ACIS-S). The first epoch consists of Obs. ID 755 while the second epoch is composed of two observations, Obs. ID 6691 and 7400 (the relevant observational parameters for each Obs. ID are given in Table 1). Each of the individual observations was first reprocessed using the standard Chandra Interactive Analysis of Observations (ciao) routines (version 3.4.0). After reprocessing, Obs. ID 6691 and 7400 were combined to produce a second epoch event file. A merged epoch event file and X-ray image of B2224+65 (Figs. 1,2) was then produced by combining Obs. ID 755 and the second epoch event file after astrometric corrections have been applied (see below). Source lists for each of the two epoch event files were constructed using the method of Wang (2004), with a false detection probability of 10-6, to be used in correcting the astrometry between epochs and producing source-removed event maps for background estimation.
Before we can properly analyze the two epoch data sets, we must correct for any possible astrometric offset that may have been produced through pointing differences between epochs. From our X-ray detected source lists, we extract the positions of 19 sources common to both epochs with count rates 0.2 counts ks-1 and off-axis distances 4′. Limiting the off-axis distance of the sources serves to minimize the effects of positional errors due to PSF variation across the CCD. The RA and DEC offsets, as well as a rotation angle in image alignment, are then derived from the RA and DEC differences of the common sources, taking into account their positional uncertainty determined from maximum likelihood centroiding (with 1 errors of 0.1-0.9″). From our initial calculation, we find that the rotation between images is negligible (0.020.05°, 1 uncertainty) and subsequently recompute the corrections assuming no rotation, resulting in RA and DEC corrections of 0.240.09 and 0.180.09, respectively. Despite exclusion of the rotation in image alignment, it is unlikely to influence our results, as we limit our analysis to only the area near the telescope aim-point. These astrometric corrections have been applied only to the astrometry in the fits header of the second epoch event file for merged epoch image production (Figs. 1,2) and subsequent analyses.
Due to the diffuse nature of the jet, we adopt the method of local background estimation to determine the background spectra. To obtain a representative background for the pulsar and jet regions, we extract the spectrum from a 2 circular region, given by the dotted circle in Fig. 1, while excluding detected point sources and the jet. Since there may be additional, unresolved emission from the jet extending beyond its source region, we exclude the area within the dotted rectangle of Fig. 1 when extracting the background. This same area is also used for determining the sky background level when constructing surface brightness profiles along the major and minor axes of the jet (§ 3.2).
3. Analysis and Results
3.1. Pulsar B2224+65: Proper Motion and Spectrum
Due to the time gap between the observations of B2224+65, we must first verify the pulsar’s proper motion ( and or mas yr-1 with 90 percent confidence intervals from the radio sample of Harrison, Lyne & Anderson, 1993). Extracting B2224+65’s position from our X-ray source lists in both epochs and applying the astrometric corrections, we find that the pulsar’s position has changed by 0.910.24 arcsec in RA and 0.440.24 arcsec in DEC, taking into consideration the relative astrometric uncertainties, or by 1.010.34 arcsec over the 6 year gap between epochs. This relates to a proper motion of and or absolute proper motion of (1 errors), in agreement with the radio proper motion.
| Epoch | Count Rate (0.3-7.0 keV) | NH | Flux (0.3-7.0 keV) | ||
|---|---|---|---|---|---|
| 10-3 cts/s | 1022 cm-2 | 10-14 ergs cm | |||
| 1 | 1.730.19 | 0.09 | 1.89 | 8.94/12 | |
| 2 | 2.000.21 | 1.66 | |||
| Merged | 1.860.14 | 0.09 | 1.70 | 9.47/14 |
Note. — xspec spectral fitting parameters for B2224+65. The column densities listed are the 90 percent confidence upper limits given by the absorbed power law fits. Errors are given to 90 percent confidence.
While we do not expect variation in the spectrum of B2224+65 itself, a significant portion of the observed emission may arise from the shocked wind material, which is dependent on the pulsar wind and local ISM properties, and could therefore change between epochs. Any variation, or lack thereof, in the emission can then be compared with the spectral modeling of the jet. To ensure that the pulsar’s proper motion will not influence the spectral modeling, we extract the spectra from the individual epoch event files using a small circular region (radius of 3 at RA=22h25m53s, DEC=+65°35′35 (J2000), see Fig. 1). The spectra are then adaptively binned such that each bin has a signal-to-noise (S/N) ratio of 2.5 where the signal is the net counts above the local background and the noise contains all counts. This provides 8(9) bins for the first(second) epoch spectrum with 10 counts per bin due to the small contribution from the local background over the pulsar region.
To model the two epoch pulsar spectra, we apply a joint fit, absorbed power law in xspec (version 11.3.1) where the foreground X-ray-absorbing column density, NH, should not change significantly with time and is thus set as a common parameter between epochs. The epoch averaged properties of the pulsar are derived by performing a similar joint fit in which all model parameters are set to be the same in both epochs (i.e. power law index and normalization). Alternatively, one may also combine the two epoch spectra using the addspec routine in ftools and apply the absorbed power law model, or directly extract the spectrum from the merged event file. However, the latter method does not preserve calibration information from each epoch whereas the former may give misleading results if the detector response changes between spectra and/or if there is any spatial variation in the spectra. Nevertheless, we find that each method produces consistent results with the simple two epoch joint fit. We report here only the spectral parameters as given by the joint fit modeling as it is likely the least sensitive to any systematic calibration uncertainties. Comparison of our spectral fitting results (with 90 percent confidence contours given in Table 2 and Fig. 3) of B2224+65 with the previous work of Hui & Becker (2007) (1 errors based on first epoch data alone) suggests that the observed emission from the pulsar has not had any significant evolution between epochs.

3.2. Jet-Like Feature: Astrometry and Spectrum
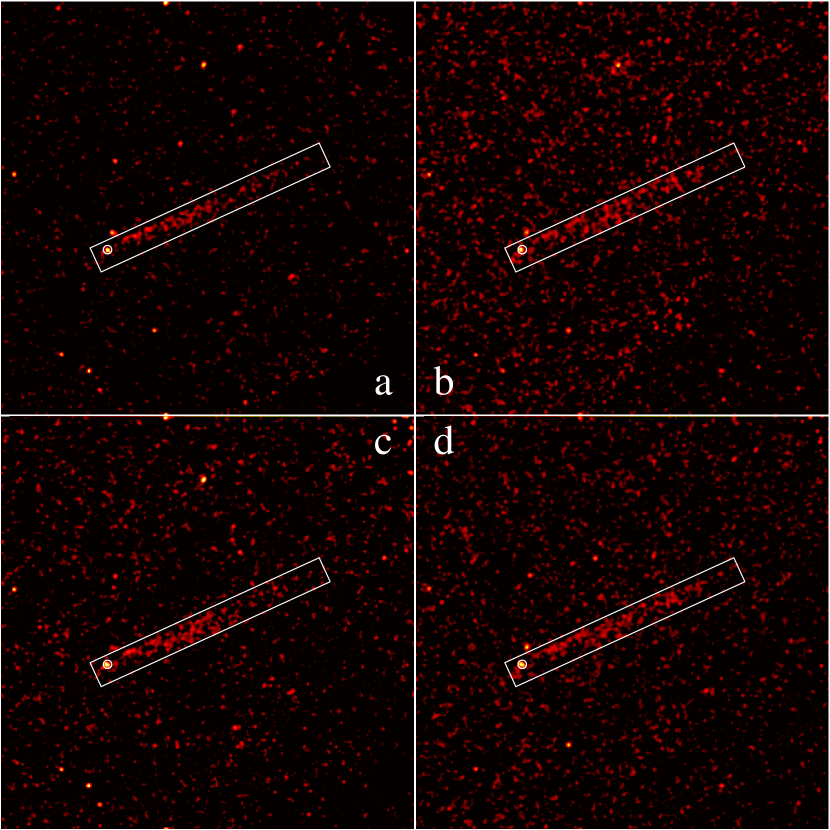
From the smoothed X-ray intensity map of B2224+65 (Fig. 1), the jet appears disconnected from both B2224+65 and the nearby point source (labeled here as CXO J222552.0+653548) and thus does not clearly support a direct association with either source (contrary to the suggestion of Kargaltsev & Pavlov 2008). The jet remains fairly linear with a sharp edge along the direction of B2224+65’s proper motion, extending a length of 2.4′away from the pulsar. Other morphological properties include apparent “fanning” with increasing distance from the pulsar and a minor region of X-ray enhancement on the opposite side of the pulsar. Furthermore, the two epoch images (Fig. 2a,b) indicate an increase in the width of the jet across epochs with little to no bending in the leading edge (1 within 2 away from B2224+65) while the soft and hard band images (Fig. 2c,d) show evidence for harder X-ray emission farther along the (epoch averaged) jet. In the following analysis, we assume the case of no bending for simplicity. The presence of any bending will serve primarily to dilute the significance of any determined edge location along the minor axis and will be propagated through our analysis as a systematic uncertainty.
For our morphological analysis of the jet, particularly for studying its proper motion and the significance of the extended emission regions, we construct surface brightness profiles along its major and minor axes. These profiles result from 10025 arcsec2 and 8550 arcsec2 rectangular regions centered at RA=(22h25m52s, 22h25m45s) and DEC=(+65°35′35″, +65°35′57″) (J2000) for the major and minor axis, respectively (given as the dot-dash and dashed line regions in Fig. 1). These regions were selected by hand to maximize the signal for the relevant profile using the epoch averaged pulsar position as the primary reference point (§ 3.1). For the calculation of the profiles, we bin the profiles with a S/N ratio of 4; here the signal is the net counts above the instrument background, as measured from the ACIS stowed data, while the noise includes all counts. The use of the instrument background, instead of the total sky background, enables the application of the adaptive binning even to regions with negligible contribution from the jet. For each bin, the X-ray intensity is then simply defined as (counts-instrument background)/exposure. After binning, the sky background levels, determined from the local background region, were subtracted to produce the surface brightness profiles shown in Fig. 4. The adopted binning was chosen simply for ease of viewing; the exact choice does not influence our analysis of the jet edge or extended emission regions (see below).

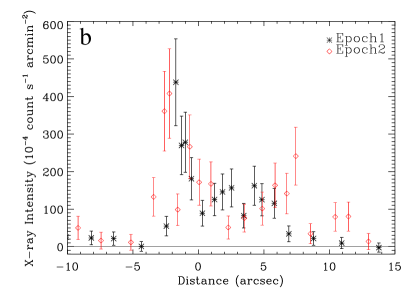
Examining Fig. 4a, there is evidence for a weak counter feature, opposite in direction to the primary jet-like feature. This counter feature, extending 20 away from B2224+65, is considerably fainter than the main jet-like feature though it still appears significant compared to the local X-ray background. Due to the faintness of the counter feature, the counting statistics are too low in individual epoch observations for a positive detection. We therefore use the merged epoch event file, along with a small 2020 arcsec2 box centered on the feature in question, to derive a background subtracted count rate of . Comparatively, the local background corresponding to the same region has a count rate of 0.680.09, placing the counter feature at 4 times the background uncertainty or at a detection significance of 4. It is therefore highly unlikely that this feature results from Poisson variations in the X-ray background.
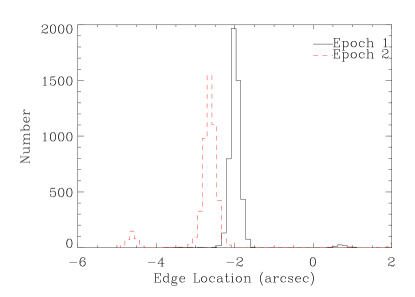
In Fig. 4b, there appears to be a slight shift in the sharp left edge as well as an extension far to the right when comparing the minor axis surface brightness profiles in the first and second epochs. Currently, we concern ourselves with the presence of the apparent shift which, if confirmed, may be compared to the observed proper motion of B2224+65, establishing a connection between the pulsar and jet-like feature. In order to determine the shift between epochs, we apply a simple one dimensional edge detection method to the sharp edges in the two epoch data. Our edge detection method involves constructing finely binned intensity profiles taken from high resolution count maps (with 0.12 pixels) and convolving the profiles with a filter based on the work of Canny (1986), which can be approximated by e, with a filter scale of =0.5″, comparable to the ACIS resolution. To determine the underlying distribution of edge positions in the two epoch data, and thus derive uncertainty estimates, we generate 5000 Poisson realizations of the high resolution count profiles and convolve each with the chosen filter, following the method of bootstrap resampling. By filter design, the edge position for each realization is determined by “centroiding” the peak in the surface brightness profile and therefore depends primarily on the counting statistics of the available data. The derived positions are thus insensitive to the exact choice of the filter scale or binning of the count profiles; we have verified this using a variety of profile binning and filter scales, all of which produce results consistent with those presented here. Based on the histogram distributions of the resampling (Fig. 5), we find a shift between the two epochs of 0.62 arcsec, with 90 percent confidence intervals. The reported errors on the shift are likely underestimates of the true uncertainty as they do not account for errors in our astrometric corrections, though they do include any possible systematic uncertainty from unresolved bending in the jet. Nevertheless, the shift, especially its direction, is consistent with the proper motion of B2224+65, correcting for its projection to the adopted minor axis of the jet (a factor of 0.88), and thus supports an association between the pulsar and jet-like feature.
As mentioned previously, there is evidence for excess extended emission along the minor axis of the jet in the second epoch compared to the first. This excess emission can also be seen in Fig. 2a,b through the apparent widening of the jet-like feature over the two epochs. Examining the two epoch surface brightness profiles, there is little deviation between epochs, after correcting for the previously determined shift, except for the excess emission region, located 7-17 away from the left sharp edge. The presence of this region will not effect our previous edge determination due to its distance from the left sharp edge and our choice of filter. Following a method similar to the extension along the major axis, the region of excess extended emission is found to have a count rate that is 0.280.11 higher in the second epoch than in the first, which has a total count rate (sky background included) of 0.640.06. Given the high detection significance of the excess emission in the second epoch (5), it is very unlikely that it is artificial or statistical in nature; although a physical explanation for the excess emission is perhaps even more enigmatic than the jet or counter feature.
| Epoch | Segment | CR (0.3-7.0 keV) | NH | Flux (0.3-7.0 keV) | ||
|---|---|---|---|---|---|---|
| 10-3 cts/s | 1022 cm-2 | 10-14 ergs cm-2 s-1 | ||||
| Two Epoch | ||||||
| 1 | Jet | 5.790.46 | 0.12 | 1.79 | 5.16 | 46.6/46 |
| 2 | Jet | 5.600.49 | 1.15 | 7.38 | ||
| Merged | B2224+65 | 1.860.14 | 1.88 | 1.68 | ||
| Epoch Averaged | ||||||
| Merged | Jet | 5.700.34 | 0.15 | 1.61 | 5.58 | 52.7/48 |
| Merged | B2224+65 | 1.860.14 | 1.95 | 1.63 | ||
| Major Axis | ||||||
| Merged | Head Segment | 3.610.25 | 0.13 | 1.69 | 3.59 | 33.6/47 |
| Tail Segment | 1.960.21 | 1.00 | 3.35 | |||
| B2224+65 | 1.860.14 | 1.90 | 1.65 | |||
| Minor Axis | ||||||
| Merged | Edge Segment | 2.640.22 | 0.06 | 1.08 | 3.76 | 31.9/45 |
| Taper Segment | 2.790.24 | 1.30 | 3.70 | |||
| B2224+65 | 1.860.14 | 1.73 | 1.77 | |||
Note. — xspec spectral fitting parameters for the jet similar to Table 2. Column densities are again given as upper limits. The inclusion of B2224+65 with the jet segments serves to jointly constrain NH and reduce the errors associated with the relevant s. The epoch averaged jet spectrum is determined using the same method as the epoch averaged pulsar spectrum. Errors are given to 90 percent confidence.

We now examine the spectrum of the jet both spatially and across epochs to determine if there may be evidence for any spectral evolution. In each epoch, we extract the spectrum of the jet using the same rectangular region (see Fig. 1,2) after removing B2224+65. The jet region is further segmented along its major and minor axes, labeled according to their relative positions, such that the segments have approximately equal counting statistics. The individual spectra are again adaptively binned to a S/N ratio of 2.5, resulting in 25 counts per bin due to the higher background contribution in the jet region. In order to improve the constraints on model parameters in the spectral fits for the segments, we again apply joint fits in which the parameters are set to be the same in both epochs though allowed to vary over the individual segments; only NH is set as a common parameter throughout, assuming that it is constant in time and space across the jet. We also include the epoch averaged pulsar spectrum to place further constraints on NH and the relevant s. The fitted parameters are given in Table 3 with the confidence contours for the epoch averaged jet spectrum given in Fig. 6. Similar to Hui & Becker (2007), we find that the power law model provides a satisfactory fit (1.1) to the jet spectrum, though the possibility of alternative models can not be completely rejected based on test alone. It should be noted, however, that reasonable alternatives such as thermal Bremsstrahlung result in temperatures on the order of 2 keV (see also Hui & Becker, 2007) and are likely unrealistic. From our spectral analysis, there is evidence for significant, to 95 percent confidence, spectral hardening in the jet between epochs. There is also indication for further spectral variation along the jet, including spectral hardening farther from the pulsar and softening counter to the pulsar proper motion, although these trends are only marginally detected (with significance).
4. Discussion
Based on our two epoch X-ray analysis of B2224+65 and the jet-like feature, we have verified the proper motion of the pulsar and have shown similar motion in the sharp leading edge of the jet, providing strong evidence for its association with the pulsar. Along the major axis of the jet, a region of extended X-ray emission (hereafter counter feature), detected with 4 confidence, is found near the pulsar and opposite the jet. The jet also appears wider, due to a significant (5) region of excess emission, with a harder spectrum in the second epoch compared to the first whereas additional spectral evolution across the major and minor axes is more ambiguous. Given the low confidence for many of the spectral variations, including softening counter to the direction proper motion, the physical nature of the jet-like feature remains puzzling. Here, we briefly examine two candidate physical scenarios for the production of the jet based on current results.
To begin with, let us first consider the model proposed by Bandiera (2008). This model assumes that the jet represents electrons that have been accelerated at the termination shock of the pulsar wind which then leak out of the bow shock and diffuse into an ambient medium containing a large-scale plane-parallel magnetic field. The orientation of the jet-like feature feature would then correspond to the direction of the magnetic field, which needs to be unusually strong (G). As stated by Bandiera (2008), this scenario would predict motion for the jet-like feature consistent with B2224+65, softening of the jet spectrum counter to the direction of proper motion due to synchrotron cooling of particles injected at different times and the presence of a counter feature. Our two epoch observations support many of these predictions though the spectral variation can not be positively confirmed. Additional spectral variations, such as hardening between epochs and away from the pulsar along the jet major axis, are difficult to explain under this scenario. If the jet spectrum was observed to soften away from the pulsar, then one may naturally expect synchrotron cooling to be responsible; however, the observed hardening implies acceleration within the jet feature, unlikely for particles confined by a magnetic field. Hardening between epochs may suggest variation in the acceleration of the energetic particles, possibly due to changes in the pulsar wind and/or ISM properties. However, the lack of spectral evolution for the pulsar advocates against any such deviations at the terminal shock if, in fact, a significant portion of the pulsar emission results from the ISM-pulsar wind interaction. Furthermore, the relative faintness of the counter feature posses a challenge for the Bandiera (2008) model, as the energetic electrons should have no preference in which direction along the magnetic field they travel, though this issue may be rectified by internal anisotropies and asymmetry of the pulsar wind.
Alternatively, the B2224+65 extended X-ray features may represent the externally processed particles from jets, akin to those associated with AGNs. In this scenario, the main jet-like feature, counter feature and the Guitar Nebula represent the pulsar jets and equatorial wind outflow where the latter is responsible for the formation of the Guitar Nebula trailing the pulsar. X-ray emission is not expected in the pulsar wind forming the Nebula as the particles are not energetic enough to generate detectable X-ray synchrotron radiation. The pulsar jets, intrinsically relativistic and containing highly energetic particles, may easily escape the bow shock but are ultimately confined by the large ram-pressure generated by the pulsar’s motion. In this scenario, the spectrum of the jet-like feature would soften counter to the direction of proper motion, similar to the Bandiera (2008) model, due to synchrotron cooling. If enhancement of the X-ray emission due to the high ram-pressure contributes significantly to the X-ray emission, then spectral variation between epochs may arise from density variations in the ISM resulting in post-processing variations of the energetic particles (i.e. through their acceleration and/or synchrotron cooling efficiency). ISM variation over time has been seen previously by Chatterjee & Cordes (2004) where they found a decrease in the local density by a factor of 0.7 between 1994 and 2001; however, any such density contrast can not be directly confirmed given the current two epoch Chandra observations and the relatively static pulsar spectrum. Spatial variations of the ISM could also explain the spectral hardening away from the pulsar through similar post-processing of the energetic particles. The relative faintness of the counter feature compared to the main jet-like feature may be due to Doppler effects if they are indeed relativistic and aligned along the line of sight; specifically, if where is the bulk flow velocity and is the angle along the line of sight. Further constraints may be possible by invoking more detailed jet mechanics and synchrotron theory.
The ballistic jet scenario was deemed unlikely by Bandiera (2008), as it would predict a ratio between the length and width of the jet-like feature ( and , respectively) that is too small to match observations ( pc and pc for D) along with significant bending in the jet based on comparisons of the bow shock pressure, transverse momentum added to the jet through the ISM ram-pressure and its the initial momentum. Following Bandiera (2008), we may estimate the expected bending angle of the jet-like feature under the ballistic jet model by assuming that the pulsar imparts a constant fraction of its spin-down energy into the jet, which has a transverse size of . Balancing the transverse and initial momenta, the angle describing the bending of the jet may be given by
| (1) |
where and are the ISM ionization fraction and mean molecular weight, respectively, and is the pulsar proper motion. If we assume a fully ionized ISM composed mostly of hydrogen ( and ) with number density and dimensions for the proposed jet as taken from current observations, then such a ballistic jet should trail behind the pulsar regardless of the value of ; strongly suggesting against the jet interpretation. However, the actual jet may be very narrow ( pc), similar to AGN jets, and/or the ISM could be largely neutral in which case the expected bending angle would be significantly reduced. A largely neutral ISM would contribute little to the ram-pressure as the mean free path of neutral atoms is much larger than the width of the feature (0.1 pc for neutral hydrogen atoms with density ); however, this would impose a fine-tuning problem on the jet-ISM interaction where the number density for the small ionized fraction must still be large enough to generate the confining ram-pressure and accelerate the energetic particles to X-ray emitting energies. An additional complication of the jet interpretation is the misalignment of the spin axis (believed to be correlated with pulsar jets) and the direction of B2224+65’s proper motion; nevertheless, the method by which pulsars or their progenitors acquire such high velocities remains uncertain (see, for example, Hills, 1988; Yu & Tremaine, 2003). Certainly, additional and more detailed theoretical modeling, which may require additional observations in order to confirm apparent spectral trends, will be necessary to further test the jet and Bandiera (2008) models.
5. Summary
Using the available two epoch Chandra observations, we have presented an X-ray morphological and spectral study of the pulsar B2224+65 and its apparent extended linear X-ray-emitting features. We confirm B2224+65’s proper motion over the two epochs and find little variation in its spectrum. Additionally, we find motion in the sharp leading edge of the jet-like feature that is consistent with the proper motion of the pulsar. The jet is found to be significantly harder and wider in the second epoch than the first with spectral variation along its major and minor axis detected only marginally. These observations are somewhat consistent with magnetically confined “leaking” of energetic particles as proposed by Bandiera (2008) as well as a typical jet interpretation; although there are certain limitations to each of these scenarios. In the Bandiera (2008) model, it is difficult to explain the faintness of the counter feature as well as the spectral variations between epochs, if verified. On the other hand, it is difficult to imagine a jet being responsible for the observed emission unless the jet is actually very thin and unresolved, similar to AGN jet outflows, or if the ISM is mostly neutral, which would then impose fine-tuning of the ISM number density and ionization fraction. Detailed spectral and theoretical modeling following pulsar ejecta interacting with the ISM and/or an ambient magnetic field, including turbulent effects within the ejecta, will be necessary in order to place any further constraints on the physical origin of the jet given current observations. Additional observations may then be required for confirmation of the observed spectral trends and place definite constraints on the origin of this enigmatic X-ray feature.
References
- Bandiera (2008) Bandiera R., 2008, A&A, 490, L3
- Canny (1986) Canny J. A., 1986, IEEE Trans. Pattern Analysis and Machine Intelligence, 8, 679
- Chatterjee & Cordes (2002) Chatterjee S., Cordes J. M., 2002, ApJ, 575, 407
- Chatterjee & Cordes (2004) Chatterjee S., Cordes J. M., 2004, ApJ, 600, L51
- Cordes, Romani & Lundgren (1993) Cordes J. M., Romani R. W., Lundgren S. C., 1993, Nature, 362, 133
- Harrison, Lyne & Anderson (1993) Harrison P. A., Lyne A. G., Anderson B., 1993, MNRAS, 261, 113
- Hills (1988) Hills J. G., 1988, Nature, 331, 687
- Hui & Becker (2007) Hui C. Y., Becker W., 2007, A&A, 467, 1209
- Johnson, Dong, & Wang (2009) Johnson S. P., Dong H., Wang Q.D., 2009, MNRAS, 399, 1429
- Kargaltsev & Pavlov (2008) Kargaltsev O., Pavlov G. G., 2008, AIP Conference Proceedings, 983, 171
- Misanovic, Pavlov & Garmire (2008) Misanovic Z., Pavlov G. G., Garmire G. P., 2008, ApJ, 685, 1129
- Pavlov et al. (2003) Pavlov G. G., Teter M. A., Kargaltsev O., Sanwal D., 2003, ApJ, 591, 1157
- Romani, Cordes & Yadigaroglu (1997) Romani R. W., Cordes J. M., Yadigaroglu I.-A. 1997, ApJ, 484, L137
- Wang, Li & Begelman (1993) Wang Q. D., Li Z.-Y., Begelman M. C., 1993, Nature, 364, 127
- Wang (2004) Wang Q. D., 2004, ApJ, 612, 159
- Weisskopf et al. (2000) Weisskopf M. C., Hester J., Tennat A. F., Elsner R. F., Schulz N. S., Marshall H. L., Karovska M., Nichols J. S., Swartz D. A., Kolodzeijczak J. J., O’Dell S. L., 2000, ApJ, 536, L81
- Wong et al. (2003) Wong D. S., Cordes J. M., Chatterjee S., Zweibel E. G., Finley J. P., Romani R. W., Ulmer, M. P., 2003, IAU Symposium 214: High Energy Processes and Phenomena in Astrophysics, Eds. Li, X.D., Trimble, V. & Wang. Z.R., 135
- Yu & Tremaine (2003) Yu Q., Tremaine S., 2003, ApJ, 599, 1129
- Zavlin & Pavlov (2004) Zavlin V. E., Pavlov G. G., 2004, ApJ, 616, 452