The 6-GHz methanol multibeam maser catalogue I: Galactic Centre region, longitudes 345∘ to 6∘
Abstract
We have conducted a Galactic plane survey of methanol masers at 6668 MHz using a 7-beam receiver on the Parkes telescope. Here we present results from the first part, which provides sensitive unbiased coverage of a large region around the Galactic Centre. Details are given for 183 methanol maser sites in the longitude range 345∘ through the Galactic Centre to 6∘. Within 6∘ of the Centre, we found 88 maser sites, of which more than half (48) are new discoveries. The masers are confined to a narrow Galactic latitude range, indicative of many sources at the Galactic Centre distance and beyond, and confined to a thin disk population; there is no high latitude population that might be ascribed to the Galactic Bulge.
Within 2∘ of the Galactic Centre the maser velocities all lie between -60 and +77 , a range much smaller than the 540 range observed in CO. Elsewhere, the maser with highest positive velocity (+107 ) occurs, surprisingly, near longitude 355∘ and is probably attributable to the Galactic bar. The maser with the most negative velocity (-127 ) is near longitude 346∘, within the longitude-velocity locus of the near side of the ‘3-kpc arm’. It has the most extreme velocity of a clear population of masers associated with the near and far sides of the 3-kpc arm. Closer to the Galactic Centre the maser space density is generally low, except within 0.25 kpc of the Centre itself, the ‘Galactic Centre Zone’, where it is 50 times higher, which is hinted at by the longitude distribution, and confirmed by the unusual velocities.
keywords:
stars: formation, Masers, Surveys, Galactic Centre, ISM: molecules1 Introduction
Methanol masers at 6668-MHz are widespread in our Galaxy and are the second strongest cosmic masers known, surpassed only by water (H2O) at 22 GHz. Unlike masers of OH, H2O and SiO, they appear to occur only in association with massive young stars (Minier et al. 2003; Xu et al. 2008). A sensitive methanol survey can thus allow a unique census of massive star formation taking place in our Galaxy. Such a survey then has the potential to provide a remarkable probe of the spatial distribution and kinematics of these most influential Galactic inhabitants, the young massive stars.
This Galactic mapping will be achieved from astrometry of the masers with accuracy sufficient to allow precise distance measurements from parallax determinations; the maser site systemic velocities then allow an accompanying measure of the velocity field of the Galaxy at each position. The technique has already been validated for a handful of masers (Reid et al. 2009), and over the coming years we will eventually be able to use a network comprising hundreds of masers to fully define the Galactic velocity field.
Equally important, multi-wavelength studies around the masers (see e.g. Purcell et al. 2009) provide an opportunity to discover the key ingredients in the Galactic environment that are necessary to foster massive star formation, a subject of intense debate and current uncertainty.
The necessary foundation for these objectives is a uniformly sensitive survey of the whole Galactic Plane for 6668-MHz methanol masers, and the Methanol Multibeam (MMB) survey (Green et al. 2009a) was planned to meet these needs.
For such an extensive survey, there are competing demands for prompt release of results, and yet also requiring second or third epoch observations to provide confirmation and sub-arcsecond positions. Accordingly, as our processing is completed, we are releasing the survey in several large portions. We have already completed a survey of the Magellanic Clouds in parallel with the Galactic Survey (Green et al. 2008). We present here the first portion of the Galactic survey, which is of special interest since it includes the Galactic Centre and thus allows a new assessment of whether the Centre is unusual in its star forming activity compared to the spiral arms.
We also include remarks on some individual sources that possess especially interesting properties, such as large velocity extents, extreme intensity variability, or occurrence in compact clusters.
2 The Methanol Multibeam Survey
The detailed plans, strategy, and some sample results from the MMB survey have been described by Green et al. (2009a). In summary, for the present southern sky observations, we first use the Parkes 64-m radio telescope, equipped with a seven-beam receiver, and then complement this with accurate position measurements from the Australia Telescope Compact Array (ATCA).
The Galactic latitude coverage is . Outside this latitude range, previous surveys (see compilation of Pestalozzi et al. 2005) have found only four methanol masers within 60∘ longitude of the Galactic Centre. The complete MMB survey will cover the full Galactic plane, 0∘ l 360∘. In this paper we present the results for the Galactic longitude range from 345∘ to 6∘.
Our choice for the velocity coverage of the survey was guided by the detected range of Galactic CO emission (Dame, Hartmann & Thaddeus 2001). Our instantaneous observing bandwidth of 4 MHz corresponds to a velocity range of only 180 km s-1 at 6668 MHz but a velocity coverage wider than this is needed for regions near the Galactic Centre. To achieve full velocity coverage, the observing frequency incorporated on-line Doppler tracking (applied to the rest frequency of 6668.5192 MHz), and we made repeated observations at offset velocities where needed. All regions described here have a final coverage of at least 325 , which was increased to 610 for the region within 2∘ of the Galactic Centre (see Green et al. 2009a).
The survey sensitivity achieved is a typical rms noise level of 0.17 Jy, deeper than all previous unbiased surveys except for the northern region of Galactic plane visible to Arecibo (Pandian, Goldsmith & Deshpande 2007).
The earlier single dish surveys in the southern hemisphere have already been followed up with the ATCA (Caswell 2009 and references therein) to determine precise positions, and to determine the range of emission emanating from each site within a cluster. The efficient observing strategy used by Caswell (1997, 2009) to observe large numbers of sources can provide positional accuracy better than 0.4 arcsec rms. With a similar strategy, we have used the ATCA to refine the positions of the newly detected masers of the MMB survey. Likewise, we have made new ATCA observations of any previously known sources lacking precise positions so as to achieve our target accuracy of 0.4 arcsec rms for all maser sites in the final survey. Since the total extent of the multiple spots at a maser site is often as large as 1 arcsec, this accuracy is adequate for clear identification with associated Galactic objects of other types. For our purposes, an efficient strategy with this accuracy is most suitable, rather than one achieving an accuracy of 0.1 arcsec rms that, in the case of the ATCA, would require much longer observing times (employing individual calibrators closer to each target and observed more frequently, longer integration times, increased and more uniform hour angle coverage, and restriction to good weather conditions).
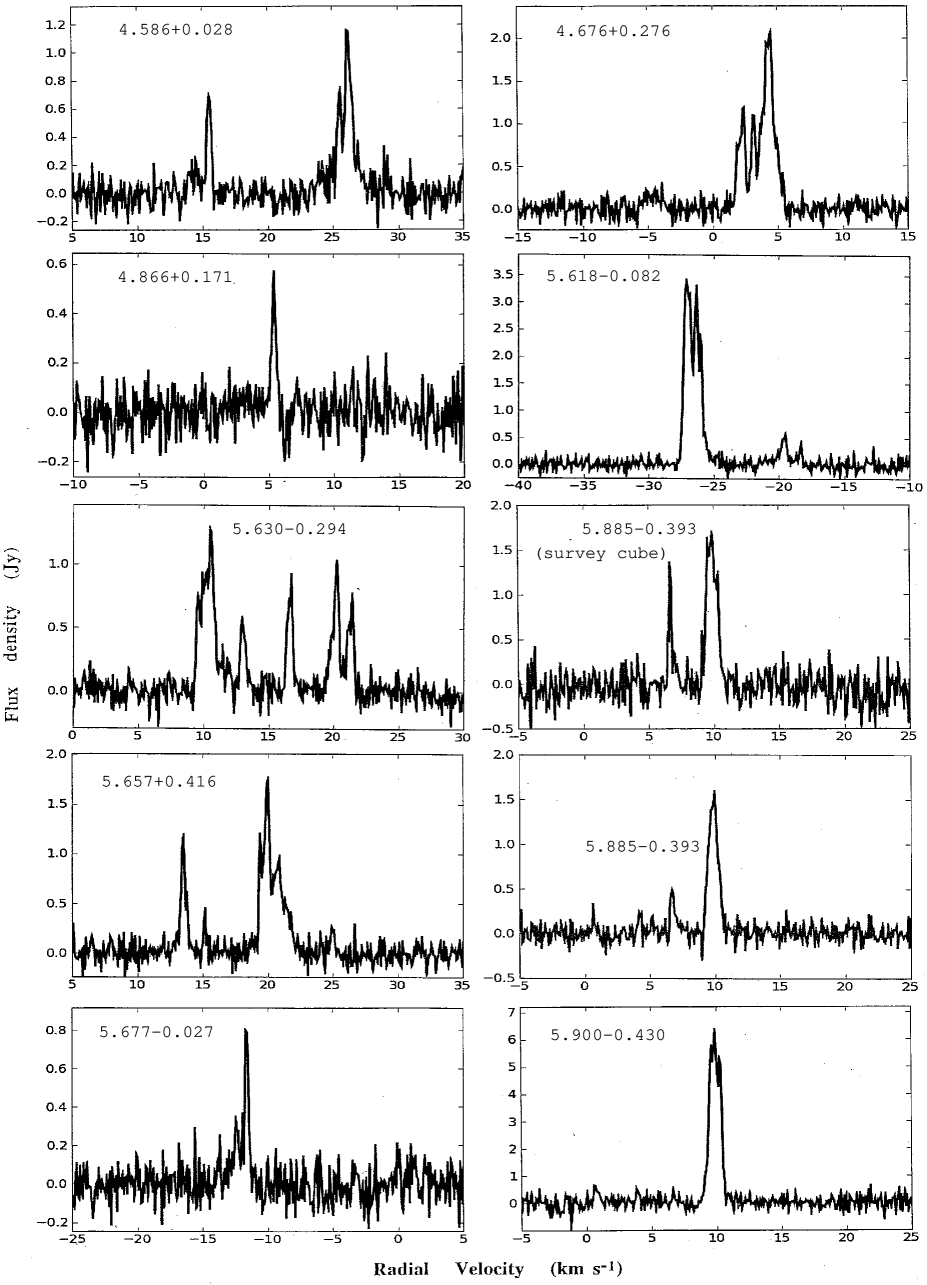
The spectra of nearly all sources from the survey have been re-measured, achieving lower noise than the survey observations, using pointed observations at Parkes in ‘MX’ mode (Green et al. 2009a). They have a typical rms noise level of 0.07 Jy and allow recognition of new weak features that in some cases reveal a velocity range of emission much wider than at first apparent. In the case of 5.885-0.393, both survey cube and MX spectra are shown, illustrating the lower noise level of the MX spectrum, and variability of the maser. We discuss in Section 4.2 the valuable information on source variability acquired through repeat observations.
3 Survey Results
The results are presented in Table 1. The first 2 columns list the Galactic longitude and latitude, commonly used here and elsewhere as a source name. They have been derived from the more precise J2000 equatorial coordinates given in columns 3 and 4. We then give velocity information, where velocities are relative to the conventional local standard of rest (LSR). Recent suggestions for modifying this LSR are discussed in Section 4.6.1. For the velocity range of the emission (lowest and highest velocity of detected emission) we have chosen to list the largest range seen at any epoch (see Section 4.5). The velocity of the peak, and the flux density of the peak as measured from our high sensitivity follow-up (MX) spectra, are then given, followed by a second velocity and peak flux density corresponding to the original measurements from the ‘survey cubes’ (SC) themselves; the latter are of lower sensitivity than the ‘MX’ values and can also differ because of variability, especially since the epochs differ by as much as 2 years in some instances (see section 4.2). Flux densities measured in the ATCA data are not given in the table, but in the case of highly variable sources, they are discussed in the notes of Section 3.1. The final column of Table 1 gives the epoch of our ATCA measurement or lists references to positions measured previously which were conducted and processed in similar fashion. Where the position has been re-determined in the current observations and corroborates the earlier value, the reference is enclosed in parentheses.
| Source Name | Equatorial Coordinates | Velocity range | MX data | Survey Cube data | Refs, epoch | ||||
| ( l, b ) | RA(2000) | Dec(2000) | (MX) | (MX) | (SC) | (SC) | |||
| ( ∘ ∘ ) | (h m s) | ( ∘ ’ ”) | () | () | (Jy) | () | (Jy) | ||
| 345.0030.223 | 17 05 10.89 | -41 29 06.2 | -25.0 | -20.1 | -23.1 | 236 | -23.1 | 193 | C2009; (2007jul19) |
| 345.0030.224 | 17 05 11.23 | -41 29 06.9 | -33.0 | -25.0 | -26.2 | 102 | -26.2 | 85.00 | C2009 |
| 345.010+1.792 | 16 56 47.58 | -40 14 25.8 | -24.0 | -16.0 | -21.0 | 268 | -22.6 | 243 | C2009 |
| 345.012+1.797 | 16 56 46.82 | -40 14 08.9 | -16.0 | -10.0 | -12.2 | 34.00 | -12.2 | 34.00 | C2009 |
| 345.1310.174 | 17 05 23.24 | -41 21 10.9 | -31.0 | -28.0 | -28.9 | 3.10 | -28.9 | 4.38 | 2007jul19 |
| 345.1980.030 | 17 04 59.49 | -41 12 45.7 | -4.0 | 1.0 | -0.5 | 2.53 | -0.6 | 2.23 | 2007jul18 |
| 345.205+0.317 | 17 03 32.87 | -40 59 46.6 | -64.1 | -59.9 | -63.5 | 0.80 | -60.5 | 1.27 | 2007jul19 |
| 345.4070.952 | 17 09 35.42 | -41 35 57.1 | -15.5 | -14.0 | -14.3 | 2.00 | -14.3 | 2.10 | C2009 |
| 345.4240.951 | 17 09 38.56 | -41 35 04.6 | -21.0 | -5.0 | -13.2 | 2.92 | -13.2 | 4.64 | C2009 |
| 345.441+0.205 | 17 04 46.87 | -40 52 38.0 | -13.0 | 2.0 | 0.9 | 2.27 | 0.9 | 2.32 | 2007jul18 |
| 345.487+0.314 | 17 04 28.24 | -40 46 28.7 | -24.0 | -21.5 | -22.6 | 2.50 | -22.6 | 2.50 | C2009 |
| 345.505+0.348 | 17 04 22.91 | -40 44 21.7 | -23.1 | -10.5 | -17.8 | 300 | -17.8 | 307 | C2009 |
| 345.498+1.467 | 16 59 42.84 | -40 03 36.1 | -15.0 | -13.2 | -14.2 | 1.20 | -13.8 | 1.02 | C2009 |
| 345.5760.225 | 17 07 01.50 | -41 01 43.4 | -127.2 | -122.0 | -126.8 | 0.64 | -126.8 | 0.65 | 2007jul22 |
| 345.8070.044 | 17 06 59.85 | -40 44 08.2 | -3.0 | -0.5 | -2.0 | 1.00 | -2.0 | 1.21 | 2007jul18 |
| 345.824+0.044 | 17 06 40.70 | -40 40 09.9 | -12.0 | -9.0 | -10.3 | 3.17 | -10.3 | 3.92 | 2007jul18 |
| 345.9490.268 | 17 08 23.64 | -40 45 21.5 | -22.5 | -21.4 | -21.9 | 1.53 | -21.9 | 1.51 | 2007jul19 |
| 345.9850.020 | 17 07 27.58 | -40 34 43.6 | -85.5 | -81.7 | -83.2 | 5.70 | -84.1 | 1.41 | 2007jul22 |
| 346.036+0.048 | 17 07 20.02 | -40 29 49.0 | -14.5 | -3.9 | -6.4 | 8.99 | -6.4 | 10.42 | 2007jul19 |
| 346.231+0.119 | 17 07 39.09 | -40 17 53.2 | -96.6 | -92.6 | -95.0 | 1.50 | -95.0 | 1.37 | 2008aug23 |
| 346.480+0.221 | 17 08 00.11 | -40 02 15.9 | -21.0 | -14.0 | -18.9 | 30.15 | -18.9 | 32.02 | C2009 |
| 346.481+0.132 | 17 08 22.72 | -40 05 25.6 | -11.6 | -4.9 | -5.5 | 2.10 | -5.6 | 1.48 | C2009 |
| 346.517+0.117 | 17 08 33.20 | -40 04 14.3 | -3.0 | 1.0 | -1.7 | 0.30 | -1.7 | 0.30 | C2009 |
| 346.522+0.085 | 17 08 42.29 | -40 05 07.8 | 4.7 | 6.1 | 5.7 | 1.90 | 5.7 | 1.47 | C2009 |
| 347.230+0.016 | 17 11 11.18 | -39 33 27.2 | -69.9 | -68.0 | -68.9 | 0.86 | -68.9 | 1.19 | 2007jul22 |
| 347.583+0.213 | 17 11 26.72 | -39 09 22.5 | -103.8 | -96.0 | -102.3 | 3.18 | -102.5 | 3.18 | C2009 |
| 347.628+0.149 | 17 11 50.92 | -39 09 29.2 | -98.9 | -95.0 | -96.5 | 19.20 | -96.5 | 18.98 | C2009 |
| 347.631+0.211 | 17 11 36.05 | -39 07 07.0 | -94.0 | -89.0 | -91.9 | 5.81 | -91.9 | 7.17 | C2009 |
| 347.817+0.018 | 17 12 58.05 | -39 04 56.1 | -26.0 | -22.8 | -24.1 | 2.52 | -24.0 | 2.85 | C2009 |
| 347.863+0.019 | 17 13 06.23 | -39 02 40.0 | -37.8 | -28.0 | -34.7 | 6.38 | -34.8 | 6.40 | C2009 |
| 347.902+0.052 | 17 13 05.11 | -38 59 35.5 | -31.5 | -27.0 | -27.4 | 5.37 | -27.5 | 5.46 | C2009 |
| 348.027+0.106 | 17 13 14.12 | -38 51 38.8 | -122.8 | -114.3 | -121.2 | 3.07 | -121.3 | 4.54 | 2007jul22 |
| 348.195+0.768 | 17 11 00.20 | -38 20 05.5 | -2.8 | -0.2 | -0.8 | 4.55 | -0.8 | 4.86 | 2007jul18 |
| 348.5500.979 | 17 19 20.41 | -39 03 51.6 | -19.0 | -7.0 | -10.6 | 41.10 | -10.6 | 36.44 | C2009 |
| 348.5500.979n | 17 19 20.45 | -39 03 49.4 | -23.0 | -14.0 | -20.0 | 22.60 | -20.0 | 18.60 | C2009 |
| 348.5790.920 | 17 19 10.61 | -39 00 24.2 | -16.0 | -14.0 | -15.1 | 0.32 | -15.0 | 0.30 | C2009 |
| 348.6171.162 | 17 20 18.65 | -39 06 50.8 | -21.5 | -8.5 | -11.4 | 47.59 | -11.4 | 44.26 | 2007jul18 |
| 348.654+0.244 | 17 14 32.37 | -38 16 16.8 | 16.5 | 17.5 | 16.9 | 0.82 | 16.9 | 0.99 | 2007jul18 |
| 348.7230.078 | 17 16 04.77 | -38 24 08.8 | 9.0 | 12.0 | 11.5 | 2.58 | 11.5 | 2.25 | 2007jul18 |
| 348.7031.043 | 17 20 04.06 | -38 58 30.9 | -17.5 | -2.5 | -3.5 | 65.00 | -3.5 | 62.00 | C2009 |
| 348.7271.037 | 17 20 06.54 | -38 57 09.1 | -12.0 | -6.0 | -7.4 | 80.78 | -7.4 | 72.85 | C2009 |
| 348.884+0.096 | 17 15 50.13 | -38 10 12.4 | -79.0 | -73.0 | -74.5 | 12.18 | -74.5 | 12.86 | C2009 |
| 348.8920.180 | 17 17 00.23 | -38 19 28.9 | 1.0 | 2.0 | 1.5 | 2.70 | 1.5 | 2.44 | C2009 |
| 349.0670.017 | 17 16 50.74 | -38 05 14.3 | 6.0 | 16.0 | 11.6 | 2.30 | 11.6 | 2.43 | C2009 |
| 349.092+0.105 | 17 16 24.74 | -37 59 47.2 | -78.0 | -74.0 | -76.6 | 33.30 | -76.5 | 23.09 | C2009 |
| 349.092+0.106 | 17 16 24.59 | -37 59 45.8 | -83.0 | -78.0 | -81.5 | 9.90 | -81.5 | 10.40 | C2009 |
| 349.151+0.021 | 17 16 55.88 | -37 59 47.9 | 14.1 | 25.0 | 14.6 | 3.36 | 14.6 | 3.33 | 2007jul18 |
| 349.5790.679 | 17 21 05.44 | -38 02 54.7 | -26.0 | -24.0 | -25.0 | 1.90 | -25.0 | 5.86 | 2007jul19 |
| 349.799+0.108 | 17 18 27.74 | -37 25 03.5 | -65.5 | -57.4 | -64.7 | 3.00 | -62.4 | 2.11 | 2007jul22 |
| 349.884+0.231 | 17 18 12.37 | -37 16 40.0 | 13.5 | 17.5 | 16.2 | 6.96 | 16.2 | 6.42 | 2007jul18 |
| 350.0111.342 | 17 25 06.54 | -38 04 00.7 | -28.0 | -25.0 | -25.8 | 2.38 | -25.8 | 2.02 | C2009 |
| 350.015+0.433 | 17 17 45.45 | -37 03 11.9 | -37.0 | -29.0 | -30.3 | 7.20 | -30.4 | 9.02 | C2009 |
| 350.104+0.084 | 17 19 26.68 | -37 10 53.1 | -69.0 | -67.5 | -68.1 | 9.90 | -68.1 | 14.60 | C2009 |
| 350.105+0.083 | 17 19 27.01 | -37 10 53.3 | -76.0 | -61.0 | -74.1 | 13.60 | -74.1 | 15.21 | C2009 |
| 350.116+0.084 | 17 19 28.83 | -37 10 18.8 | -69.0 | -67.0 | -68.0 | 10.30 | -68.0 | 9.50 | C2009 |
| 350.116+0.220 | 17 18 55.11 | -37 05 38.1 | 3.0 | 5.0 | 4.2 | 2.78 | 4.2 | 2.31 | 2007jul18 |
| 350.189+0.003 | 17 20 01.41 | -37 09 30.7 | -65.0 | -62.0 | -62.4 | 1.07 | -62.4 | 1.30 | 2007nov26 |
| 350.299+0.122 | 17 19 50.87 | -36 59 59.9 | -70.0 | -61.0 | -62.1 | 31.34 | -62.2 | 31.17 | C2009; (2007jul19) |
| 350.340+0.141 | 17 19 53.43 | -36 57 18.8 | -60.0 | -57.5 | -58.4 | 2.50 | -58.4 | 2.40 | 2007jul19 |
| 350.344+0.116 | 17 20 00.03 | -36 58 00.1 | -66.0 | -55.0 | -65.4 | 19.90 | -65.4 | 18.90 | C2009; (2007jul19) |
| 350.3560.068 | 17 20 47.55 | -37 03 42.0 | -68.5 | -66.0 | -67.6 | 1.44 | -67.6 | 1.40 | 2007jul22 |
| Source Name | Equatorial Coordinates | Velocity range | MX data | Survey Cube data | Refs, epoch | ||||
| ( l, b ) | RA(2000) | Dec(2000) | (MX) | (MX) | (SC) | (SC) | |||
| ( ∘ ∘ ) | (h m s) | ( ∘ ’ ”) | () | () | (Jy) | () | (Jy) | ||
| 350.470+0.029 | 17 20 43.24 | -36 54 46.6 | -11.0 | -5.5 | -6.3 | 1.44 | -6.3 | 1.00 | 2007nov26 |
| 350.5200.350 | 17 22 25.32 | -37 05 13.4 | -25.0 | -22.0 | -24.6 | 1.67 | -24.6 | 1.04 | 2007jul19 |
| 350.6860.491 | 17 23 28.63 | -37 01 48.8 | -15.0 | -13.0 | -13.7 | 17.85 | -13.8 | 19.38 | C2009 |
| 350.776+0.138 | 17 21 08.58 | -36 35 58.8 | 34.5 | 39.0 | 38.7 | 0.65 | 38.7 | 0.91 | 2007jul21 |
| 351.161+0.697 | 17 19 57.50 | -35 57 52.8 | -7.0 | -2.0 | -5.2 | 17.02 | -5.2 | 12.02 | C2009 |
| 351.242+0.670 | 17 20 17.84 | -35 54 46.0 | 2.0 | 3.0 | 2.5 | 0.74 | 2.5 | 2.40 | 2007jul21; (CP2008) |
| 351.251+0.652 | 17 20 23.87 | -35 54 57.0 | -7.5 | -6.0 | -7.1 | 0.99 | -7.1 | 1.30 | 2007jul21 |
| 351.3820.181 | 17 24 09.58 | -36 16 49.3 | -69.0 | -58.0 | -59.7 | 19.66 | -59.8 | 16.85 | 2007jul22 |
| 351.417+0.645 | 17 20 53.37 | -35 47 01.2 | -12.0 | -6.0 | -10.4 | 3423 | -10.4 | 3506 | C2009 |
| 351.417+0.646 | 17 20 53.18 | -35 46 59.3 | -12.0 | -7.0 | -11.1 | 1840 | -11.2 | 1816 | C2009 |
| 351.445+0.660 | 17 20 54.61 | -35 45 08.6 | -14.0 | 1.0 | -7.1 | 129 | -7.1 | 110 | C2009 |
| 351.5810.353 | 17 25 25.12 | -36 12 46.1 | -100.0 | -88.0 | -94.2 | 47.50 | -94.2 | 47.46 | C2009 |
| 351.611+0.172 | 17 23 21.25 | -35 53 32.6 | -46.0 | -31.5 | -43.7 | 4.2 | -43.7 | 4.1 | 2007jul19 |
| 351.688+0.171 | 17 23 34.52 | -35 49 46.3 | -47.5 | -35.0 | -36.1 | 41.54 | -36.1 | 42.14 | 2007jul19 |
| 351.7750.536 | 17 26 42.57 | -36 09 17.6 | -9.0 | 3.0 | 1.3 | 231 | 1.3 | 311 | C2009 |
| 352.083+0.167 | 17 24 41.22 | -35 30 18.6 | -68.2 | -63.6 | -66.0 | 6.77 | -66.0 | 5.77 | C2009 |
| 352.111+0.176 | 17 24 43.56 | -35 28 38.4 | -61.0 | -50.0 | -54.8 | 7.46 | -54.8 | 5.93 | C2009 |
| 352.1330.944 | 17 29 22.32 | -36 05 00.2 | -18.8 | -5.6 | -7.7 | 16.32 | -7.8 | 15.66 | C2009 |
| 352.5170.155 | 17 27 11.34 | -35 19 32.4 | -52.0 | -49.0 | -51.2 | 9.69 | -51.3 | 9.42 | 2007jul22; (C2009) |
| 352.5250.158 | 17 27 13.42 | -35 19 15.5 | -62.0 | -52.0 | -53.0 | 0.70 | -53.0 | 0.70 | C2009 |
| 352.5840.185 | 17 27 29.58 | -35 17 14.6 | -92.6 | -79.7 | -85.7 | 6.38 | -85.6 | 3.73 | 2007jul22 |
| 352.6040.225 | 17 27 42.73 | -35 17 34.2 | -85.0 | -81.0 | -81.7 | 3.30 | -81.8 | 1.80 | 2007may22 |
| 352.6241.077 | 17 31 15.31 | -35 44 47.7 | -2.0 | 7.0 | 5.8 | 20.00 | 5.8 | 21.00 | C2009 |
| 352.6301.067 | 17 31 13.91 | -35 44 08.7 | -8.0 | -2.0 | -2.9 | 183 | -3.0 | 137 | C2009 |
| 352.8550.201 | 17 28 17.59 | -35 04 12.9 | -54.1 | -50.1 | -51.3 | 1.29 | -51.4 | 1.45 | 2007jul19 |
| 353.2160.249 | 17 29 27.80 | -34 47 47.3 | -25.0 | -15.0 | -22.9 | 5.14 | -23.0 | 1.10 | 2007jul19 |
| 353.273+0.641 | 17 26 01.58 | -34 15 15.4 | -7.0 | -3.0 | -4.4 | 8.30 | -4.4 | 12.70 | 2007jul21; (C2009) |
| 353.3630.166 | 17 29 31.40 | -34 37 40.3 | -80.1 | -78.3 | -79.0 | 2.79 | -79.0 | 2.94 | 2007jul22 |
| 353.3700.091 | 17 29 14.27 | -34 34 50.2 | -56.0 | -43.4 | -44.7 | 1.35 | -45.7 | 1.13 | 2007jul19 |
| 353.378+0.438 | 17 27 07.59 | -34 16 50.5 | -16.5 | -14.0 | -15.7 | 0.97 | -15.7 | 1.06 | 2007nov26 |
| 353.4100.360 | 17 30 26.18 | -34 41 45.6 | -23.0 | -19.0 | -20.3 | 116 | -20.4 | 109 | C2009 |
| 353.4290.090 | 17 29 23.48 | -34 31 50.3 | -63.9 | -45.0 | -61.8 | 13.39 | -61.8 | 13.00 | 2007jul22 |
| 353.464+0.562 | 17 26 51.53 | -34 08 25.7 | -52.7 | -48.7 | -50.3 | 11.88 | -50.3 | 12.84 | C2009 |
| 353.5370.091 | 17 29 41.25 | -34 26 28.4 | -59.0 | -54.0 | -56.6 | 2.51 | -56.6 | 2.31 | 2007jul19 |
| 354.2060.038 | 17 31 15.01 | -33 51 15.1 | -37.5 | -35.0 | -37.1 | 1.11 | -37.1 | 1.43 | 2007feb05 |
| 354.3080.110 | 17 31 48.56 | -33 48 29.1 | 11.0 | 19.5 | 18.8 | 3.44 | 18.7 | 3.89 | 2007feb05 |
| 354.496+0.083 | 17 31 31.77 | -33 32 44.0 | 17.5 | 27.5 | 27.0 | 8.41 | 26.9 | 7.78 | 2007feb05 |
| 354.615+0.472 | 17 30 17.13 | -33 13 55.1 | -27.0 | -12.5 | -24.4 | 166 | -24.3 | 185 | 2007feb05; (C2009) |
| 354.701+0.299 | 17 31 12.06 | -33 15 16.7 | 98.0 | 104.0 | 102.8 | 1.29 | 102.7 | 1.20 | 2007feb05 |
| 354.724+0.300 | 17 31 15.55 | -33 14 05.7 | 91.0 | 95.0 | 93.9 | 12.58 | 93.8 | 12.16 | 2007jul22: (C2009) |
| 355.1840.419 | 17 35 20.49 | -33 14 28.6 | -2.0 | -0.5 | -1.4 | 1.35 | 2007feb05 | ||
| 355.343+0.148 | 17 33 28.84 | -32 48 00.2 | 4.0 | 7.0 | 5.8 | 1.24 | 5.8 | 1.20 | 2007jul21; (2009) |
| 355.344+0.147 | 17 33 29.06 | -32 47 58.9 | 19.0 | 21.0 | 19.9 | 10.17 | 19.9 | 10.49 | 2007jul21; (2009) |
| 355.346+0.149 | 17 33 28.91 | -32 47 49.5 | 9.0 | 12.5 | 10.5 | 7.39 | 9.9 | 9.16 | 2007jul21; (2009) |
| 355.5380.105 | 17 34 59.60 | -32 46 22.7 | -3.5 | 5.0 | 3.8 | 1.25 | 3.8 | 1.50 | 2007feb05 |
| 355.5450.103 | 17 35 00.28 | -32 45 58.1 | -31.0 | -27.5 | -28.2 | 1.22 | -28.2 | 1.25 | 2007feb05 |
| 355.642+0.398 | 17 33 15.40 | -32 24 46.8 | -9.0 | -6.9 | -7.9 | 1.44 | -7.9 | 1.90 | 2007feb05 |
| 355.666+0.374 | 17 33 24.92 | -32 24 21.1 | -4.5 | 0.6 | -3.3 | 2.47 | -3.4 | 1.93 | 2007feb05 |
| 356.0540.095 | 17 36 16.55 | -32 20 02.7 | 15.6 | 17.7 | 16.7 | 0.52 | 16.9 | 0.76 | 2007jul21 |
| 356.6620.263 | 17 38 29.16 | -31 54 38.8 | -57.0 | -44.0 | -53.8 | 8.38 | -53.8 | 10.08 | C2009 |
| 357.5580.321 | 17 40 57.19 | -31 10 59.3 | -5.5 | 0.0 | -3.9 | 2.16 | -3.9 | 1.95 | 2007jul21; 2006mar31 |
| 357.5590.321 | 17 40 57.33 | -31 10 56.9 | 15.0 | 18.0 | 16.2 | 2.01 | 16.2 | 2.00 | 2007jul21 |
| 357.9220.337 | 17 41 54.94 | -30 52 55.1 | -5.5 | -4.0 | -4.6 | 0.97 | -4.9 | 1.50 | 2006mar31 |
| 357.9240.337 | 17 41 55.17 | -30 52 50.2 | -4.5 | 3.0 | -2.1 | 2.34 | -2.1 | 3.37 | 2006mar31 |
| 357.9650.164 | 17 41 20.14 | -30 45 14.4 | -9.0 | 3.0 | -8.6 | 2.74 | -8.8 | 3.10 | C2009 |
| 357.9670.163 | 17 41 20.26 | -30 45 06.9 | -6.0 | 0.0 | -3.1 | 47.50 | -4.2 | 55.14 | C2009 |
| 358.2632.061 | 17 49 37.63 | -31 29 18.0 | 0.5 | 6.0 | 5.0 | 17.20 | C2009 | ||
| 358.3710.468 | 17 43 31.95 | -30 34 10.7 | -1.0 | 13.0 | 1.3 | 44.01 | 1.2 | 46.87 | C2009 |
| 358.3860.483 | 17 43 37.83 | -30 33 51.1 | -7.0 | -5.0 | -6.0 | 6.95 | -6.0 | 11.60 | C2009 |
| 358.4600.391 | 17 43 26.76 | -30 27 11.3 | -0.5 | 4.0 | 1.3 | 47.73 | 1.2 | 25.40 | 2006mar31 |
| 358.4600.393 | 17 43 27.24 | -30 27 14.6 | -8.5 | 6.0 | -7.3 | 11.19 | -7.5 | 14.50 | 2006mar31 |
| Source Name | Equatorial Coordinates | Velocity range | MX data | Survey Cube data | Refs, epoch | ||||
| ( l, b ) | RA(2000) | Dec(2000) | (MX) | (MX) | (SC) | (SC) | |||
| ( ∘ ∘ ) | (h m s) | ( ∘ ’ ”) | () | () | (Jy) | () | (Jy) | ||
| 358.7210.126 | 17 43 02.31 | -30 05 29.9 | 8.8 | 13.9 | 10.6 | 2.99 | 10.5 | 3.64 | 2006mar31 |
| 358.8090.085 | 17 43 05.40 | -29 59 45.8 | -60.3 | -50.5 | -56.2 | 6.86 | -56.2 | 11.99 | 2006mar31 |
| 358.8410.737 | 17 45 44.29 | -30 18 33.6 | -30.0 | -17.0 | -20.7 | 10.94 | -20.6 | 13.11 | 2006mar31 |
| 358.906+0.106 | 17 42 34.57 | -29 48 46.8 | -20.5 | -16.5 | -18.1 | 1.70 | -18.1 | 2.39 | 2006mar31 |
| 358.9310.030 | 17 43 10.02 | -29 51 45.8 | -22.0 | -14.5 | -15.9 | 5.90 | -15.9 | 10.06 | 2006mar31 |
| 358.980+0.084 | 17 42 50.44 | -29 45 40.4 | 5.0 | 7.0 | 6.2 | 0.20 | 6.2 | 1.6 | 2007nov25 |
| 359.138+0.031 | 17 43 25.67 | -29 39 17.3 | -7.0 | 1.0 | -3.9 | 15.42 | -3.9 | 19.61 | C2009 |
| 359.4360.104 | 17 44 40.60 | -29 28 16.0 | -53.0 | -45.0 | -47.8 | 73.50 | -46.7 | 59.70 | C2009 |
| 359.4360.102 | 17 44 40.21 | -29 28 12.5 | -58.0 | -54.0 | -53.3 | 1.65 | -53.6 | 1.50 | C2009 |
| 359.6150.243 | 17 45 39.09 | -29 23 30.0 | 14.0 | 27.0 | 19.3 | 38.62 | 22.6 | 71.70 | C2009 |
| 359.938+0.170 | 17 44 48.55 | -28 53 59.4 | -1.5 | 0.2 | -0.5 | 2.34 | -0.5 | 1.56 | 2007jul21 |
| 359.9700.457 | 17 47 20.17 | -29 11 59.4 | 20.0 | 24.1 | 23.0 | 2.39 | 23.8 | 2.24 | C2009 |
| 0.092+0.663 | 17 48 25.90 | -29 12 05.9 | 10.0 | 25.0 | 23.8 | 18.86 | 23.5 | 24.80 | 2006mar31 |
| 0.1670.446 | 17 47 45.46 | -29 01 29.3 | 9.5 | 17.0 | 13.8 | 1.33 | 13.8 | 4.44 | 2006mar31 |
| 0.2120.001 | 17 46 07.63 | -28 45 20.9 | 41.0 | 50.5 | 49.5 | 3.32 | 49.3 | 3.47 | C2009 |
| 0.3150.201 | 17 47 09.13 | -28 46 15.7 | 14.0 | 27.0 | 19.4 | 62.60 | 19.4 | 72.16 | C2009 |
| 0.3160.201 | 17 47 09.33 | -28 46 16.0 | 20.0 | 22.0 | 21.1 | 0.58 | 21.0 | 0.60 | C2009 |
| 0.376+0.040 | 17 46 21.41 | -28 35 40.0 | 35.0 | 40.0 | 37.1 | 0.62 | 37.0 | 2.32 | C2009 |
| 0.4090.504 | 17 48 33.48 | -28 50 52.5 | 24.5 | 27.0 | 25.4 | 2.61 | 25.3 | 2.77 | 2007jul31 |
| 0.4750.010 | 17 46 47.07 | -28 32 06.9 | 23.0 | 31.0 | 28.8 | 3.14 | 28.8 | 3.43 | 2006mar31 (C2009) |
| 0.496+0.188 | 17 46 03.96 | -28 24 52.8 | -12.0 | 2.0 | 0.9 | 24.51 | 0.8 | 32.14 | C2009 |
| 0.5460.852 | 17 50 14.35 | -28 54 31.1 | 8.0 | 20.0 | 11.8 | 61.92 | 11.8 | 62.83 | C2009 |
| 0.6450.042 | 17 47 18.65 | -28 24 25.0 | 46.0 | 53.0 | 49.5 | 54.39 | 49.5 | 76.08 | HW1995 |
| 0.6470.055 | 17 47 22.04 | -28 24 42.6 | 49.0 | 52.0 | 51.0 | HW1995 (2.0 Jy) | |||
| 0.6510.049 | 17 47 21.12 | -28 24 18.2 | 46.0 | 49.0 | 48.3 | 21.45 | 48.0 | 24.00 | HW1995 |
| 0.6570.041 | 17 47 20.05 | -28 23 46.5 | 48.0 | 56.0 | 49.9 | HW1995 (1.8 Jy) | |||
| 0.6650.036 | 17 47 20.04 | -28 23 12.8 | 58.0 | 62.0 | 60.4 | 2.61 | 60.4 | 6.00 | HW1995 |
| 0.6660.029 | 17 47 18.64 | -28 22 54.6 | 68.0 | 73.0 | 70.5 | 34.38 | 70.0 | 32.90 | HW1995 |
| 0.6670.034 | 17 47 19.87 | -28 23 01.3 | 49.0 | 56.0 | 55.0 | HW1995 (0.4 Jy) | |||
| 0.6720.031 | 17 47 20.04 | -28 22 41.3 | 55.0 | 59.0 | 58.2 | 7.29 | 58.2 | 9.00 | HW1995 |
| 0.6730.029 | 17 47 19.54 | -28 22 32.6 | 65.5 | 66.5 | 66.0 | HW1995 (0.4 Jy) | |||
| 0.6770.025 | 17 47 19.28 | -28 22 14.8 | 70.0 | 77.0 | 73.3 | 4.87 | 73.3 | 4.00 | HW1995 |
| 0.6950.038 | 17 47 24.74 | -28 21 43.6 | 64.0 | 75.0 | 68.6 | 32.33 | 68.6 | 36.41 | HW1995 |
| 0.836+0.184 | 17 46 52.86 | -28 07 34.8 | 2.0 | 5.0 | 3.5 | 6.64 | 3.6 | 8.99 | C2009 |
| 1.0080.237 | 17 48 55.29 | -28 11 47.9 | 1.0 | 7.0 | 1.6 | 13.57 | 1.6 | 15.23 | 2006mar31 |
| 1.1470.124 | 17 48 48.53 | -28 01 11.2 | -20.5 | -14.0 | -15.3 | 3.01 | -15.3 | 2.97 | 2007jul19; (W98) |
| 1.329+0.150 | 17 48 10.31 | -27 43 20.7 | -13.5 | -11.0 | -12.2 | 2.08 | -12.0 | 1.56 | 2006mar31 |
| 1.7190.088 | 17 49 59.84 | -27 30 36.9 | -9.0 | -4.5 | -8.1 | 7.82 | -8.0 | 9.81 | 2006mar31 |
| 2.143+0.009 | 17 50 36.14 | -27 05 46.5 | 54.0 | 65.0 | 62.6 | 7.08 | 62.7 | 6.70 | C2009 |
| 2.5210.220 | 17 52 21.17 | -26 53 21.1 | -7.5 | 5.0 | -6.1 | 1.02 | 4.2 | 0.70 | 2006dec04 |
| 2.536+0.198 | 17 50 46.47 | -26 39 45.3 | 2.0 | 20.5 | 3.1 | 29.40 | 3.2 | 36.41 | C2009 |
| 2.5910.029 | 17 51 46.69 | -26 43 51.2 | -9.5 | -4.0 | -8.3 | 1.76 | -8.2 | 1.69 | 2006dec04 |
| 2.615+0.134 | 17 51 12.30 | -26 37 37.2 | 93.5 | 104.0 | 94.1 | 1.22 | 94.5 | 1.10 | 2006dec04 |
| 2.703+0.040 | 17 51 45.98 | -26 35 56.7 | 91.5 | 98.0 | 93.5 | 8.97 | 93.6 | 9.00 | 2006dec04 |
| 3.253+0.018 | 17 53 05.96 | -26 08 13.0 | -1.5 | 3.5 | 2.2 | 3.54 | 2.2 | 3.70 | 2006dec04 |
| 3.3120.399 | 17 54 50.11 | -26 17 51.5 | 0.0 | 10.0 | 0.4 | 1.17 | 0.5 | 0.88 | 2006dec04 |
| 3.4420.348 | 17 54 56.11 | -26 09 35.6 | -35.5 | -34.5 | -35.1 | 1.06 | -35.0 | 0.66 | 2007jul19 |
| 3.5020.200 | 17 54 30.06 | -26 01 59.4 | 43.0 | 45.5 | 43.9 | 1.57 | 43.9 | 2.02 | 2006dec04 |
| 3.910+0.001 | 17 54 38.75 | -25 34 44.8 | 15.0 | 24.5 | 17.8 | 5.04 | 17.9 | 5.10 | C2009 |
| 4.393+0.079 | 17 55 25.77 | -25 07 23.6 | 0.0 | 9.0 | 1.9 | 6.74 | 2.0 | 7.67 | 2006dec04 |
| 4.434+0.129 | 17 55 19.74 | -25 03 44.8 | -1.5 | 8.0 | -1.0 | 3.29 | -0.9 | 4.59 | 2006dec04 |
| 4.5690.079 | 17 56 25.30 | -25 03 03.7 | 9.0 | 10.0 | 9.5 | 0.44 | 9.5 | 0.61 | 2006dec04 |
| 4.586+0.028 | 17 56 03.23 | -24 58 55.9 | 15.0 | 27.0 | 26.1 | 1.16 | 26.3 | 0.96 | 2006dec04 |
| 4.676+0.276 | 17 55 18.34 | -24 46 45.3 | -5.5 | 6.0 | 4.5 | 2.06 | 4.4 | 2.48 | 2006dec04 |
| 4.8660.171 | 17 57 25.96 | -24 50 24.4 | 5.0 | 6.0 | 5.4 | 0.56 | 5.4 | 0.64 | 2008aug19; (2008jan23) |
| 5.6180.082 | 17 58 44.78 | -24 08 40.1 | -28.0 | -18.5 | -27.1 | 3.37 | -27.0 | 3.42 | 2006dec04 |
| 5.6300.294 | 17 59 34.60 | -24 14 23.7 | 9.0 | 22.0 | 10.5 | 1.28 | 10.6 | 1.31 | 2006dec04 |
| 5.657+0.416 | 17 56 56.53 | -23 51 42.0 | 13.0 | 22.0 | 20.0 | 1.75 | 20.1 | 1.90 | 2006dec04 |
| 5.6770.027 | 17 58 39.98 | -24 03 57.2 | -14.5 | -11.0 | -11.7 | 0.79 | -11.5 | 0.99 | 2006dec04 |
| 5.8850.393 | 18 00 30.65 | -24 04 03.4 | 6.0 | 7.5 | 6.7 | 0.48 | 6.7 | 1.30 | 2006dec04 |
| 5.9000.430 | 18 00 40.86 | -24 04 20.8 | 0.0 | 10.6 | 10.4 | 6.20 | 10.4 | 6.20 | C2009 |
The high spatial resolution of the ATCA (beam width of a few arcsec) has allowed us to recognise multiple sites that are blended together in the beam of the Parkes telescope used for the basic survey. As discussed by Caswell (2009), the typical individual maser site with its own exciting star can have maser spots spread over an extent of up to 2 arcsec; when maser spots are separated somewhat more than this, it is difficult to distinguish between a single site which is merely slightly more extended than usual, and a very small cluster of distinct sites, each with its own exciting star. Where sites close to each other have been previously studied (e.g. Caswell 2009) and been regarded as separate, we retain that interpretation. We have applied similar criteria to the new masers: maser spots arising from a region up to about 2 arcsec in size are regarded as a single site; notes to the sources indicate when the distinction is uncertain. Where the Parkes spectrum is a blend of sites, the appropriate velocity range for each site has been determined from the ATCA observations.
In addition to the sources detected in the main survey, we also list for completeness a further five masers in this longitude range that are reliably documented but were not detectable in our survey; for three of them we have made new measurements of the spectra, homogeneous with those of the other sources. One of these sources (358.263-2.061) was absent from the initial survey because it lies just outside the survey latitude range; two others (346.517+0.117 and 348.579-0.920) were below the survey noise limit but could be recognised in the longer integration MX follow up observations. The remaining two sources (0.667-0.034 and 0.673-0.029, in the Sgr 2 complex) are not only weak but also very confused and we rely on the published report (Houghton & Whiteoak 1995) based on an unusually deep survey. As a result of these additions, in the longitude range presented here, we believe that there are no previously reported masers that are not accounted for by the entries of Table 1.
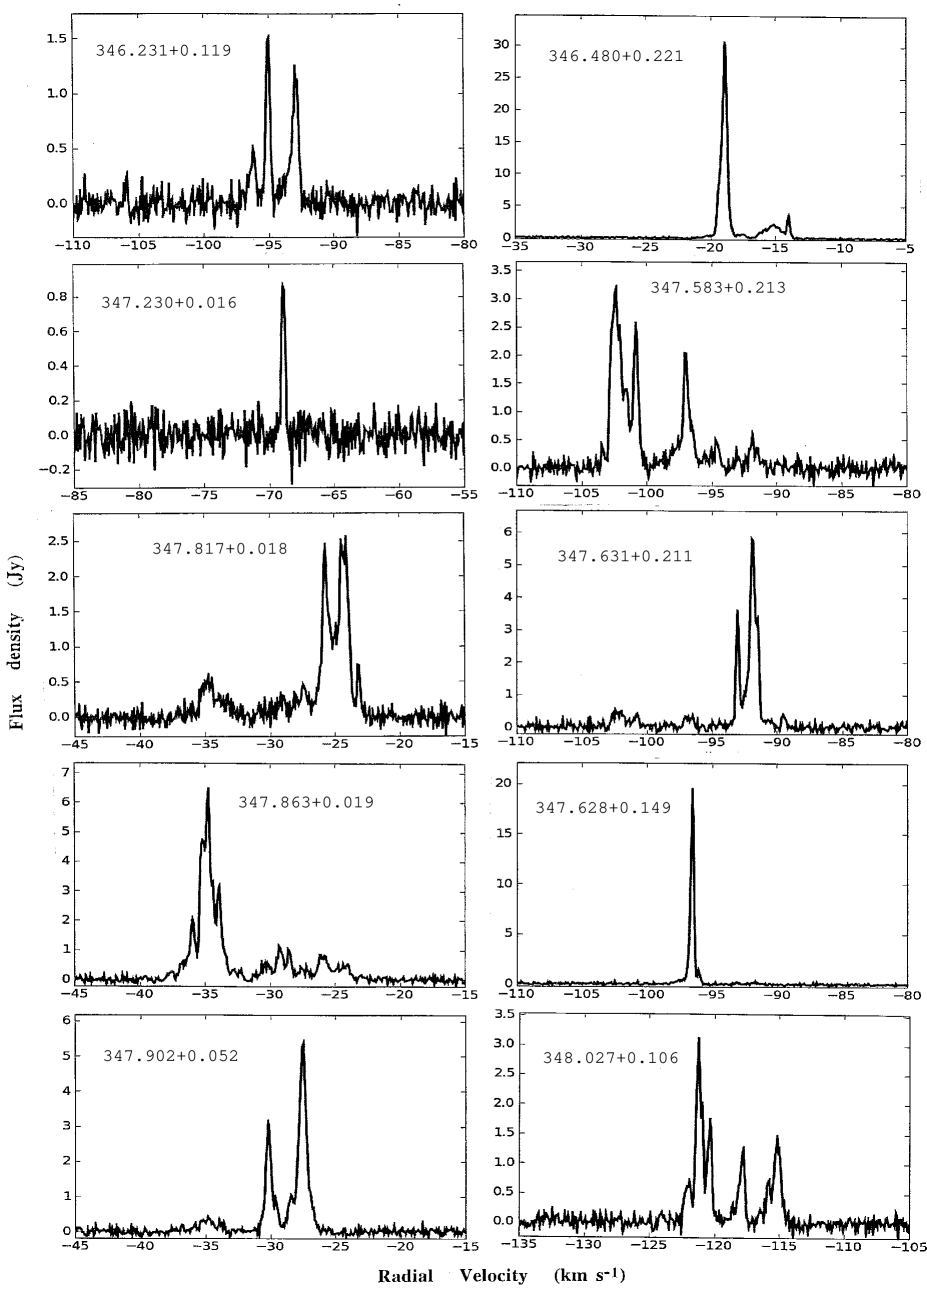
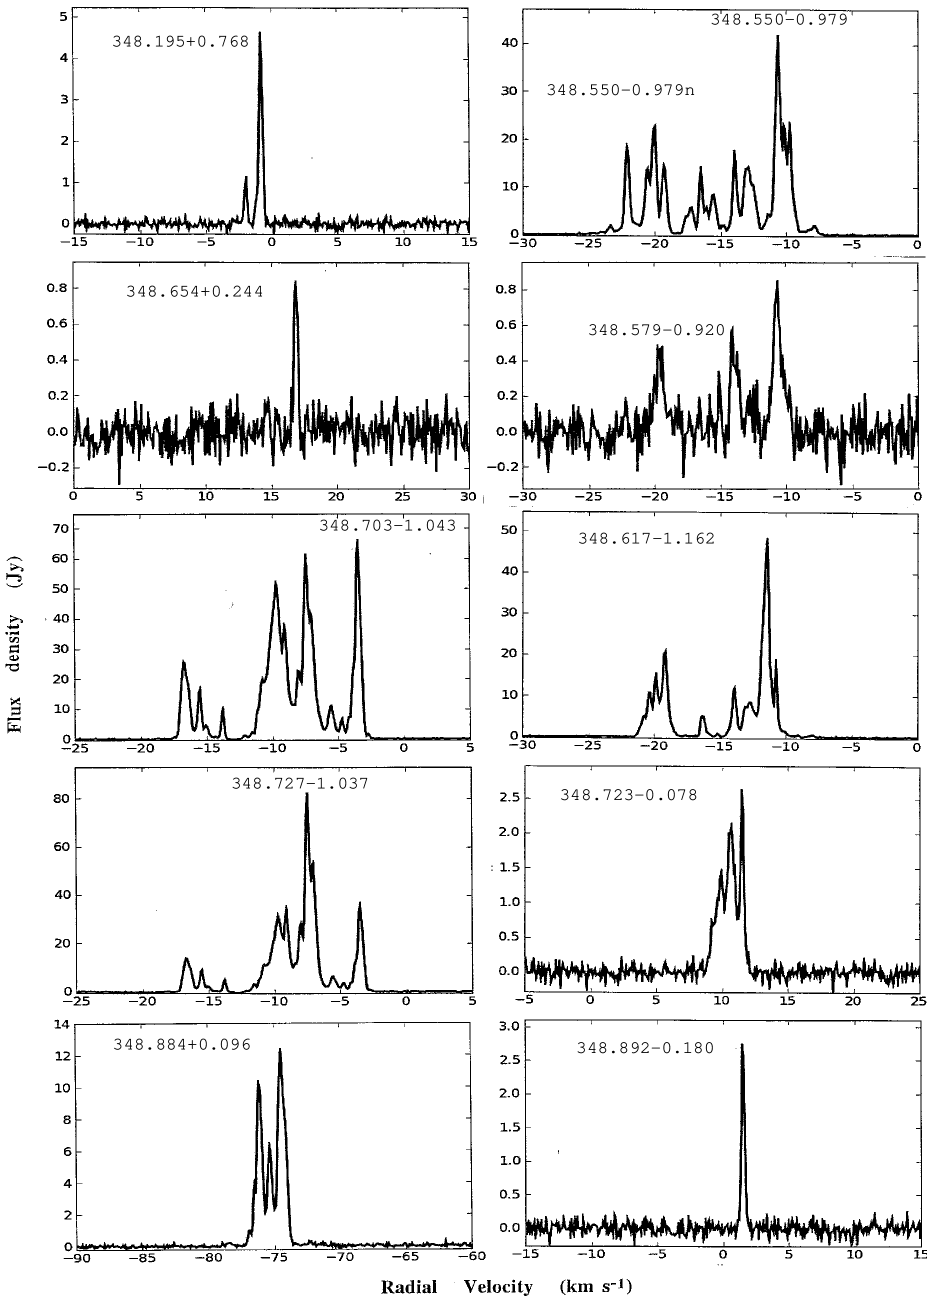
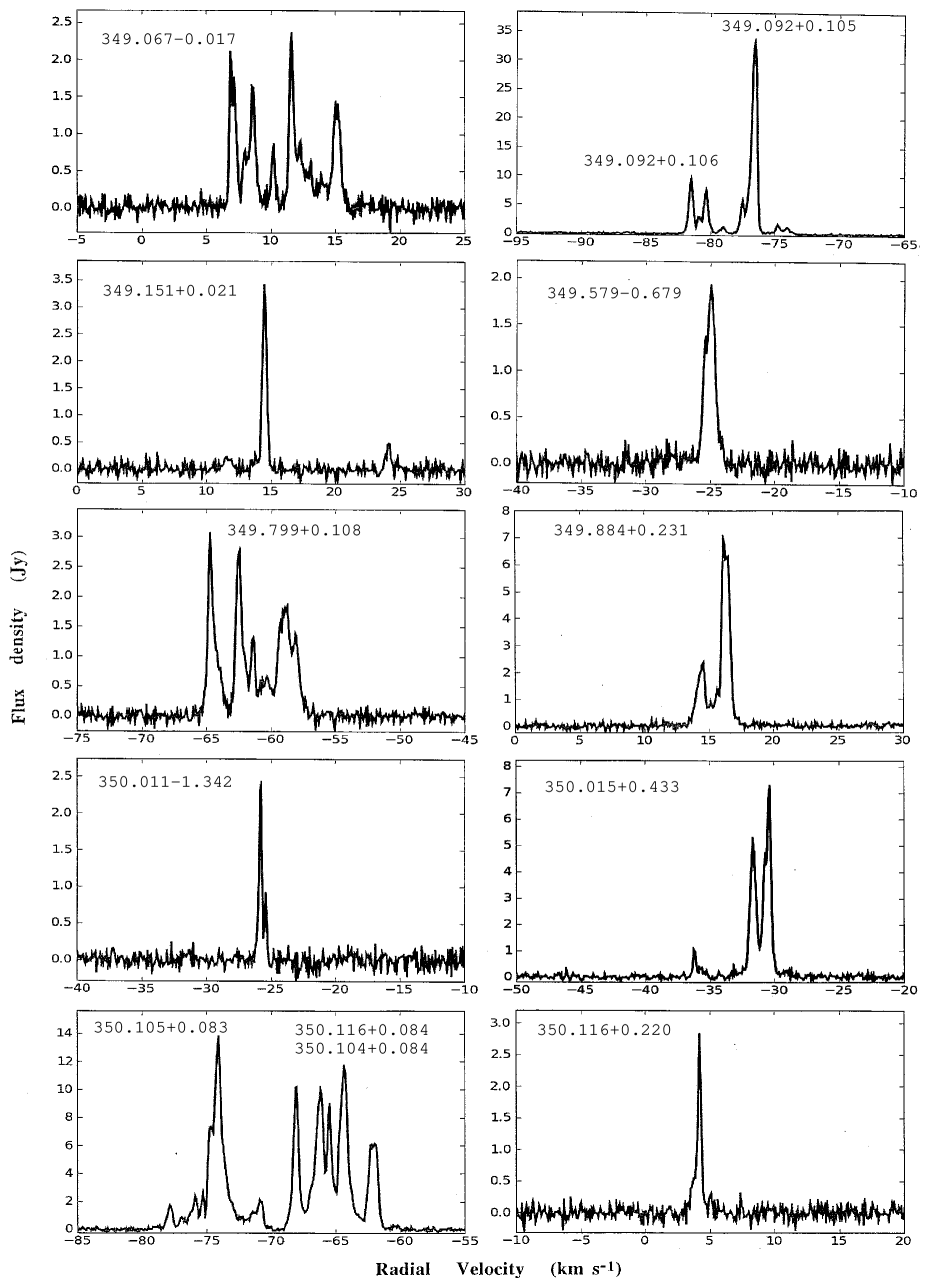
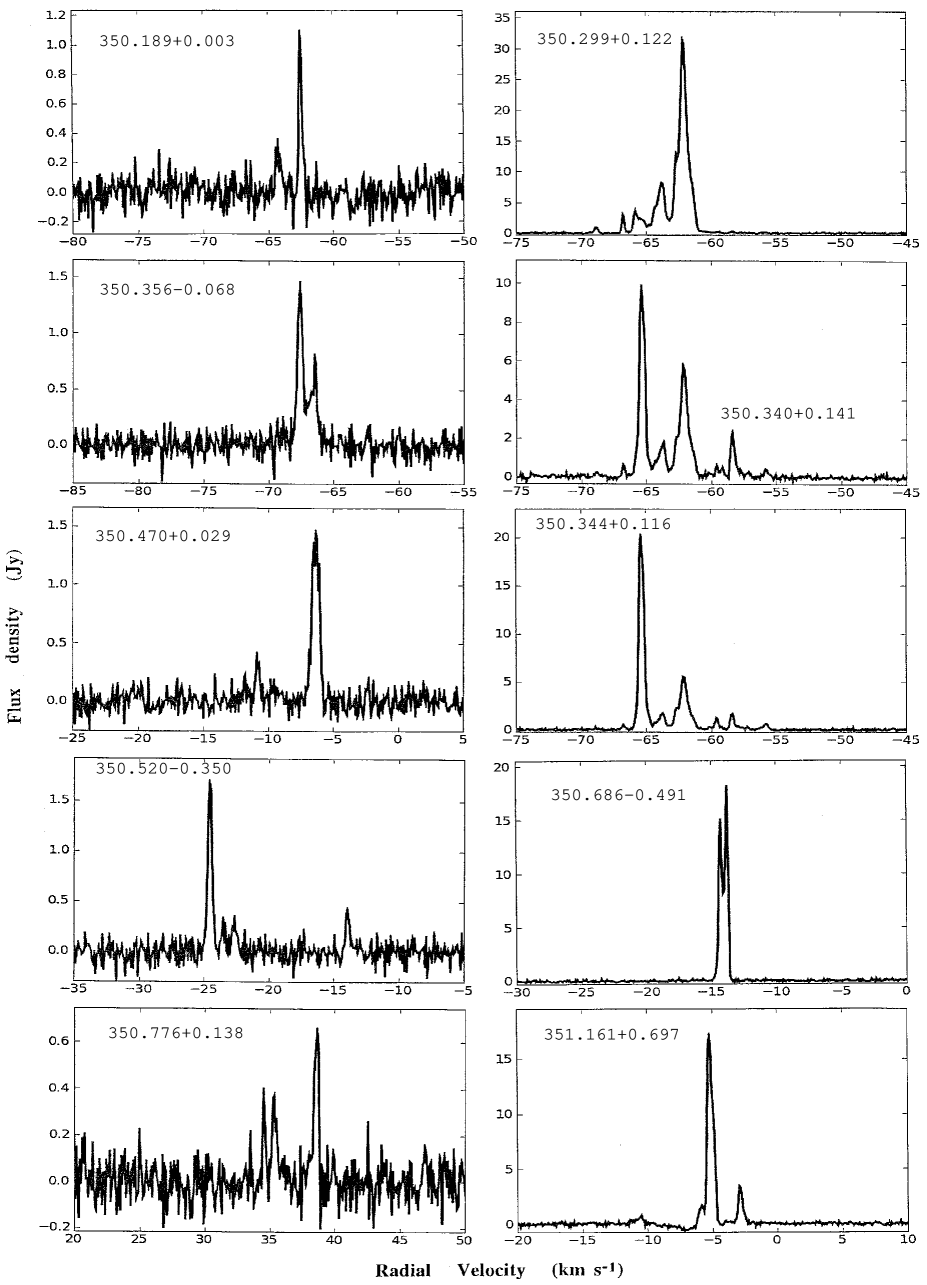
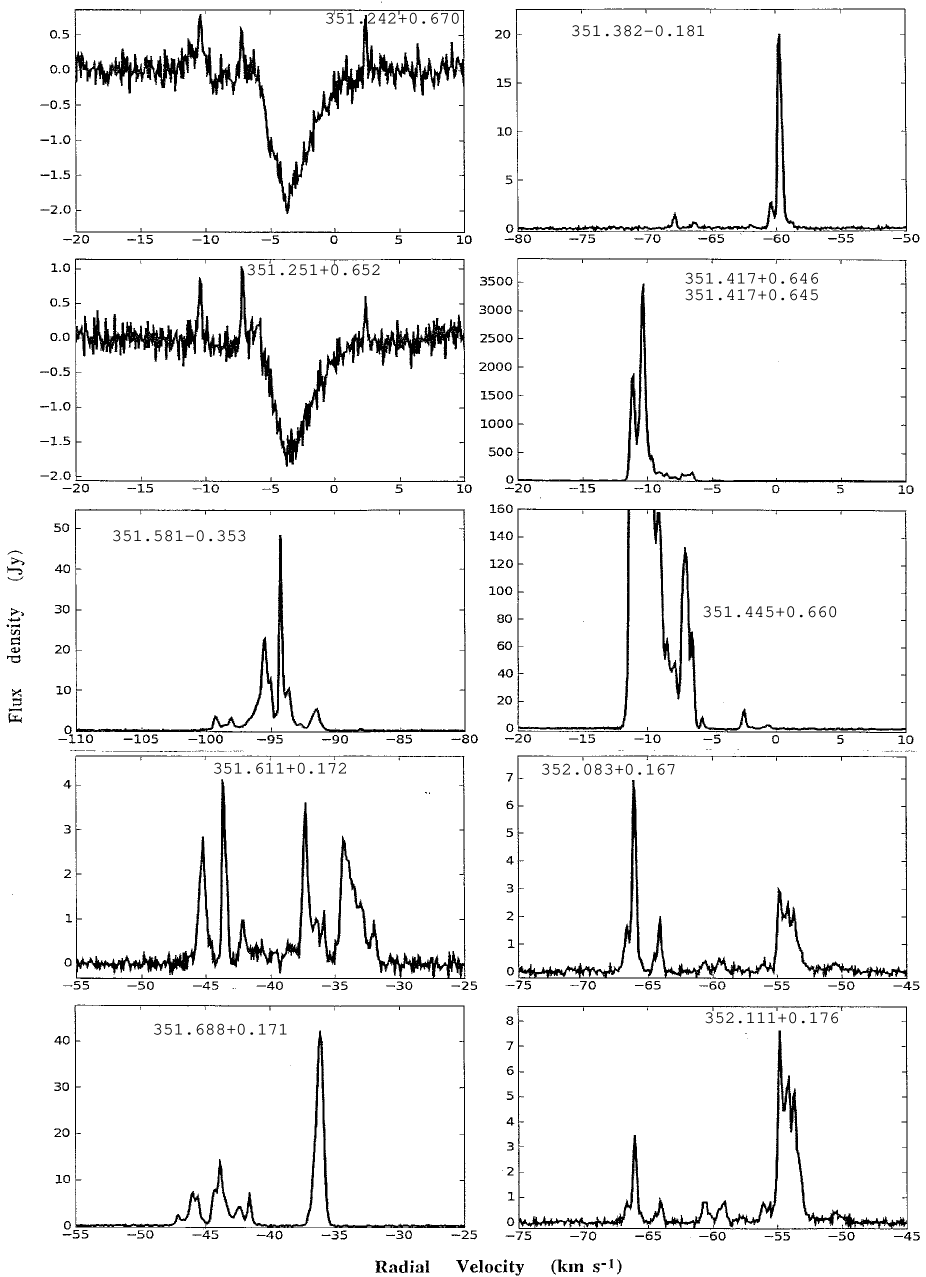
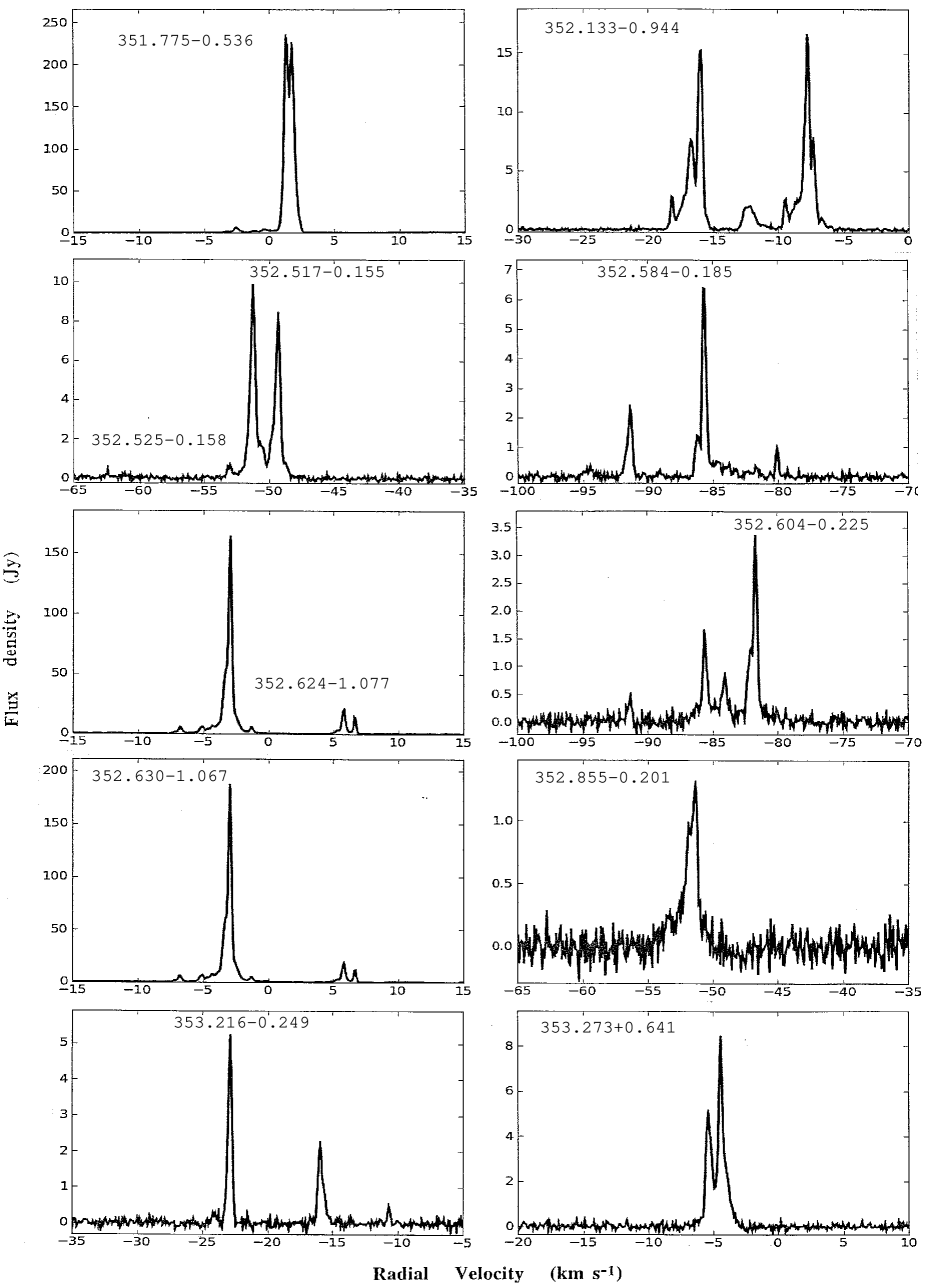
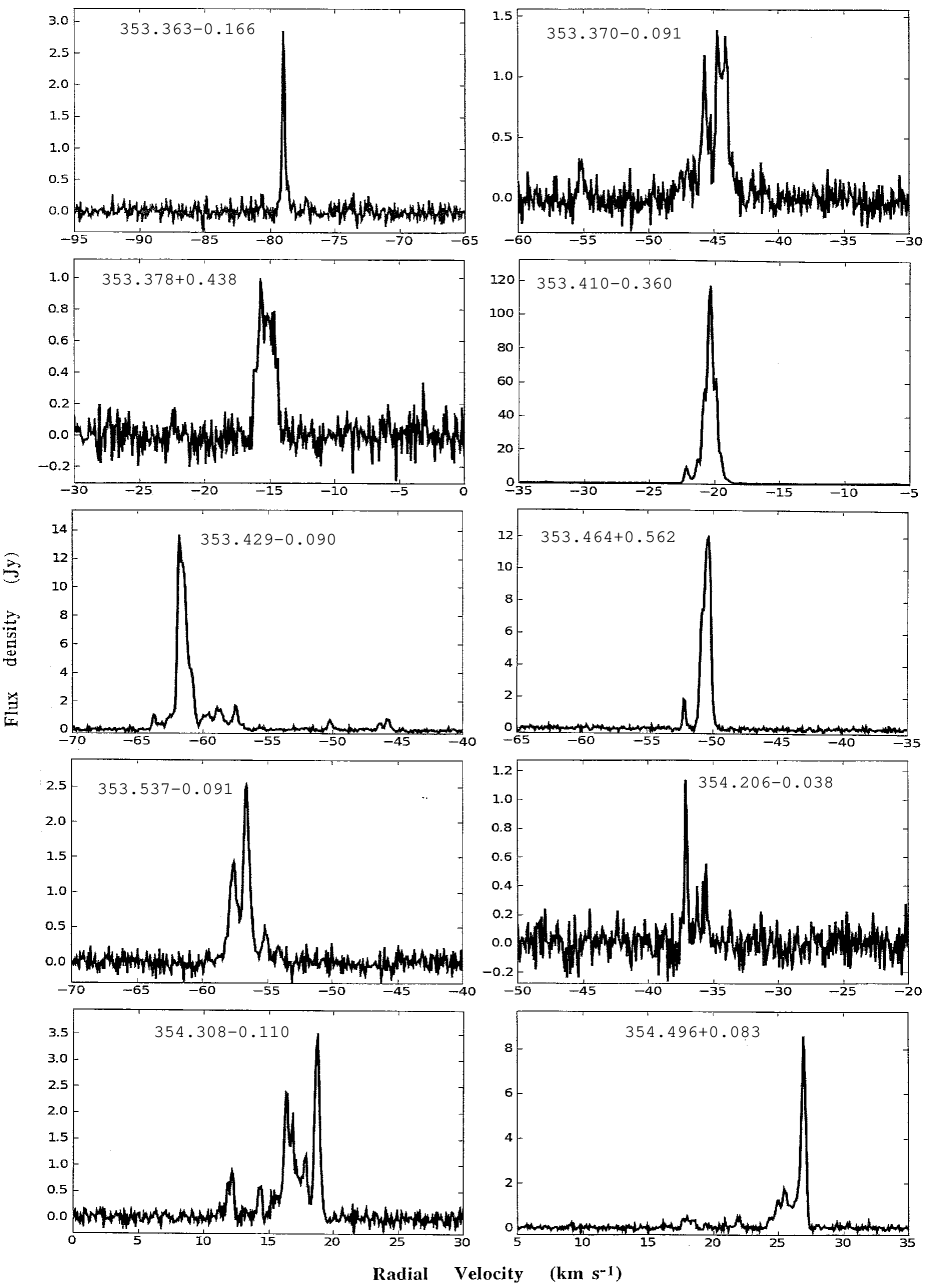
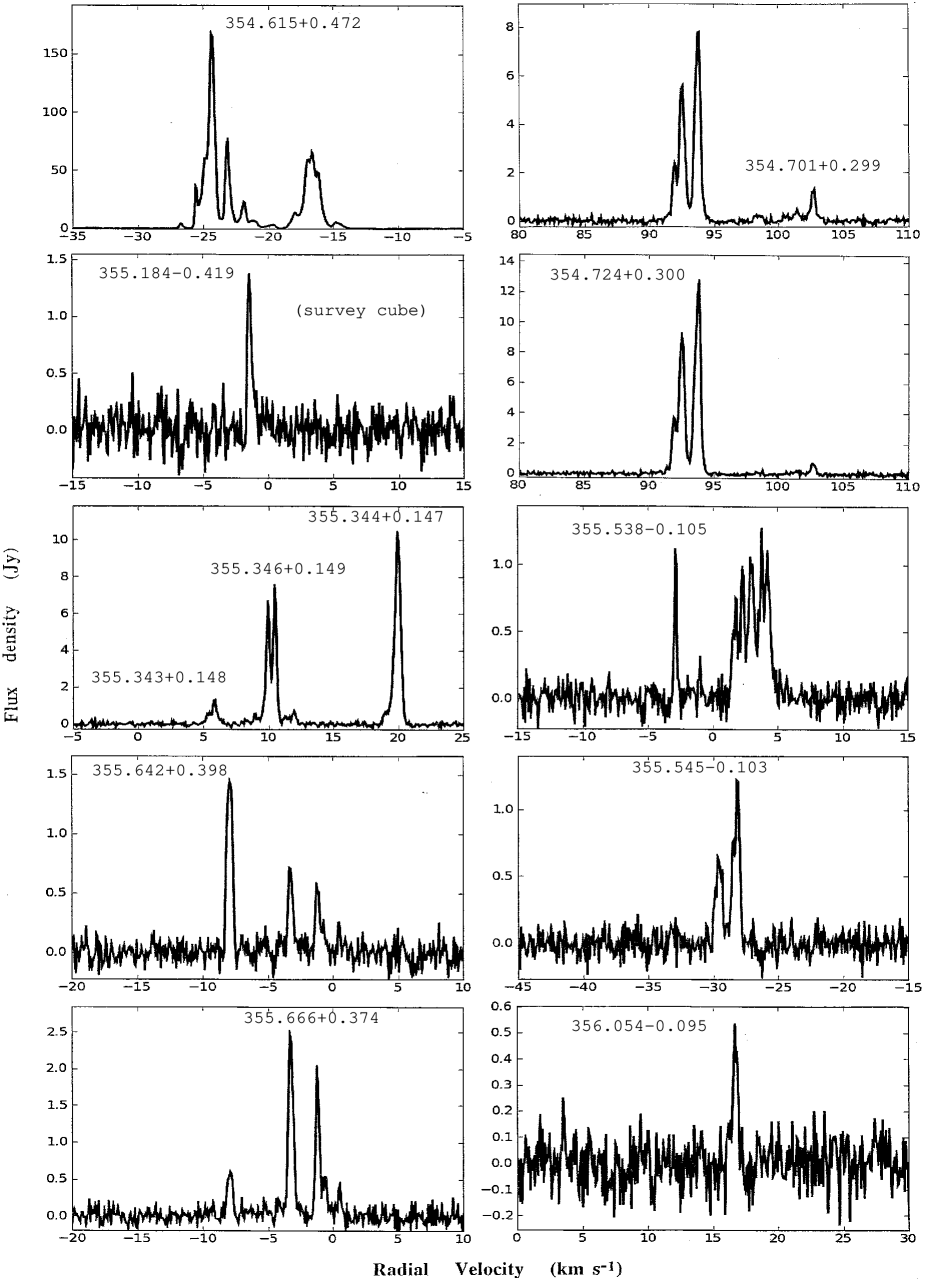
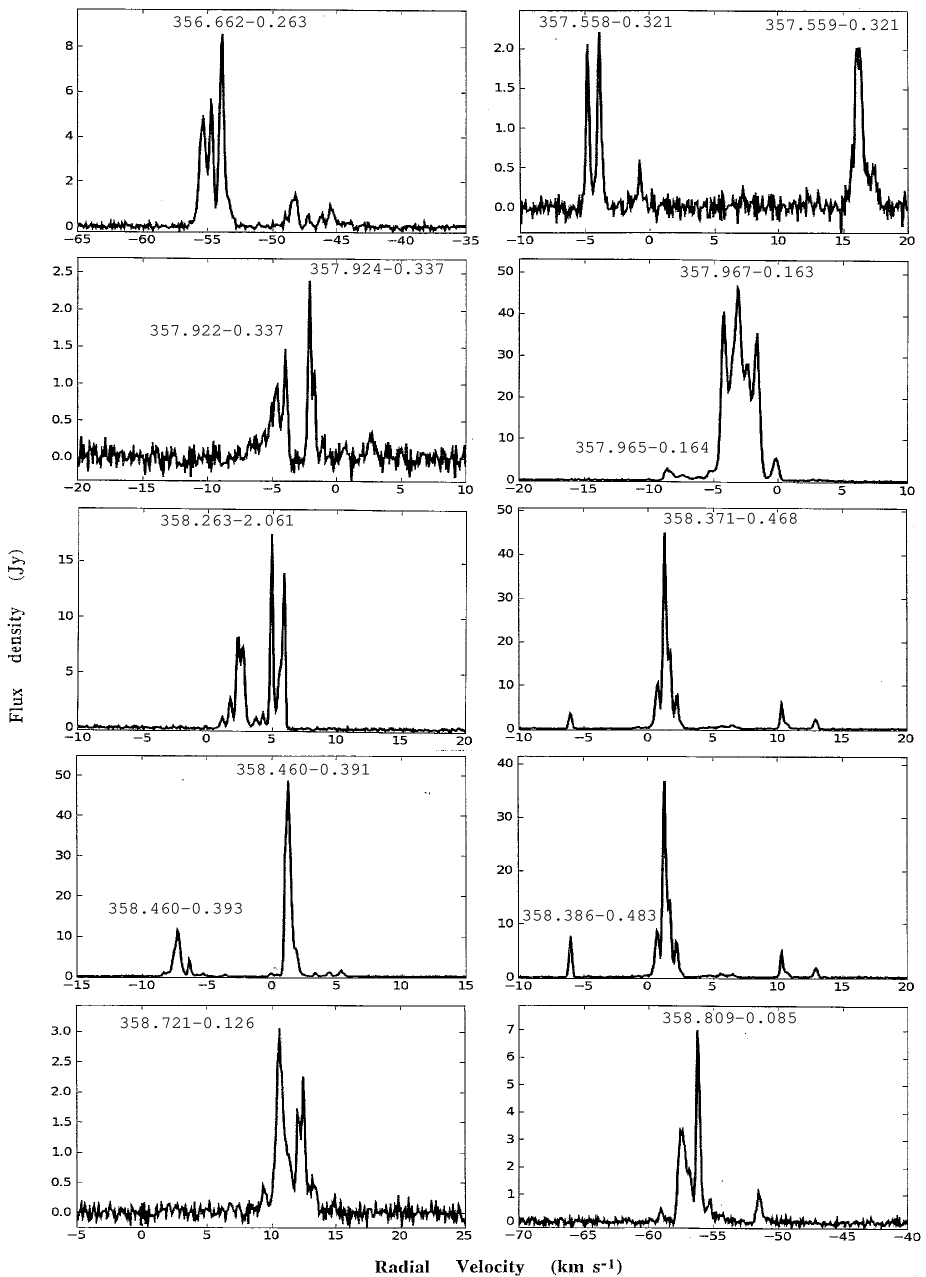
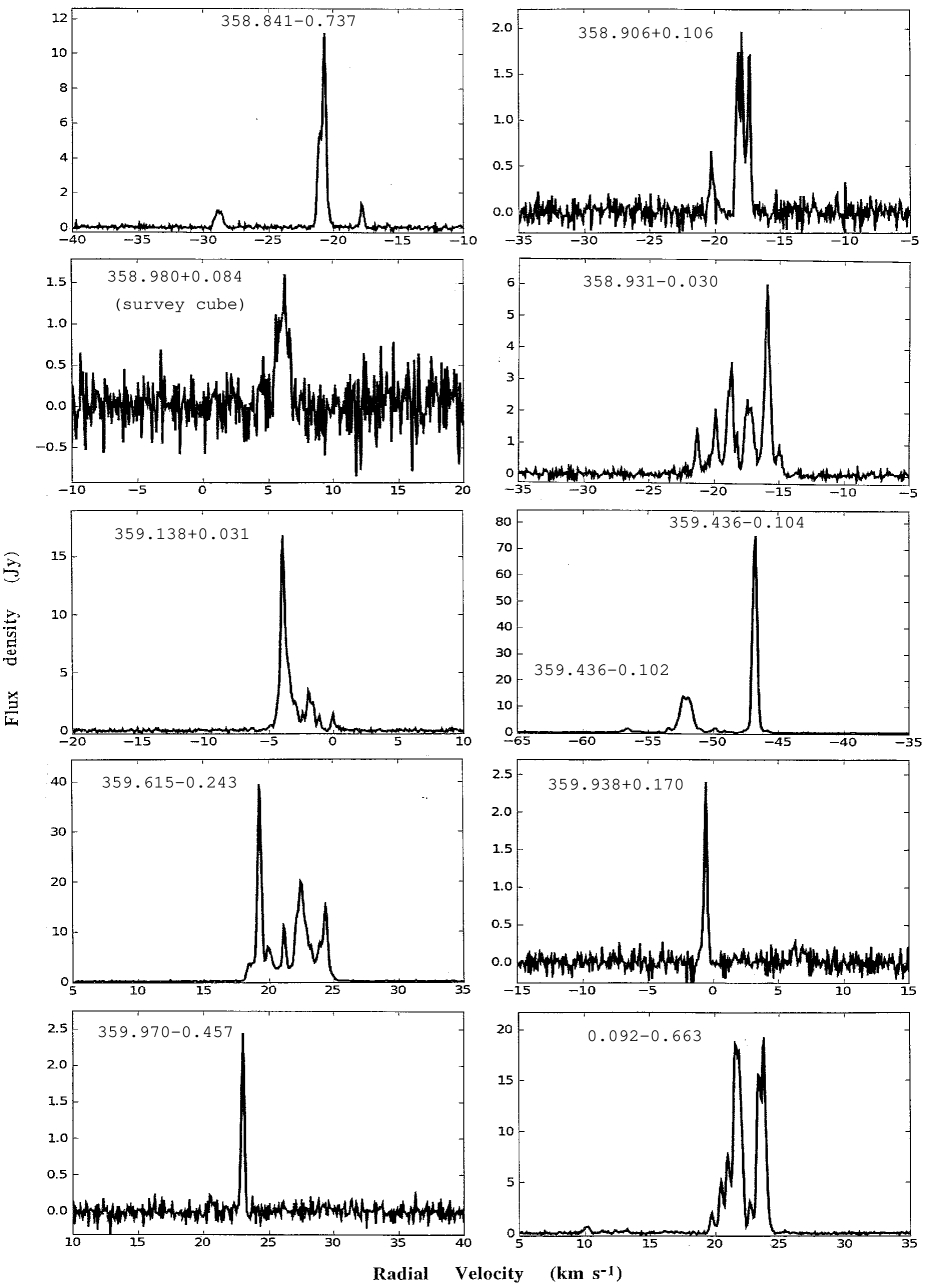
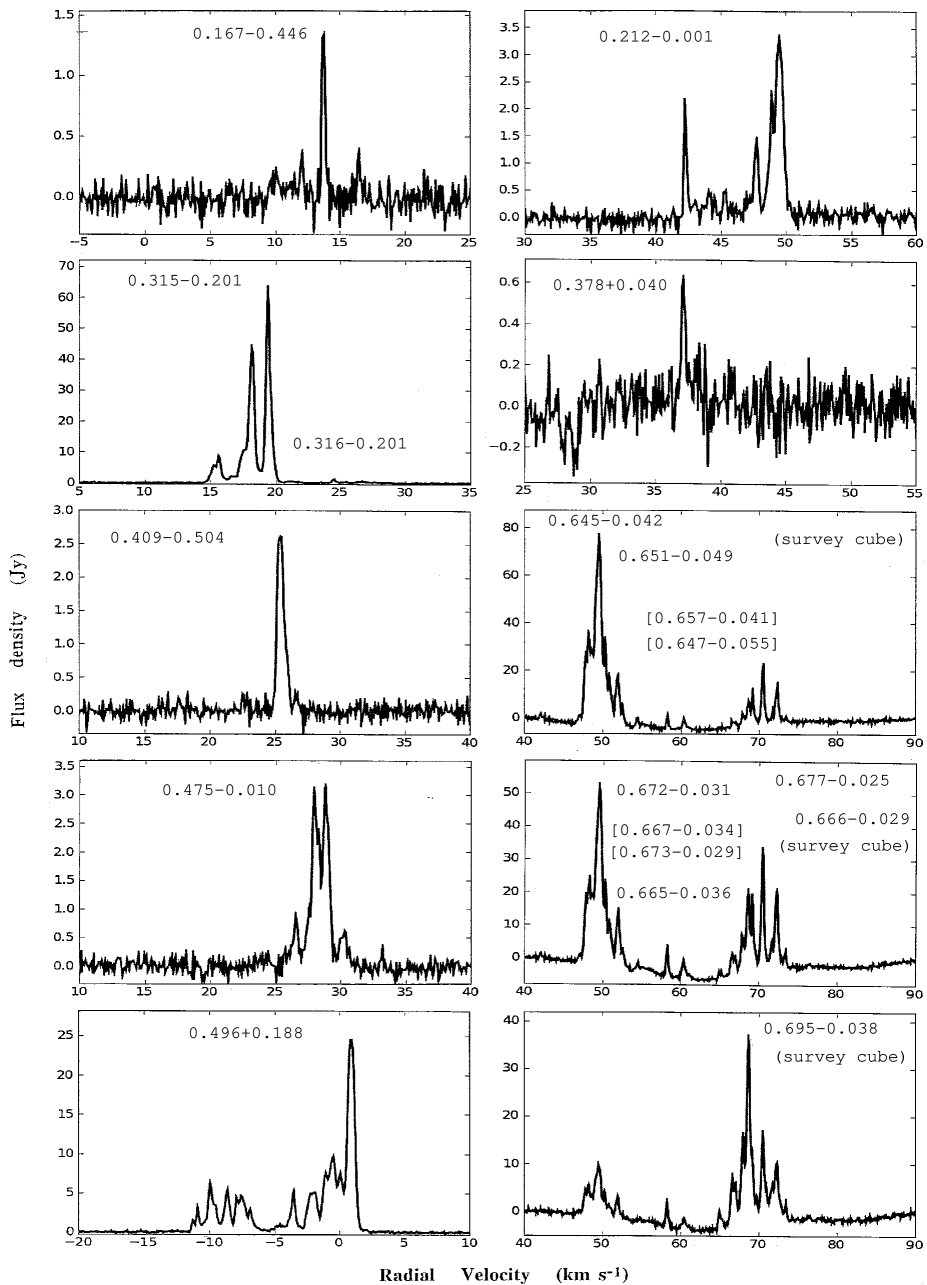
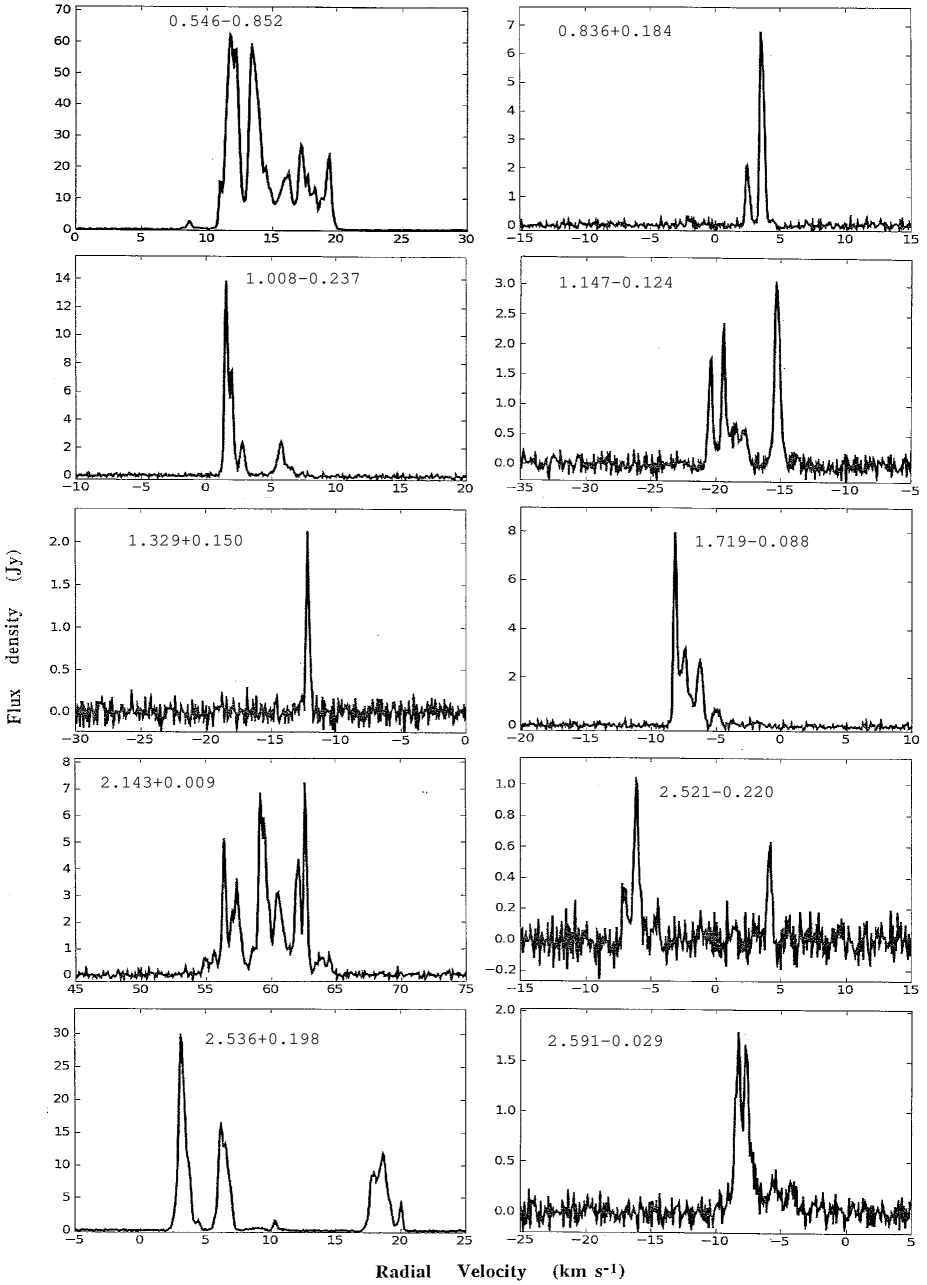
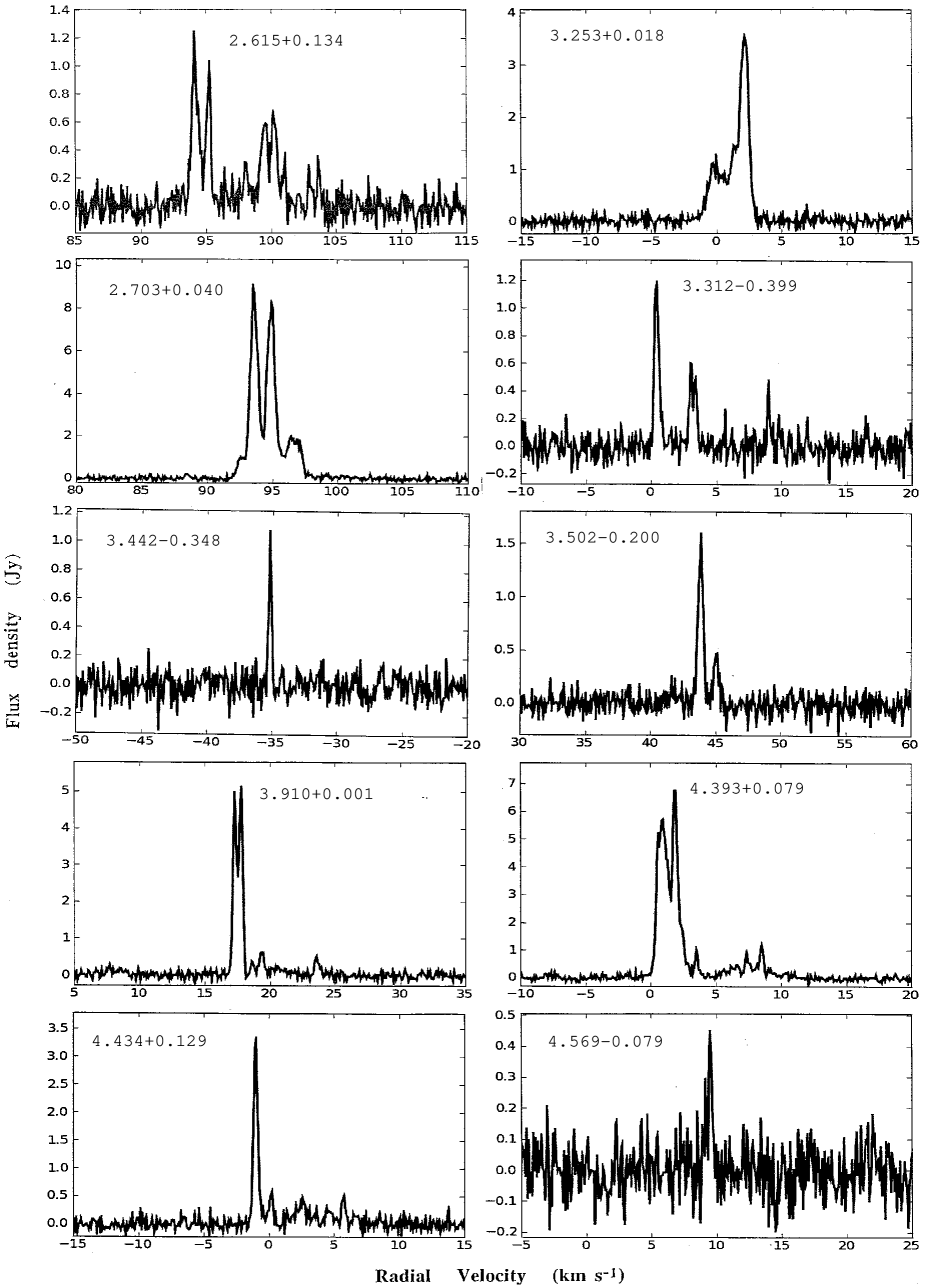
Only a few key parameters can be summarized in a table, and therefore we also present for each maser site a spectrum to display the detailed distribution of flux density as a function of velocity. These spectra, shown in Fig. 1, are from Parkes observations, with half-power beamwidth (HPBW) 3.2 armin. At this spatial resolution, most sites are sufficiently isolated that their spectra are not confused. However, there are other sites with much nearer neighbours, and their spectra are blended. In these cases, the spectra are intended primarily to show the total emission from the combined region. Reference to Table 1 is then required to recognise the strongest peak of each contributing site, and its velocity range. Consultation of high spatial resolution data is needed to fully understand the most complex regions where neighbours have overlapping velocity ranges. For some regions, such studies are already available (e.g. Houghton & Whiteoak 1995 and Caswell 1997); other regions will be the subject of subsequent papers on the MMB survey (see Section 4.7), and preliminary assessment of complex regions is given in the remarks of the following section. We generally display the spectra from the lower noise ‘MX’ follow-up observations, but in a few cases show the original survey observations instead, especially if the source was much stronger at the survey epoch. For the site 5.885-0.393, both survey cube and MX spectra are shown.
3.1 Remarks on selected maser sites
Analysis of the ATCA data yields small maps of the maser spot spatial distribution at each site with relative accuracy of 0.1 arcsec. Presenting and interpreting the wealth of information in these maps is much beyond the scope of the present paper, but there are some sites where additional information from these maps has been vital in the generation of a reliable source catalogue, in particular, the interpretation of emission from closely spaced sites. Accordingly, we have made remarks on selected maser sites in the following notes. A variety of other material also enhances the value of the catalogue and in this section we present individual notes for some of the sites. In addition to a discussion of closely spaced sites, the remarks highlight the following:- the 5 masers not detectable in our original survey cubes; the 9 masers showing intensity variability greater than a factor of two within the survey and follow-up period; 16 other masers showing historical intensity variability; the 2 sources with widest velocity ranges, exceeding 16 ; and the association of masers with an ultracompact H ii region (ucH ii) in some instances.
Finally we remark on the likely location of some sites, especially
the 34 sources in this portion of the survey that lie in the 3-kpc arm
(14 in the near side and 20 in the far side - see classification criteria
in Section 4.6.2 and Green et al. (2009b)). The suggested likely
distances of other masers include some with respect to heliocentric
distances, d, (distinguishing near and far kinematic distances);
and others with respect to Galactocentric distances (R), chiefly those
with longitude ,
in order to highlight those that appear to lie within 3 kpc of the
Galactic Centre, applying velocity criteria described in Section 4.
345.003-0.223 and 345.003-0.224
These known maser sites are shown on the same spectrum since they are separated by only 3 arcsec and do not overlap in velocity. Reference to Table 1, and to spectra in Caswell (1997), make it clear which features are at which site. Variability reported by Caswell et al. (1995b) is present at velocities corresponding to both sites, and spectra over a long timespan characterise the variability in more detail (Goedhart, Gaylard & van der Walt 2004) but reveal no distinct periodicities.
345.010+1.792 and 345.012+1.797
These known maser sites are separated by 19 arcsec and are shown on the same spectrum. The velocity ranges do not overlap (Table 1, and spectra from Caswell (1997)). The first site is associated with a ucH ii region (Caswell 1997) and displays class II methanol maser emission from a remarkably large number of other transitions (Cragg et al. 2001).
345.198-0.030
This new site is believed to lie in the far side of the 3-kpc arm. For this site, and several others near these longitudes, the velocity (-1.5 in this instance) is sufficiently near zero that the alternative kinematic distances lie on the solar circle, i.e. at the same Galactocentric distance as the Sun (and thus very nearby or at 17 kpc), where the space density of masers is low (see Section 4). We conclude that, statistically, very few can lie near the solar circle, and that most of them are correctly attributed to the far side of the 3-kpc arm, but with some exceptions recognisable from their quite large Galactic latitude, e.g. 348.195+0.768.
345.407-0.952 and 345.424-0.951
This is a known pair of sites separated by about 1 arcmin. The first is a single spectral feature, coincident with an OH maser site (Caswell 1998). The spectra are shown aligned, one beneath the other and with the same velocity scale, so as to allow clear distinction of the features attributable to each site. The sites are not likely to be at a large distance in view of their rather large Galactic latitude. HI absorption measurements of nearby continuum emission was interpreted to indicate a distance of 2 kpc by Caswell et al. (1975). However, Radhakrishnan et al. (1972) considered this region in the context of others at similar latitude which lie between longitude and . They argued persuasively that all of these complexes are at a distance of about 4.2 kpc (if the Galactic Centre is assumed to be at 8.4 kpc) and this remains a likely interpretation.
345.441+0.205
New site believed to lie in the far side of the 3-kpc arm.
345.487+0.314 and 345.505+0.348
Known sites separated by more than 2 arcmin. The latter site displays emission over a velocity range from -23.1 to -10.5 , and seems likely to lie in the far side of the 3-kpc arm; with a peak intensity of 307 Jy, it is the strongest maser attributed to the far side. The first site is a weak single feature with velocity -22.8 lying just outside the velocity range of the 3-kpc arm (Green et al. 2009b). For consistency, we formally exclude it from the 3-kpc arm but this is uncertain, and it may be near its apparent neighbour in the 3-kpc arm. The spectra are aligned to allow recognition of the features of each site.
345.498+1.467
This known site lies within the longitude-velocity domain of the far side of the 3-kpc arm but, in view of its large Galactic latitude, and evidence from HI absorption (Radhakrishnan et al. 1972), that interpretation is rejected in preference to a nearby location (Green 2009b).
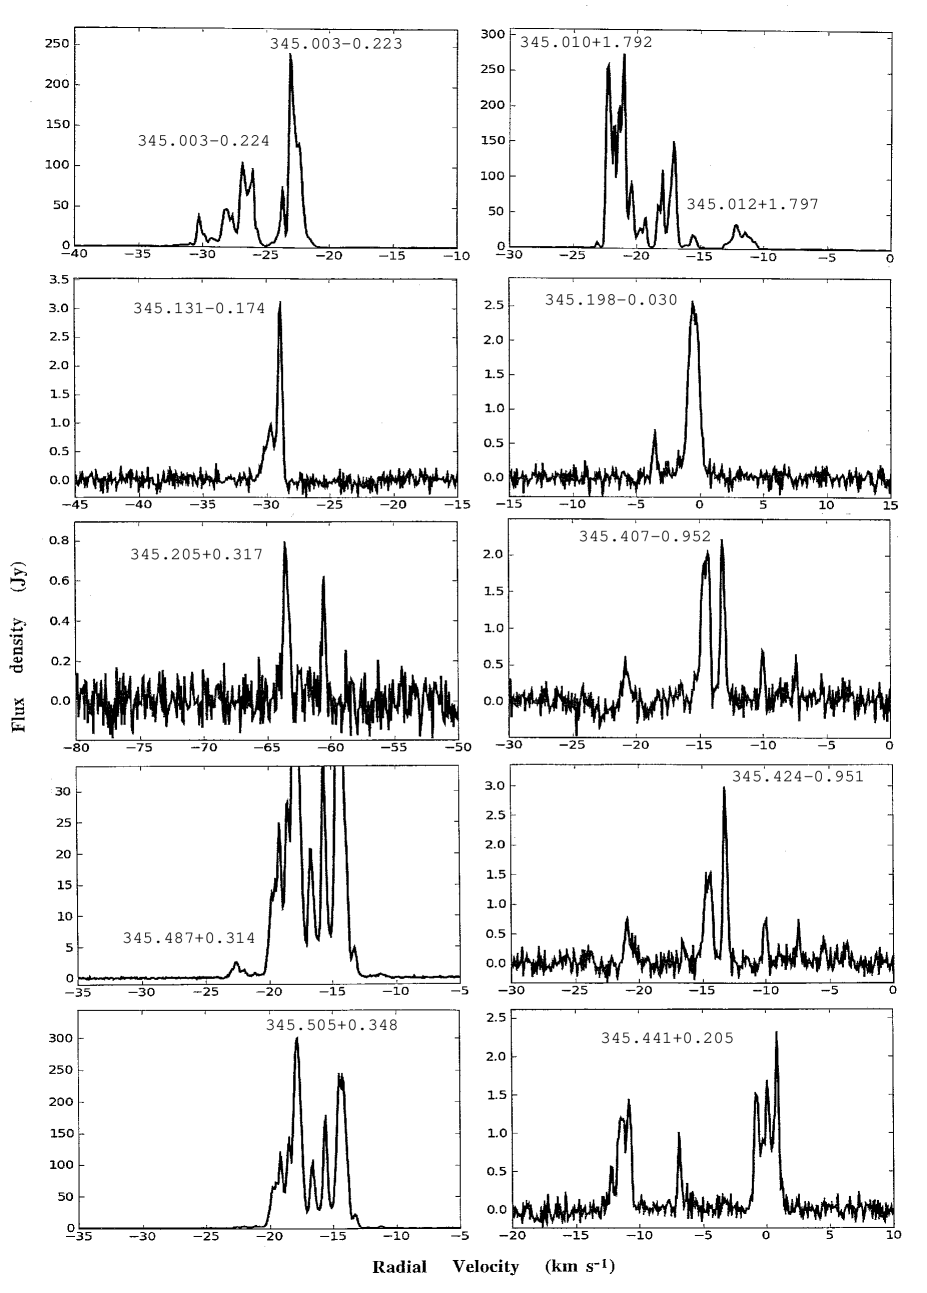
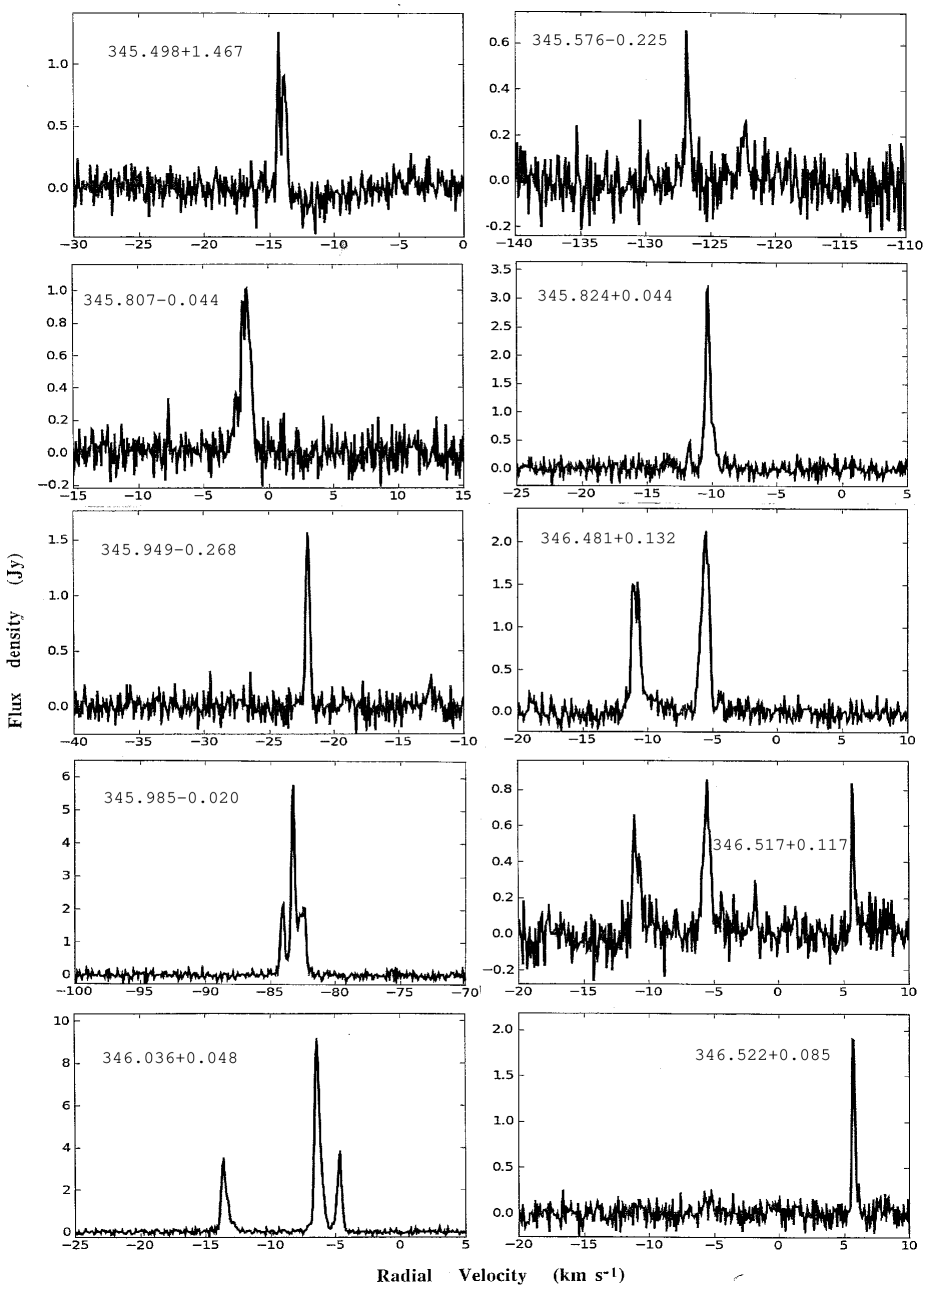
345.576-0.225
This newly discovered site has the highest negative velocity (peak at nearly -126 ) of any site in the survey region presented here. It most likely lies in the near side of the expanding 3-kpc arm (Green et al. 2009b).
345.807-0.044
New weak maser lying in the far side of 3-kpc arm.
345.824+0.044
Caswell and Haynes (1987) remark on the likely ‘far’ distance of an H ii region which lies in the same direction and has the same velocity as the maser; a location in the far side of the 3-kpc arm for both the H ii region and the maser would satisfy those observations.
345.985-0.020
Strongly variable new maser with peak of 5.7 Jy at -83.2 in our follow up measurements of 2008 August. This feature was only 1.35 Jy in our original survey cube (2007 June, when another peak was slightly stronger) and had a similar value in the ATCA measurement of 2007 July.
346.036+0.048
New maser located in the far side of the 3-kpc arm.
346.231+0.119
This new maser has its velocity centred at -95 , just outside our adopted range for 3-kpc arm near-side members; we provisionally reject it as a 3-kpc arm object pending other data.
346.480+0.221
Known site with velocity range just outside our formal boundary for far-side 3-kpc arm members.
346.481+0.132
Known site located in the far side of the 3-kpc arm.
346.517+0.117
Not detected above the noise level in the survey observations (2007 June) but known as a maser with peak of 1 Jy at -0.1 and a secondary peak of 0.7 Jy at -1.7 in 1999 October (see Caswell 2009). Our follow-up observations 2008 August detected it with peak of only 0.3 Jy, and only at -1.7 . The spectrum is shown aligned in velocity with those of nearby sites 346.481+0.132 and 346.522+0.085 so as to recognise their confusing contribution to the spectrum. A similar confirmatory spectrum was obtained 2009 March.
346.522+0.085
Known single feature varying in our observations between 1.47 Jy (2007 June) and 1.9 Jy (2008 August), similar to its peak in 1992, but as weak as 0.6 Jy in 1999 October (C2009). Located in the far side of the 3-kpc arm.
347.583+0.213
Known maser in the near side of the 3-kpc arm. The spectrum is aligned with 347.631+0.211 which is responsible for two weak features, and with 347.628+0.149 whose major feature does not contribute to the spectrum.
347.628+0.149
Known maser in the near side of the 3-kpc arm. The offset of 4.7 arcmin from the previous source is just large enough to prevent any confusion.
347.631+0.211
Offset 3.7 arcmin from a possible companion, the previous maser 347.628+0.149, which is at slightly more negative velocity. Most likely, 347.631+0.211 also lies in the near side of the 3-kpc arm, but at present, for consistency, we have formally rejected it as just outside our accepted velocity range. Note that our spectrum centred here shows weak emission from 347.583+0.213 which lies at the edge of the Parkes telescope beam response.
347.863+0.019
Our new observations of this site, both from the survey cube (2007 June) and the MX measurement (2008 August), show that, compared to the spectrum from 1992 June (Caswell et al. 1995a), the currently prominent features near -35 have increased by a factor of 2 and the previously strongest feature of 7 Jy at -29 has faded to less than 1 Jy. The kinematic distance ambiguity for this site has been investigated by Busfield et al. (2006) who favour the far distance since no HI self-absorption could be detected.
348.027+0.106
New maser located in the near side of the 3-kpc arm.
348.195+0.768
New maser whose velocity is consistent with a location in the far side of the 3-kpc arm. However its large latitude suggests that it is more likely to be nearby (Green et al. 2009b). If it is nearby, this should be easy to verify by future astrometry and a parallax measurement.
348.550-0.979 and 348.550-0.979n
This is a known close pair of sources (separation 2 arcsec) for which we accept the current interpretation that they are distinct sites (Caswell 2009). These sites, and those discussed in the next two notes, all have velocities that suggest they lie in a region argued to be at a distance of about 4.2 kpc by Radhakrishnan et al. (1972) - see also notes to 345.407-0.952.
348.579-0.920
This known weak maser displayed a peak of 0.5 Jy at -15 in 1996 (Caswell 2009) and was below the noise level in our regular survey measurement. A weak peak of 0.32 Jy at this velocity was detected in our later follow-ups in both 2008 August and 2009 March and we conservatively list just this peak in Table 1. However, the spectrum at this location, when aligned with that of the nearby strong source 348.550-0.979, reveals that the sidelobe response to the strong source is no more than 1 per cent; thus probably most other emission at this location is also from 348.579-0.920, and attributable to previously unrecognised features of up to 0.5 Jy.
348.617-1.162
This is the strongest of our new detections and lies in the region where its velocity suggests it to be at a distance of 4.2 kpc (Radhakrishnan et al. 1972).
348.654+0.244
New maser located in the far side of the 3-kpc arm.
348.703-1.043 and 348.727-1.037
This is a known pair of sites separated by more than 1 arcmin. Both sites host OH masers (Caswell 1998). Emission from the first site is confined to a small velocity range, and its main feature at velocity -7.4 is clearly distinguishable from 348.727-1.037 when the two aligned spectra are compared. The sites lie in the region suggested to be at a distance of 4.2 kpc (Radhakrishnan et al. 1972).
348.723-0.078, 348.892-0.180, and 349.067-0.017
The first is a new maser and the other two are previously known. All are most likely located in the far side of the 3-kpc arm.
349.092+0.105 and 349.092+0.106
Known sites with separation of only 2 arcsec. Their velocities near -80 are not quite within the range of the near side of the 3-kpc arm. If they are not in the 3-kpc arm, their velocity would be compatible with a location slightly further away, and within 3 kpc of the Galactic Centre. At a distance of 8.4 kpc, their separation corresponds to more than 80 mpc.
349.151+0.021
New site located in the far side of the 3-kpc arm.
349.579-0.679
This new maser has decreased from a peak flux density of 5.9 Jy in the initial survey (2007 June) to 4.2 Jy in the ATCA observations (2007 July) and 1.9 Jy (2008 August) in our MX spectrum.
349.884+0.231
New maser located in the far side of the 3-kpc arm.
350.011-1.342
Known maser consistently showing a peak of more than 2 Jy in our recent observations. However, the original detection of 1993 September (reported in source notes of Caswell 1998) showed a peak of 1 Jy at velocity -27.9 , and in 1999 May the peak was only 0.4 Jy at -25.8 (Caswell 2009); thus it has shown a recent flux density increase by more than a factor of five. Its large latitude suggests that it is nearby, but the velocity and latitude would be compatible with a location in the extensive structure at 4.2 kpc discussed by Radhakrishnan et al. (1972).
350.105+0.083, 350.104+0.084 and 350.116+0.084
Three known sites (Caswell 2009), of which the first two are separated by only 4 arcsec. The first site is the strongest, with a large velocity range, and a peak at -74.1 of approximately 15 Jy, both in our recent measurements up to 2008 March and as far back as 1996 October; however it was much stronger, 40 Jy, in 1992. The location of the second site was determined in 1996 October from a single feature at -68.4 Jy of 2.5 Jy, and the location of the third site, offset 40 arcsec, was determined from a single feature in 1996 October at -68.0 , with peak 1.8 Jy. A much stronger feature close to these velocities now has a peak varying between 14.6 (survey cube 2007 March) and 9.9 Jy (MX 2008 March), and although we have no precise recent position, we interpret it as evidence of a flare in either the second or third site by a factor of four. Slight differences in the strength of emission seen in our Parkes measurements centred at each site are insufficient to indicate the more likely location. However, from the velocity comparisons, it seems probable that the flare occurred in the third site rather than the second.
350.116+0.220
New maser located in the far side of the 3-kpc arm.
350.340+0.141 and 350.344+0.116
350.340+0.141 is a single feature weak new maser nearly 90 arcsec from the known strong maser 350.344+0.116. The aligned spectra clearly reveal the main features of each site.
350.776+0.138
The high positive velocity of this new site is strikingly unusual for a site at this longitude, and can most readily be interpreted as indicating a location at the edge of the far side of the 3-kpc arm.
351.242+0.670 and 351.251+0.652
The first of these was reported by Caswell and Phillips (2008) while the second was detected in the same observations (but unpublished) as a peak of 1 Jy at -7.1 . Neither maser can readily be seen in our Parkes survey due to a combination of several distracting effects. These effects include deep absorption (stronger than the masers) at a velocity spanning almost the entire range between the two masers; the consequent slightly offset zero intensity level; and some weak responses to very strong offset maser emission near velocity -10 associated with NGC6334F. Allowing for these effects, our original survey cube for 351.242+0.670 shows a peak of 2.2 Jy at +2.5 . The follow-up MX spectrum 2008 March (displayed in this paper) shows a peak of 0.74 Jy. At intermediate epochs, the peak was 1.1 Jy on 2007 May 14 using a compact configuration of the ATCA (Caswell & Phillips 2008), and our high spatial resolution measurements with the ATCA on 2007 July 21 revealed a peak of only 0.44 Jy. The maser is thus markedly variable.
The second site is offset 73 arcsec from the first and is weaker. The most sensitive spectrum from the MX follow-up (2008 March) shows a 1-Jy peak at -7.1 , with weaker emission extending to -6 , similar to the unpublished ATCA observations by Caswell & Phillips in 2007 May; the original survey cube was noisier, showing a peak of 1.3 Jy, and the ATCA observations (2007 July) yielded a peak of 0.6 Jy at -7.1 , with a secondary peak of 0.55 Jy at -6.1 . Some variability seems likely, but deviations from a peak of 1 Jy are barely significant in view of the low signal-to-noise ratio. The two sites do not overlap in their emission velocity ranges and are clearly distinguishable on the aligned spectra.
351.417+0.645, 351.417+0.646 and 351.445+0.660
These are strong well-known masers (e.g. Caswell 1997) with the first projected onto the prominent compact H ii region NGC6334F (Ellingsen, Norris & McCulloch 1996; Caswell 1997). The second is offset from the first by several arcsec to the north-west and has an almost identical velocity range but the spectra are clearly distinct when seen with the ATCA spatial resolution (Caswell 1997). The third site is offset nearly 2 arcmin to the north, and our Parkes spectrum, although confused by the first two very strong sources between -12 and -9.6 , clearly shows features at -9.2, -7.1 and -2.5 which correspond to the main features of 351.445+0.660 seen on the ATCA spectrum of Caswell (1997).
351.581-0.353
This known strong maser site has a weak northern feature offset nearly 2 arcsec (Caswell 1997; 2009). Following Caswell (2009) we treat it as probably not a distinct site and therefore do not list it here, and cite a velocity range encompassing all features. The velocity indicates a location in the near side of the 3-kpc arm.
351.611+0.172 and 351.688+0.171
These masers are separated by 4.6 arcmin and both are new. 351.688+0.171 has a peak flux density of 42 Jy, our second strongest new detection. Alignment of the two spectra shows that, despite the similar velocity ranges, there is no confusion between them in the Parkes spectra. Both sites are likely to be part of the same star forming cluster.
352.083+0.167 and 352.111+0.176
This known pair of sites has a separation of more than 100 arcsec and non-overlapping velocity ranges. The intensity of the second site has been stable but the first has increased by more than a factor of 3 relative to 1999 May and 1993 September (Caswell et al. 1995a; Caswell 2009). The aligned spectra clearly distinguish the features from each site.
352.604-0.225 and 352.584-0.185
Two new sites separated by more than 2 arcmin, with the velocity range of the stronger site, 352.584-0.185, straddling that of the weaker site. Their systemic velocities correspond well with that expected for the near side of the 3-kpc arm. Both show some variability. The aligned spectra show a small amount of confusion between them as measured at Parkes, with a beamsize of 3.2 arcmin.
352.624-1.077 and 352.630-1.067
Two known sites separated by 42 arcsec. The velocity ranges do not overlap and the separation of the sources is clear on the aligned spectra.
353.216-0.249
New source with large variability, increasing from the survey cube peak of 1.1 Jy (2007 March) to 1.3 Jy (ATCA, 2007 July) and reaching 5.1 Jy in the MX follow-up (2008 March).
353.273+0.641
Known source (Caswell & Phillips 2008) associated with an unusual water maser showing dominant blue-shifted emission. The methanol intensity has faded from 25 Jy in 1993 June to 12.7 Jy in the survey cube (2007 March) and finally to 8.3 Jy in the MX follow-up 2008 March.
353.363-0.166
New maser located in the near side of the 3-kpc arm.
353.429-0.090
New maser with large velocity range of 18.9 , the widest in this part of the survey. However, the weak features in the velocity range -51 to -45 were not detected above the noise level of the ATCA observations so it was not possible to confirm conclusively that they all arise from this same site.
354.496+0.083
New maser located in the far side of the 3-kpc arm.
354.615+0.472
Known strong maser, showing modest variations in our survey and follow-up period. However the feature at -23 , which had a peak intensity of 216 Jy in 1992 December, has now faded to less than 100 Jy, whereas some other features show negligible change. The high variability was noted by Caswell et al. (1995b) and additional monitoring information was presented by Goedhart et al. (2004).
354.701+0.299 and 354.724+0.300
The first of these is a new maser with high positive velocity exceeding 100 ; the second maser was already known and has a similar velocity. Such velocities are highly unusual for this region of Galactic longitude. Indeed, they are the highest positive velocity masers in any part of the survey region covered here. The unusual velocities are discussed in Section 4.5, in the context of the Galactic bar which appears to be their most likely location. The separation between the sites is 75 arcsec, causing spectral features of the offset source to be seen on both Parkes spectra.
355.184-0.419
This is a new maser for which we display the spectrum from the original survey cube (2007 January). Confirmation observations with the ATCA (2007 February) showed a peak of 1.2 Jy and yielded a precise position. No MX measurement has yet been made.
355.343+0.148, 355.344+0.147 and 355.346+0.149
These are three previously known sites, with the first two separated by only about 2 arcsec but the third offset by 10 arcsec. Recent careful evaluation of information that in the past gave rise to conflicting interpretations of their distance has now yielded the conclusion that the masers most likely lie within 3 kpc of the Galactic Centre, or perhaps the far side of the 3-kpc arm (Caswell 2009). A single spectrum is shown, and reference to the table, and to ATCA spectra from Caswell (1997), is needed to distinguish the features.
355.642+0.398 and 355.666+0.374
New sites, separated by just over 2 arcmin. Their velocity ranges do not overlap and the aligned spectra distinguish the two sites.
356.662-0.263
Known maser site located in the near side of the 3-kpc arm.
357.558-0.321 and 357.559-0.321
Newly discovered pair of sites separated by 3 arcsec and with quite separate velocity ranges. The second source has velocity range +15 to +18 and is best interpreted as being at Galactocentric radius R 3 kpc (see Section 4.6). The first source has a velocity range of -5.5 to 0 ; from this velocity, its location could be interpreted as R 3.5 kpc. However their small projected separation suggests that the sites are more likely close companions, at a common distance. Therefore, for both sites, we favour R 3 kpc, where anomalous velocities are more common than at R 3.5 kpc.
357.922-0.337 and 357.924-0.337
Another newly discovered pair, separated by 5 arcsec, with slight overlap of velocity ranges. The velocities are compatible with a location R 3.5 kpc.
357.965-0.164 and 357.967-0.163
This known pair of sites has a separation of 7 arcsec. Intensity variations have been modest for all features. The stronger emission of the second source lies wholly within the velocity range of the (much wider velocity) weak source. Their velocities are compatible with a location R 3.5 kpc.
358.263-2.061.
The Galactic latitude of this previously known site is large, and lies just outside our formal survey coverage. We have re-observed it and include it in Table 1 so that the table provides a complete current listing of reliably known masers in the survey longitude range. The maser intensity has shown modest variations. Its velocity, ranging from 0.5 to 6 , is compatible with R 3.5 kpc, after allowance for small (less than 7 ) non-circular motions. This is consistent with its large latitude, which almost certainly indicates that it is nearby, with heliocentric distance of only a few kpc.
358.386-0.483 and 358.371-0.468
Both sites are previously known, separated by about 81 arcsec. The first shows emission from a single narrow peak at velocity -6.2 which was only 2.5 Jy in 1997 May (Caswell 2009) but the survey cube peak was 12.5 Jy in 2006 February, decreasing in the MX follow-up observations of 2008 March to 7 Jy.
The second site has features in the range -1 to +13 , with peak at +0.8 and fairly stable at 45 Jy. Both sites are acceptably interpreted as being located at R 3.5 kpc. The aligned spectra clearly distinguish the emission from each site.
358.460-0.391 and 358.460-0.393
These are both new, separated by 7 arcsec. The first has a velocity range of +0.5 to +4.0 and its peak (at velocity +1.2 ) has increased from the survey cube value of 25 Jy (2006 February), to the ATCA value of 35 Jy (2006 March), and MX follow-up (2008 March) value of 48 Jy. The second maser has a peak at -7.5 of 11 Jy which has remained stable, and the velocity range of -8.5 to +6 encompasses that of the first. Both are acceptably interpreted as located at R 3.5 kpc.
358.721-0.126
We formally interpret the velocity of this new maser as indicating a distant site outside the solar circle, but with R 13.5 kpc; however, the choice is not clearcut since it lies slightly outside our suggested boundary for this longitude-velocity domain on Fig. 4, perhaps indicating a location with R 3 kpc.
358.809-0.085
The velocity of this new site perfectly matches the value expected for a location in the near side of the 3-kpc arm.
358.841-0.737
New maser with a velocity offset from zero sufficient to indicate non-circular motions and a location at R 3 kpc.
358.906+0.106
New maser with velocity suggesting R 3 kpc.
358.931-0.030
New maser with velocity similar to the previous site and likely to be at R 3 kpc.
358.980+0.084
New site fading from a peak of 1.6 Jy in the survey cube (2006 February) to less than 0.2 Jy in the MX spectrum of 2008 March; an intermediate value of 0.5 Jy was measured at the intermediate epoch 2007 November in the ATCA measurement. The survey cube spectrum is shown in Fig. 1. The velocity near zero is compatible with R 3.5 kpc if small non-circular motions are assumed.
359.138+0.031
For this known site, a weak feature at velocity -6 was clearly visible in 1992 and 1995 with peak flux density of 1.0 and 0.7 Jy respectively, and although now only marginally detectable (0.25 Jy), was used to define the velocity range; the systemic velocity is compatible with R 3.5 kpc.
359.436-0.104 and 359.436-0.102
Both sites are previously known. Their velocity ranges do not significantly overlap and the two sources shown on a single spectrum are distinguishable from the velocity ranges given in Table 1. Both systemic velocities indicate a location in the near side of the 3-kpc arm. At a distance of 5.1 kpc, their separation of 6.1 arcsec corresponds to 150 mpc. The first site is the stronger and its peak at -46.8 has increased from less than 7 Jy (in 1992 and 1995) to 60 Jy in the survey cube and to 75 Jy in the MX spectrum of 2008 March; a feature at -52 which was strongest (27 Jy) in 1992 has decreased to 13 Jy in 2008. The second site has recent peak intensities of 1.5 and 1.6 Jy, similar to 1992 but much smaller than its value of 4.4 Jy in 1995 (Caswell 2009). Forster & Caswell (2000) show a detailed map of continuum emission together with information on other masers.
359.615-0.243
Known, strong maser and highly variable. The peak intensity for the spectrum from the survey cube (2006 February) is at a velocity different from that of the follow-up MX spectrum (2008 March), and thus variability exceeds a factor of 2; indeed, near velocity +22.6 , intensities since 1992 have ranged from 15 Jy to 88 Jy. The high variability was noted by Caswell et al. (1995b) and additional monitoring information was presented by Goedhart et al. (2004). The positive systemic velocity is significantly offset from zero, indicating non-circular motions and a location at a Galactocentric radius R 3 kpc.
359.938+0.170
New single feature maser with flux density varying from 1.6 Jy in our survey cube discovery spectrum (2006 February), to 0.75 Jy in our ATCA measurement (2007 July) and 2.4 Jy in our MX follow-up (2008 March). The near-zero velocity is compatible with R 3.5 kpc.
359.970-0.457
Known maser, with one feature increasing from 1 Jy in 1992 to our MX measurement of 2.4 Jy in 2008 March, but the other fading from 0.8 Jy to less than 0.2 Jy, below our detection threshold. We cite the velocity range seen in 1992, +20 to +24 ; the velocity offset from zero indicates non-circular motions and a Galactocentric radius R 3 kpc.
0.092-0.663
New strong maser with its velocity suggesting R 3kpc.
0.167-0.446
New maser with intensity fading markedly from the survey cube value 4.4 Jy (2006 February), to 3.6 Jy during the ATCA measurement (2006 March) and to 1.3 Jy for the MX spectrum (2008 March). Its systemic velocity suggests R 3 kpc.
0.212-0.001
Known maser with velocity just within the range of the far side of the 3-kpc arm.
0.315-0.201 and 0.316-0.201
Known very close pair of maser sites, distinguishable on the ATCA spectra shown in Caswell (1996) and displayed here in a single spectrum. Intensity increases since 1995 are less than a factor of 2. The first site is strong with a wide velocity range; the second site is weak, with its small velocity range of emission contained within that of the stronger site. The systemic velocities strongly suggest R 3 kpc and thus a heliocentric distance 5 kpc, for which the separation of 2.6 arcsec corresponds to more than 60 mpc, in accord with the interpretation as two separate sites (Caswell 2009).
0.376+0.040
Known maser with intensity variations from 0.7 Jy (1992 and 1999 February), flaring to 2.3 Jy in our survey cube (2006 February) and back to 0.62 Jy in our MX spectrum (2008 March). Its velocity indicates R 3 kpc.
0.409-0.504
New maser, likely to be within R 3 kpc.
0.475-0.010
The history of this source is given by Caswell (2009), and identifies the error leading to the incorrect position of 0.393-0.034 originally reported by Caswell (1996). The corrected position and its re-evaluated peak intensity of 2.9 Jy from re-analysis of the old data from 1995 November (Caswell 2009) agree well with our new measurements between 2006 and 2009. The velocity range as measured in the earlier data is given in Table 1; the systemic velocity implies a likely R 3 kpc.
0.496+0.188
Known maser with many spectral features; the intensity is now more than twice as strong as the 10 Jy main peak measured in 1995 November. The velocity range straddling zero velocity could be compatible with R 3.5 kpc.
0.546-0.852
Known methanol maser site accompanied by water and OH masers and continuum emission (Forster & Caswell 2000). Formally, the velocity suggests a distant object outside the solar circle, or an anomalous velocity of a site within R 3 kpc. However, in view of its large latitude, it has alternatively been interpreted as nearby (with R 3.5 kpc) and an unusually large peculiar motion (Gardner & Whiteoak 1975; Caswell 1998). An astrometric distance will eventually resolve this uncertainty and yield an excellent distance if it is indeed nearby. Pending new data, we note that a far distance outside the solar circle of more than 17 kpc would imply an unlikely large Galactic height, z, of 250 pc. In contrast, a heliocentric distance between 5.5 and 8.5 kpc would not imply an unreasonable value of Galactic height, z, nor a contradiction to the apparent quite low obscuration (assuming the optical nebula RCW 142 to be associated). So we provisionally regard it as an object with R 3 kpc, as was assumed by Russeil (2003).
0.645-0.042 to 0.695-0.038 inclusive
These eleven sites in a cluster near Sgr B2 are contained within 3 arcmin and are individually separated by more than 10 arcsec. Nine sites were seen in the results of Caswell (1996, 2009), and were also visible with the sensitivity of our present survey (although confused in the single dish spectrum). The other two sites are very weak and were detected only in the observations of Houghton & Whiteoak (1995) who achieved high sensitivity with the ATCA using a full synthesis (although with low spectral resolution, channel spacing 8 kHz equivalent to 0.4 ). In Table 1, for all sites, we cite the HW (Houghton & Whiteoak 1995) positions and velocity ranges. We list Parkes measurements of flux density where they were not too confused. We were unable to establish reliable peak flux density values for 0.647-0.055 (2 Jy HW; 3.4 Jy Caswell 1996), 0.657-0.041 (1.8 Jy HW; 3.0 Jy Caswell 1996), 0.667-0.034 (0.4 Jy HW), and 0.673-0.029 (0.4 Jy HW) but, for convenience, list the HW velocity in the Table, and the corresponding HW flux density in parenthesis after the reference. Variability is difficult to establish in view of confusion for all measurements except those of Houghton and Whiteoak. Representative spectra are shown at three locations which span the positions of all eleven sites, with all eleven labelled to show which spectrum best matches their position. Reference to Houghton & Whiteoak (1995) is needed to distinguish the sites, and the labels on the spectra for those four sites that are extremely confused are enclosed in square brackets.
0.836+0.184
Known site, with velocity close to zero compatible with R 3.5 kpc.
1.008-0.237
New site, with velocity close to zero compatible with R 3.5 kpc.
1.147-0.124
New precise position (see also Walsh et al. 1998). The unusual velocity is most simply interpreted if R 3 kpc.
1.329+0.130
New single feature maser with unusual velocity best interpreted if R 3 kpc.
1.719-0.088
New site. The velocity is slightly negative and requires an assumption of small non-circular motions to be compatible with R 3.5 kpc.
2.143+0.009
Known maser with velocity well-matched to the far side of the 3-kpc arm. There is no detectable ucH ii region (Forster & Caswell 2000).
2.521-0.220
New maser with velocity straddling zero and compatible with R 3.5 kpc.
2.536+0.198
Known site with a wide velocity range from 2 to 20.5 ; the systemic velocity is compatible with R 3.5 kpc.
2.591-0.029
New maser with negative velocity. The assumption of a non-circular motion component is needed for compatibility with a Galactocentric radius R 3.5 kpc.
2.615+0.134 and 2.703+0.040
Two new sites with overlapping velocity ranges but separated by more than 7 arcmin and not confused (contrary to the similar appearance of features near +95 ). Their large positive velocities are most readily attributed to a location in the Galactic bar (see Section 4).
3.253+0.018
New maser with velocity straddling zero and compatible with R 3.5 kpc.
3.312-0.399
New weak maser with small positive velocity compatible with R 3.5 kpc.
3.442-0.348
New maser with single weak feature at a velocity well-matched to the near side of 3-kpc arm.
3.502-0.200
New maser at a quite high velocity that is not compatible with the 3-kpc arm nor with R 3.5 kpc; we therefore locate it within R 3 kpc.
4.569-0.079 and 4.866-0.171
Two of our weakest new masers, with flux densities of 0.44 Jy and 0.56 Jy respectively.
5.618-0.082
New maser with velocity well matched to the near side of the 3-kpc arm.
5.885-0.393
New maser with single feature at a velocity of +6.7 . It coincides with a previously known OH maser and strong H ii region, believed to be at a distance of 2 kpc (Stark et al. 2007). An earlier unsuccessful search for methanol in this direction, made in 1992 (Caswell et al. 1995a), yielded an upper limit of 0.3 Jy, presumably because it was weak at that epoch. Our position measurement with the ATCA (2006 December) showed a peak intensity similar to the survey cube value (2006 August) of 1.3 Jy, but our MX follow-up spectrum (2008 March) showed that it had faded again, to 0.5 Jy; both the survey cube and MX spectra are shown. Note that 5.885-0.0-393 is only 2 arcmin from the known source 5.900-0.430, and its velocity, straddled by features of the known source, suggest that the two sites are located at a similar distance. We have aligned their spectra so as to make it clear that only a single weak feature arises from 5.885-0.393.
4 Discussion
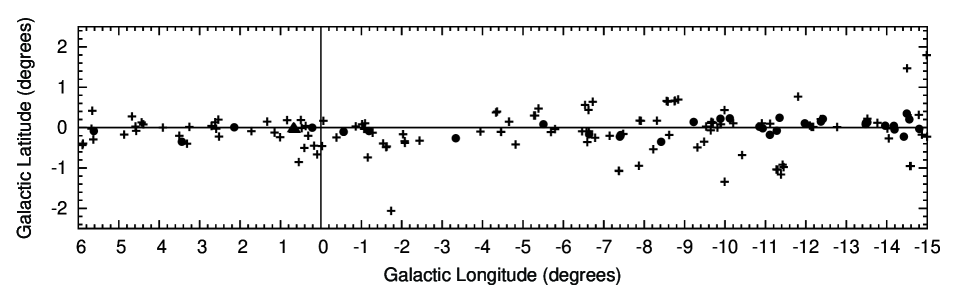
The distribution of maser sites is displayed in Fig. 2. For the purposes of later discussion we distinguish sources in the Sgr B2 complex by triangles, those believed to lie within the 3-kpc arm by circles and denote the remainder by crosses. Within 1∘ of the Galactic Centre, we can compare our results with an earlier survey (Caswell 1996) which was unbiased (not limited to pre-selected target positions) but was restricted to a narrow latitude coverage, and a small velocity range; 23 sites (11 in the Sgr B2 complex) were reported and another known site (0.546-0.852) lay outside the narrow latitude range. The MMB survey has been able to add only four new sites here, which clearly demonstrates that the full population very close to the Galactic Centre is indeed confined to a narrow velocity range and a small latitude range. In contrast, many more new sites were found in the region within 6∘ of the Galactic Centre, but excluding the well-studied central 1∘; here, 44 of the 60 sites listed are new. The smaller number of known sources (16) reflects the fact that previous searches had been limited to a modest number of pre-selected targets, and emphasises the value of the present sensitive unbiased survey. The new full coverage of regions both sides of the Galactic Centre now allows us to understand, for the first time, the Galactic Centre population in the context of its surroundings.
4.1 Flux densities
The median peak flux density of the 183 sources in this part of the survey is 4.1 Jy. Amongst the new detections, the only sources with peak flux density exceeding 20 Jy are 348.617-1.162, 351.688+0.171, 358.460-0.391 and 0.092-0.663 (none of them exceeding 50 Jy). The first of these is offset by more than 1∘ from the Galactic plane, and is probably quite nearby, while the distances of the other three are less clear. Seven known and seven new sources were below 0.7 Jy (as determined from our most sensitive MX spectra). Four new sources were below 0.7 Jy in the survey discovery spectra, of which the weakest was 4.569-0.079, which had a peak of 0.61 Jy in the discovery spectrum, and was subsequently measured as 0.44 Jy in the follow up MX spectrum.
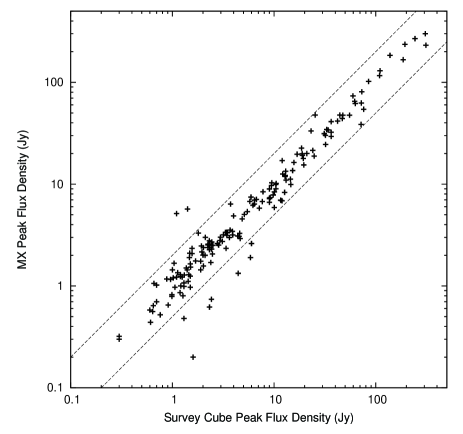
4.2 Variability and Completeness
The masers in the survey have generally been observed at least three times. The peak intensities from both the survey measurement and the ‘MX’ final spectrum are listed in Table 1, and a comparison at the two epochs is displayed in Fig. 3. In many cases the differences can be attributed to small measurement errors due to noise in the case of weak masers, and calibration uncertainties for stronger sources. The median ratio of MX peak flux density to survey cube peak flux density is 0.98, but some sites show significant differences between the two epochs, indicative of real intensity variability. The statistics of variability over a few epochs for a large number of sources was explored by Caswell, Vaile & Ellingsen (1995b), and for fewer sources over many epochs by Goedhart et al. (2004). Our statistics are broadly compatible with the earlier extensive work, and when the survey is complete we will reassess the variability statistics. The fact that variability does occur clearly impacts on the meaning of ‘completeness’ for any survey. Our completeness in the initial survey was discussed by Green et al. (2009a) and estimated to be 80 per cent at the 0.8 Jy level, and a progressively smaller percentage detected down to 0.6 Jy. The criterion for inclusion in the catalogue is that a high precision position from the ATCA must have been obtained. Our preliminary catalogue contained a few weak apparent detections that we were unable to confirm with the ATCA. Since they were close to our detection limit, we cannot distinguish whether they varied, or were spurious, and we omit them from the final catalogue. For most of the ATCA observations, a target would have been detectable even if it had faded to one-quarter of its initial intensity. We drew attention in the notes of Section 3 to nine sources that varied by more than a factor of two during our observations. This is a small fraction (5 per cent) of the survey total and so we expect very few of the sources not confirmed by the ATCA to be real ones that faded. Observations of the ‘piggyback survey’ (described by Green et al. 2009a) are approximately four times more sensitive than the main MMB survey and cover a significant fraction of the main survey region. They are currently being processed and will result in some new sources below the sensitivity limit of the present survey (the weak example ‘piggyback’ source displayed by Green et al. (2009a) is at a position covered by the present part of the survey). We envisage publishing ‘piggyback sources’ as a supplementary weak source catalogue, and will include any sources from the main survey which faded before the ATCA observations, but reappeared during future checks. Comparison of the piggyback results with the main MMB survey will also be used to more rigorously assess the completeness of the main survey.
There are nine sources where the peak has varied by more than a factor of two in our observing sessions since 2006 (see Fig. 3). For such strong variations it should be especially simple to discover from future monitoring whether any of these show strict periodicity such as has been established for seven enigmatic methanol masers to date (Goedhart et al. 2004 and citations thereto). In one instance (the new source 353.216-0.249) we have seen a rise, from 1.1 Jy to a peak of 5.1 Jy (MX on 2008 March 18) followed by decline to less than 1 Jy, when we made additional measurements (2009 April 5). 359.938+0.170 showed a drop from 1.6 Jy at its discovery in our survey cube to 0.75 Jy in our ATCA measurement followed by a recovery to 2.4 Jy in our MX follow-up 2008 March. The other seven strong variations during our observations were an increase for 345.985-0.020 and marked decreases for 349.579-0.679, 351.242+0.670, 358.980+0.084, 0.167-0.446, 0.376+0.040 and 5.885-0.393.
At least 16 previously known sources in our survey region have a history of variability, or show newly discovered variability when compared with our new measurements: 346.517+0.117, 346.522+0.085, 347.863+0.019, 350.011-1.342, 350.105+0.083, 350.116+0.084, 352.083+0.167, 353.273+0.641, 354.615+0.472, 358.386-0.483, 359.436-0.102, 359.436-0.104, 359.615-0.243, 359.970-0.457, 0.376+0.040 and 0.496+0.188. For six of these, the large changes are clearly seen from comparison of the spectra shown in this paper with Parkes spectra taken 15 years earlier, in 1992 (Caswell et al. 1995a). For some of the others, current spectra are comparable with those of 1992 and there was a flare or decline at an intermediate epoch (Caswell 2009) as detailed in the source remarks of Section 3.1.
More generally, there is also a wide range of variability in subsidiary features of these and many other masers, which will be the subject of future studies.
4.3 Galactic latitude distribution
The Galactic latitude distribution can be seen from Fig. 2. Our surveying strategy readily allowed extension to a larger latitude range than if the detected distribution had indicated that it might be worthwhile. This proved unnecessary even in the Galactic Bulge region, since our inspection of the latitude distribution of the 183 detected sources shows a tight concentration to low latitudes, with 173 lying within 1∘ of the Galactic plane. The 10 sources outside this latitude range (and within the currently presented longitude range) are: 345.010+1.792 with 345.012+1.797, 345.498+1.467, 348.617-1.162, 348.703-1.043 with 348.727-1.037, 350.011-1.342, 352.630-1.067 with 352.624-1.077, and 358.263-2.061.
Of these, only 348.617-1.162 is a new detection, and only 358.263-2.061 lies outside our regular survey coverage.
Overall, it is clear that towards the Galactic Centre, there is no significantly broader latitude distribution than elsewhere, and thus the Galactic Bulge that is recognisable from other varieties of objects contains no significant population of current high mass star formation regions.
From a pragmatic view, we argue that the narrow latitude distribution over all longitudes indicates that very few sources above our detection limit lie undiscovered more than 2∘ from latitude zero.
The significant interpretation from the narrow latitude distribution is that the masers are confined to a very thin disk and the maser population is dominated by distant objects beyond a few kpc. This will be discussed in more detail when the remainder of the survey is presented.
4.4 Absence of very high velocities
We recall that our velocity coverage of the region surveyed here, spanning the Galactic Centre, was very large, with the objective of covering all velocities where CO emission had been detected. Our maser detections are all found to lie within the quite small velocity range -127 to +104 . Within 2 degrees of the Galactic Centre, no detections were made outside the even smaller range of only -60 to +77 . In sharp contrast to the masers, the CO in this region shows a wide velocity range which extends from -260 to +280 (Dame et al. 2001), commonly interpreted as material in rapid rotation extremely close to the Galactic Centre. The absence of accompanying high velocity masers is an interesting result from our survey and may indicate that the conditions in this region are hostile to massive star formation (see also Section 4.6.3). Alternatively, the absence of detected masers from this molecular material may simply reflect the fact that the region considered is a very small volume, with very few masers expected unless their space density were extremely high.
4.5 Velocity ranges
As noted in Section 2, the velocity range (lowest and highest velocities) that we have chosen to list for each source in Table 1 corresponds to extreme values seen at any epoch, since this range is likely to be more meaningful in characterising the site than the individual values at different epochs, which depend mostly on variability and observational sensitivity. Only two of the 183 masers have ranges greater than 16 . These are the new source 353.429-0.090 with range nearly 19 ; and the known source 2.536-0.198 with range 18 . The range distribution is similar to that of the larger sample of Caswell (2009) which showed velocity widths exceeding 16 to be rare, accounting for a few per cent of the sources. The mid-value of the range is our preferred estimate for the systemic velocity of each site, a preference justified by Szymczak, Bartkiewicz & Richards (2007) and Caswell (2009).
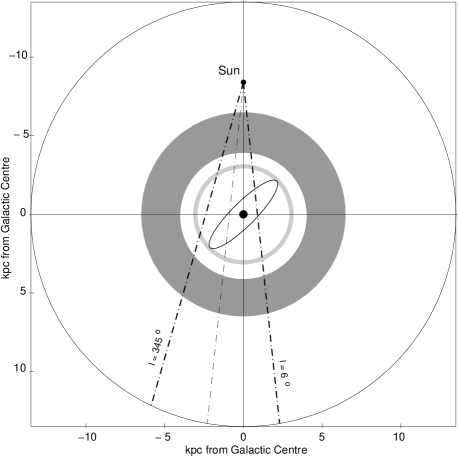
4.6 The space density and kinematics of masers
Our main aim in this section is to compare the Galactic Centre region with the remainder of the Galaxy, particularly with regard to the space density of maser sites which, in turn, can be interpreted as revealing the relative current rates of high mass star formation. The relevance of our results can be seen in Fig. 4 showing the coverage of the current portion of the survey in relation to the whole Galaxy. At large Galactocentric radius, R, there are vey few masers and we therefore limited the outer boundary to R = 13.5 kpc, beyond which there are no authenticated methanol maser sites and very little high mass star formation. The Galactocentric radius of the Sun, R⊙, is depicted at 8.4 kpc (see later). We also mark several distinct zones that will be discussed in detail later. These are: an annulus from 4 to 6.5 kpc which is known to have a high density of molecular material hosting massive star-forming sites and masers; an annulus from R = 3 to 3.5 kpc corresponding to the 3-kpc arm; the approximate extent of a Galactic bar; and a small region at the centre with radius 250 pc which we refer to as the Galactic Centre Zone; We note that maser sites physically near the Galactic Centre can be recognised firstly by their confinement to a small longitude range, but require distance estimates to distinguish them from foreground and background sites.
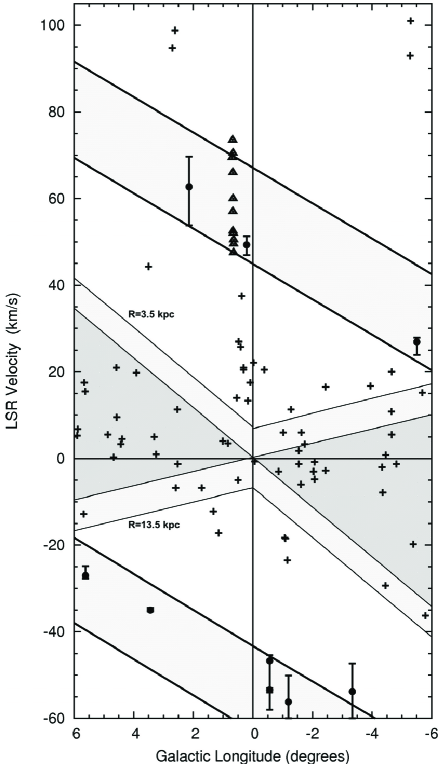
Fortunately, the unique kinematics near the Galactic Centre can act as a distance discriminator, as we will see from a discussion of Fig. 5, which shows the longitude versus velocity distribution for maser sites with . We have indicated several key domains in longitude-velocity (l-v) space. The precise location of the lines drawn depends on the Galactic rotation curve chosen (see next section), but the overall appearance is not affected by that choice. We will be emphasising the inferred Galactocentric radius of each maser site and will be less interested in the heliocentric distance. Objects at the Galactocentric radius of the Sun, R⊙, lie on the zero velocity locus (with minor variations if changes are made to the adopted solar motion). We bracket this region with the loci of objects in strict circular rotation at R values 3.5 and 13.5 kpc, so objects with 3.5 kpc R 13.5 kpc will lie in the shaded central region. We have increased the boundaries of this region by 7 to allow both for small deviations from circular rotation and for uncertainties in determining the systemic velocity for individual objects. The lower boundary of 3.5 kpc was chosen because extreme departures from circular rotation are known to be present inside this region. The most notable structure within 3.5 kpc is the ‘3-kpc arm’. We retain this common designation despite the fact that it is neither a simple spiral arm, nor is 3 kpc the best estimate of its Galactocentric radius. It is usually regarded as a ring, with R approximately 3.3 kpc and its most striking feature is an expansion outwards from the Galactic Centre at approximately 50 (see next sections). The wide lightly-shaded parallel sloping bands near the bottom and top of Fig. 5 correspond to the domain of the near and far sides of this ring, with parameters suggested by Dame & Thaddeus (2008) and as applied to an initial investigation of the present survey by Green et al. (2009b). Note that some prominent sites lying in this domain, members of the Sgr B2 complex, are not part of the 3-kpc arm, but lie much closer to the Galactic Centre.
Fig. 5 highlights the fact that near Galactic longitude zero there is very little velocity discrimination for sources over the large range of R between 3.5 and 13.5 kpc, where circular rotation dominates. This lack of discrimination is usually regarded as unfortunate and preventing the assignment of meaningful kinematic distances close to Galactic longitude zero. However, for our special purpose of recognising the Galactic Centre population, it is a strength rather than a weakness. With reference to Fig. 5, if we accept the premise that essentially all maser sites with R 3.5 kpc can lie only in the central l-v domain (dark shading with lightly shaded error band), and that the Galactocentric annulus between 3 and 3.5 kpc radius is wholly occupied by the 3-kpc ring sources (lightly shaded parallel bands with large offset from zero velocity), then sources in the unshaded l-v domain must all arise within 3 kpc of the Galactic Centre where non-circular motions can dominate. The number in the unshaded area will be a lower limit to (conservative estimate of) the number with R 3 kpc since some can share the same central l-v domain as the sources with R 3.5 kpc.
4.6.1 Galactocentric radii 3.5 kpc
We consider this region first so as to establish an estimate for the maximum space density of masers in the spiral arms, at Galactocentric radii 3.5 kpc, where high mass star formation chiefly occurs. This can then be a yardstick for comparison with the Galactic Centre. The small portion of the MMB survey presented in this paper is not suitable for detailed studies at R 3.5 kpc. However, the whole MMB survey southern region from Galactic longitude 186∘ through the Galactic Centre to 60∘ (as described by Green et al. 2009a) is essentially complete and, even in preliminary unpublished form, can provide an estimate adequate for our purpose. The study of spatial distributions also requires distance estimates for each source. Accurate distances are now being derived for methanol masers from VLBI measurements sufficiently precise to allow parallax determinations, but only a handful of sites have so far been measured (Reid et al. 2009). We must therefore rely at present on kinematic distances for most sources. However, the existing astrometric distances have already revealed a number of insights which suggest a slightly improved prescription for determination of kinematic distance estimates (Reid et al. 2009). Reid et al. adopt a flat rotation curve (with velocity 254 ) and incorporate a significant revision to the standard solar motion currently used to adjust velocities to the LSR (see also McMillan & Binney 2009; Binney 2009); they also apply a velocity correction (which partially counteracts the solar motion revision) assumed to be applicable to high mass young stars. This latter correction is somewhat more controversial, possibly indicative of the need for further revision to the solar motion (McMillan & Binney 2009, Binney 2009). For our purposes, the interpretation of the correction is not important since it does not greatly affect the resulting distances. We note that Reid et al. (2009) incorporate a Galactic Centre distance R⊙ of 8.4 kpc, rather than the IAU recommended value of 8.5 kpc. This scaling change is too small to noticeably affect the commonly described features within 3.5 kpc of the Galactic Centre, so we retain, for example, the mean radius for the 3-kpc arm of 3.3 kpc suggested by Dame & Thaddeus (2008).
We provisionally applied the Reid et al. (2009) prescription for kinematic distances to our preliminary unpublished MMB catalogue to derive the space density of masers as a function of Galactocentric radius R, for R 3.5 kpc. Note that for this purpose there is no need to discriminate between near and far distance ambiguities. A detailed analysis will be deferred until the full catalogue is finalized, but our initial studies (with no allowance for distance and luminosity effects) clearly show a broad peak in the radial distribution between Galactocentic radii 4 and 6.5 kpc at least as high as 7 masers per kpc2, where the area refers to the area in the plane of the Galaxy. This peak is an azimuthal average. It thus corresponds to a value smeared over spiral arm and inter-arm regions, so the space density within the arms is likely to be at least three times as high, i.e. 20 masers per kpc2. A peak between 4 and 6 kpc was also evident in the smaller sample of methanol masers (with poorer, and inhomogeneous, sensitivity limits) studied by Pestalozzi et al. (2007). The Galactic distribution of OH masers shows a similar peak between radii 4.25 and 6 kpc (Caswell and Haynes 1987; after scaling from their assumed Galactic Centre distance of 10 kpc to 8.4 kpc which is the only major change needed for a valid comparison with our present results).
4.6.2 The 3-kpc arm (expanding ring)
We now turn to the inner region of the Galaxy with R 3.5 kpc. Here, the atomic and molecular gas has long been known to exhibit unusual kinematics (e.g. Cohen & Davies 1976 and citations thereto), and features which are still not well understood. Most notable is the expanding 3-kpc arm, for which we adopt the parameters suggested by Dame & Thaddeus (2008). They treat it as a ring or annulus with mean radius of 3.3 kpc (based on the estimated location of tangent points to the ring as recognised in HI and CO at longitude 23∘), and showing an expansion velocity of between 53 and 56 , over and above circular rotation.
In the longitude velocity domain, the Dame & Thaddeus (2008) CO data allow clear recognition that the 3-kpc arm features lie on lines with a mean slope of 4.12 per degree. For a ring at Galactocentric radius R, this slope (strictly a sin(longitude) function, but close to a linear slope for small longitude) is very simply related to R, and its rotation velocity (e.g. Cohen & Davies 1976). If we adopt a value of R = 3.3 kpc, with R⊙ = 8.4 kpc and rotation velocity 254 at the Sun, the slope of 4.12 per degree implies a rotation velocity at 3.3 kpc of 193 , i.e. lower than at the Sun by 61 (more than 24 per cent). This is clear evidence that it would not be appropriate to assume a flat rotation curve extending from the solar circle to R as small as 3.3 kpc.
The distinctive kinematic signature of the 3-kpc ring (see Fig. 5), interpretable as a well-defined rotation velocity modified by an apparent expansion of more than 50 , has allowed the recognition of many methanol masers that lie within it (Green et al. 2009b). The presence of the masers demonstrates the ongoing massive star forming activity in the 3-kpc arms, which had earlier been in dispute. In the source notes, we identify the individual sources that are likely to lie in the 3-kpc arm, after making some small revisions to the preliminary assessment by Green et al. (2009b). We also draw attention to the presumed ‘start’ of the far 3-kpc arm near longitude 346∘ where it is assumed to originate, at the end of a Galactic bar. This appears to be a densely populated portion of the far arm, and while some outer spiral arm confusing sources may also be present in this domain of longitude-velocity space, the local over-density may well be an indication of especially active star formation in this unique part of the 3-kpc arm. We estimate that the mean space density of maser sites in the ring is approximately 4 per kpc2, when we approximate it to an annulus between Galactocentric radius 3 and 3.5 kpc, but make allowance for the limited domain where the kinematic signature is distinct from the outer spiral arms.
4.6.3 Region interior to the 3-kpc arm
Here we will distinguish between two discrete spatially confined structures and a more diffuse population within the inner 3-kpc of the Galaxy. The discrete structures are the Galactic bar and a small Galactic Centre Zone (GCZ) which we define as within a radius of 250 pc of the Galactic Centre (see Fig. 5).
Past discussions have recognised this Galactic bar, and a loosely defined central molecular zone (e.g. Morris & Serabyn 1996), both of which have already been noted as containing methanol masers (Caswell 1996, 1997). Our GCZ is a more precisely defined region which encompasses the central molecular zone.
With regard to the Galactic bar, the previously known maser 354.724+0.300 has already been attributed to this structure (Caswell 1997). It has a velocity that, for this longitude, is extremely anomalous (near +100 ); it is loosely associated with an HII region postulated to lie within the elliptical orbits of the Galactic bar (Caswell & Haynes 1982). The present survey has discovered a nearby companion maser 354.701+0.299. Two other masers, 2.615+0.134 and its companion 2.703+0.040, also have unusual velocities, near +94 . They could probably also be accommodated within the bar (far side of the ellipse shown in Fig. 3, and in fig. 1 of Caswell & Haynes 1982), and we regard this as the most plausible explanation.
The GCZ includes Sgr B2 as a distinct complex within it. This fact alone indicates that there is significant massive star forming activity in the GCZ but our objective is to assess whether the GCZ shows enhanced star forming activity additional to the Sgr B2 complex. From our definition of the GCZ as a disc of radius 250 pc centred on the nucleus, we note that for a Galactic Centre distance of 8.4 (or 8.5) kpc, the only maser sites that can be attributed to the GCZ must lie within the longitude range 358.3∘ to 1.7∘. This longitude sector will also include foreground and background sources. We can crudely estimate the foreground and background sources by making a comparison with the longitude range 1.7∘ 3.4∘, which statistically is expected to have similar numbers of foreground and background sources but cannot have any in the GCZ. We find 17 masers in the comparison longitude range, compared with 41 in the range 1.7∘. This suggests that 24 sites (including 11 within the Sgr B2 complex) lie in the GCZ. A similar result is obtained by extending the comparison region by a further 1.7∘. Thus statistically we have confirmed an earlier conclusion (Caswell 1996) that there is indeed a clear population of masers in the GCZ. However this simplistic approach does not make use of the valuable velocity information, and we now attempt to make the estimate more precisely, and identify the location of individual maser sites.
We first require an estimate of the mean space density of smoothly distributed masers within Galactocentric radius 3 kpc (which are necessarily confined within 20.9∘ of the Centre). With the exclusion of the 4 Galactic bar masers and those that could lie within the GCZ, we have estimated this to be 1.8 sources per kpc2. This value was derived using the preliminary MMB catalogue, from consideration of the longitude range within 20.9∘ of the Centre, but with the exclusion of the small sector 358.3∘ to 1.7∘, and removing sources that lie within the 3-kpc arm and those with kinematic Galactocentric distances greater than 3.5 kpc.
We now return to the 41 masers in the small sector within 1.7∘ of the Centre. We discuss these in our notes of Section 3.1 where we remark on the likely location of each of them based on their velocities and other available evidence. From these individual considerations and the overall statistics, we suggest that 10 of the 41 masers may lie more than 3.5 kpc from the Galactic Centre, these being the masers with LSR velocities close to zero (see Fig. 5). 4 sites are attributed to the 3-kpc arm. This then leaves 27 sites that appear to lie within 3 kpc of the Galactic Centre. 22 of these are expected to lie within the GCZ, since 5 possibly lie in the smoothly distributed population at radii between 250 pc and 3 kpc (using our estimated space density of 1.8 per kpc2). These assessments will eventually be verifiable from precise astrometry.
The 22 sites attributed to the GCZ include 11 within the Sgr B2 complex. The area in the plane of the Galaxy of the GCZ is 0.2 kpc2 and thus apart from Sgr B2, the space density of masers in the GCZ is 55 per kpc2; the 11 Sgr B2 sites increase it to 110 per kpc2. The space density is thus more that 50 times higher than in the immediate surroundings, and also somewhat higher than the average in the spiral arms of about 20 per kpc2 (Section 4.6.1). However, as noted by Caswell (1996), for such small regions, and taking into account the short lives of massive stars, the statistical fluctuations over time will be large, and there are likely to be similarly small regions in spiral arms with comparably high maser space densities at some epochs, as will become clear when statistics from the final catalogue are available. Our present conclusion is that the GCZ has a high current rate of star forming activity, rivalling, and probably exceeding that in the spiral arms. It reinforces and extends a conclusion (Caswell 1996) based on simple considerations of an earlier dataset restricted to a very small longitude range near the Galactic Centre.
4.7 Data availability and survey follow-up
All survey data sets will be made available online in due course, and will be a resource enabling archival searches for methanol emission (or absorption) towards future targets of interest. Global investigations of the maser distribution from the methanol survey and investigations of related quantities (such as the luminosity function) will be presented when final results for more of the Galaxy have been completed.
Comparisons with CO and HI (in some cases allowing distance discrimination between near and far kinematic distances) and other surveys are in progress and results will be deferred until a larger portion of the catalogue has been completed. Discussion of correlations with other objects such as those in the IR will also be deferred.
In addition to correlations with published data, we are conducting a number of new follow-up observational programs targeted towards the maser sites, in order to study various other methanol transitions, and also other molecular masing species.
The other methanol transitions include not only other masing transitions that are of the class II variety such as 12 GHz, but also Class I methanol masers such as those at 36 and 44 GHz.
Foremost amongst masers of other molecular species is the 6035-MHz transition of OH, which was surveyed in parallel with the methanol (Green et al. 2009a) but with results to be presented as a separate study. Other studies are being conducted for associated ground-state OH and for water masers at 22 GHz. The high frequency maser follow-ups will include studies of the primarily thermal emission from other molecular species such as ammonia and SiO, and deeper studies of the continuum to complement our existing 8.6-GHz data in searching for ultracompact and hypercompact H ii regions associated with the masers or in their vicinity.
5 Conclusions
This first portion of our Galactic Plane survey of methanol masers at 6668 MHz has emphatically confirmed the benefits of a survey which is unbiased rather than limited to pre-selected targets, and has generously covered ranges of velocity and Galactic latitude beyond pre-conceived expectations of where the masers would be concentrated. We have corroborated the confinement of maser sites to a thin disk population, even in the Galactic Centre region. Specifically, masers close to the Galactic Centre show no recognisable high latitude population that might be ascribed to the Galactic Bulge, and there are no sites at extreme velocities. However, there is a clear population associated with the ‘3-kpc arm’, both the near and far portions. There is also a high density of masers in the Galactic Centre zone, within 250 pc of the Galactic Centre. We have demonstrated this statistically, and identified the likely members from their kinematics. Results for the whole Southern Galaxy are nearly complete and will be presented soon, allowing more detailed comparisons of the Galactic Centre with the remainder of the Galaxy.
Acknowledgments
AA and DW-McS acknowledge support from a Science and Technology Facilities Council (STFC) studentship. LQ acknowledges support from the EU Framework 6 Marie Curie Early Stage Training programme under contract MEST-CT-2005-19669 “ESTRELA”. The authors thank staff at the Parkes Observatory and the Australia Telescope Compact Array for ensuring the smooth running of the observations. Both facilities are part of the Australia Telescope which is funded by the Commonwealth of Australia for operation as a National Facility managed by CSIRO.
We dedicate this paper to the memory of our friend and colleague Jim Cohen in recognition of his immense contribution to this project from its inception; the Galactic Centre focus in this first survey paper is especially appropriate in view of Jim’s major contribution to early studies of the Galactic Centre and the interpretation of its HI kinematics.
References
- (1) Binney J.J., 2010, MNRAS 401, 2318 (astro-ph0911.2661)
- (2) Busfield A.L., Purcell C.R., Hoare M.G., Lumsden S.L., Moore T.J.T., Oudmaijer R.D., 2006, MNRAS, 366, 1096
- (3) Caswell J. L., 1996, MNRAS, 283, 606
- (4) Caswell J. L., 1997, MNRAS, 289, 203
- (5) Caswell J. L., 1998, MNRAS, 297, 215
- (6) Caswell J. L., Phillips C.J., 2008, MNRAS, 386, 1521
- (7) Caswell J. L., 2009, PASA, 26, 454
- (8) Caswell J. L., Haynes R. F., 1982, ApJLetts, 254L 31
- (9) Caswell J. L., Haynes R. F., 1987, A&A, 171, 261
- (10) Caswell J.L., Murray J.D., Roger R.S., Cole D.J., Cooke D.J., 1975, A&A., 45, 239
- (11) Caswell J. L., Vaile R. A., Ellingsen S. P., Whiteoak J. B., Norris R. P., 1995a, MNRAS, 272, 96
- (12) Caswell J. L., Vaile R. A., Ellingsen S. P., 1995b, PASA, 12, 37
- (13) Cohen R.J., Davies R.D., 1976, MNRAS, 175, 1
- (14) Cragg D.M., Sobolev A.M., Ellingsen S.P., Caswell J.L., Godfrey P.D., Salii S.V., Dodson R.G., 2001, MNRAS, 323, 939
- (15) Dame,T.M., Hartmann D., Thaddeus,P., 2001, ApJ, 547, 792
- (16) Dame,T.M., Thaddeus,P., 2008, ApJ, 683, L143
- (17) Ellingsen S.P., Norris R.P.,McCulloch P.M., 1996, MNRAS, 279, 101
- (18) Forster J.R., Caswell J.L., 2000, ApJ., 530, 371
- (19) Gardner F.F., Whiteoak J.B., 1975, MNRAS, 171, 29p
- (20) Goedhart S., Gaylard M.J., van der Walt D.J., 2004, MNRAS, 355, 553
- (21) Green J.A., Caswell J. L., Fuller G. A. et al., 2008, MNRAS, 385, 948
- (22) Green J.A., Caswell J. L., Fuller G. A. et al., 2009a, MNRAS, 392, 783
- (23) Green J.A., McClure-Griffiths N.M., Caswell J. L., Ellingsen S.P., Fuller G. A., Quinn L., Voronkov M.A., 2009b, ApJLetts 696, L156
- (24) Houghton S., Whiteoak J.B., 1995, MNRAS, 273, 1033
- (25) McMillan P.J., Binney J.J., 2010, MNRAS, 402, 934 (astro-ph0907.4685)
- (26) Minier V., Ellingsen S.P., Norris R.P., Booth R. S., 2003, A&A., 403. 1095
- (27) Morris M., Serabyn E., 1996, ARA&A, 34, 615
- (28) Pandian J.D., Goldsmith P.F, Deshpande A.A., 2007, ApJ, 656, 255
- (29) Pestalozzi M. R., Minier V., Booth R. S., 2005, A&A., 432. 737
- (30) Pestalozzi M. R., Chrysostomou A., Collett J.L., Minier V., Conway J., Booth R. S., 2007, A&A., 463. 1009
- (31) Purcell C.R., Longmore A.J., Burton M. G., Walsh A. J., Minier V,, Cunningham M.R., Balasubramanyam R., 2009, MNRAS, 394, 323
- (32) Radhakrishnan V., Goss W.M., Murray J.D., Brooks J.W., 1972, ApJS,24, 49
- (33) Reid M.J., Menten K.M., Zheng X.W., Brunthaler A., Moscadelli L., Xu Y., Zhang B., Sato M., Honma M., Hirota T., Hachisula K., Choi Y.K., Moellenbrock, G.A., Bartkiewicz A., 2009, ApJ, 700, 137
- (34) Russeil D., 2003, A&A., 397, 133
- (35) Stark D.P., Goss W.M., Churchwell E., Fish V.L., Hoffman I.M., 2007, ApJ, 656, 943
- (36) Szymczak M., Bartkiewicz A., Richards A.M.S., 2007, A&A., 468, 617
- (37) Walsh A. J., Burton M. G., Hyland A. R., Robinson G., 1998, MNRAS, 301, 640
- (38) Xu Y., Li J.J., Hachisuka K., Pandian J.D., Menten K.M., Henkel C., 2008, A&A., 485. 729