Laboratoire des Colloïdes, Verres et Nanomatériaux, UMR CNRS 5587, Université Montpellier 2, 34095 Montpellier, France
Statistical mechanics of classical fluids Thermodynamics and statistical mechanics Granular solids
Superdiffusive, heterogeneous, and collective particle motion near the fluid-solid transition in athermal disordered materials
Abstract
We use computer simulations to study the microscopic dynamics of an athermal assembly of soft particles near the fluid-to-solid, jamming transition. Borrowing tools developed to study dynamic heterogeneity near glass transitions, we discover a number of original signatures of the jamming transition at the particle scale. We observe superdiffusive, spatially heterogeneous, and collective particle motion over a characteristic scale which displays a surprising non-monotonic behavior across the transition. In the solid phase, the dynamics is an intermittent succession of elastic deformations and plastic relaxations, which are both characterized by scale-free spatial correlations and system size dependent dynamic susceptibilities. Our results show that dynamic heterogeneities in dense athermal systems and glass-formers are very different, and shed light on recent experimental reports of ‘anomalous’ dynamical behavior near the jamming transition of granular and colloidal assemblies.
pacs:
05.20.Jjpacs:
64.70.qdpacs:
83.80.FgMany materials, from emulsions and suspensions to foams and granular materials are dense assemblies of non-Brownian particles [1]. Since thermal energy is irrelevant, the dynamics of these systems must be studied in driven non-equilibrium conditions. Together with the driving mechanism, a second important control parameter is the volume fraction of the particles, . These materials undergo a fluid-to-solid ‘jamming’ transition as increases beyond some critical density [2].
The properties of this jamming transition have received considerable interest in recent years, and much progress was made through the analysis of idealized theoretical models, such as soft, frictionless, repulsive particles as studied below [3]. Structural and mechanical properties of systems on both sides of the jamming transition have been analyzed [4, 5], and a number of remarkable features emerged, such as algebraic scaling of linear mechanical response [6], or the development of nontrivial timescales or lengthscales characterizing the macroscopic behavior of the system [7, 8, 9].
With the developments of new experimental techniques (confocal microscopy, original light scattering techniques, etc.), the dynamics of systems near the jamming transition can now be resolved at the particle scale. Very recently, a number of ‘anomalous’ or ‘unexpected’ dynamic behaviors were reported in granular and colloidal assemblies: superdiffusive particle motion [10, 11], nonmonotonic variations of characteristic scales across the transition [11, 12, 13, 14], anomalous drop of dynamic correlations upon compression [13, 15]. Thus, it appears timely to investigate, at the fundamental level of single particle trajectories, the signatures of the jamming transition in idealized theoretical models. Our work reveals original signatures of the jamming transition in both fluid and solid phases which, we believe, shed light on recent experimental findings. We also establish a connection between single particle dynamics and collective particle motion, which allows us to develop an intuitive and appealing picture of jamming as the consequence of the diverging size of rigid particle clusters.
We study a bidimensional 50:50 binary mixture of particles of diameter ratio 1.4 with harmonic repulsion [16], , where is the distance between the centers of particle and , , and is the diameter of particle . Particles only interact when they overlap, . We work in the zero temperature limit, so that all the dynamical processes in the system are induced by an external driving. We use a simple shear flow, and perform quasi-static shear simulations, as described before [17]. Very small shear strains are applied, followed by a minimization of the potential energy. At each step, particles are first affinely displaced along the -axis by an amount with . Appropriate Lees-Edwards periodic boundary conditions are used. During the subsequent energy minimization, additional nonaffine displacements occur in both directions. In the dilute limit, these nonaffine displacements are absent, and their presence directly reveals the influence of interactions and interparticle correlations. In the following, we focus on the purely nonaffine displacements occurring along the -direction, i.e. transverse to the flow. We use system sizes , 1600 and 2500 to detect finite size effects. The unique control parameter is the volume fraction, . Below a critical value, , which is well defined and sharp in the thermodynamic limit, the system flows with no resistance, while a yield stress grows continuously from 0, when increases above [18]. This corresponds to the jamming transition for the present system and driving conditions.
The simplest quantity which is measured from particle displacements is the root mean-squared displacement, where is the transverse displacement of particle after a total strain is applied. In this expression, the brackets indicate averages taken over independent initial conditions all chosen in the driven stationary state at a particular density. We present the evolution of at various volume fractions across in Fig. 1. The displacements in the yield-stress flow regime above are diffusive at all strains, . This is a robust signal of the quasi-static dynamics in yield-stress materials. It can be traced back to the accumulation of plastic rearrangements spanning the entire system [19, 20]. The important observation here is that the diffusion constant depends only weakly on density and distance to .
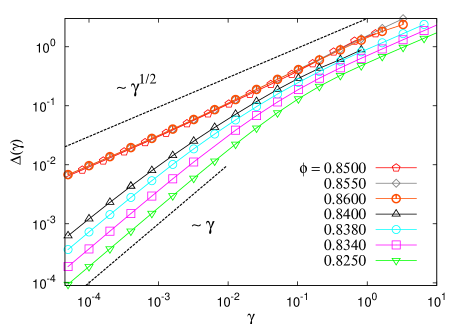
The regime below is more interesting. At any given volume fraction, particles move in a superdiffusive, ballistic manner at short strain, , before crossing over to diffusive motion at large strain. Since we work at zero temperature, this ballistic regime is completely unrelated to the trivial short-time ballistic displacements in particle systems with classical Newtonian dynamics.
Superdiffusive behavior can be interpreted from the observation that below the jamming transition, the network of particle contacts is not sufficient to insure mechanical stability, and there exists a large number of zero-frequency modes allowing particle displacements at no energy cost [21]. The actual displacement field is a superposition of these modes, which can thus persist until the particle configuration has evolved sufficiently to decorrelate the mode spectrum. Persistence of the modes, followed by their decorrelation explain superdiffusive and diffusive motion, respectively.
Remarkably, Fig. 1 shows that particles move faster when is increased towards in both ballistic and diffusive regimes. In particular, the short-time particle ‘velocities’ increase with . This is a surprising finding because compression towards jamming usually yields slower dynamics [11, 15]. Note that is a displacement per unit of strain and thus has the dimension of length. Thus an increasing particle velocity in fact implies an increasing length scale. Indeed, we will argue below that superdiffusion reflects the concerted motion of solid-like clusters of particles correlated over a length scale comparable to , and which grows towards .
The displacements and the associated length scale measure how much particles have to move in addition to the affine displacements, in order to accomodate the imposed shear flow. At , for example, this additional displacement is about ten times larger than the affine contribution itself. This means, that close to the system is in a highly ‘fragile’ state and small changes in the boundary or loading conditions lead to large-scale motions [22].
Interestingly, superdiffusion was recently used to identify the location of the jamming transition in a bidimensional granular system [11]. Due to the ‘random agitation’ driving mechanism in that experiment, superdiffusion is observed on a modest time window, and only very close to . This is consistent with our finding that superdiffusion is indeed most pronounced near the transition.
A second, often studied, correlation function to quantify single particle dynamics is the ‘overlap’ function [11]
| (1) |
The overlap goes from 1 to 0 as typical particle displacements get larger than the probing length scale . It is thus very similar to a self-intermediate scattering function in liquids, with playing the role of an inverse wavevector, and the role of time.
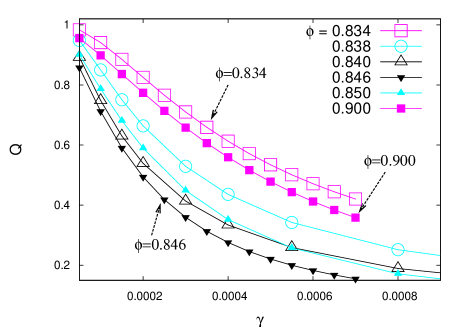
The behavior of is presented in Fig. 2 for a fixed (qualitatively similar results are obtained for different choices of ) and various volume fractions across . For , we find that the overlap function decays faster when increases. This is consistent with the above observation that displacements get larger closer to . A qualitatively different behaviour is found above the transition, where the overlap decays more slowly when increases. This is in striking contrast with the behavior of the mean squared displacement in Fig. 1 which showed no such variations with .
The data in Fig. 2 thus imply the existence of an unexpected nonmonotonic variation of the dynamical behaviour, which is absent in the root mean-squared displacement, Fig. 1. To quantify these differences we define the analog of the displacement scale, , discussed above. For a given strain we measure the value of such that
| (2) |
The value 0.5 is arbitrary and we find similar results with 0.3 and 0.7. For small strains within the ballistic regime this definition insures that is independent of strain and reflects a short-time velocity, as does its analog . For larger strains a crossover to diffusive behavior sets in similar as for the root mean-square displacement (Fig. 1). In the following, we want to avoid this crossover and thus choose as small as possible.
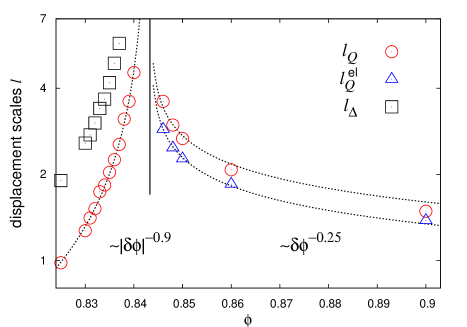
In Fig. 3 we report the behaviour of as defined from Eq. (2), which clearly reflects the nonmonotonic behaviour of the overlap observed in Fig. 2. This result shows that a remarkably simple statistical analysis of single particle displacements in athermal systems very easily reveals the existence of, and quite accurately locates, the fluid-to-solid jamming transition. This measurement requires no finite size scaling, or other involved or indirect statistical analysis [11, 12, 15].
We have discussed two signatures of the jamming transition from the behavior of (superdiffusion) and (nonmonotonic relaxation as a function of density). It should come as a third surprise that both dynamic quantities apparently provide distinct informations, in particular for , although they both aim at quantifying dynamics at the particle scale. In fact, such discrepancies are well-known and well-studied in the field of the glass transition where several similar ‘decoupling’ phenomena have been studied [23]. Indeed, if the particle dynamics were a Gaussian process, the information content of and would be mathematically equivalent. Their different behavior thus suggests that the distribution of single particle displacements is strongly non-Gaussian [25].
To substantiate this claim we report the evolution of the van Hove distribution, , as a function of volume fraction below (Fig. 4). Above the shape of the van Hove function has a form well-known from recent work on sheared glasses [19, 20]; therefore, we do not show our data here. Briefly, the distribution is ‘bimodal’, with a first component at small resulting from displacements during reversible elastic branches, and a second component at larger due to irreversible plastic events. This latter contribution completely dominates the second moment of the distribution, and thus controls the diffusive behavior of in Fig. 1.
The decomposition between elastic and plastic branches above suggests a separate analysis of these two types of dynamics. We have computed along elastic branches only, and defined , the ‘elastic’ analog of the displacement scale for the full overlap; it is shown in Fig. 3. Both and are very close, confirming that is not very sensitive to plastic rearrangements, in contrast to . The scaling of the typical elastic response above has recently been discussed in great detail [24, 26, 27], and we simply quote the result: , in good agreement with our numerical results.
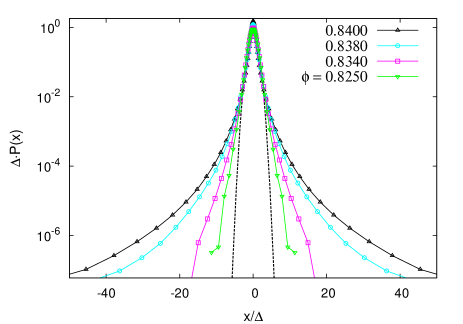
Below the distributions remain highly non-Gaussian (Fig. 4), even though plastic events are absent. Deviations from a Gaussian shape become stronger as increases towards . The distribution develops polynomial tails, and it is thus not surprising that different averages taken over such distributions provide quantitatively distinct results. In Fig. 3, we show that , for . In contrast, we find that the scale , defined in Fig. 1, scales as with an exponent slightly distinct from the one of . Hence, despite the appeal of the algebraic ‘scaling’ relations reported in Fig. 3, our particle distributions do not follow simple scaling forms, even along elastic branches, in apparent contradiction with recent claims [27]. Single particle dynamics is not ‘universal’ near the jamming transition and it is somewhat ambiguous to define ‘typical’ displacements from such broad distributions.
It is tempting to speculate that the polynomial tails which develop near but below in Fig. 4 are in fact the ‘precursors’ of plastic events taking place above . The tails in fact become so broad that the kurtosis of the distribution (also called ‘non-Gaussian parameter’) actually diverges at small when is approached from below (data not shown). This implies that the kurtosis could be used as a second, simple statistical indicator of the underlying jamming transition. In glass-formers, the non-Gaussian parameter increases as the glass transition is approached, but much more modestly [28], while van hove distributions develop exponential rather than algebraic tails [25].
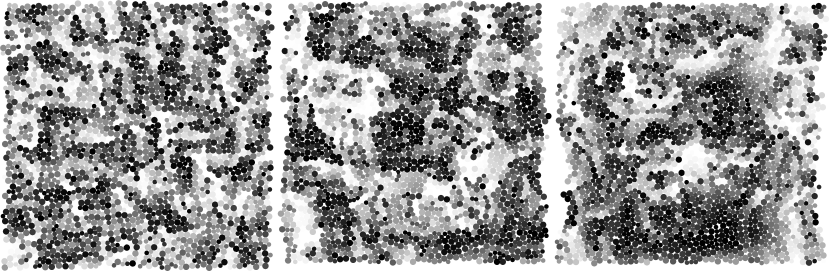
Let us now turn to the discussion of particle correlations. This will allow us to make concrete the notion of ‘rigid’ clusters that we have alluded to above. To this end, we first discuss the images shown in Fig. 5, where the spatial fluctuations of the overlap are shown. From this figure, we can readily identify dynamically correlated clusters of particles, that clearly grow in size upon approaching from below. These images are direct evidence that dynamics becomes more collective as is approached. Above the system is now solid, and responds as an elastic body. Correspondingly, mobility fluctuations are correlated on a length scale comparable to the system size, the only visible effect of the density being that the snapshot looks less ‘disordered’ at the largest . Very similar observations were recently made experimentally in a soft granular material [14].
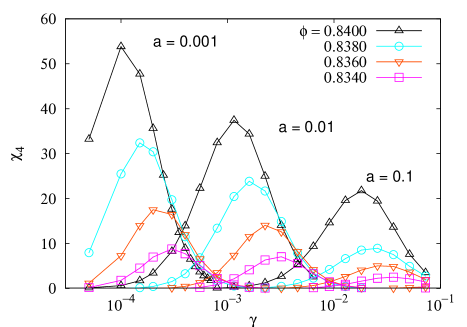
To quantify these qualitative observations, we study the dynamical susceptibility , defined as the variance of statistical fluctuations of the overlap [29], , where represents the instantaneous contribution to the average . Our results are summarized in Fig. 6. In all cases, displays a well-defined maximum when shown as a function of , which shifts towards lower strain when increases. This maximum identifies a strain for which fluctuations of the overlap are maximal, and is slaved to the typical strain over which decays in Fig. 2, as commonly found in studies of dynamic heterogeneity [30, 31]. As is well-known, the height of this maximum is a good estimate of the number of particles relaxing in a correlated manner [31], which justifies the fundamental importance of . The increase of the height of the peak of the dynamic susceptibility when increases towards in Fig. 6 thus quantitatively confirms the visual impression given by the snapshots: the dynamics is increasingly collective when increases towards . As shown in Fig. 6, this conclusion does not depend on our choice of a probing length scale .
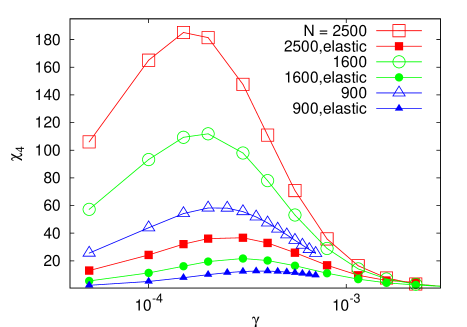
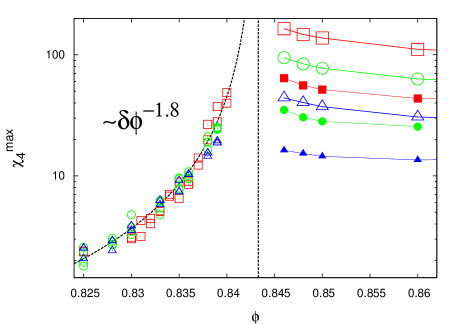
To quantify the possible divergence of the spatial correlation of the dynamics, we analyze the data as above for the overlap. For a given strain , we look for such that is maximum (it corresponds roughly to defined in Eq. (2)) and measure its height. We report the evolution of this maximum as a function of volume fraction in Fig. 7. The data for three different system sizes superimpose below , and we can satisfactorily describe the -dependence as: . Comparing this apparent divergence with the much more modest increase of dynamic correlations in glass-forming liquids close to the glass transition [32], emphasizes once more the qualitative differences between both types of transitions.
Assuming that correlated domains have a compact geometry, this finding immediately translates into a genuine dynamic correlation length scale, , which grows as . Strikingly, we found a similar power law divergence for both and in Figs. 1 and 3. The exponents are furthermore close to the one obtained in previous work [17] using the spatial dependence of the displacement correlation function.
These findings call for a simple relation between single-particle displacements, as characterized by or , and particle correlations, as given by or by displacement correlations. The picture that we propose assumes particles to form ‘temporarily rigid’ clusters of the size of the correlation length . Driven by the shear-strain these clusters move or rotate in a solid-like manner over distances . This motion shows up as pronounced ballistic regime in the mean-squared displacement or in the decay of the overlap function and allows to make the identification, . The cross-over to particle diffusion then corresponds to a typical cluster lifetime. On longer strains, clusters break up and lose their identity. This process is evident in the reduction of the dynamical correlation length as measured by the decreasing amplitude of with in Fig. 6.
Moving to in Fig. 6, we observe that still exhibits a maximum at a given strain , which again tracks the relaxation of . Remarkably, we now find that the height of this peak strongly depends on the system size, and increases roughly linearly with , see Fig. 6. This suggests that spatial correlations saturate to the system size at and remain scale-free above in the entire solid phase[18]. This is in agreement with studies of the mechanical response of disordered solids, which showed evidence of plastic rearrangements spanning the entire system [33, 20]. Additionally, we show in Figs. 6 and 7 that the dynamic susceptibility measured along purely elastic branches (discarding plastic events), is linearly growing with as well. Indeed, the elastic response of a disordered solid is also scale-free, as shown theoretically [34, 35] and numerically [36, 37].
For a given system size, grows with below , and becomes proportional to above . However, the amplitude of decreases slowly with above . The net result is that , for a fixed system size , has a striking nonmonotonic behaviour with , and presents an absolute maximum at , which adds to our list of microscopic signatures of the jamming transition.
A similar maximum of has recently been reported both for colloidal [13, 15] and granular [11] assemblies, and given two distinct interpretations. It was associated to a nonmonotonic dynamic correlation length scale diverging at in Ref. [11]. Alternatively, it was attributed to a nonmonotonic strength of essentially scale-free spatial correlations in Refs. [13, 15]. Our results clearly favor the second interpretation to explain the behavior above . The dynamic susceptibility above is system size dependent with scale-free spatial dynamic fluctuations (Fig. 7).
This finding suggests that the length scale identified from the low-frequency part of the vibrational spectrum, and much studied recently [7, 27, 37] does not directly influence the dynamics at the particle scale beyond the linear regime where it belongs. We suggest, however, that it indirectly influences the behaviour of , and leads to the decaying strength of the correlations as observed in Fig. 7 above . The evolution of the displacement length scale above in Fig. 3 suggests a simple explanation for this decay. The overlap function relax when typical displacements are of the order of . When increases, typical displacements in response to strain increments become smaller, and more steps are needed to decorrelate the overlap. If these steps are not perfectly correlated, more steps directly imply less dynamic fluctuations and thus a reduced [31]. This physical explanation was made more quantitative in the empirical model of Ref. [15], which then accounts for a nonmonotonic evolution of across .
To summarize, borrowing tools from studies of dynamic heterogeneity in glass-formers, we provided a detailed account of the evolution of the microscopic dynamics of an idealized model system across the jamming transition. We found a number of original signatures, that are strikingly different from the behaviour of viscous liquids, but might have been observed in recent experimental reports. Given the (relative) ease with which particle trajectories can be monitored in suspensions, foams, or granular assemblies, we hope our study will motivate further experimental studies along the lines of the present study.
Acknowledgements.
CH acknowledges financial support from the Humboldt Foundation.References
- [1] R. G. Larson, The Structure and Rheology of Complex Fluids (Oxford University Press, New York, 1999).
- [2] Jamming and Rheology: Constrained Dynamics on Microscopic and Macroscopic Scales, edited by A. J. Liu and S. R. Nagel (Taylor and Francis, New York, 2001).
- [3] For a review, see M. van Hecke, J. Phys. Cond. Mat. 22, 033101 (2010).
- [4] A. Donev, S. Torquato, and F. H. Stillinger, Phys. Rev. E 71, 011105 (2005).
- [5] C. S. O’Hern et al., Phys. Rev. Lett. 88 075507 (2002).
- [6] C. S. O’Hern et al., Phys. Rev. E 68, 11306 (2003).
- [7] M. Wyart, S. R. Nagel, and T. A. Witten, Europhys. Lett. 72, 486 (2005).
- [8] P. Olsson and S. Teitel, Phys. Rev. Lett. 99, 178001 (2007).
- [9] T. Hatano, Phys. Rev. E 79, 050301(R) (2009).
- [10] L. Cipelletti et al., Phys. Rev. Lett. 84, 2275 (2000).
- [11] F. Lechenault et al., Europhys. Lett. 83, 46003 (2008).
- [12] R. Candelier and O. Dauchot, Phys. Rev. Lett. 103, 128001 (2009); Phys. Rev. E 81, 011304 (2010).
- [13] D. A. Sessoms et al., Phil. Trans. R. Soc. A 367, 5013 (2009).
- [14] X. Cheng, Phys. Rev. E 81, 031301 (2010).
- [15] P. Ballesta, L. Cipelletti, and A. Duri, Nat. Phys. 4, 550 (2008).
- [16] D. J. Durian, Phys. Rev. Lett. 75, 4780 (1995).
- [17] C. Heussinger and J.-L. Barrat, Phys. Rev. Lett. 102, 218303 (2009).
- [18] C. Heussinger, P. Chaudhuri and J.-L. Barrat, arXiv:1001.0658.
- [19] A. Lemaître and C. Caroli, Phys. Rev. E 76, 036104 (2007).
- [20] A. Tanguy, F. Leonforte, and J.-L. Barrat, Eur. Phys. J. E 20, 355 (2006)
- [21] S. Alexander, Phys. Rep. 296, 65 (1998).
- [22] M. E. Cates et al., Phys. Rev. Lett. 81, 1841 (1998).
- [23] M. D. Ediger, Annu. Rev. Phys. Chem. 51, 99 (2000).
- [24] W. G. Ellenbroek et al., Phys. Rev. Lett. 97, 258001 (2006).
- [25] P. Chaudhuri, L. Berthier, and W. Kob, Phys. Rev. Lett. 99, 060604 (2007).
- [26] M. Wyart et al., Phys. Rev. Lett. 101, 215501 (2008).
- [27] W. G. Ellenbroek, M. van Hecke, W. van Saarloos arXiv:0911.0944.
- [28] W. Kob, et al., Phys. Rev. Lett. 79, 2827 (1997).
- [29] S. Franz and G. Parisi, J. Phys.: Condens. Matter 12, 6335 (2000).
- [30] N. Lacevic, et al., J. Chem. Phys. 119, 7372 (2003).
- [31] C. Toninelli et al., Phys. Rev. E 71, 041505 (2005).
- [32] L. Berthier, et al., Science 310, 1797 (2005).
- [33] C. E. Maloney and A. Lemaitre, Phys. Rev. Lett. 93, 016001 (2004).
- [34] B. A. DiDonna and T. C. Lubensky, Phys. Rev. E 72, 066619 (2005).
- [35] G. Picard, et al., Eur. Phys. J. E 15, 371 (2004).
- [36] C. E. Maloney. Phys. Rev. Lett. 97, 035503 (2006).
- [37] F. Leonforte, et al., Phys. Rev. B 70, 014203 (2004).