Discovery of the Transiting Planet Kepler-5b
Abstract
We present 44 days of high duty cycle, ultra precise photometry of the 13th magnitude star Kepler-5 (KIC 8191672, =6300 K, =4.1), which exhibits periodic transits with a depth of 0.7%. Detailed modeling of the transit is consistent with a planetary companion with an orbital period of days and a radius of . Follow-up radial velocity measurements with the Keck HIRES spectrograph on 9 separate nights demonstrate that the planet is more than twice as massive as Jupiter with a mass of and a mean density of g/cm3.
1 INTRODUCTION
The launch of Kepler offers a special opportunity to study the nature of transiting extrasolar planets through transit photometry. The Kepler mission is designed to determine the frequency of terrestrial-size planets. The Kepler mission also provides an excellent platform to study and understand the wide variety of extrasolar planets. From the spacecraft’s Earth-trailing orbit heliocentric photometric measurements are devoid of artifacts usually associated with instruments in close proximity to the Earth, due to problems such as the day-night cycle and effects imposed by the Earth’s atmosphere on ground based observations, and orbital effects for satellites in low earth orbit.
We report the discovery and confirmation of Kepler-5b, a strongly irradiated transiting hot Jupiter. We describe the Kepler photometry and transit modeling, and the follow-up observations used to confirm that Kepler-5b is a planet, including an orbital solution using radial velocities obtained with HIRES on Keck 1.
2 KEPLER PHOTOMETRY
The Kepler photometer consists of a 0.95-m Schmidt telescope feeding an array of 42 CCDs with a broad (430 - 890 nm) spectral response (Koch et al., 2010). From its Earth-trailing heliocentric orbit and single field of view, Kepler can monitor more than 100,000 stars nearly continuously for the lifetime of the mission.
Photometry of Kepler-5b (KIC 8191672, , , Kepmag=13.369) was obtained during 1 May - 15 June 2009, at an integration time of 29.426 minutes for each observation. This run includes 9.7 days of photometric data taken while ground analysis was being performed in preparation for start of science operations, and is referred to as the Q0 data set (Haas et al., 2010). Kelper science operations began on 12 May 2009, which compose the second data set of 33.5 days of photometry referred to as the Q1 data set. There is a gap with a length of 30 hours between Q0 and Q1 to facilitate contact between the spacecraft and groundstations for downlink of the Q0 data stream.
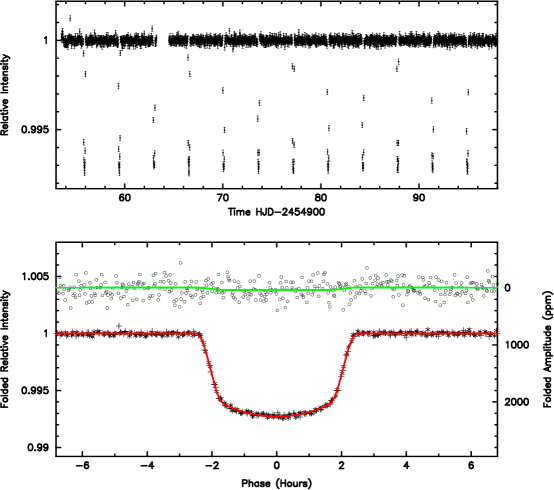
After pipeline data processing and photometry extraction, as described in Jenkins et al. (2010) and Caldwell et al. (2010), the time series stream was detrended with a running 1-day mean. All observations that occurred during a transit were rejected from the evaluation of the mean. The detrended photometry is presented in Figure 1.
2.1 Initial Transit Fits and False-Positive Detection
From examination of Q0 light curves, Kepler-5 and a few dozen other candidates were initially flagged as Kepler Objects of Interest (KOI). To identify the best candidates for ground-based follow-up observations, a number of metrics are computed to help recognize and reject stellar binary systems that can mimic a planetary transit signal. A quick summary of these steps, as it relates to Kepler-5 are listed below. For a full description of the steps taken to identify false positives see Batalha et al. (2010).
The transit lightcurve is modeled using the analytic expressions of Mandel & Agol (2002) using -band non-linear limb darkening parameters Claret (2000). The stellar radius (), effective temperature () and surface gravity () are fixed to values adopted from Kepler Input Catalog (KIC). The stellar mass () is usually calculated from and . In the case of Kepler-5, a larger stellar radius of 1.9 was required to be consistent with the transit duration. With and fixed to their initial values, a transit fit is then computed to determine the orbital inclination, planetary radius, and depth of the occultation (passing behind the star) assuming a circular orbit. The best fit is found using a Levenberg-Marquardt minimization algorithm (Press et al., 1992).
These initial fits are used to determine whether the transit is representitive of a planetary event. In the case of a stellar binary where the surface brightness of the two components differ, the observed depth of the odd and even numbered transits will differ. There was no measurable difference in the transit depths to report.
For systems that show only primary transits, a search is made for a weak occultation assuming that the orbit is circular, namely at phase 0.5. In the cases where an occultation is found with significance greater than for the depth, the dayside temperature of the planet can be estimated. From the depth of the occultation, the flux ratio of the planet and star () over the instrumental bandpass can be obtained. The depth of the transit indicates the ratio of the planet and star radii. By assuming that the star and planet both behave as blackbodies and the flux ratio is bolometric, the dayside effective temperature can be estimated. For Kepler-5 we find . This gives a planetary effective temperature of K, where an error of 30% is assumed for the input stellar luminosity and radius. This estimate is a lower limit, as a significant fraction of the planetary flux is emitted at wavelengths longer than the red edge of the Kepler bandpass, but it is a useful diagnostic in order to determine whether the depth of the occultation is consistent with a strongly irradiated planet. To make this comparison we can estimate the equilibrium temperature,
| (1) |
for the companion, where and are the stellar radius and temperature, with the planet at distance with a Bond albedo of , and is a proxy for atmospheric thermal circulation. We assume for highly irradiated planets (Rowe et al., 2006) and for efficient heat distribution to the night side. Assuming stellar irradiation is the primary energy source, these parameter choices give a rough estimate for the dayside temperature of the planet. Assuming a 30% error in the input stellar parameters and that the star and planet act as blackbodies we find for Kepler-5b. The consistency of and to first order suggests that the occultation is consistent with a strongly irradiated planet. If the estimate of were found to be much larger than , then the companion is likely to be self-luminous and is probably a star.
2.2 Centroid Shifts
The Kepler pipeline provides measurements of the centroids of stellar images with a precision of about 0.1 millipixel for the brightness of Kepler-5 (Batalha, 2010). Examination of the image centroids during transits revealed shifts with an amplitude of 0.2 millipixels. Such a motion can result if the photo-aperture for Kepler-5 includes light from another source. We examine and demonstrate with speckle and adaptive-optic (AO) images in Section 3.1 that the centroid motion observed for Kepler-5 can be accounted for by the presence of nearby faint stars with constant brightness.
3 FOLLOW-UP OBSERVATIONS
After a KOI passes the above tests, additional ground-based follow-up observations are obtained as described in Gautier et al. (2010). These observations include high-resolution imaging to search for additional sources of flux within the Kepler photometric aperture that would dilute the depth of the transit, and reconnaissance spectroscopy to confirm and refine the KIC stellar classification and to search for evidence of stellar companions.
3.1 High-Resolution Imaging
Ground-based visible-light speckle imaging from the WIYN Telescope and near-infrared AO imaging from the Mt. Palomar 5-m telescope show that Kepler-5 has two companions. The first companion is away and 5.2 magnitudes fainter, as seen in the NIR-AO image, but is not visible in the speckle image. The other companion, KIC 8191680, is away with a Kepler magnitude of 17.69. The difference in Kepler magnitude between Kepler-5 and KIC 8191680 can be used to compute the expected centroid shift, depending on which object is assumed to be the source of the transit signal.
If KIC 8191680 is a background eclipsing binary, then the centroids are expected to shift by +14.0 and millipixels in the column and row directions of the detector, respectively. If KIC 8191680 shows no flux changes and Kepler-5 is indeed the source of the transit signal, then the expected centroid shift is and 0.0 millipixels, which is consistent with the centroid shift reported in Section 2.2. The transit depth is estimated to be diluted by %. We include the effects of dilution in our transitfits.
The speckle image shows a single star within its square field. This rules out very close background eclipsing binaries that might simulate the observed transits, except for stars lying closer than about from the target star.
3.2 Reconnaissance Spectroscopy
The FIbre-fed Echelle Spectrograph (FIES) on the 2.5-m Nordic Optical Telescope (NOT) was used on 4 June 2009 to obtain a spectrum of Kepler-5 for the purposes of stellar classification. Stellar parameters of and K were estimated, which were used to refine the transit model fits described in §2.1. The spectrum shows no indication that the system includes an eclipsing binary or has a composite spectrum.
3.3 HIRES Spectroscopy
HIRES spectra were obtained from 3-6 June, 2-4 July, and on 6 October, 2009. Figure 2 shows the radial velocities for Kepler-5 folded with the photometric period of the planet. An analysis of the Keck/HIRES template spectrum by D. Fischer using SME (Valenti & Piskunov, 1996) measured the stellar parameters as listed in Table 2. A fit to the velocities with the eccentricity fixed to zero measures a reflex velocity semi-amplitude of with residuals of . A bisector analysis of the HIRES velocities does not show any significant variations correlated with the radial velocities.
4 ANALYSIS
The Kepler photometric and HIRES radial-velocity measurements can be simultaneously modeled. The data is fit for the center of transit time, period, impact parameter (), the scaled planetary radius (Rp/R, the amplitude of the radial velocity (K), photometric and velocity zeropoints and /R⋆. The last term, /R⋆ is related to the transit duration () and the mean stellar density (Pál et al., 2009). We also account for non-circular orbits by modeling for e cos(), e sin(), where e is the orbital eccentricity and is argument of periastron.
The modeled stellar density is strongly dependent on the impact parameter, , of the planetary orbit. It was discovered that the adopted limb-darkening parameters were placing unrealistic constraints on . Specifically, the best would occur at for a majority of the models of Kepler light curves. The model fits were repeated for various choices of limb darkening, including values generated specifically for the Kepler bandpass with Atlas 9 models by A. Prsa. Detailed examination of the fits revealed that the limb darkening models were over-predicting the curvature of the base of the transit shape. To alleviate this problem, limb darkening coefficients were computed for the three known exoplanet systems in the Kepler field of view, TrES-2 (Daemgen et al., 2009), HAT-P-7 (Pál et al., 2008; Gilliland et al., 2010), and HAT-P-11 (Bakos et al., 2009), based on fits fixed to the published values of , , and . We then linearly interpolate between these values for candidates with different temperatures. It is estimated this procedure results in a systematic error on the quoted value of reported in Table 2.
The error distribution for the stellar densities that fit the transit light curve are obtained from a Markov-Chain-Monte-Carlo (MCMC) analysis. We adopt the approach outlined in §4.3 of Ford (2005). Convergence was tested by generating 10 Markov-chains each with steps and different initial conditions. We checked that each chain had statistically similar means and distributions. Given the stellar effective temperature from the Keck/HIRES template and the mean stellar density from transit photometry we employ the method. This method uses stellar evolution Yale-Yonsei tracks to calculate the range of stellar parameters consistent with the observations. A full description of the method is described in citetbor10b.
The output of the method is a set of Markov Chains giving a consistent set of allowed and pairs. The distribution of stellar mass and radius allows us to define a transition probability to compute a MCMC analysis to determine the most likely model values. We fit for stellar mass and radius, planetary mass and radius, center time of transit, orbital period and inclination, depth of the occulation and allow for non-circular orbits through the inclusion of e cos() and e sin(). We generated 10 sets of Markov-Chains with elements and use all 10 sets to generate distributions for the model fits.
The errors in Table 2 are centered around the mode of each model parameter which represents the value of highest relative probability. The mode is calculated by binning the bootstrapped parameters into 50 equally-spaced bins. We chose to use the mode to determine the most likely system parameters as some distributions, such as the stellar mass, are bi-modal. We report the bounds that enclose of the samples centred on the mode and report these values in Table 2.
5 DISCUSSION
Similar to Kepler-7 (Latham et al., 2010), the Kepler-5 host star is not much hotter than the Sun, , but is much more massive and larger than the Sun, and . With a mean stellar density of the star is on its way to becoming a shell-burning subgiant. Similar to Kepler-4 (Borucki et al., 2010b) and Kepler-7 there are two distinct sets of model parameters that fit the observations equally well. There are two peaks in the mass distribution centered at and . While our analysis favours the larger mass, the lower mass choice can not be ruled out.
The planet is found to have a mass of and a radius of , where refers to the equatorial radius of Jupiter. This makes the planet more massive and larger than Jupiter. The mean planetary density is , which is not uncommon amongst the known population of transiting Jupiter-sized planets. Figure 3 from Latham et al. (2010) compares the mass and radius of Kepler-5b to other known transiting extrasolar planets.
The photometry points to a weak (2) detection of an occultation. As correlations in the timeseries may lead to a false detection of an occultation we computed a Fourier Transform and autocorrelation of the dataset which did not show any significant issues. There is no excess of power in the Fourier Transform from 1 to 12 hours has a 3 detection limit of 15 ppm.
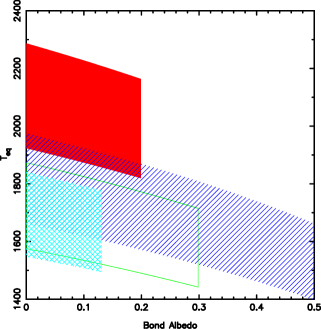
Most of the observed light from the planet in the Kepler bandpass is due to thermal emission, but we can use the depth of the occultation to derive an upper limit on the albedo of the planet. The geometric albedo,
| (2) |
is defined as the ratio of the planet’s luminosity at full phase to the luminosity from a Lambertian disk, where is the planetary radius. This allows us to place boundaries on the dayside temperature of the planet as estimated by the equilibrium temperature given by Equation 1. Figure 3 shows the boundaries for Kepler-4b, 5b, 6b and 7b where we have calculated for 1,2 and from zero to the 1- upper limit. The Bond albedo is estimated from the geometric albedo by assuming a Lambertian scatter as described in Rowe et al. (2006). Due to the relatively short periods of the first four planets discovered by Kepler, it not surprising that all of them have temperatures greater than 1500 K. The upper limits show that Kepler-5b, 6b and 7b are less reflective than Jupiter and likely quiet dark, consistent with predictions and observations of other hot extrasolar planets. Additional photometry of these planets will provide special opportunities to study planets in extreme conditions.

References
- Bakos et al. (2009) Bakos, G. Á., et al. 2009, ApJ, in press (arXiv:0901.0282v1)
- Batalha et al. (2010) Batalha, et al. 2010, ApJ, this issue
- Borucki et al. (2010a) Borucki, W. J., et al. 2010, Science, TBD
- Borucki et al. (2010b) Borucki, W. J., et al. 2010, ApJ, this issue
- Caldwell et al. (2010) Caldwell, D. A., et al. 2010, ApJ, this issue
- Claret (2000) Claret, A. 2000 A&A, 363, 1081
- Daemgen et al. (2009) Daemgen, S., et al. 2009, A&A, 498, 567
- Dunham et al. (2010) Dunham, E. W., et al. 2010, ApJ, this issue
- Ford (2005) Ford, E.B. 2005, ApJ, 129, 1706
- Gautier et al. (2010) Gautier, T. N., et al. 2010, ApJ, this issue
- Gilliland et al. (2010) Gilliland, R., et al. 2010, PASP, submitted
- Haas et al. (2010) Haas, M. et al. 2010, ApJ, this issue
- Jenkins et al. (2010) Jenkins, J. J., et al. 2010, ApJ, this issue
- Koch et al. (2010) Koch, D. G., et al. 2010, ApJ, this issue
- Latham et al. (2010) Latham, D. W., et al. 2010, ApJ, this issue
- Mandel & Agol (2002) Mandel, K., & Agol, E. 2002, ApJ, 580, L171
- Morel (1997) Morel, P. 1997, A&A, 124, 597
- Pál et al. (2008) Pál, A., et al. 2008, ApJ, 680, 1450
- Pál et al. (2009) Pál, A., et al. 2009, arXiv:0908.1705v2
- Press et al. (1992) Press, W. H., Teukolsky, S. A., Vetterling, W. T., & Flannery, B. P. 1992, Numerical Recipes in Fortran 77, Second Edition, Cambridge University Press, 678
- Rowe et al. (2006) Rowe, J. F., et al. 2006, ApJ, 646, 1241
- Walker et al. (2008) Walker, G. A. H., et al. 2008, A&A, 482, 691
- Valenti & Piskunov (1996) Valenti, J. A., & Piskunov, N. 1996 A&AS, 118, 595
- Yi et al. (2001) Yi, S. K., Demarque, P., Kim, Y.-C., Lee, Y.-W., Ree, C. H., Lejeune, T., & Barnes, S. 2001, ApJS, 136, 417
| Parameter | Value | Notes |
|---|---|---|
| Orbital period (d) | A | |
| Midtransit time (HJD) | A | |
| Scaled semimajor axis | A | |
| Scaled planet radius / | A | |
| Impact parameter | A | |
| Orbital inclination (deg) | A | |
| Orbital semi-amplitude () | A,B | |
| Orbital eccentricity | A,B,G | |
| Center-of-mass velocity () | A,B | |
| Observed stellar parameters | ||
| Effective temperature (K) | C | |
| Spectroscopic gravity (cgs) | C | |
| Metallicity [Fe/H] | C | |
| Projected rotation () | C | |
| Mean radial velocity () | B | |
| Derived stellar parameters | ||
| Mass () | C,D | |
| Radius () | C,D | |
| Surface gravity (cgs) | C,D | |
| Luminosity () | C,D | |
| Age (Gyr) | C,D | |
| Planetary parameters | ||
| Mass () | A,B,C,D | |
| Radius (, equatorial) | A,B,C,D | |
| Density () | A,B,C,D | |
| Surface gravity (cgs) | A,B,C,D | |
| Orbital semimajor axis (AU) | E | |
| Equilibrium temperature (K) | F | |
Note. —
A: Based on the photometry.
B: Based on the radial velocities.
C: Based on a MOOG analysis of the FIES spectra.
D: Based on the Yale-Yonsei stellar evolution tracks.
E: Based on Newton’s version of Kepler’s Third Law and total mass.
F: Assumes Bond albedo = 0.1 and complete redistribution.
G: 1 sigma upper limit