Invariant mass distributions for the reaction at Q = 10 MeV
Abstract
Proton-proton and proton- invariant mass distributions and the total cross section for the reaction have been determined near the threshold at an excess energy of Q = 10 MeV. The experiment has been conducted using the COSY-11 detector setup and the cooler synchrotron COSY. The determined invariant mass spectra reveal significant enhancements in the region of low proton-proton relative momenta, similarly as observed previously at higher excess energies of Q = 15.5 MeV and Q = 40 MeV.
pacs:
13.60.LeMeson production and 13.85.LgTotal cross sections and 29.20.D-Cyclic accelerators and storage rings1 Introduction
The complexity of the structure of hadrons constitutes the basic difficulty in the quantitative description of the hadronic interaction in the medium energy regime. Therefore, this interaction is not well understood especially in the meson-nucleon and meson-meson sector, where an additional difficulty is the relatively poor experimental data-base. Particularly challenging are investigations of interactions involving flavour-neutral mesons. This is due to the short life-time of these mesons which can neither be used as targets nor as beams. Thus, in practice such interactions can be accessed only indirectly via observables like excitation functions or invariant mass distributions. Measurements of these observables are especially useful in the close-to-threshold region where the final state particles are produced with low relative velocities. Among the basic flavour neutral mesons the is of particular interest since its interaction with nucleons is strong enough to be detectable with the presently achievable experimental precision hab , and since its interaction seems to be sufficently strong to form an eta-mesic nucleus haider257 ; li515 . The existence of such kind of nuclear matter is vividly discussed boundtheory and there are ongoing experimental programs searching for a signal of such a state bound-exp .
The earlier high statistics measurements of the reaction at an excess energy of Q = 15.5 MeV from the COSY-11 collaboration pawel-prc , and also the measurements of the TOF group tof at Q = 15 and 41 MeV, revealed that there exist significant enhancements in the invariant mass distributions of and subsystems at higher values of proton-proton invariant mass and lower values of the proton- invariant mass. One of the plausible explanations for these enhancements could be an influence of the proton- interaction hab ; fix . If this is the case one could use such observables for the estimation of the strength of this interaction. However, the observed invariant mass distributions could be also plausibly explained by contributions of higher partial waves kanzo-acta23 ; kanzo045201 or by an energy dependence of the primary production amplitude deloff ; ceci1 . Therefore, in order to verify the correctness of the proposed explanations it is of importance to investigate the dependence of the strength of the enhancements as a function of the excess energy. Qualitatively, with decreasing excess energy the contribution from the higher partial waves should decrease whereas the influence of the interaction should be more pronounced.
Certainly, most effectively, contributions from higher partial waves could be disentangled by the determination of the analysing powers and spin transition coefficients kanzo045201 ; meyer064002 ; hanhartreview , yet such investigations are not planned in the near future at COSY which is at present the only laboratory where it can be conducted. This makes the determination of the energy dependence of the distributions of the differential cross section for the reaction even more important for studies of the proton- hadronic interaction and for studies of the properties of nucleon resonances kanzo-acta23 ; kanzo0803 .
In this article we present distributions of the proton-proton and proton- invariant masses at the excess energy of Q = 10 MeV which is significantly closer to the threshold with respect to the previous studies. Although the original experiment at Q = 10 MeV has been devoted to the investigations of the analysing power for the reaction czyzyk and has been performed with a polarised proton beam, the data enable also the determination of the spin averaged observables after appropriate offline ”depolarisation” of the beam explained in section 2.1. In Section 2 we briefly describe the experimental set-up, present the experimental principles of the measurement, and describe the method of the data analysis. In section 3 the determined spectra are compared to the analogoues results determined at the excess energy of Q = 15.5 MeV, and the final conclusions are drawn.
2 Experiment
The measurement of the reaction has been performed at the cooler synchrotron COSY cosy at the Research Center Jülich in Germany using the COSY-11 detector setup cosy11 , presented schematically in Figure 1.
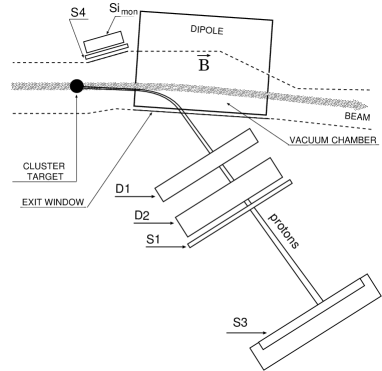
The proton beam with a momentum of 2.010 GeV/c, corresponding to an excess energy of Q = 10 MeV, has been scattered on H2 molecules from an internal cluster jet target dombrowski ; khoukaz , installed in front of the COSY magnet. Reaction products carry lower momenta than the beam protons, therefore are bent more in the magnetic field of the dipole magnet. Positively charged ejectiles leave the scattering chamber through a thin exit window reaching the detection system operating under atmospheric pressure. The hardware trigger was based on signals from scintillator detectors only. It was adjusted to register all events with at least two positively charged particles. For this aim coincident signals in the S1 and S3 detectors were required. In the case of the S1 detector only these events were accepted for which either two separate segments were hitted or an amplitude of the signal in a single module was higher than the certain threshold value. Based on the data analysis from the previous experiments, the threshold was set high enough to reduce significantly the number of single particle events, and at the same time to accept most events (almost 100%) with two protons passing through one segment. Next, in the off-line analysis it was required that at least two tracks are reconstructed from signals measured by means of two planar drift chambers D1 and D2. The trajectories of the positively charged particles reconstructed in drift chambers are further traced through the magnetic field of the dipole back to the interaction point. In this way the momenta of the particles can be reconstructed with a precision of 6 MeV/c (standard deviation) pawel-prc . The time-of-flight measurement between the scintillator hodoscope S1 and the scintillator wall S3, and the independently reconstructed momentum enable a particle identification by means of the invariant mass technique. The COSY-11 mass resolution allows for a clear seperation of groups of events with two protons, two pions, proton and pion and also deutron and pion hab . Further on the produced meson is identified using the missing mass method. A more detailed description of the method and results of the identification of the reaction can be found in reference hab ; pawel-prc ; czyzyk-phd .
2.1 Off-line depolarisation of the beam
Originally the experiment was dedicated to the measurement of the beam analysing power for the reaction czyzyk ; czyzyk-phd . Therefore, the proton beam has been vertically polarised. The vertical polarisation of the beam is defined as an asymmetry of populations of particles in the spin up () and down () states with respect to the vertical axis, integrated over the whole period of measurement:
| (1) |
In the discussed experiment the direction of the polarisation was being flipped from cycle to cycle. Hence, for the so called ”spin up cycles” we define the spin up polarisation as:
| (2) |
and analogously for ”spin down cycles” the spin down polarisation reads:
| (3) |
where, and denote the number of protons in the cycle, in spin up and down state, respectively. Please note, that according to above definitions the following relations are valid:
| (4) |
The beam can be effectively depolarized e.g. by assigning to the events in spin up cycles the weights which can be derived from the requirement that the numerator of Equation 1 has to vanish:
| (5) |
Thus, combining Equations 2 and 3 with Equation 5 we obtain the following formula for the value of :
| (6) |
where denotes the relative luminosity for the spin up and down cycles. Taking into account the numerical values of , , and czyzyk ; czyzyk-phd one gets .
The weight , assigned to events in spin up cycles, does not change the absolute value of cross sections, as the same weight has been applied in both: the calculation of the number of events originating from the reaction and the determination of the luminosity from the elastic scattering.
2.2 Data analysis
The method applied to the determination of the differential cross sections follows the procedures described in pawel-prc , therefore for any details the reader is reffered to that paper. Here we shall only briefly describe the main steps of the data analysis and emphasize the differences between the methods used in both studies.
After particle identification we continued the analysis with the depolarization of the experimental data, according to the procedure described in Section 2.1. Next, we determined the covariance matrix and performed the kinematical fitting hab ; pawel-prc .
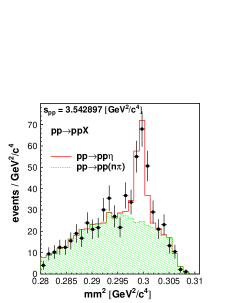
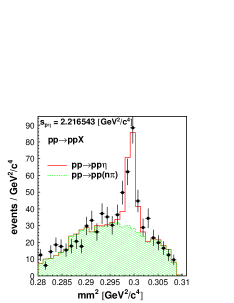
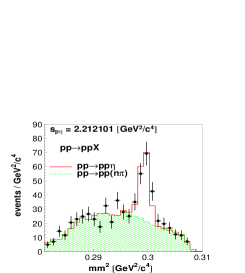
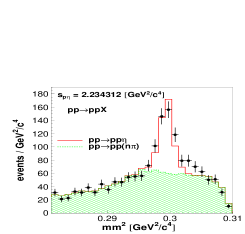
For the description of the relative motion of the protons and the meson, following reference pawel-prc , we have chosen the squares of the invariant masses – and – of the proton-proton and proton- systems, respectively. Optimizing the statistics we have divided the range of and into 20 bins. For each bin of these variables we have determined the spectrum of the square of the missing mass. Analogoues spectra were simulated for the reaction and for the background channels. The simulation program, based on the GEANT3 geant code, accounts for the geometry of the COSY-11 detector setup including the conditions of the beam and target NIM and the resolution and efficiency of the detectors hab . The simulated events were analysed with the same program as the experimental data. Subsequently, functions of the type:
| (7) |
were fitted to the data, with , , , and treated as free parameters responsible for the normalisation of the simulated missing mass spectra () of reactions indicated in subscripts. In order to determine the background free invariant mass distributions the experimental missing mass squared spectra were fitted separately for each bin of and . As an example, the missing mass distributions for arbitrarily chosen bins of and are presented in Figure 2.

The mumbers of mesons for the individual intervals of and have been calculated as:
| (8) |
and the statistical errors have been estimated as:
| (9) |
where are the estimates of the parameter uncertainties (standard deviations) determined by means of the MINUIT minimization package minuit .
The systematic error of has been estimated to be not larger than 8%, based on the dependence of the results on different assumptions for i) background estimation (2%), ii) description of the proton-proton final state interaction (5%), and iii) inaccuracy in efficiency for reconstruction of both proton trajectories (6%). The uncertainty in the number of the background events under the peak of the meson was estimated as differences between results obtained by fitting to the background a) the first order polynomials, b) the second order polynomials, c) the sum of two Gaussian functions, and d) the distributions simulated for the multi-pion production klajaphd ; czyzyk-phd . The inaccuracy due to the model used for the description of the proton-proton FSI was estimated conservatively as a difference in results determined when using parameterization of the proton-proton S-wave interaction swave and when neglecting the FSI and taking into account a homogeneous phase-space distribution of the momenta of final state particles.
The determination of the luminosity was based on the comparison of the measured differential elastic scattering cross sections to the data of the EDDA group edda . For the detailed method of the luminosity and acceptance calculation the interested reader is referred to hab ; NIM . The integrated luminosity was extracted to be nb-1.
3 Results and conclusions
The total cross section evaluated as an integral of the distribution equals to b, where the first error is the statistical and the second the systematic one. The latter accounts for the quadratic sum of independent contributions from 8% systematic error of , 3% systematic error of the luminosity determination pawel-prc , and 6 % uncertainty in the acceptance estimation pawel-prc . The determined total cross section is in line with the previous measurements performed independently by various experimental groups pawel-prc ; etadata .
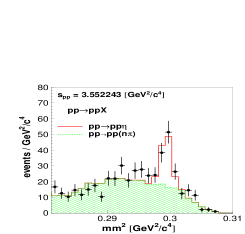
The results on the differential cross sections for the reaction as a function of the square of the proton-proton and proton- invariant masses are given in Table 1, and presented in the left part of Figure 3. They are compared with the differential cross sections measured at the excess energy of Q = 15.5 MeV pawel-prc , displayed in the right part of Figure 3.


The homogeneous phase-space distributions, shown in Figure 3 by solid lines, completely disagree with the experimental data for all distributions presented. The peak observed at small values of is associated with strong proton-proton final state interaction (FSI). On the other hand the dotted lines, which represent the phase-space distribution convoluted with the proton-proton FSI describe the data quite well in the range of small invariant masses of the proton-proton system and in the range of large , but for both excess energies there is a significant deviation of the theoretical predictions from the experimental data in the range of large values of and small values of . In the calculations we have used the parameterization of the proton-proton FSI given in reference baru . The curves including the proton-proton FSI have been arbitrarily normalized in the range of small values of and close to the upper limit of the distribution.
| [] | [] | [] | [] |
|---|---|---|---|
| 3.522337 | 33.6 2.9 | 2.207658 | 11.0 2.3 |
| 3.524206 | 64.3 4.4 | 2.209139 | 14.6 3.2 |
| 3.526075 | 58.8 4.9 | 2.210620 | 24.0 4.1 |
| 3.527944 | 46.1 4.8 | 2.212101 | 32.4 4.8 |
| 3.529813 | 38.6 4.7 | 2.213582 | 32.0 5.1 |
| 3.531682 | 37.2 4.9 | 2.215062 | 25.4 5.1 |
| 3.533552 | 40.3 4.9 | 2.216543 | 51.5 6.8 |
| 3.535421 | 39.9 5.0 | 2.218024 | 32.1 6.0 |
| 3.537290 | 35.8 4.9 | 2.219505 | 50.7 6.8 |
| 3.539159 | 40.2 5.3 | 2.220985 | 47.2 6.7 |
| 3.541028 | 31.3 5.1 | 2.222466 | 57.1 7.2 |
| 3.542897 | 37.9 5.6 | 2.223947 | 55.9 7.2 |
| 3.544767 | 26.2 5.3 | 2.225428 | 60.1 7.0 |
| 3.546636 | 26.0 5.4 | 2.226908 | 67.4 7.4 |
| 3.548505 | 30.8 5.4 | 2.228389 | 67.4 6.9 |
| 3.550374 | 23.2 5.4 | 2.229870 | 58.5 6.3 |
| 3.552243 | 26.6 4.8 | 2.231351 | 56.6 5.4 |
| 3.554112 | 25.1 4.7 | 2.232831 | 52.9 4.6 |
| 3.555982 | 9.8 4.0 | 2.234312 | 41.8 3.7 |
| 3.557851 | 7.7 1.9 | 2.235793 | 19.0 2.0 |
A preliminary result from a comparative analysis of the and system indicates that the observed enhancement is rather not due to the meson-proton interaction klajaacta ; klajaphd . Preliminary results show that the enhancements in the invariant mass distributions are also present in case of the reaction klajaacta ; klajaphd . Due to the fact that the interaction between the meson and proton is more than an order of magnitude weaker than the one between the meson and proton swave , the explanation that the bump is caused by the proton- final state interactions is rather doubtious.
One plausible explanation for the bumps observed at higher values of and lower values of is the presence of higher partial waves in the final state proton-proton system kanzo045201 . Already the inclusion of the objasnienie transition to the production amplitude of the reaction leads to a quite well description of the experimental data in the high values of and low values of , leaving unaltered the description of the experimental data at low values of and high values of , dominated mainly by the transition. However, to cope the P-wave contribution with the flat angular distributions pawel-prc ; tof , it is necessary that the amplitude vanishes or that it interferes destructively with transition deloff . Moreover, the model calculations based on a significant P-wave contribution underestimates the excitation function for the reaction below 20 MeV by a factor of about two hab ; pawel-prc . Although this deficit can be overcome when assuming a relatively strong contribution to the production amplitude from the nucleon resonances, such hypothesis cannot be confirmed at the present stage of the inaccuracies of the resonance parameters kanzo-acta23 . The amount of the P-wave contribution should decrease towards threshold but the enhancement observed at Q = 10 MeV is rather of the same order as the one at Q = 15.5 MeV, however in view of the present experimental statistical and systematic inaccuracies the hypothesis of the higher partial wave contribution cannot be excluded.
Another explanation for the bumps observed at higher values of were put forward by Deloff deloff who explains the observed spectra by allowing a linear energy dependence of the leading partial wave amplitude. Recently also Ceci, Švarc and Zauner ceci1 ; ceci2 have shown that the excitation function and the enhancement in the invariant mass spectra can be very well described by the energy dependence of the production amplitude when the negative interference between the and the meson exchange amplitudes is assumed. However, for the quantitative confirmation of these hypotheses still more precise data on the energy dependence of the enhancement in the invariant mass spectra are required.
4 Acknowledgements
The work was partially supported by the European Community-Research Infrastructure Activity under the FP6 programme (Hadron Physics, RII3-CT-2004-506078), by the Polish Ministry of Science and Higher Education under grants No. 3240/H03/2006/31 and 1202/DFG/2007/03, by the German Research Foundation (DFG), and by the FFE grants from the Research Center Jülich.
References
- (1) P. Moskal, arXiv: hep-ph/0408162, Jagiellonian University Press (2004).
- (2) Q. Haider, L. C. Liu, Phys. Lett. B 172 (1986) 257.
- (3) G. L. Li et al., Phys. Lett. B 195 (1987) 515.
- (4) Q. Haider, L. C. Liu, Acta Phys. Polon. Supp. 2 (2009) 121; A. Sibirtsev et al., Phys. Rev. C 70 (2004) 047001; T. Inoue, E. Oset, Nucl. Phys. A 710 (2002) 354; Q. Haider, L. C. Liu, Phys. Rev. C 66 (2002) 045208; C. Wilkin, Phys. Rev. C 47 (1993) R938; S. Wycech et al., Phys. Rev. C 52 (1995) 544; C. Hanhart, Phys. Rev. Lett. 94 (2005) 049101; S. D. Bass, A. W. Thomas, Phys. Lett. B 634 (2006) 368; V. A. Tryasuchev, A. V. Isaev,e-Print: arXiv:0901.3242.
- (5) W. Krzemien et al., Acta Phys. Polon. Supp. 2 (2009) 141; W. Krzemien et al., Int. J. Mod. Phys A 24 (2009) 576; B. Krusche, I. Jaegle, Acta Phys. Polon. Supp. 2 (2009) 51; M. Pfeiffer et al., Phys. Rev. Lett. 92 (2004) 252001; J. Smyrski et al., Acta Phys. Polon. Supp. 2 (2009) 133.
- (6) P. Moskal et al., Phys. Rev. C 69 (2004) 025203.
- (7) M. Abdel-Bary et al., Eur. Phys. J. A 16 (2003) 127.
- (8) A. Fix and H. Arenhövel, Phys. Rev. C 69 (2004) 014001.
- (9) K. Nakayama et al., Acta Phys. Polon. Supp. 2 (2009) 23.
- (10) K. Nakayama et al., Phys. Rev. C 68 (2003) 045201.
- (11) A. Deloff, Phys. Rev. C 69 (2004) 035206.
- (12) S. Ceci, A. Švarc, B. Zauner, Acta Phys. Polon. Supp. 2 (2009) 157.
- (13) H. O. Meyer et al., Phys. Rev. C 63 (2001) 064002.
- (14) C. Hanhart, Phys. Rept. 397 (2004) 155.
- (15) K. Nakayama et al.,
- (16) R. Czyżykiewicz et al., Phys. Rev. Lett. 98 (2007) 122003.
- (17) D. Prasuhn et al., Nucl. Instr. & Meth. A 441 (2000) 167.
- (18) S. Brauksiepe et al., Nucl. Instr. and Meth. A 376 (1996) 397; P. Klaja et al., AIP Conf. Proc. 796 (2005) 160; J. Smyrski et al., Nucl. Instr. and Meth. A 541 (2005) 574.
- (19) H. Dombrowski et al., Nucl. Instr. & Meth. A 386 (1997) 228.
- (20) A. Khoukaz et al., Eur. Phys. J. D 5 (1999) 275.
- (21) R. Czyżykiewicz, PhD thesis, Jagellonian University (2007); e-Print: nucl-ex/0702010.
- (22) CERN Program Libraries Long Writeups W5013 (1994).
- (23) P. Moskal et al., Nucl. Instr. & Meth. A 466 (2001) 448.
- (24) MINUIT - Minimization Package, CERN Program Library Long Writeups D506 (1994).
- (25) P. Moskal et al., Phys. Lett. B 482 (2000) 356.
- (26) D. Albers et al., Phys. Rev. Lett. 78 (1997) 1652.
- (27) J. Smyrski et al., Phys. Lett. B 474 (2000) 182; A. M. Bergdolt et al., Phys. Rev. D 48 (1993) 2969; E. Chiavassa et al., Phys. Lett. B 322 (1994) 270; H. Calén et al., Phys. Lett. B 366 (1996) 39; H. Calén et al., Phys. Rev. Lett. 79 (1997) 2642; F. Hibou et al., Phys. Lett. B 438 (1998) 41.
- (28) B. L. Druzhinin et al., Z. Phys. A 359 (1997) 205.
- (29) Following the conventional notation meyer064002 the partial wave states are denoted as , where S, L, and J denote the total spin, relative orbital momentum, and the total angular momentum of the system, respectively. denotes the orbital angular momentum of the produced meson.
- (30) P. Klaja et al., Acta Phys. Polon. Supp. 2 (2009) 45.
- (31) P. Klaja, PhD thesis, Jagiellonian University (2009); e-Print: arXive:0907.1491
- (32) S. Ceci, A. Švarc, B. Zauner, Phys. Scripta 73 (2006) 663.