The effect of gas fraction on the morphology and time-scales of disc galaxy mergers
Abstract
Gas-rich galaxy mergers are more easily identified by their disturbed morphologies than mergers with less gas. Because the typical gas fraction of galaxy mergers is expected to increase with redshift, the under-counting of low gas-fraction mergers may bias morphological estimates of the evolution of galaxy merger rate. To understand the magnitude of this bias, we explore the effect of gas fraction on the morphologies of a series of simulated disc galaxy mergers. With the resulting -band images, we determine how the time-scale for identifying major and minor galaxy mergers via close projected pairs and quantitative morphology (the Gini coefficient , the second-order moment of the brightest 20% of the light , and asymmetry ) depends on baryonic gas fraction . Strong asymmetries last significantly longer in high gas-fraction mergers of all mass ratios, with time-scales ranging from Myr for 20% to 1 Gyr for 50%. Therefore the strong evolution with redshift observed in the fraction of asymmetric galaxies may reflect evolution in the gas properties of galaxies rather than the global galaxy merger rate. On the other hand, the time-scale for identifying a galaxy merger via is weakly dependent on gas-fraction ( 200-400 Myr), consistent with the weak evolution observed for mergers.
keywords:
galaxies:interactions – galaxies:structure – galaxies:evolution1 INTRODUCTION
Gas plays an important role in shaping the properties of galaxy mergers and their remnants. Unlike stars and dark matter, gas can cool radiatively and therefore lose kinetic energy efficiently. Cold gas is converted into stars, which in turn produce dust and supernovae. The varying gravitational fields of galaxy mergers can draw gas out into long tidal tails that eventually form tidal dwarf galaxies (e.g. Barnes & Hernquist 1996; Bournaud & Duc 2006; Wetzstein et al. 2007) or funnel gas into the galaxies’ centers to spark strong central starbursts (e.g. Mihos & Hernquist 1996; Martig & Bournaud 2008; di Matteo et al. 2008) and feed active galactic nuclei (e.g. Di Matteo, Springel, & Hernquist 2005; Hopkins et al. 2005, 2008; Johansson et al. 2009; de Buhr et al. 2009). Low density gas shocked by mergers can linger as hot X-ray emitting gaseous haloes (e.g. Cox et al. 2004, 2006a; Sinha & Holley-Bockelmann 2009). The spheroidal remnants of gas-rich mergers can reform small discs out of the remaining gas (Barnes 2002; Cox et al. 2006b; Naab, Jesseit, & Burkert 2006; Khalatyan et al. 2008), while the remnants of extremely gas-rich mergers can preserve discs large enough to resemble present-day spiral galaxies (e.g. Springel & Hernquist 2005; Robertson et al. 2006b; Hopkins et al. 2009). The kinematic and structural properties of gas-poor mergers, on the other hand, are less rotationally supported and less centrally concentrated, similar to present-day massive elliptical galaxies (e.g. Boylan-Kolchin, Ma, & Quataert 2005, 2006; Cox et al. 2006c; Robertson et al. 2006a; Naab, Khochfar, & Burkert 2006)
In order to understand the formation of today’s galaxies, astronomers need to measure the frequency of gas-rich and gas-poor mergers as well as the global galaxy merger rate. At present, there are few direct measurements of cold gas in distant galaxies. Rest-frame optical colours are often used as a proxy for gas content with the assumption that blue star-forming galaxies are gas-rich and red quiescent galaxies are gas-poor. Massive red galaxies were 24 times less common at than today (e.g. Bell et al. 2004; Faber et al. 2007; Brown et al. 2007), suggesting that gas-poor galaxies were rare at early times. Several recent studies of the evolution of close pairs of galaxies have detected strong evolution in the colours of pre-merger systems. In a study of kinematic pairs of galaxies in the Extended Groth Strip, Lin et al. (2008) found that kinematic pairs are three times more likely to both be blue and four times less likely to both be red at than in the local universe. Similar studies in the GOODS and COSMOS fields have also found strong evolution in red pairs out to (Bundy et al. 2009; de Ravel et al. 2008).
| Model | 111Number of particles in total, dark matter, gas, stellar disc, and stellar bulge for GADGET simulations | 222Virial mass | 333Dark matter halo concentration | 444Baryonic mass | 555Mass of stellar disc | 666Mass of stellar bulge | 777Mass of gaseous disc | 888Fraction of baryons in the bulge | 999Fraction of baryons in gas | 101010Scale-length of stellar disc | 111111Scale-length of bulge | 121212Scale-length of gaseous disc |
| () | () | () | () | () | (kpc) | (kpc) | (kpc) | |||||
| G3 | 6 | 0.14 | 0.19 | 2.85 | 0.62 | 8.55 | ||||||
| G2 | 9 | 0.08 | 0.24 | 1.91 | 0.43 | 5.73 | ||||||
| G1 | 12 | 0.04 | 0.29 | 1.48 | 0.33 | 4.44 | ||||||
| G3gf1 | 6 | 0.14 | 0.39 | 2.85 | 0.62 | 8.55 | ||||||
| G3gf2 | 6 | 0.14 | 0.53 | 2.85 | 0.62 | 8.55 | ||||||
| G3gf2a | 6 | 0.14 | 0.53 | 2.85 | 0.62 | 8.55 | ||||||
| Sbc | 11 | 0.10 | 0.52 | 5.50 | 0.45 | 16.50 |
Morphological disturbances are an independent and efficient way to identify on-going galaxy mergers. The majority of merger candidates with strong visual disturbances, asymmetries or double nuclei appear blue (e.g. Bell et al. 2005; Lotz et al. 2008a; Jogee et al. 2009). But gas-rich mergers exhibit strong disturbances for longer periods of time than gas-poor mergers (Bell et al. 2006), and therefore are more likely to be found. Very low surface brightness tails and shells may persist in gas-poor mergers for 1 Gyr (Van Dokkum 2005), but these features are not easily detected at high redshifts. Given that the strong morphological signatures of purely dissipationless mergers last for less time than the signatures of a moderately gas-rich merger, morphological estimates of the galaxy merger fraction may under-count gas-poor galaxy mergers.
The effect of gas fraction on the morphologies of disc-disc galaxy mergers has not yet been fully explored. Most theoretical work has focused on the impact of gas on the structure and kinematics of merger remnants (e.g. Boylan-Kolchin et al. 2005; Cox et al. 2006b; Robertson et al. 2006a,b; Hopkins et al. 2009). Only a few studies have examined the properties of on-going mergers with different gas properties (Bournaud et al. 2005; Lotz et al. 2008b). It remains unknown if large scale asymmetries and other disturbances scale with gas fraction, or are equally evident in all mergers above a critical gas threshold. In order to understand the biases associated with detecting mergers of varying gas fractions, this work explores the effect of gas fraction on the time-scales for identifying simulated major and minor mergers via different quantitative methods (, asymmetry, close pairs).
This paper continues the work first presented in Lotz et al. 2008b (hereafter Paper 1), and Lotz et al. 2009a (Paper 2). Because it is impossible to derive the initial merger parameters (mass ratio, gas fraction, orbits, etc.) from observations of on-going highly disturbed mergers, our approach is to simulate mergers with a wide range in parameter space and determine which parameters are important for the strength and duration of morphological disturbances. In Paper 1, we studied a series of equal-mass disc merger simulations. We found that the time-scales for identifying a particular galaxy merger could be quite different depending on the gas properties of the merging galaxies as well as the method used to find the merger. However, because the high gas-fraction and moderate gas-fraction galaxy models (Sbc and G3) presented in Paper 1 also had different dark matter concentrations and gas disc scale-lengths, it was not possible to determine if the baryonic gas fraction was the governing factor. Paper 2 explored the effect of mass ratio and orbital parameters for a series of unequal-mass disc mergers with gas fractions fixed at local values. We found that different morphological indicators probed different ranges of mass ratio at fixed gas fraction, but were almost independent of the merger orbits and orientations.
In this paper, we study major and minor merger simulations with primary disc galaxy models of increasing baryonic gas fractions (19%, 39%, and 53%) and decreasing stellar mass fractions, but identical in total mass, dark matter concentration, and scale-length. The lowest gas-fraction simulations were originally presented in Papers 1 and 2. In §2, we describe the simulations, the properties of the initial galaxies, and the merger parameters. In §3, we briefly describe the analysis of the resulting simulated images and the criteria for identification as a merger by morphology and projected separation. In §4, we discuss the resulting observability time-scales and their dependence on the baryonic gas fraction and merger mass ratios, and we summarize the results and discuss the broader implications in §5. Those familiar with our approach in Papers 1 and 2 may skip to §45 for the results and discussion. The simulated band images and morphology tables will be available in 2010 at the Multimission Archive at STScI (MAST) as a High-Level Science Products (HLSP) contribution “Dusty Interacting Galaxy GADGET-SUNRISE Simulations” (DIGGSS): http://archive.stsci.edu/prepds/diggss .
| Primary | Satellite | Total | Stellar | Baryonic |
| G3 | G3 | 1:1 | 1:1 | 1:1 |
| G3gf1 | G3gf1 | 1:1 | 1:1 | 1:1 |
| G3gf2 | G3gf2 | 1:1 | 1:1 | 1:1 |
| Sbc | Sbc | 1:1 | 1:1 | 1:1 |
| G3 | G2 | 2.3:1 | 3.2:1 | 3.1:1 |
| G3gf1 | G2 | 2.3:1 | 2.4:1 | 3.1:1 |
| G3gf2 | G2 | 2.3:1 | 1.9:1 | 3.1:1 |
| G3 | G1 | 5.8:1 | 10.0:1 | 8.9:1 |
| G3gf1 | G1 | 5.8:1 | 7.6:1 | 8.9:1 |
| G3gf2 | G1 | 5.8:1 | 5.8:1 | 8.9:1 |
2 Simulations
Here we briefly describe the galaxy merger simulations and initial conditions.
2.1 GADGET N-Body/SPH simulations
The details of these simulations, their global star-formation histories, and their remnant properties are discussed in Cox et. al (2004, 2006, 2008). All of the simulations presented in this work were performed using the N-Body/SPH code GADGET (Springel, Yoshida, & White 2001). While we use the first version of GADGET (Springel et al. 2001), the smoothed particle hydrodynamics are upgraded to use the ‘conservative entropy’ version that is described in Springel & Hernquist (2002). Each galaxy is initially modeled as a disc of stars and gas, a stellar bulge, and a dark matter halo, with the number of particles and masses for each component given in Table 1. The stellar and dark matter particles are collisionless and are subject to only gravitational forces. The gas particles are also subject to hydro-dynamical forces. The baryonic and dark matter particles have gravitational softening lengths of 100 pc and 400 pc respectively. The SPH smoothing length for the gas particles indicates the size of the region over which the particle’s hydrodynamic quantities are averaged and is required to be greater than half the gravitational softening length or 50 pc. The radiative cooling rate (, ) is computed for a primordial plasma as described in Katz et al. (1996).
Gas particles are transformed into collisionless star particles assuming the Kennicutt-Schmidt law (Kennicutt 1998) where the star-formation rate depends on the local gas density . These new star particles have typical masses M⊙, and are assigned ages based on their formation time and metallicities based on the metallicity of the gas particle from which they are spawned. We adopt the instantaneous recycling approximation for metal production whereby massive stars are assumed to instantly become supernovae, and the metals produced are put back into the gas phase of the particle. In this version of GADGET, metals do not mix and remain in the gas particle in which they are formed. The enriched gas contribution from stellar winds and Type Ia supernovae are ignored. Unlike the metals, there is no recycling of hydrogen and helium to the gas.
Feedback from supernovae is required to produce stable star-forming discs. We adopt a model in which the supernova feedback energy is dissipated on an 8 Myr time-scale, and have a equation of state . No active galactic nuclei (AGN) are included in these simulations. As we discussed in Paper 1, the exclusion of AGN feedback will not affect the morphological disturbance time-scales calculated here but may affect the appearance of the merger remnants.
2.2 SUNRISE Monte Carlo radiative transfer processing
SUNRISE is a parallel code which performs full Monte Carlo radiative-transfer calculations using an adaptive-mesh refinement grid (Jonsson 2006; Jonsson et al. 2006; Jonsson, Groves, & Cox 2009). We use SUNRISE v2 to create -band images at least 30 timesteps for each merger simulation. For each GADGET simulation timestep, SUNRISE assigns a spectral energy distribution to each star particle using the STARBURST99 population synthesis models (Leitherer et al. 1999).
The metallicities of the gas and stars of the initial galaxy models decline exponentially with the radius of the disc. The density of dust is linearly proportional to the density of metals in the gas. The central metallicities and gradients scale with the mass of the galaxy, but not the gas fraction. The details of the initial galaxy metallicities, gradients, and dust extinctions are given in Rocha et al. (2008).
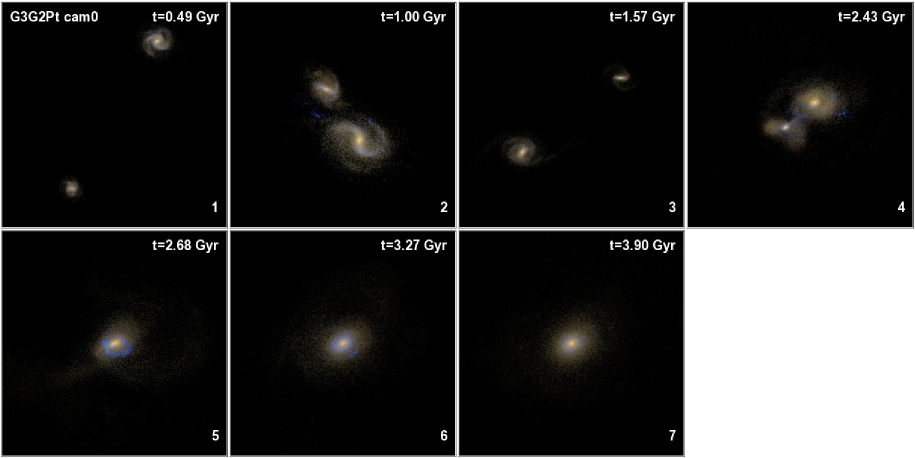
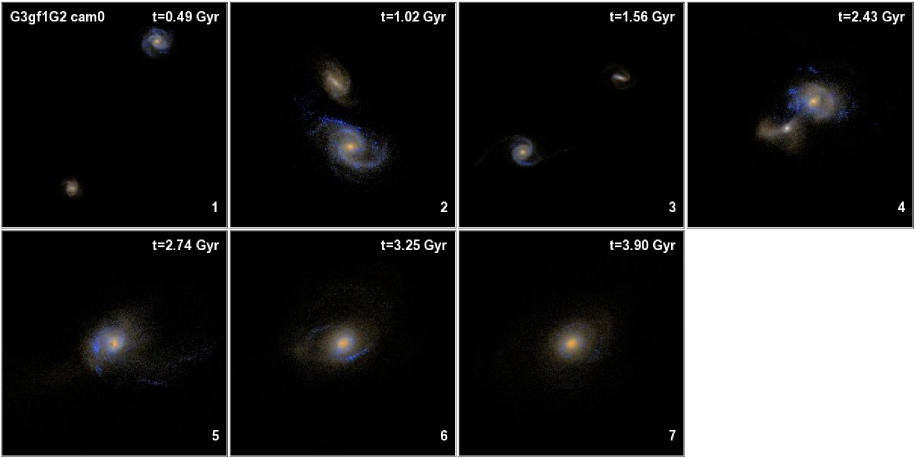
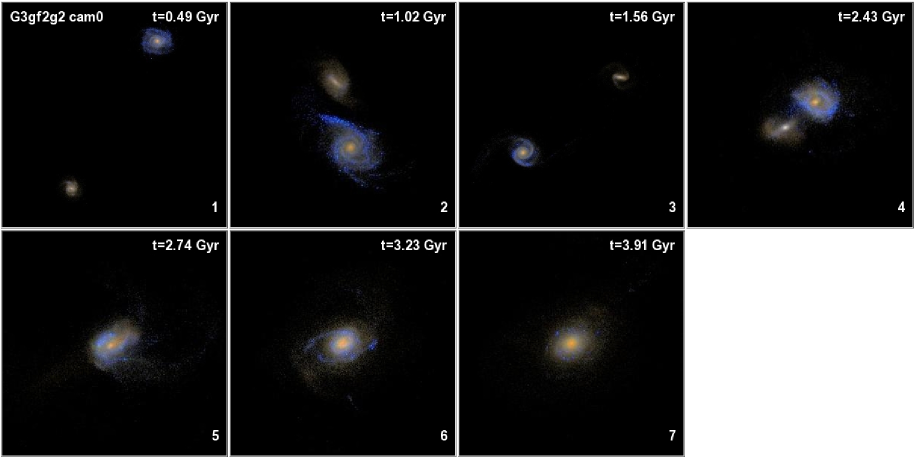
Given a particular simulation geometry and viewing angle, SUNRISE v2 performs the Monte-Carlo radiative transfer calculation for 20 wavelengths from the far-ultraviolet to the mid-infrared and interpolates a resulting spectral energy distribution of 510 wavelengths, including the effects of absorption and scattering. Images are created for eleven isotropically positioned viewpoints (“cameras”). In Figures 1, 2, and 3, we show examples of composite images for the G3-G2 merger simulations with 19%, 39%, and 53% primary galaxy baryonic gas fractions, viewed face-on (camera 0) at multiple timesteps.
2.3 Initial Galaxy Models and Merger Parameters
The galaxy models G3, G2, and G1 have masses, bulge-to-disc ratios, and gas fractions motivated by SDSS estimates of typical local galaxies (Table 1; Cox et al. 2008). Each galaxy model contains a rotationally supported disc of gas and stars, a non-rotating stellar bulge, and a massive dark matter halo (Table 1). A detailed description of the galaxy disc models can be found in Cox et al. (2006b, 2008), Jonsson et al. (2006) and Rocha et al. (2008). The largest galaxy (G3) is chosen to have a stellar mass M⊙, and the smaller galaxies are chosen to have stellar masses M⊙ (G2), and M⊙ (G1), spanning a factor of 10 in stellar mass. The total mass-to-light ratio is assumed to vary with mass such that lower mass galaxy models have higher mass-to-light ratios and the range in total mass is a factor of 6. The galaxy merger simulations with the gas fractions tuned to local galaxy values were originally presented in Paper 1 (equal-mass merger G3G3) and Paper 2 (unequal-mass mergers G3G2 and G3G1) and are included here for comparison.
In this work, we explore the effect of gas fraction on the merger morphologies and disturbance time-scales. Because the satellite G2 and G1 galaxies contribute relatively little to total gas content and star-formation, we have only modified the baryonic gas fraction of the primary G3 galaxy. The total mass, stellar bulge mass, overall baryonic fraction, and metallicity have been kept constant. The central metallicities are , which may be an overestimate for high gas-fraction disc galaxies at (Erb et al 2006a, b), although recent CO observations at suggest higher gas fractions for high mass, high metallicity discs (Daddi et al. 2009, Tacconi et al. 2009) than derived by Erb et al. (2006a). The ratio of disc stars to disc gas has been modified such that the fraction of total baryons in gas was increased from 19% for the G3 model to 39% for the G3gf1 model and 53% for the G3gf2 model. These high gas-fraction discs are merged together in identical equal-mass mergers (G3gf1G3gf1 and G3gf2G3gf2), and with the satellite galaxy models (G3gf1G2, G3gf1G1, G3gf2G2, G3gf2G1).
The gas fractions in the G3gf1 and G3gf2 models have been boosted by increasing the gas particle masses and decreasing the disc star particle masses. However, as the gas particles are turned into stars, this results in new star particles with somewhat larger masses than the old star particles. In order to understand any resulting systematics, we created a modified version of the initial galaxy G3gf2 (G3gf2a) with fewer disc star particles and a larger number of gas particles than the G3 model but with gas particles of the same mass as the G3 model. Any biases should be most apparent in the highest gas-fraction equal-mass merger because these form the largest number of new star particles. We compare the equal-mass merger G3gf2aG3gf2a to the G3gf2G3gf2 merger, and find no significant difference in the morphologies (see §4 for discussion). Therefore we conclude that the slightly higher mass new star particles in the G3gf1- and G3gf2- merger simulations do not bias our morphological results.
The total, baryonic, and stellar mass ratios for all the simulations are given in Table 2. Throughout this paper we will generally refer to the baryonic mass ratios of the mergers, but note that the stellar/total mass ratios are higher/lower than the baryonic mass ratios. The G3G3, G3gf1G3gf1, and G3gf2G3gf2 mergers are identical equal-mass mergers with 1:1 mass ratios. The G3G2, G3gf1G2, and G3gf2G2 mergers have baryonic mass ratios of 3:1, and hence are more representative of major mergers than rare equal-mass mergers. The G3G1, G3gf1G1, and G3gf2G1 mergers have baryonic mass ratios of 9:1 and are considered to be minor mergers.
All of the simulated G mergers in this paper have the same orbital parameters. Each pair of galaxies starts on a sub-parabolic orbit with eccentricity = 0.95 and an initial pericentric radius 13.6 kpc. The galaxies have a roughly prograde-prograde orientation relative to the orbital plane, with the primary galaxy tilted 30 degrees from a pure prograde orientation. In Papers 1 and 2, we found that the merger orbits and orientations did not significantly change the time-scales for strong morphological disturbances.
Finally, we also include the gas-rich prograde-prograde simulation of the Sbc-Sbc merger from Paper 1 (Sbc-Sbc). The initial Sbc galaxy model parameters are motivated by observations of local gas-rich, disc-dominated Sbc galaxies similar to the Milky Way (see Table 1; Cox et al. 2006b). The baryonic gas fraction of the Sbc model (52%) is similar to the G3gf2 model (53%). The Sbc model galaxy has a larger gaseous disc scale-length than the other simulations (16.5 kpc v. 8.6 kpc), therefore the majority of its gas lies at large radii. The Sbc model also has a higher dark matter concentration (11 v. 6 ). The Sbc-Sbc merger starts on a parabolic with eccentricity = 1. and an initial pericentric radius of 11 kpc. The galaxies have a roughly prograde-prograde orientation, with galaxy 2 tilted 30 degrees from the plane of the orbit (see Paper 1).
3 Image Analysis
We replicate the observations and measurements of real galaxy mergers as closely as possible. We focus on rest-frame morphologies for purposes of this paper, as these simulations can be used to calibrate the morphologies of galaxies currently observed from the ground and with the Hubble Space Telescope in optical and near-infrared wavelengths at . In the following section we briefly describe how the simulated images are degraded and analysed to match real galaxy morphology measurements; a more detailed discussion may be found in Paper1.
3.1 Image degradation
The images are produced by SUNRISE for each simulation for 11 isotropically positioned viewpoints as a function of time from Gyr prior to the first pass to 1 Gyr after the final coalescence in Myr timesteps (depending on the merger state), up to a maximum runtime of 6 Gyr. The field of view of the output images ranges from 200 kpc during the initial stages and period of maximal separation to 100 kpc during the first pass, second pass, final merger and post-merger stages. The intrinsic resolution of the output SUNRISE -band images is 333 pc per pixel.
The images output by SUNRISE have no background sky noise and no seeing effects, although they do have particle noise and Monte Carlo Poisson noise. We degrade these images to simulate real data, but do not attempt to mimic a particular set of galaxy survey observations. We re-bin the images to 105 pc per pixel and convolve the images with a Gaussian function with a FWHM = 400 pc. This was done to simulate the effect of seeing but maintain as high spatial resolution as possible. The values were chosen to match the Sloan Digital Sky Survey (Abazajian et al. 2003) with 1.5″ seeing, 0.396″ per pixel plate scale for a galaxy at a distance such that 1.5″ 400 pc. We also add random Poisson noise background to simulate sky noise but scale this noise to maintain a high signal-to-noise for the primary galaxies ( per pixel within the Petrosian radius).
3.2 Morphology Measurements
Each image is run through an automated galaxy detection algorithm integrated into our IDL code. If the centres of the merging galaxies are less than 10 kpc apart, they are generally detected as a single object. If 2 distinct galaxies are detected, the detection segmentation maps are used to mask out the other galaxy while each galaxy’s morphology is measured. The projected separation is measured when two galaxies are detected. For each detected object, we calculate the Petrosian radii in circular and elliptical apertures, concentration , 180 degree rotational asymmetry , the Gini coefficient , and the second-order moment of the brightest 20% of the light . (Please refer to Lotz, Primack, & Madau 2004, Conselice 2003, and Paper 1 for detailed definitions).
In Paper 1, we studied the effect of numerical resolution on the simulation morphologies. We found small but significant differences in the average and values when we compared the standard numerical resolution simulation to simulations with 4 and 10 times as many particles, and corrected for these offsets. Because the numerical resolution of the simulations presented here are similar to the standard resolution simulations in Paper 1 ( particles), we apply the same correction of and to the values in this work.
3.3 Merger Classification and Time-Scales
Lotz et al. (2004) found that local ultra-luminous galaxies visually classified as mergers could be distinguished from the sequence of normal Hubble type galaxies with
| (1) |
or
| (2) |
Asymmetry alone is also often used to classify merger candidates. The calibration of local mergers by Conselice (2003) finds the following merger criterion:
| (3) |
Galaxies at higher redshift cannot be imaged at as high spatial resolution as local galaxies even when observed with . The measured morphologies of galaxies at imaged with will have non-negligible biases as a result of this lower spatial resolution (Lotz et al. 04). See Paper 1 for a discussion of how the morphologies and merger criteria change at resolution, and how the time-scale computed here may be applied to data.
Close kinematic pairs are also probable pre-merger systems. We assume and we estimate the time-scales during which merging galaxies can be found as separate objects within 20, 10 30, 10 50, and 10 100 kpc. The simulated merging galaxies always have relative velocities 500 km s-1.
We calculate each simulation’s average observability time-scale for the , , and criteria given above by averaging the results of the 11 isotropic viewpoints. Because we wish to determine the number density of merger events rather than the number of galaxies undergoing a merger, galaxies that have not yet merged but identified morphologically as merger candidates are weighted accordingly. The time that each pre-merger galaxy is morphologically disturbed is summed (not averaged) to the time that the post-merger system appears disturbed. No such weighting is done for the close pair time-scales as this factor is generally included in the merger rate calculation (e.g. Patton et al. 2000).
4 Results
4.1 Evolution with Merger Stage
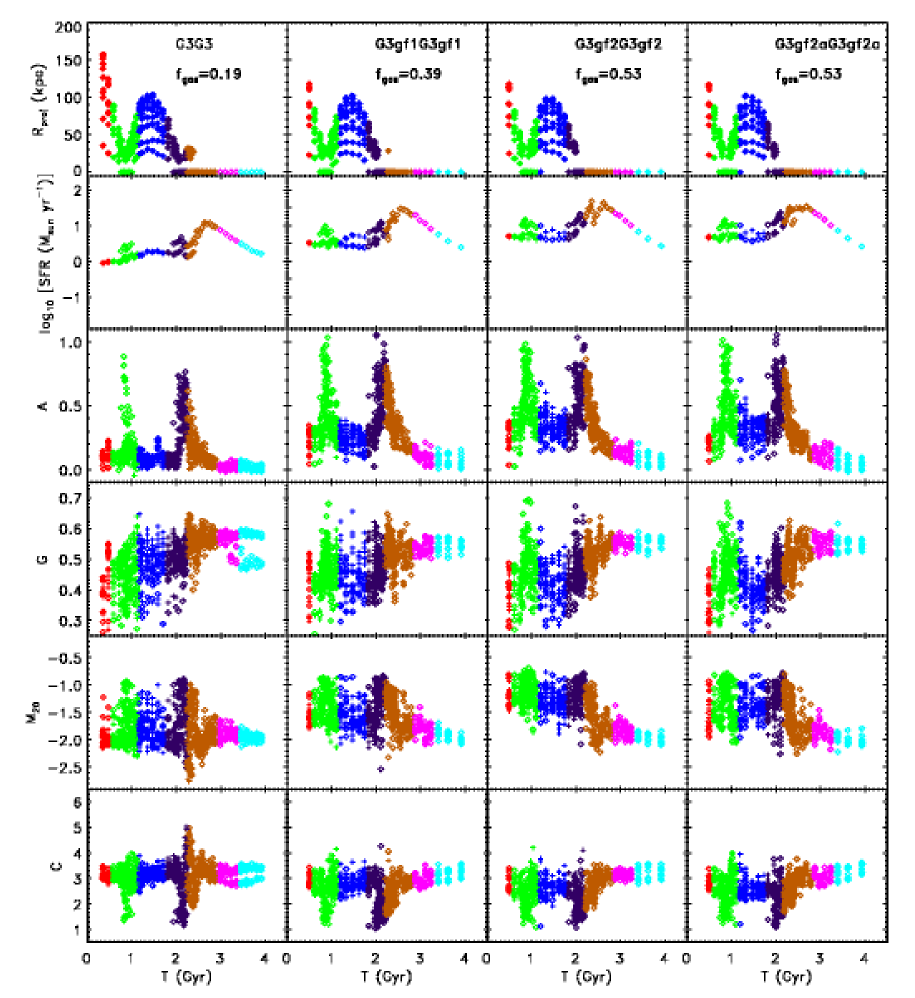
The time evolution of each simulation depends on the mass ratio of the galaxies, therefore we compare the behavior of each simulation as a function of merger stage rather than time. We define seven different merger stages based on the positions of the galaxy nuclei in real space, which are colour-coded in Figures 4 9. These are the initial encounter (red), the first pass (green), maximal separation immediately after the first pass (blue), the second pass or final approach (purple), the final merger (orange), the post-merger observed 0.51 Gyr after the final merger (magenta), and the remnant observed 1 Gyr after the final merger (cyan).
In Figures 4, 5, and 6 we examine the projected separations , quantitative morphologies (, , , and ), and star-formation rate per object as a function of time and merger stage. Each figure shows a fixed merger mass ratio and increasing baryonic gas fraction for the primary galaxy. The scatter in and morphologies at each timestep is the variation in the merger appearance with the 11 viewing angles. The minor mergers (G3G1, G3gf1G1, G3gf2G1) take significantly longer to complete than the major mergers, and experience a third and final pass before the galaxies coalesce.
The simulations show similar patterns of starbursts and morphological disturbances with merger stage. The initial segmentation maps computed to identify each galaxy are used to compute the total star-formation rate for each galaxy at each timestep and camera. The typical star-formation rate of the initial primary discs and mergers increases with of the primary galaxies (Figures 4 6). The major mergers experience a burst of star-formation at the first pass and a few hundred Myr after the strongest morphological disturbances as the nuclei merge (see also Papers 1 and 2). The minor mergers also have enhanced star-formation rates at the close passages, although they do not show strong starbursts relative to the initial star-formation rate at the final merger (Figure 6; see also Cox et al. 2008).
The baryonic gas fraction of the primary galaxy strongly affects the morphology of the merging system. All of the mergers show peaks in and and minima in during the close passages and just before the final merger. The higher gas-fraction simulations (G3gf1, G3gf2) have higher at the close passages and final merger than the lowest gas-fraction simulations. These simulations also have higher between the first pass and final merger stages, often with values greater the merger criterion (). The values for the extremely gas-rich primary galaxies are significantly higher in the early stages of the merger. is similar for the initial discs, but is suppressed to lower values between the first pass and final merger for the extremely gas-rich primary galaxies. is relatively unaffected by gas fraction, although the high simulations are less likely to achieve high values.
The higher gas fraction simulations have higher star formation rates and dust production. The higher star formation rates result in more bright star-forming knots in the outer regions, which contributes to higher and and lower . Higher star formation rates also result in higher gas metallicities, whose primary effect is to increase the amount of dust. We found in Paper 1 that both and individually are more sensitive to dust extinction than and . Dust preferentially extinguishes the central nuclei, which lowers and and raises .
The morphologies of the major merger remnants (cyan points, Figure 4 5) are not strongly affected by the initial gas fractions, and are consistent with bulge-dominated disc galaxies (e.g. Sb). The minor merger remnants are more likely to remain disc-like if they have higher gas fractions (Figure 6). However, as we discuss in Paper 2, the minor merger simulations take considerably longer to coalesce and consume more of their gas during the course of the simulations. We concluded that the spheroid-like , , and values for the lowest gas-fraction minor merger (G3G1) were the result of the long simulation runtime (6 Gyr) rather than the dynamics of the merger remnant. We will study the remnant properties in more detail in a future paper.
As we mentioned in §2, the gas fractions of the G3gf1 and G3gf2 model were increased by increasing the gas particle masses and decreasing the disc star particle mass relative to the G3 model. Therefore new star particles formed in the G3gf1 and G3gf2 simulations have slightly larger masses than the G3 simulations. In Paper 1, we found that low numerical resolution – i.e. high particle masses – could systematically bias the and values. To determine if the high gas fraction model suffered the same problem, we simulated a modified version of the G3gf2a model where the gas fraction was increased by changing the number of gas and disc star particles. We compare the morphologies of an equal-mass G3gf2aG3gf2a merger to the G3gf2G3gf2 merger in Figures 4 and 7. These simulations have the highest star-formation rates, and therefore produce the largest number of new star particles. We find no difference between the two simulations, and conclude that the slightly larger new particle masses of the high gas fraction simulations do not effect our results.
| Simulation | T() | T() | T() |
|---|---|---|---|
| (Gyr) | (Gyr) | (Gyr) | |
| Equal-mass mergers | |||
| SbcSbc | 0.39 0.16 | 0.78 0.21 | 0.74 0.17 |
| G3G3 | 0.16 0.07 | 0.31 0.08 | 0.23 0.11 |
| G3gf1G3gf1 | 0.24 0.14 | 0.81 0.14 | 0.76 0.16 |
| G3gf2G3gf2 | 0.24 0.16 | 1.25 0.20 | 1.54 0.28 |
| G3gf2aG3gf2a | 0.16 0.06 | 1.00 0.24 | 1.32 0.32 |
| 3:1 baryonic mass ratio mergers | |||
| G3G2 | 0.25 0.08 | 0.30 0.13 | 0.24 0.11 |
| G3gf1G2 | 0.26 0.09 | 0.50 0.08 | 0.47 0.08 |
| G3gf2G2 | 0.14 0.09 | 0.80 0.11 | 1.04 0.20 |
| 9:1 baryonic mass ratio mergers | |||
| G3G1 | 0.36 0.15 | 0.27 0.13 | 0.03 0.03 |
| G3gf1G1 | 0.21 0.08 | 0.60 0.26 | 0.66 0.19 |
| G3gf2G1 | 0.14 0.09 | 1.15 0.44 | 1.30 0.34 |
4.2 Merger Diagnostics
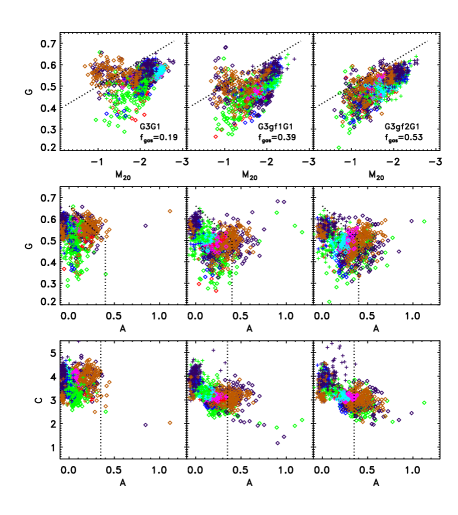
In Figures 7 9, we plot the simulation morphologies on the merger diagnostic plots , , and . The lowest major mergers (G3G3, G3G2) are identified just before the final merger (purple points) with and at the final merger (orange points) in (Figures 7 8). The higher major mergers are also identified at the first pass (green points) by all three methods, and are somewhat less likely to be identified at the final merger via . The lowest minor merger G3G1 is identified by and at the second pass and the final merger (purple and orange points), but does not meet the merger criteria (Figure 9). As is increased, minor mergers are more likely to be detected by and around the final merger but slightly less likely to be found via .
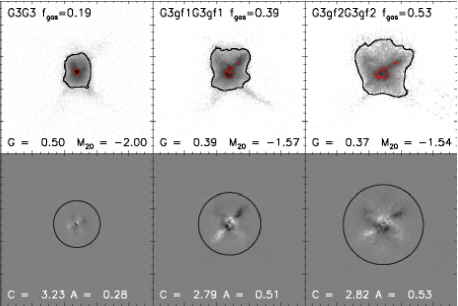
To illustrate the different behaviors of and , we show the equal-mass mergers just after the final merger at t=2.5 Gyr in Figure 10. After the final merger, the object has a single central nucleus and spatially extended regions of star-formation which appear brighter and larger as increases. None of the simulated images are classified as mergers by because they have a single nucleus, but the images of the G3gf1G3gf1 and G3gf2G3gf2 simulations are classified as mergers by and because of the increased number and brightnesses of the star-forming regions. As increases, the Petrosian radius and the regions used to measure , , , and become larger. (These measures are designed to be independent of size, therefore are not affected by physical size alone – see Lotz et al. 2004). The lower panels show the difference image between the original image and the image rotated by 180 degrees. Asymmetry is measured using the pixels within the circular apertures with radii equal to 1.5 the Petrosian radius (circles, lower panels). As increases, the residuals and asymmetries increase to exceed the merger criterion.
.)
| Morphology | 131313T = + Slope | Slopea |
|---|---|---|
| (Gyr) | (Gyr per unit ) | |
| Equal-mass mergers | ||
| 0.12 0.06 | 0.25 0.16 | |
| w/ Sbc 141414Fit includes Sbc-Sbc simulation | 0.07 0.07 | 0.46 0.16 |
| -0.23 0.07 | 2.75 0.18 | |
| w/ Sbcb | -0.08 0.11 | 2.13 0.25 |
| -0.56 0.11 | 3.78 0.28 | |
| w/ Sbcb | -0.32 0.11 | 2.78 0.25 |
| 3:1 baryonic mass ratio mergers | ||
| 0.33 0.05 | -0.31 0.12 | |
| 0.00 0.06 | 1.43 0.15 | |
| -0.26 0.09 | 2.28 0.23 | |
| 9:1 baryonic mass ratio mergers | ||
| 0.48 0.05 | -0.66 0.14 | |
| -0.26 0.15 | 2.52 0.39 | |
| -0.71 0.11 | 3.71 0.29 | |
| Simulation | T(151515 has units kpc .) | T() | T() | T () |
|---|---|---|---|---|
| (Gyr) | (Gyr) | (Gyr) | (Gyr) | |
| Equal-mass mergers | ||||
| SbcSbc | 0.15 0.19 | 0.35 0.23 | 0.90 0.16 | 1.20 0.18 |
| G3G3 | 0.39 0.30 | 0.72 0.39 | 1.21 0.38 | 1.85 0.13 |
| G3gf1G3gf1 | 0.20 0.38 | 0.47 0.36 | 0.94 0.34 | 1.58 0.15 |
| G3gf2G3gf2 | 0.13 0.26 | 0.43 0.29 | 0.89 0.32 | 1.51 0.17 |
| G3gf2aG3gf2a | 0.14 0.27 | 0.40 0.28 | 0.88 0.34 | 1.50 0.21 |
| 3:1 baryonic mass ratio mergers | ||||
| G3G2 | 0.26 0.15 | 0.59 0.44 | 1.15 0.36 | 1.98 0.16 |
| G3gf1G2 | 0.25 0.21 | 0.60 0.47 | 1.16 0.40 | 1.95 0.12 |
| G3gf2G2 | 0.35 0.23 | 0.72 0.45 | 1.27 0.34 | 2.07 0.14 |
| 9:1 baryonic mass ratio mergers | ||||
| G3G1 | 0.44 0.28 | 0.96 0.47 | 1.67 0.62 | 2.87 0.31 |
| G3gf1G1 | 0.41 0.21 | 0.95 0.49 | 1.64 0.55 | 2.83 0.31 |
| G3gf2G1 | 0.46 0.24 | 1.00 0.53 | 1.74 0.53 | 2.98 0.33 |
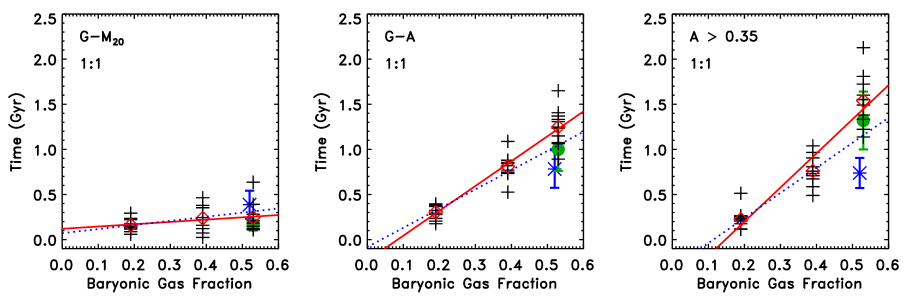
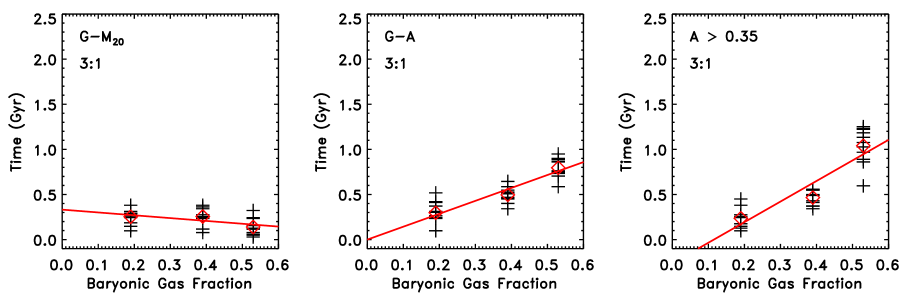
4.3 Observability Time-scales v.
We calculate the time each simulation is classified as a merger using morphological criteria given in Equations 911. These time-scales (black crosses) are plotted in Figures 1113, and the viewing-angle averaged values and standard deviations are given in Table 3. We fit the dependence of the observability time-scale on , and give these fits in Table 4. Again, we find no significant difference between the G3gf2G3gf2 and G3gf2aG3gf2a simulations (green circles; Table 3).
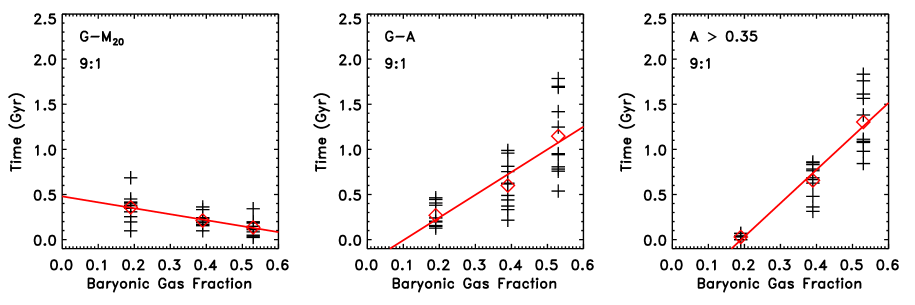
The time-scale for detecting a merger with high asymmetry is a strong function of the baryonic gas fraction of the primary galaxy, regardless of the merger mass ratio. For the major mergers, the and time-scales roughly doubles from 200300 Myr to 500700 Myr when is increased from 19% to 39%, and roughly doubles again to 11.4 Gyr when is increased from 39% to 53%.
The asymmetry behavior of the minor mergers is even more dramatic because the lowest minor merger, G3G1, does not show . The minor merger observability time-scales increase from 0 at = 19% to 1.3 Gyr at 53%. The minor merger G3gf2G1 simulation and time-scales are as long as the equal-mass G3gf2G3gf2 simulation because it experiences an additional peak in asymmetry at the second pass as well as at the first pass and the final merger. Given these trends, it is possible that even higher mass ratio ( 9:1) high gas-fraction ( 20%) mergers may be detected by asymmetry.
The observability time-scale, on the other hand, does not appear to be a strong function of gas fraction nor mass ratio. There is a slight trend towards shorter time-scales with higher gas fraction for unequal-mass mergers because the merging nuclei are more likely to be obscured by dust in the high gas-fraction simulations. In general, the time-scales have a much weaker correlation with than , as the increased values are countered by the decreased values. In Paper 2, we found that a 39:1 baryonic mass ratio merger with local gas fraction was not classified as merger by . Given the inverse correlation of T() with , it is unlikely that very high mass ratio, high gas fraction mergers would be detected by .
Our results here confirm the our conclusion in Paper 1 that high gas-fraction mergers experience high asymmetries for longer durations than moderate gas-fraction mergers. In Figure 11 we also plot the Sbc-Sbc prograde-prograde simulation time-scales from Paper 1. The Sbc-Sbc simulation has similar to the G3gf2G3gf2 simulation but shows high asymmetry for 750 Myr shorter duration. The difference between the Sbc-Sbc and G3gf2G3gf2 merger asymmetry time-scales suggests that gas scalelength and/or dark matter concentration may play secondary roles.
We also compute the time-scales for detecting each merger as a close pair with projected separations , , , and kpc (Table 4) . The unequal-mass mergers show no dependence of the close pair time-scale on gas fraction. However, the equal-mass mergers have shorter close pair time-scales at higher gas fractions. At small separations kpc , this is because the higher gas fraction discs are less easily deblended.
5 Summary and Implications
We have analysed the -band quantitative morphologies and projected pair separations of a series of GADGET/SUNRISE simulations of disc galaxy mergers with increasing gas fractions. These merger simulations span a range in baryonic mass ratio from 1:1 to 9:1, and in primary galaxy baryonic gas-fraction from 19% to 53%. We determine the observability time-scales for identifying these simulated mergers using quantitative morphology classifications in , , and and as close pairs with projected separations , , , and kpc . Our main conclusions are as follows:
Gas-fraction has a strong effect on the quantitative morphologies of the merger simulations. Both minor and major merger simulations with fgas 39% show higher , higher , and lower values throughout the course of the merger. The high gas fractions produce more disc star-formation and therefore higher and values for the initial disc galaxies. During the course of a high gas-fraction merger, remains elevated after the first pass and after the final merger because of strong tidal features and residual star-formation. , on the other hand, is suppressed because of increased dust extinction of the central nuclei.
The time-scale for detecting a galaxy merger with high asymmetry is a strong function of gas fraction. The asymmetry time-scale for a major merger with baryonic mass ratio 3:1 increases from 230 Myr for f 19% to 500700 Myr for f 39% to 11.4 Gyr for f 53%. While the 9:1 minor merger with f 19% does not produce asymmetries large enough to be classified as a merger, the higher fgas minor mergers have asymmetry time-scales similar to the major mergers. Therefore, at high , asymmetry is equally likely to detect both minor and major mergers, but at low and moderate asymmetry will primarily find major mergers.
The time-scale for detecting a galaxy merger via is not a strong function of the merger gas fraction, and is weakly anti-correlated with for minor mergers. While the high simulations produce more stars at large radii and increase , they have more dust obscuration for the central nuclei and therefore lower values. These two effects result in more mergers detected at the first pass and fewer mergers detected at the final merger by , but leave the total detection time-scale relatively unchanged ( Myr).
The close pair time-scales do not change with increased gas fraction for the unequal-mass mergers. Equal-mass mergers of high gas fraction discs are more difficult to deblend at projected separations 30 kpc , resulting in shorter projected separation time-scales.
Gas-rich mergers are expected to be more common at redshifts than at present-day. The fraction of galaxies in blue galaxy blue galaxy pairs increases strongly from to (Lin et al. 2008, Bundy et al. 2009, Ravel et al. 2009). In addition, the typical gas-fraction of galaxies may also evolve strongly with redshift. Cold gas in disc galaxies has recently been observed (Daddi et al. 2009; Tacconi et al. 2009), and suggest gas-fractions 40%, significantly higher than local discs. These galaxies also have higher star-formation rates per unit mass (Noeske et al. 2007) and similar or smaller effective radii (Barden et al. 2005; Melbourne et al. 2007) suggestive of higher gas densities than local disc galaxies.
Many studies have found strong evolution in the fraction of bright or massive galaxies with high asymmetries from to (e.g. Abraham et al. 1996; Conselice et al. 2003, 2008; Cassata et al. 2005; Lopez-Sanjuan et al. 2009; but see Shi et al. 2009). Similar trends have also been found using visual classification of strongly-disturbed merger candidates and tidal tails (e.g. Brinchmann et al. 1998, Le Févre et al. 2000, but also see Jogee et al. 2009). On the other hand, spectroscopically-confirmed pairs and techniques have found weak evolution in the fraction of galaxy merger candidates (Lin et al. 2004, Bundy et al. 2004, Lotz et al. 2008a, de Ravel et al. 2009).
Our simulations predict that galaxy mergers will exhibit high asymmetries for longer periods of time if they have high gas-fractions. Asymmetric galaxies are also likely to be visually classified as mergers, therefore the time-scales for visually classifying a merger will also scale with gas fraction. This implies that much of the observed evolution in the asymmetric galaxy mergers may be the result of strong evolution in the typical gas-fraction of mergers, rather than the global merger rate. In other words, we find more high-redshift asymmetric galaxies not because mergers occur more frequently but because they are more likely to be gas-rich and/or they have higher gas-fractions than local mergers. On the other hand, the and close pair time-scales are expected to be independent of gas-fraction and therefore not affected by by any evolution in the typical merger gas fraction. This is consistent with weak evolution observed in the fraction of mergers and close pairs.
The merger simulations and observability time-scales presented here and in Papers 1 and 2 represent a dramatic step forward in our ability to interpret observations of galaxy mergers. With an understanding of how gas-fraction and merger mass ratio affect the detection of galaxy mergers, we can now determine a consistent galaxy merger rate for each of different methods of identifying galaxy mergers. We can also use the different behaviours of , asymmetry, and close pairs to probe the evolution of mergers as a function of mass ratio and gas content. For a given merger, it is difficult to determine its mass ratio or gas-fraction from its morphology alone. But by using the relative numbers of mergers, close pairs, and asymmetric objects, combined their observability time-scales, it will be possible to determine how the minor v. major and gas-rich v. gas-poor merger rates evolve with time. We will explore these possibilities in more detail in our next paper (Paper 4). In the next few years, the refurbished with Wide Field Camera 3 will certainly identify large samples of morphologically disturbed galaxies. With the commissioning of the Atacama Large Millimeter Array, it will be possible to determine if these merger candidates and other galaxies have cold gas fractions substantially higher than local galaxies.
JML acknowledges support from the NOAO Leo Goldberg Fellowship, NASA grants NAG5-11513 and HST-AR-9998, and would like to thank P. Madau for support for this project. PJ was supported by programs HST-AR-10678, HST-AR-10958, and HST-AR-11958 provided by NASA through grants from the Space Telescope Science Institute, which is operated by the Association of Universities for Research in Astronomy, Incorporated, under NASA contract NAS5-26555, and by the Spitzer Space Telescope Theoretical Research Program, through a contract issued by the Jet Propulsion Laboratory, California Institute of Technology under a contract with NASA. TJC was supported by a grant from the W.M. Keck Foundation. JRP was supported by NASA ATP grant NNX07AG94G.
This research used computational resources of the NASA Advanced Supercomputing Division (NAS) and the National Energy Research Scientific Computing Center (NERSC), which is supported by the Office of Science of the U.S. Department of Energy.
References
- [] Abraham, R., Tanvir, N.R., Santiago, B.X., Ellis, R.S., Glazebrook, K., van den Bergh, S. 1996, MNRAS, 279, L47
- [] Abadi, M.G., Navarro, J., Steinmetz, M., & Eke, V.R. 2003, ApJ, 597, 21
- [] Abazajian, K. et al. 2003, AJ, 126, 2081
- [] Barnes, J. & Hernquist, L. 1996
- [] Barnes, J. 2002, MNRAS, 333, 481
- [] Barden, M. et al. 2005, ApJ, 635, 959
- [] Bell, E.F. & de Jong, R.S. 2001, ApJ, 550, 212
- [] Bell, E. et al. 2004, ApJ 608, 752
- [] Bell, E. et al. 2006, ApJ, 640, 241
- [] Bournaud, F., Combes, F., Jog, C.J., & Puerari, I. 2005, A&A, 438, 507
- [] Bournaud, F., & Duc, P. 2006, A&A, 456, 481
- [] Boylan-Kolchin, M., Ma, C.-P., & Quataert, E. 2005, MNRAS, 362, 184
- [] Boylan-Kolchin, M., Ma, C.-P., & Quataert, E. 2006, MNRAS, 360, 1081
- [] Brinchmann, J. et al. 1998, ApJ, 499, 112
- [] Broeils, A.H. & van Woerden H., 1994, A&AS, 107, 129
- [] Brown, M. et al. 2007, ApJ, 654, 858
- [] Bundy, K. et al. 2004, ApJ, 601, L123
- [] Bundy, K. et al. 2009, ApJ, 1369, 1383
- [] Cassata et al. 2005, MNRAS, 357, 903
- [] Conselice, C. 2003, ApJS, 147, 1
- [] Conselice, C., Bershady, M.A., Dickinson, M., & Papovich, C. 2003, AJ, 126, 1183
- [] Conselice, C., Yang, C., & Bluck, A.F.L. 2009, MNRAS, 394, 1956
- [] Cox, T.J., Primack, J.R., Jonsson, P., & Somerville, R.S. 2004, ApJL, 607, L87
- [] Cox, T.J., Di Matteo, T., Hernquist, L., Hopkins, P., Robertson, B., & Springel, V. 2006a, ApJ, 643, 692
- [] Cox, T.J., Jonsson, P., Primack, J.R., Somerville, R.S. 2006b, MNRAS, 373, 1013
- [] Cox, T.J., Dutta, S.N., Di Matteo, T., Hernquist, L., Hopkins, P., Robertson, B., & Springel, V. 2006c, ApJ, 650, 791
- [] Cox, T.J., Jonsson, P., Somerville, R.S., Primack, J.R., & Dekel, A. 2008, MNRAS, 384, 386
- [] Daddi, E., et al. 2009, ApJ submitted, arXiv:0911.2776
- [] de Jong, R.S. 1996, A&A, 313, 45
- [] de Ravel et al. 2009, A&A, 498, 379
- [] Di Matteo, T., Springel, V., & Hernquist L. 2005, Nature, 433, 7026
- [] Di Matteo, P., Bournaud, F., Martig, M., Combes, F., Melchior, A.-L., & Semelin, B. 2008, A&A, 492, 31
- [] Erb, D., Shapley, A.E., Pettini, M., Steidel, C.C., Reddy, N.A., & Adelberger, K.L. 2006, ApJ, 644, 813
- [] Erb, D., Steidel, C.C., Shapley, A., Pettini, M., & Reddy, N.A. 2006, ApJ, 646, 107
- [] Faber, S.M., et al. 2007, ApJ, 665, 265
- [] Jogee, S. et al. 2009, ApJ, 697, 1971
- [] Johansson, P.H., Naab, T., & Burkert, A. 2009, ApJ, 690, 802
- [] Jonsson, P. 2006, MNRAS, 372, 2
- [] Jonsson, P., Cox, T.J., Primack, J., & Somerville R. 2006, ApJ, 637, 255
- [] Jonsson, P., Groves, B. & Cox, T.J., 2009, MNRAS, submitted
- [] Hopkins, P.F., Hernquist, L., Cox, T.J., Di Matteo, T., Martini, P., Robertson, B., & Springel V. 2005, ApJ, 630, 705
- [] Hopkins, P.F., et al. 2008, ApJS, 175, 356
- [] Hopkins, P. et al. 2009, ApJ, 691, 1168
- [] Katz, N., Weinberg, D.H., Hernquist, L. 1996, ApJS, 105, 19
- [] Kennicutt, R.C. 1998, ApJ, 498, 541
- [] Khalatyan, A., Cattaneo, A., Schramm, M., Gottlober, S., Steinmetz, M., & Wisotzki, L. 2008, MNRAS, 387, 13
- [] Leitherer, C. et al. 1999, ApJS, 123, 3
- [] Le Fèvre, O. et al. 2000, MNRAS, 311, 565
- [] Lin, L. et al. 2004, ApJ, 617, L9
- [] Lin, L. et al. 2008, ApJ, 681, 232
- [] Lopez-Sanjuan, C. et al. 2009, A&A, in press
- [] Lotz, J.M., Primack, J., & Madau, P. 2004, AJ, 613, 262 (LPM04)
- [] Lotz, J.M. et al 2008a, ApJ, 672, 177
- [] Lotz, J.M., Jonsson,P., Cox, T.J., & Primack, J. 2008b, MNRAS, 391, 1137 (Paper 1)
- [] Lotz, J.M., Jonsson,P., Cox, T.J., & Primack, J. 2009a, MNRAS, submitted (Paper 2)
- [] Martig, M. & Bournaud, F. 2008, MNRAS, 385, L38
- [] Melbourne, J., Phillips, A.C., Harker, J., Novak, G., Koo, D.C., & Faber, S.M. 2007, ApJ, 660, 81
- [] Mihos, J. C., & Hernquist, L. 1996, ApJ, 464, 641
- [] Naab, T., Jesseit, R., & Burkert, A. 2006, MNRAS, 372, 839
- [] Noekse, K. et al. 2007, ApJ, 660, L47
- [] Patton, D et al. 2000, ApJ, 536, 153
- [] Rocha, M., Jonsson, P., Primack, J.R., & Cox, T.J. 2008, MNRAS, 383, 1281
- [] Roberts, M.S. & Haynes, M.P. 1994, ARA&A, 32, 115
- [] Robertson, B., Cox, T.J., Hernquist, L., Franx, M., Hopkins, P., Martini, P., & Springel, V., 2006a, ApJ, 641, 21
- [] Robertson, B., Bullock, J., Cox, T.J., di Matteo, T., Hernquist, L., Springel, V., & Yoshida, N. 2006b, ApJ, 645, 986
- [] Shi, Y., Rieke, G., Lotz, J.M., & Perez-Gonzalez, P. 2009, ApJ, 697, 1764
- [] Sinha, M., & Holley-Bockelmann, K. 2009, MNRAS, 397, 190
- [] Springel, V., Yoshida, N., & White, S.D.M., 2001, New Astronomy, 6, 79
- [] Springel, V. & Hernquist, L. 2002, MNRAS, 333, 649
- [] Springel, V. & Hernquist, L. 2003, MNRAS, 339, 289
- [] Springel, V. & Hernquist, L. 2005, ApJ, 622, L9
- [] Tacconi, L. et al. 2010, Nature, submitted
- [] van Dokkum, P. 2005, AJ, 130, 2647
- [] Wetzstein, M., Naab, T., & Burket, A. 2007, MNRAS, 375, 805