Gas, dust and stars in the SCUBA galaxy, SMM J023990136: the EVLA reveals a colossal galactic nursery
Abstract
We present new multi-wavelength observations of the first submillimetre-selected galaxy (SMG), SMM J023990136 at . These observations include mapping of the CO =10 emission using elements of the Expanded Very Large Array, as well as high-resolution 1.4-GHz imaging and optical/infrared (IR) data from the Very Large Array, Hubble Space Telescope, Spitzer and Keck-i. Together these new data provide fundamental insights into the mass and distribution of stellar, gas and dust distribution within this archetypal SMG. The CO =10 emission, with its minimal excitation and density requirements, traces the bulk of the metal-rich molecular gas, and reveals a molecular gas mass of 1011 M⊙, extending over approximately 5 arcsec (25 kpc in the source plane), although there is tentative evidence that it may be significantly larger. Our data suggest that three or more distinct structures are encompassed by this molecular gas reservoir, including the broad-absorption-line (BAL) quasar from which the redshift of the SMG was initially determined. In particular, the new rest-frame near-IR observations identify a massive, obscured, starburst which is coincident with a previously known Ly cloud. This starburst dominates the far-IR emission from the system and requires a re-assessment of previous claims that the gas reservoir resides in a massive, extended disk around the BAL QSO. Instead it appears that SMM J023990136 comprises a merger between a far-IR-luminous, but highly obscured starburst, the BAL QSO host and a faint third component. Our findings suggest that this archetypal SMG and its immediate environment mark a vast and complex galactic nursery and that detailed studies of other SMGs are likely to uncover a similarly rich diversity of properties.
keywords:
galaxies: evolution — galaxies: high-redshift — galaxies: individual: SMM J023990136 — galaxies: starburst — infrared: galaxies — radio continuum: galaxies1 Introduction
Submillimetre- (submm-)selected galaxies (SMGs) were discovered using the Submm Common-User Bolometer Array (SCUBA – Holland et al., 1999), exploiting gravitational amplication by massive, foreground clusters (Smail et al., 1997, 2002). They are responsible for a significant fraction of the cosmic submm and far-IR background (Fixsen et al., 1998) and hence constitute an important class of distant galaxies. The Very Large Array (VLA) facilitated identification of the first SMGs, via high-resolution 1.4-GHz imaging (Smail et al., 2000; Ivison et al., 2000) enabling the acquisition of spectroscopic redshifts, e.g. for the first SMG to be discovered, SMM J023390136 (Ivison et al., 1998, hereafter SMM J02399 and I98). The rest-frame UV spectral properties of SMM J02399 indicated that this system contained a low-ionisation, BAL quasar, denoted L1 by I98, with a low-surface-brightness companion (possibly due to scattered AGN light), L2, associated with a large Ly-emitting cloud, extending over at least 20 kpc (I98; Ivison et al. 1999; Villar-Martín et al. 1999; Vernet & Cimatti 2001). Vernet & Cimatti (2001) report an absorption complex at 1,000 km s-1 and, for high-ionisation lines, at 6,700 km s-1, both measured relative to L1 (at , which is km s-1 blueward of L2). Mid-IR and X-ray data have suggested that the immense luminosity of this system, L⊙, arises roughly equally from the AGN and starburst components (Bautz et al., 2000; Lutz et al., 2005; Valiante et al., 2007).
SMM J02399 was also the first SMG whose molecular gas was detected via CO (Frayer et al., 1998). This exploited the large positive -correction afforded by even mildly-excited high- CO lines and the redshifting of their frequencies to transmissive parts of the atmosphere (see also Brown & Vanden Bout, 1991, 1992; Solomon et al., 1992; Solomon & Vanden Bout, 2005). Since then, great progress has been made in discerning the H2 gas mass distribution in distant SMGs, helping to characterise their evolutionary state (Frayer et al., 1999; Ivison et al., 2001); recently, more sensitive and higher resolution work has employed the Institut de Radioastronomie Millimétrique’s (IRAM’s) Plateau de Bure Interferometer (PdBI; Downes & Solomon, 2003; Neri et al., 2003; Greve et al., 2005; Kneib et al., 2005; Tacconi et al., 2006, 2008). On the basis of CO =32 observations, Genzel et al. (2003), hereafter G03, argued for the presence of a massive and rapidly rotating disk in SMM J02399, associated with L1, although they could not rule out an alternative configuration with two galaxies orbiting one another. They reported a -arcsec structure in their sensitive rest-frame 335-m continuum imaging, associating this with L1.
Only a handful of SMG studies (Greve et al., 2003; Hainline et al., 2006; Carilli et al., 2010) have made use of the CO =10 line – the transition most capable of tracing the bulk of the H2 gas, with its minimal excitation requirements ( cm-3 and k). Instead, high- (and thus high-excitation) CO transitions have usually been used. CO =32 and higher- rotational levels probe the star-forming molecular gas (e.g. Zhu et al., 2003; Yao et al., 2003) and thus give a potentially biased view of the total gas mass and gas distribution.
It must be noted that even when it comes to the properties of the star-forming gas, comparisons between SMGs and local ULIRGs are difficult since the high- CO lines routinely obtained for SMGs have only recently become available for the global molecular gas reservoirs of ULIRGs (e.g. Papadopoulos et al., 2007). Observations of the CO =10 line, on the other hand, allow the most straightforward estimate of metal-rich H2 gas mass, its distribution, and the enclosed galactic dynamical mass (assuming dynamically relaxed systems). Comparisons with the available CO =32 also allow an assessment of the global molecular gas excitation conditions, which are in turn a powerful indicator of the star-forming and non-star-forming molecular gas fractions in galaxies. The latter has been found to vary considerably, even among vigorous starbursts in the local Universe (Weiß et al., 2005) and at higher redshifts (e.g. Papadopoulos & Ivison, 2002).
Here, we report sensitive new interferometric observations of SMM J02399, exploiting the arrival of Ka (26.5–40 GHz) Expanded VLA (EVLA) receivers at the VLA to trace the bulk of its molecular gas through its CO =10 line emission redshifted into a hitherto inaccessible frequency range (over half of radio-identified SMGs lie at –3.35 corresponding to CO =10 in the Ka frequency band, Chapman et al., 2005). This well-studied and bright target provides an obvious starting point for future CO =10 surveys of the SMG population with EVLA. We also present sensitive, new 1.4-GHz continuum imaging, spectroscopic imaging in the rest-frame UV from the Keck-i telescope, and deep multi-filter imaging with Spitzer and the Advanced Camera for Surveys (ACS) aboard the Hubble Space Telescope.
Throughout this paper we assume a flat cosmological model with and km s-1 Mpc-1.
2 Observations
2.1 CO =10 observations using the EVLA
Around 70 hr of data were obtained with the VLA in its C configuration during 2009 July–September, around half via dynamically-scheduled 2-hr blocks, the rest via fixed 6-hr blocks. The weather conditions were generally excellent. We discarded 20 hr of data, taken when a pointing bug was affecting the array, and around 6 hr of data, taken when the weather was unsuitable.
A compact calibrator, 0239025 (1.0 Jy at 30.3 GHz), lies deg from SMM J02399, and we used this to track the phase and amplitude every 3–5 min, as well as to update the VLA’s pointing model every hour (at 8.4 GHz). 0137+331 (3C 48) was used to calibrate the flux density scale.
Typically, around ten receivers were functional at any one time, each mounted on an upgraded EVLA antenna. We used continuum mode, giving dual-polarisation channels, each with a bandwidth of 50 MHz (or km s-1 for CO =10 at ). The observed frequency of the CO =10 transition lies below 32 GHz for , where only two intermediate frequencies (IFs), B and D, can be tuned, so we placed IFs A and C at 32.3 GHz to constrain the off-line flux density, even though we expected no significant continuum emission from either the synchrotron, the free-free or the dust (I98). We alternated the tuning of IFs B and D between the blue and red peaks seen by Frayer et al. (1998) and G03, although some data were taken at non-optimal frequencies.
The data were processed using standard procedures developed for high-frequency observing. Our calibration strategy was able to track changes in phase and amplitude accurately across the full 0–300 k of coverage. Imaging was accomplished using imagr within .
2.2 CO =32 and 1.3-mm continuum observations
G03’s 1.3-mm continuum imaging of SMM J02399 from IRAM’s PdBI, and their CO =32 data cube, were kindly made available to us by L. Tacconi and A. Baker (private communication). We use these data here to facilitate the most complete possible picture of the molecular gas in SMM J02399 and its physical conditions. The 1.3-mm imaging yields a beam of 1.8-arcsec 1.4-arcsec (very close to that of our 1.4-GHz radio map, see §2.3), while the CO =32 map has significantly lower resolution, 5.2-arcsec 2.4-arcsec. A full description of the observations and their reduction is given in G03.
2.3 1.4-GHz imaging with the Very Large Array
Data at 1.4 GHz were obtained for the Abell 370 cluster field during August and September in both 1994 [B configuration] and 1999 [A], recording -MHz channels in each of two dual-polarisation IF pairs. 0259077 [B] and 0323055 [A] were used to track amplitude and phase and 0137331 was used for flux and bandpass calibration. Data processing and imaging followed the description given by Owen & Morrison (2008). The resulting continuum map has a noise level of Jy beam-1 near SMM J02399, with a 1.8-arcsec 1.6-arcsec synthesised beam (position angle, PA, 166 deg).
2.4 Hubble Space Telescope and Spitzer observations
Following the successful Servicing Mission #4 in 2009 May, observations were obtained using the Advanced Camera for Surveys (ACS) during 2009 July (PID 11507), for a total of 6,780, 2,040 and 3,840 s in the F475W (), F625W () and F814W () bands, respectively. The data were reduced using the multidrizzle package and the images are available111http://archive.stsci.edu/hst/sm4earlypublic.
In addition, we have retrieved Near Infrared Camera and Multi-Object Spectrometer (NICMOS) imaging of SMM J02399 (PID 11143). These were reduced and combined in the standard manner from the pipeline-reduced data in the Space Telescope European Coordinating Facility archive. They comprise 2,560 s of integration with the NIC2 camera in the F110W () and F160W () filters.
2.5 Keck spectroscopic observations
Keck-i long-slit spectroscopy was obtained during 2001 October using LRIS (Oke et al., 1995) to step through seven positions across the object, integrating for 2 ks in each, with a 1-arcsec slit and the low-resolution 300 lines mm-1 grism. A full description of the observations and data reduction are presented in Santos et al. (2004).
2.6 Astrometric alignment
The bright point source, L1, visible in many wavebands, has allowed us to remove the positional ambiguity that would otherwise hamper a detailed comparison of the kind undertaken here.
We adopt the VLA 1.4-GHz map as our fundamental coordinate frame and shift the other frames to this one to align the emission from L1. We employed local phase calibrators (1.0, 10.6 and 13.0 deg from SMM J02399), with positions known to 1 milliarsec, and residual phase errors after calibration were small, so we estimate the absolute alignment of the 1.4-GHz and CO =10 coordinate frames should be better than 0.1 arcsec, leaving aside uncertainties relating to signal-to-noise and beam size (discussed in §3.4). The astrometry of the HST images was firstly calibrated against a wider-field optical image of the cluster which had in turn been aligned onto the FK5 coordinate system defined by United States Naval Observatory optical catalogue to an r.m.s. precision of 0.2 arcsec. To align the IRAM data (1.3-mm continuum and CO =32) with the 1.4-GHz continuum emission, we shifted the former to the east by 0.5 arcsec in R.A., which is consistent with the claimed astrometric precision of the PdBI images. To align the optical/near-IR data with the 1.4-GHz continuum emission, we shifted the former in Dec. by +0.15 arcsec.
2.7 The lensing model
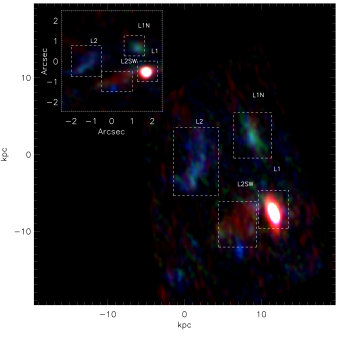
Having described the large collection of new and archival data at our disposal, we describe now how we deal with the gravitational lensing experienced by SMM J02399. We correct for the lensing distortion and magnification using a mass model of the Abell 370 cluster. This is discussed in detail by Richard et al. (2009) and is based on ten multiply-imaged systems detected in the HST/ACS data (§2.4). We derive a total magnification factor of at the location of SMM J02399 in a direction roughly aligned with L1–L2 and we use the model to reconstuct the morphology in the source plane using lenstool (Kneib et al., 1996). The effect of the correction can be seen in Fig. 1.
3 Analysis and Results
3.1 Taxonomy
We begin with a brief description of the SMM J02399 system, as seen in the rest-frame UV–optical true-colour imaging from HST. In what follows we will refer to four main components seen in Fig. 1: L1 – the BAL quasar to the west, the brightest UV emitter in the region; L1N – the bright, compact source, 8 kpc north of L1; L2 – the low-surface-brightness feature, 10 kpc east of L1; L2SW, the red feature seen in our NICMOS imaging extending 6 kpc to the south-east of L1.

3.2 Radio continuum morphology
In Fig. 2 (central panel) we see the 1.4-GHz synchrotron emission overlaid as green contours on the HST true-colour image, together with 50-k-tapered CO contours. A knot of synchrotron emission is coincident with L1 but the majority of the radio emission extends to the east, close to the extended near-IR source, L2SW. It is coincident to within the uncertainties with the original SCUBA 850-m continuum centroid, with the PdBI 1.3-mm continuum emission, and with the CO =32 line emission (\al@ivison98, genzel03; \al@ivison98, genzel03), as shown in the right-hand panel of Fig. 2.
There are two possible explanations for the radio morphology of this system. First, the radio morphology could be due to a bipolar jet from L1 – a known X-ray-bright BAL quasar – which encounters only one working surface: the cloud of molecular gas traced by the CO and dust emission, to the east of L1. In this scenario, L2 and L2SW may be shock-excited regions – L2 lying at the point where the jet terminates – with the entire system powered by the kinetic energy of the jet (e.g. Punsly & Tingay, 2005). Taking this interpretation, SMM J02399 is reminiscent of the system described by Józsa et al. (2009), where extended emission originating at the centre of IC 2497 at , probably a radio jet, points in the direction of Hanny’s Voorwerp – a region in a neighbouring H i cloud, first seen because of its shock-excited, optical emission lines.
Alternatively, and more plausibly, the extended emission may be associated with a heavily dust-obscured starburst between L1 and L2. As we shall see in the next section, the host of this starburst, L2SW, is identified through IRAC and NICMOS rest-frame optical/near-IR emission, as well as wispy rest-frame UV emission structures representing leakage from patches of low obscuration (similar to the scenario proposed for SMM J140110252 by Ivison et al. 2001). The spatial coincidence of this source with the CO reservoir, as well as the 850-m and 1.3-mm continuum emission, strongly suggests it is the seat of the hyperluminous starburst within this system.
As an aside, the lack of emission at 32.3 GHz rules out the possibility that the AGN within L1 has a flat-spectrum core.
3.3 Rest-frame UV/optical/near-IR light
The most remarkable feature of the 2-D spectroscopy described in §2.5 is that Ly is seen across the entire 1,600-kpc2 region shown in Fig. 1. The scale of the Ly nebular was hinted at by early data (I98) but we can see now that SMM J02399 is a classic ‘Ly blob’ (e.g. Matsuda et al., 2004). There is a velocity gradient in Ly as one moves from L1 to L2. Secondary peaks in Ly intensity and velocity dispersion are coincident with L2 – the local velocity gradient is around km s-1. UV continuum is co-spatial with the line emission over much of the region, but none is seen near L2.
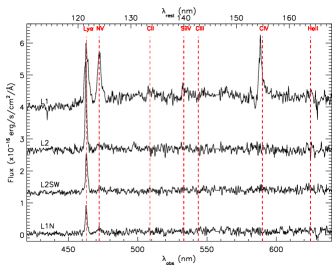
Fig. 3 shows 1-D spectra of the four regions identified in Fig. 1. Strong Ly and N v emission dominate the spectrum of L1, along with weak He ii (164.5nm) (e.g. I98, ) at nm. L2 and L2SW are practically indistinguishable, spectroscopically. Regarding the Ly emission, and the proximity of an AGN/starburst, SMM J02399 is very similar to the Ly nebula presented by Scarlata et al. (2009). L1N, L2 and L2SW all show weak N v emission suggesting that they contain ionising sources.
L1 dominates the SMM J02399 system in IRAC wavebands. We show in the left-hand panel of Fig. 2 the true-colour IRAC image after subtraction of a point source at the position of L1. It is immediately apparent that L2SW emits strongly at rest-frame 0.95–1.5 m.
Using the optical photometry from I98 and the flux densities of L2 determined from the NICMOS and IRAC imaging (§2.4; see also Figs 1 and 2), we find that the spectral energy distribution (SED) is well fit with a reddened and very young stellar population (; 10 Myr old). From this we derive a best-fit, rest-frame, lensing-corrected -band luminosity for the galaxy, , equivalent to a stellar mass of 1011 M⊙ using a light-to-mass ratio appropriate for a young burst (), with an uncertainty of at least a factor of (Borys et al., 2005). This confirms the visual impression (Fig. 2) that L2 corresponds to a massive stellar system. We note that the rest-frame 1.5–2 m SED of L2 is flat, suggesting that an obscured AGN is not dominating its near-IR luminosity (cf. Hainline et al. 2010, in preparation). We stress that the combined SED of L1 and L2 is dominated by the AGN emission from L1. Only the combination of gravitational lensing and the high-resolution imaging used here allows us to decouple the AGN activity from that of the luminous, obscured starburst within this system. Similarly detailed studies of other SMGs may also uncover a rich variety in their properties (e.g. Ivison et al., 2000, 2008).
3.4 Molecular gas
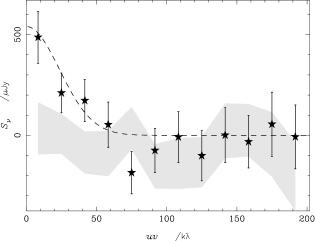
The other major baryonic component in the system is the cold gas. The CO =10 images mentioned in §2.1 were made using a variety of Gaussian tapers (125, 75, 50 k) resulting in synthesised beam sizes of 1.7, 2.4 and 3.2 arcsec and noise levels of 26–50 Jy beam-1. The noise level rises as the longer baselines are weighted down, but the signal due to CO line emission increases markedly. This is best illustrated by the amplitudes of the real and imaginary visibility components (Fig. 4) which suggest that the CO emission is resolved on baselines longer than 10 k, with a total flux density of approximately 500 Jy.
The position of the CO =10 emission ( J2000; see Fig. 2) is consistent with the emission seen by SCUBA and PdBI. We cannot rule out a contribution to the CO =10 flux from the quasar, but the majority of the emission appears to be coincident with L2SW.
The peak and total flux densities in the most severely tapered CO =10 map are Jy beam-1 and Jy. The latter value is sensitive to the manner in which the measurement is made; however, Gaussian fits and a simple integral over the emission region in the dirty image with tvstat give results consistent with Fig. 4. We adopt 540 Jy as the total CO =10 flux density hereafter. Gaussian fits to the dirty image provide a very rough indication of the size of the emission region: 2.0 5.0 arcsec, with the major axis at PA, deg, implying a lensing-corrected size of 25 kpc. This is only barely consistent with the visibilities (which suggest a size closer to 10 arcsec). Without data from the VLA in its D configuration, we have only loose constraints on the size of the CO =10 emitting region and may be underestimating the total flux density.
To correct for the finite throughput of our IFs, we adopt and adapt the strategy of Greve et al. (2003), correcting upwards by 45 per cent to account for the breadth of the line seen by G03 relative to our total bandwidth (90 MHz, taking into account the bandpass rollover), which takes the total flux in CO =10 to Jy km s-1.
As expected, no signal is apparent in the ‘off-line’ IF pair, down to a 2- limit of Jy. This situation does not change when tapering the data, although the noise doubles when a 50-k taper is applied.
The velocity/area-integrated CO brightness temperature in the source reference frame, , can be expressed as
| (1) |
where is the luminosity distance (Mpc), is the rest-frame frequency (GHz) of the CO =10 transition and the velocity-integrated flux density is in Jy km s-1 (e.g. Solomon et al., 1997). The corresponding H2 mass, , is given by , where is the CO–H2 luminosity-mass conversion factor. For quiescent environments, M⊙ (k km s-1 pc2)-1 (e.g. Solomon et al., 1987; Solomon & Barrett, 1991). In extreme starburst environments, like those prevailing in SMM J02399, M⊙ (k km s-1 pc2)-1 may be more suitable (Downes & Solomon, 1998), which corrects semi-empirically for the fact that the molecular gas reservoir in the dissipative mergers that typically characterise such starbursts is a continuous medium with a significant stellar mass component rather than an ensemble of virialised clouds (so that CO line widths no longer reflect only the mass of gas). In this case, M⊙ (after correcting for lensing amplification).
An absolute lower limit for the H2 gas mass can be obtained by assuming that the 12CO =10 emission is optically thin. For local thermodynamic equilibrium,
| (2) | |||||
where k, , k (the temperature of the cosmic microwave background at ), – the degeneracy of level , – the partition function, and for a Solar metallicity environment (Bryant & Scoville, 1996). For typical star-forming gas, where k, this yields M⊙ (k km s-1 pc2)-1, and thus M⊙ is the minimum plausible molecular gas mass in this system. Of course, CO traces metal-rich gas and in metal-poor environments (and/or intense far-UV radiation fields) more molecular gas may be present where CO has been dissociated. In this sense, and because we cannot rule out that we have missed a more extensive CO =10 component due to the lack of D-configuration EVLA data, the latter value is a firm lower limit.
The availability of both CO =10 and =32 allows a rudimentary probe of the average molecular gas excitation state. This can provide powerful clues about whether a galaxy-wide starburst occurs over most of the available molecular gas reservoir (pushing the global ratio up), or whether a smaller gas mass fraction is involved in fueling the starburst. High global high-/low- CO line ratios, indicative of galaxy-wide starbursts involving most of the ambient gas reservoir, have been observed in various high-redshift systems (e.g. Papadopoulos et al., 2005; Weiß et al., 2007), but low ratios in vigorously starbursting systems have also been detected (Papadopoulos & Ivison, 2002; Daddi et al., 2009; Dannerbauer et al., 2009).
For the reported CO =32 velocity-integrated line flux of Jy km s-1 (Frayer et al. 1998, G03), the globally-average CO (32)/(10) brightness temperature ratio would be . This line ratio is well within the domain expected for globally star-forming molecular gas, although it lies towards the low end of the expected range. Quiescent Milky Way clouds have whilst the typical average value for starburst nuclei is (Devereux et al., 1994; Yao et al., 2003). A grid of radiative transfer large-velocity gradient (LVG) models, constrained by the observed ratio and (since gas is always warmer than the concomitant dust where the gas is heated by far-UV radiation and/or turbulence), with the latter being k (I98) yields 300–103 cm-3, for k, for various values of the average gas velocity gradient . Given that other CO line ratios are not available to us, there is an irreducible degeneracy (the higher the temperature, the lower the density reproducing a given CO ratio, typically). If we further constrain the LVG solutions by allowing only those corresponding closely to virialised molecular gas velocity fields where
| (3) |
where and correspond to unbound gas motions and unphysical sub-virial motions, respectively, we find that the solutions with k are mostly favoured. We note, however, that super-virial solutions are plausible if the CO =10 emission originates predominantly from a cold, extended gas reservoir; indeed, solutions occupy the majority of the parameter space compatible with the observed line ratio, typically with cm-3 and k, conditions that often characterise the gas in starbursts (e.g. Aalto et al., 1995).
4 Discussion and concluding remarks
Based on the rest-frame UV and optical imaging, it appears that the SMM J02399 system comprises at least three significant components: L1, L1N and L2SW. Are these all massive baryonic galaxies within a very large reservoir of molecular gas, each caught during a different phase of their development? Or does L1 dominate the system, with L2SW, L1N (and L2) representing mere outflows and reflections?
G03 argued that the dust and gas seen towards SMM J02399 are associated with L1 and that the dynamics of the system as a whole are best described as a massive disk. Based on the data described here and elsewhere, there is little doubt that L1 does represent a significant concentration of mass: it is the brightest rest-frame UV emitter in the region; it is bright in the rest-frame 0.95–2.1 m waveband and hosts an X-ray-bright BAL quasar. However, Fig. 2 suggests that G03’s main assertion may not correct because the mm/submm, radio and CO emission lie predominantly on and around L2SW, although some weak emission does appear to be associated with L1.
Moving on to L2 and L2SW, Vernet & Cimatti (2001) and G03 argued that L2 is due to scattered light from L1, although G03 did concede that the L1/L2 system may comprise two galaxies orbiting one another. As we have argued, the true-colour Spitzer imaging presented in Fig. 2 shows that L2SW is a luminous source at rest-frame 0.95–1.5 m. We stress that several of these bands are not expected to suffer strong contamination by emission lines, hence we are seeing continuum emission, not scattered light.
We conclude that SMM J02399 comprises at least two galaxies – possibly as many as four – caught at different points during their evolution. In the evolutionary scheme outlined by Page et al. (2004), L1N may be the most evolved of these systems, followed by L1, L2 and the gas- and dust-rich system, L2SW, whose rest-frame far-IR emission led to the system’s discovery. However, this sequence could just as easily be related to mass: we have either one or two UV systems with modest stellar mass, the QSO host galaxy, which must be massive according to Magorrian et al. (1998), plus a massive, obscured starburst.
The major result from our study is the discovery of a massive, cold and apparently extended gas reservoir in SMM J02399. Tentative evidence for luminous CO =10 emission in SMGs had been published previously (Greve et al., 2003; Hainline et al., 2006). Greve et al. used the VLA to observe ERO J16452+4626.4, a submm-bright starburst at , finding and . Similarly, Hainline et al. observed the AGN-dominated SMG, SMM J13120+4242, using the Green Bank Telescope, and found a brightness temperature ratio, , indicative of a massive, sub-thermally excited molecular gas reservoir. Our new observations suggest that massive, cold gas components must be common amongst the SMG population.
In retrospect this discovery shouldn’t come as a great surprise. As is widely appreciated, optical/IR lines can lead to misleading views of velocity fields and galaxy types/sizes. They trace ionised gas, whose distribution traces the star formation and AGN activity within the galaxy, rather than its underlying structure. Equally, however, the excitation requirements of high- CO lines tie them to a particular star-formation area, so they do not give a faithful picture of the true H2 mass and dynamical mass distributions in galaxies either. The compact (0.5–1 kpc) emitting regions thereby revealed (Tacconi et al., 2008) are unlikely to trace the true dimensions of galaxies. It can be argued that high- observations simply return the star-formation efficiency (SFE) per star-forming H2 gas mass, rather than the more fundamental SFE per total H2 gas mass. Indeed, previous high- CO studies have uncovered low and brightness temperature ratios (0.15–0.35) in several SMGs (Tacconi et al., 2006) and such a low global high-/low- CO ratio is exactly how a massive, low-excitation H2 gas phase would betray itself at high redshifts.
A similar situation exists at where low-excitation H2 gas is found to extend well beyond compact nuclear starbursts (e.g. Weiß et al., 2005) while containing the bulk of the H2 gas mass. Line ratios comparable to those seen in the SMGs can be recovered by degrading similar observations of local starbursts and vigorously star-forming spirals (see Papadopoulos & Seaquist, 1998) to the spatial resolution typically available in CO observations of the distant Universe (1–10 kpc).
The confirmation of the presence of significant amounts of cold gas in SMGs has several significant implications for the interpretation of this population. In particular, the large gas reservoir detected in CO =10 highlights the danger of drawing far-reaching conclusions from more biased high- studies, particularly concerning the gas mass and gas fraction, the dynamics of SMGs, the evolutionary links between SMGs and their likely descendants at , their true star-forming potential (i.e. their potential present-day mass), the possible durations of star-forming episodes, and the state of their velocity fields (ordered and/or disk-like versus the more chaotic fields typical of mergers) – all of these issues are important, yet the answers remain largely unknown.
In the fullness of time, we expect EVLA, the Atacama Large Millimetre/submm Array and the Herschel Space Observatory to fully compare the excitation properties of gas reservoirs in SMGs, ULIRGs and QSOs and the relative distributions of star-forming and quiescent molecular gas, relating this to the activity in these systems, and their evolution, thereby constraining theoretical models of galaxy formation (Swinbank et al., 2008).
Acknowledgements
We thank Linda Tacconi and Andrew Baker for generously providing their IRAM PdBI data, Richard Ellis for granting us access to the LRIS observations and Julie Wardlow for help with the stellar population analysis. IRS acknowledges support from the UK Science and Technology Facilities Council. AMS and JR gratefully acknowledge a Royal Astronomical Society Sir Norman Lockyer Fellowship and a Marie Curie fellowship, respectively.
References
- Aalto et al. (1995) Aalto S., Booth R. S., Black J. H., Johansson L. E. B., 1995, A&A, 300, 369
- Bautz et al. (2000) Bautz M. W., Malm M. R., Baganoff F. K., Ricker G. R., Canizares C. R., Brandt W. N., Hornschemeier A. E., Garmire G. P., 2000, ApJ, 543, L119
- Borys et al. (2005) Borys C., Smail I., Chapman S. C., Blain A. W., Alexander D. M., Ivison R. J., 2005, ApJ, 635, 853
- Brown & Vanden Bout (1991) Brown R. L., Vanden Bout P. A., 1991, AJ, 102, 1956
- Brown & Vanden Bout (1992) Brown R. L., Vanden Bout P. A., 1992, ApJ, 397, L19
- Bryant & Scoville (1996) Bryant P. M., Scoville N. Z., 1996, ApJ, 457, 678
- Carilli et al. (2010) Carilli C. L. et al., 2010, ApJ, submitted
- Chapman et al. (2005) Chapman S. C., Blain A. W., Smail I., Ivison R. J., 2005, ApJ, 622, 772
- Daddi et al. (2009) Daddi E. et al., 2009, ArXiv e-prints
- Dannerbauer et al. (2009) Dannerbauer H., Daddi E., Riechers D. A., Walter F., Carilli C. L., Dickinson M., Elbaz D., Morrison G. E., 2009, ApJ, 698, L178
- Devereux et al. (1994) Devereux N., Taniguchi Y., Sanders D. B., Nakai N., Young J. S., 1994, AJ, 107, 2006
- Downes & Solomon (1998) Downes D., Solomon P. M., 1998, ApJ, 507, 615
- Downes & Solomon (2003) Downes D., Solomon P. M., 2003, ApJ, 582, 37
- Fazio et al. (2004) Fazio G. G. et al., 2004, ApJS, 154, 10
- Fixsen et al. (1998) Fixsen D. J., Dwek E., Mather J. C., Bennett C. . L., Shafer R. A., 1998, ApJ, 508, 123
- Frayer et al. (1999) Frayer D. T. et al., 1999, ApJ, 514, L13
- Frayer et al. (1998) Frayer D. T., Ivison R. J., Scoville N. Z., Yun M., Evans A. S., Smail I., Blain A. W., Kneib J., 1998, ApJ, 506, L7
- Genzel et al. (2003) Genzel R., Baker A. J., Tacconi L. J., Lutz D., Cox P., Guilloteau S., Omont A., 2003, ApJ, 584, 633
- Greve et al. (2005) Greve T. R. et al., 2005, MNRAS, 359, 1165
- Greve et al. (2003) Greve T. R., Ivison R. J., Papadopoulos P. P., 2003, ApJ, 599, 839
- Hainline et al. (2006) Hainline L. J., Blain A. W., Greve T. R., Chapman S. C., Smail I., Ivison R. J., 2006, ApJ, 650, 614
- Holland et al. (1999) Holland W. S. et al., 1999, MNRAS, 303, 659
- Ivison et al. (1999) Ivison R., Smail I., Blain A., Kneib J., Frayer D., 1999, ApSS, 266, 285
- Ivison et al. (2008) Ivison R. J. et al., 2008, MNRAS, 390, 1117
- Ivison et al. (2000) Ivison R. J., Smail I., Barger A. J., Kneib J., Blain A. W., Owen F. N., Kerr T. H., Cowie L. L., 2000, MNRAS, 315, 209
- Ivison et al. (2001) Ivison R. J., Smail I., Frayer D. T., Kneib J., Blain A. W., 2001, ApJ, 561, L45
- Ivison et al. (1998) Ivison R. J., Smail I., Le Borgne J., Blain A. W., Kneib J., Bezecourt J., Kerr T. H., Davies J. K., 1998, MNRAS, 298, 583
- Józsa et al. (2009) Józsa G. I. G. et al., 2009, A&A, 500, L33
- Kneib et al. (1996) Kneib J., Ellis R. S., Smail I., Couch W. J., Sharples R. M., 1996, ApJ, 471, 643
- Kneib et al. (2005) Kneib J., Neri R., Smail I., Blain A., Sheth K., van der Werf P., Knudsen K. K., 2005, A&A, 434, 819
- Lutz et al. (2005) Lutz D., Yan L., Armus L., Helou G., Tacconi L. J., Genzel R., Baker A. J., 2005, ApJ, 632, L13
- Magorrian et al. (1998) Magorrian J. et al., 1998, AJ, 115, 2285
- Matsuda et al. (2004) Matsuda Y. et al., 2004, AJ, 128, 569
- Neri et al. (2003) Neri R. et al., 2003, ApJ, 597, L113
- Oke et al. (1995) Oke J. B. et al., 1995, PASP, 107, 375
- Owen & Morrison (2008) Owen F. N., Morrison G. E., 2008, AJ, 136, 1889
- Page et al. (2004) Page M. J., Stevens J. A., Ivison R. J., Carrera F. J., 2004, ApJ, 611, L85
- Papadopoulos et al. (2005) Papadopoulos P. P., Greve T. R., Ivison R. J., De Breuck C., 2005, A&A, 444, 813
- Papadopoulos et al. (2007) Papadopoulos P. P., Isaak K. G., van der Werf P. P., 2007, ApJ, 668, 815
- Papadopoulos & Ivison (2002) Papadopoulos P. P., Ivison R. J., 2002, ApJ, 564, L9
- Papadopoulos & Seaquist (1998) Papadopoulos P. P., Seaquist E. R., 1998, ApJ, 492, 521
- Punsly & Tingay (2005) Punsly B., Tingay S. J., 2005, ApJ, 633, L89
- Richard et al. (2009) Richard J., Kneib J., Limousin M., Edge A., Jullo E., 2009, ArXiv e-prints
- Santos et al. (2004) Santos M. R., Ellis R. S., Kneib J., Richard J., Kuijken K., 2004, ApJ, 606, 683
- Scarlata et al. (2009) Scarlata C. et al., 2009, ArXiv e-prints
- Smail et al. (1997) Smail I., Ivison R. J., Blain A. W., 1997, ApJ, 490, L5
- Smail et al. (2002) Smail I., Ivison R. J., Blain A. W., Kneib J., 2002, MNRAS, 331, 495
- Smail et al. (2000) Smail I., Ivison R. J., Owen F. N., Blain A. W., Kneib J.-P., 2000, ApJ, 528, 612
- Solomon & Barrett (1991) Solomon P. M., Barrett J. W., 1991, in IAU Symposium, Vol. 146, F. Combes & F. Casoli , ed, Dynamics of Galaxies and Their Molecular Cloud Distributions, p. 235
- Solomon et al. (1997) Solomon P. M., Downes D., Radford S. J. E., Barrett J. W., 1997, ApJ, 478, 144
- Solomon et al. (1992) Solomon P. M., Radford S. J. E., Downes D., 1992, Nature, 356, 318
- Solomon et al. (1987) Solomon P. M., Rivolo A. R., Barrett J., Yahil A., 1987, ApJ, 319, 730
- Solomon & Vanden Bout (2005) Solomon P. M., Vanden Bout P. A., 2005, ARA&A, 43, 677
- Swinbank et al. (2008) Swinbank A. M. et al., 2008, MNRAS, 391, 420
- Tacconi et al. (2008) Tacconi L. J. et al., 2008, ApJ, 680, 246
- Tacconi et al. (2006) Tacconi L. J. et al., 2006, ApJ, 640, 228
- Valiante et al. (2007) Valiante E., Lutz D., Sturm E., Genzel R., Tacconi L. J., Lehnert M. D., Baker A. J., 2007, ApJ, 660, 1060
- Vernet & Cimatti (2001) Vernet J., Cimatti A., 2001, A&A, 380, 409
- Villar-Martín et al. (1999) Villar-Martín M., Binette L., Fosbury R. A. E., 1999, A&A, 346, 7
- Weiß et al. (2007) Weiß A., Downes D., Neri R., Walter F., Henkel C., Wilner D. J., Wagg J., Wiklind T., 2007, A&A, 467, 955
- Weiß et al. (2005) Weiß A., Walter F., Scoville N. Z., 2005, A&A, 438, 533
- Werner et al. (2004) Werner M. W. et al., 2004, ApJS, 154, 1
- Yao et al. (2003) Yao L., Seaquist E. R., Kuno N., Dunne L., 2003, ApJ, 588, 771
- Zhu et al. (2003) Zhu M., Seaquist E. R., Kuno N., 2003, ApJ, 588, 243